| 01/06/2026 |
Iowa Insights |
Iowa Charter Schools
|
|
|
|
|
| 09/12/2025 |
Iowa Insights |
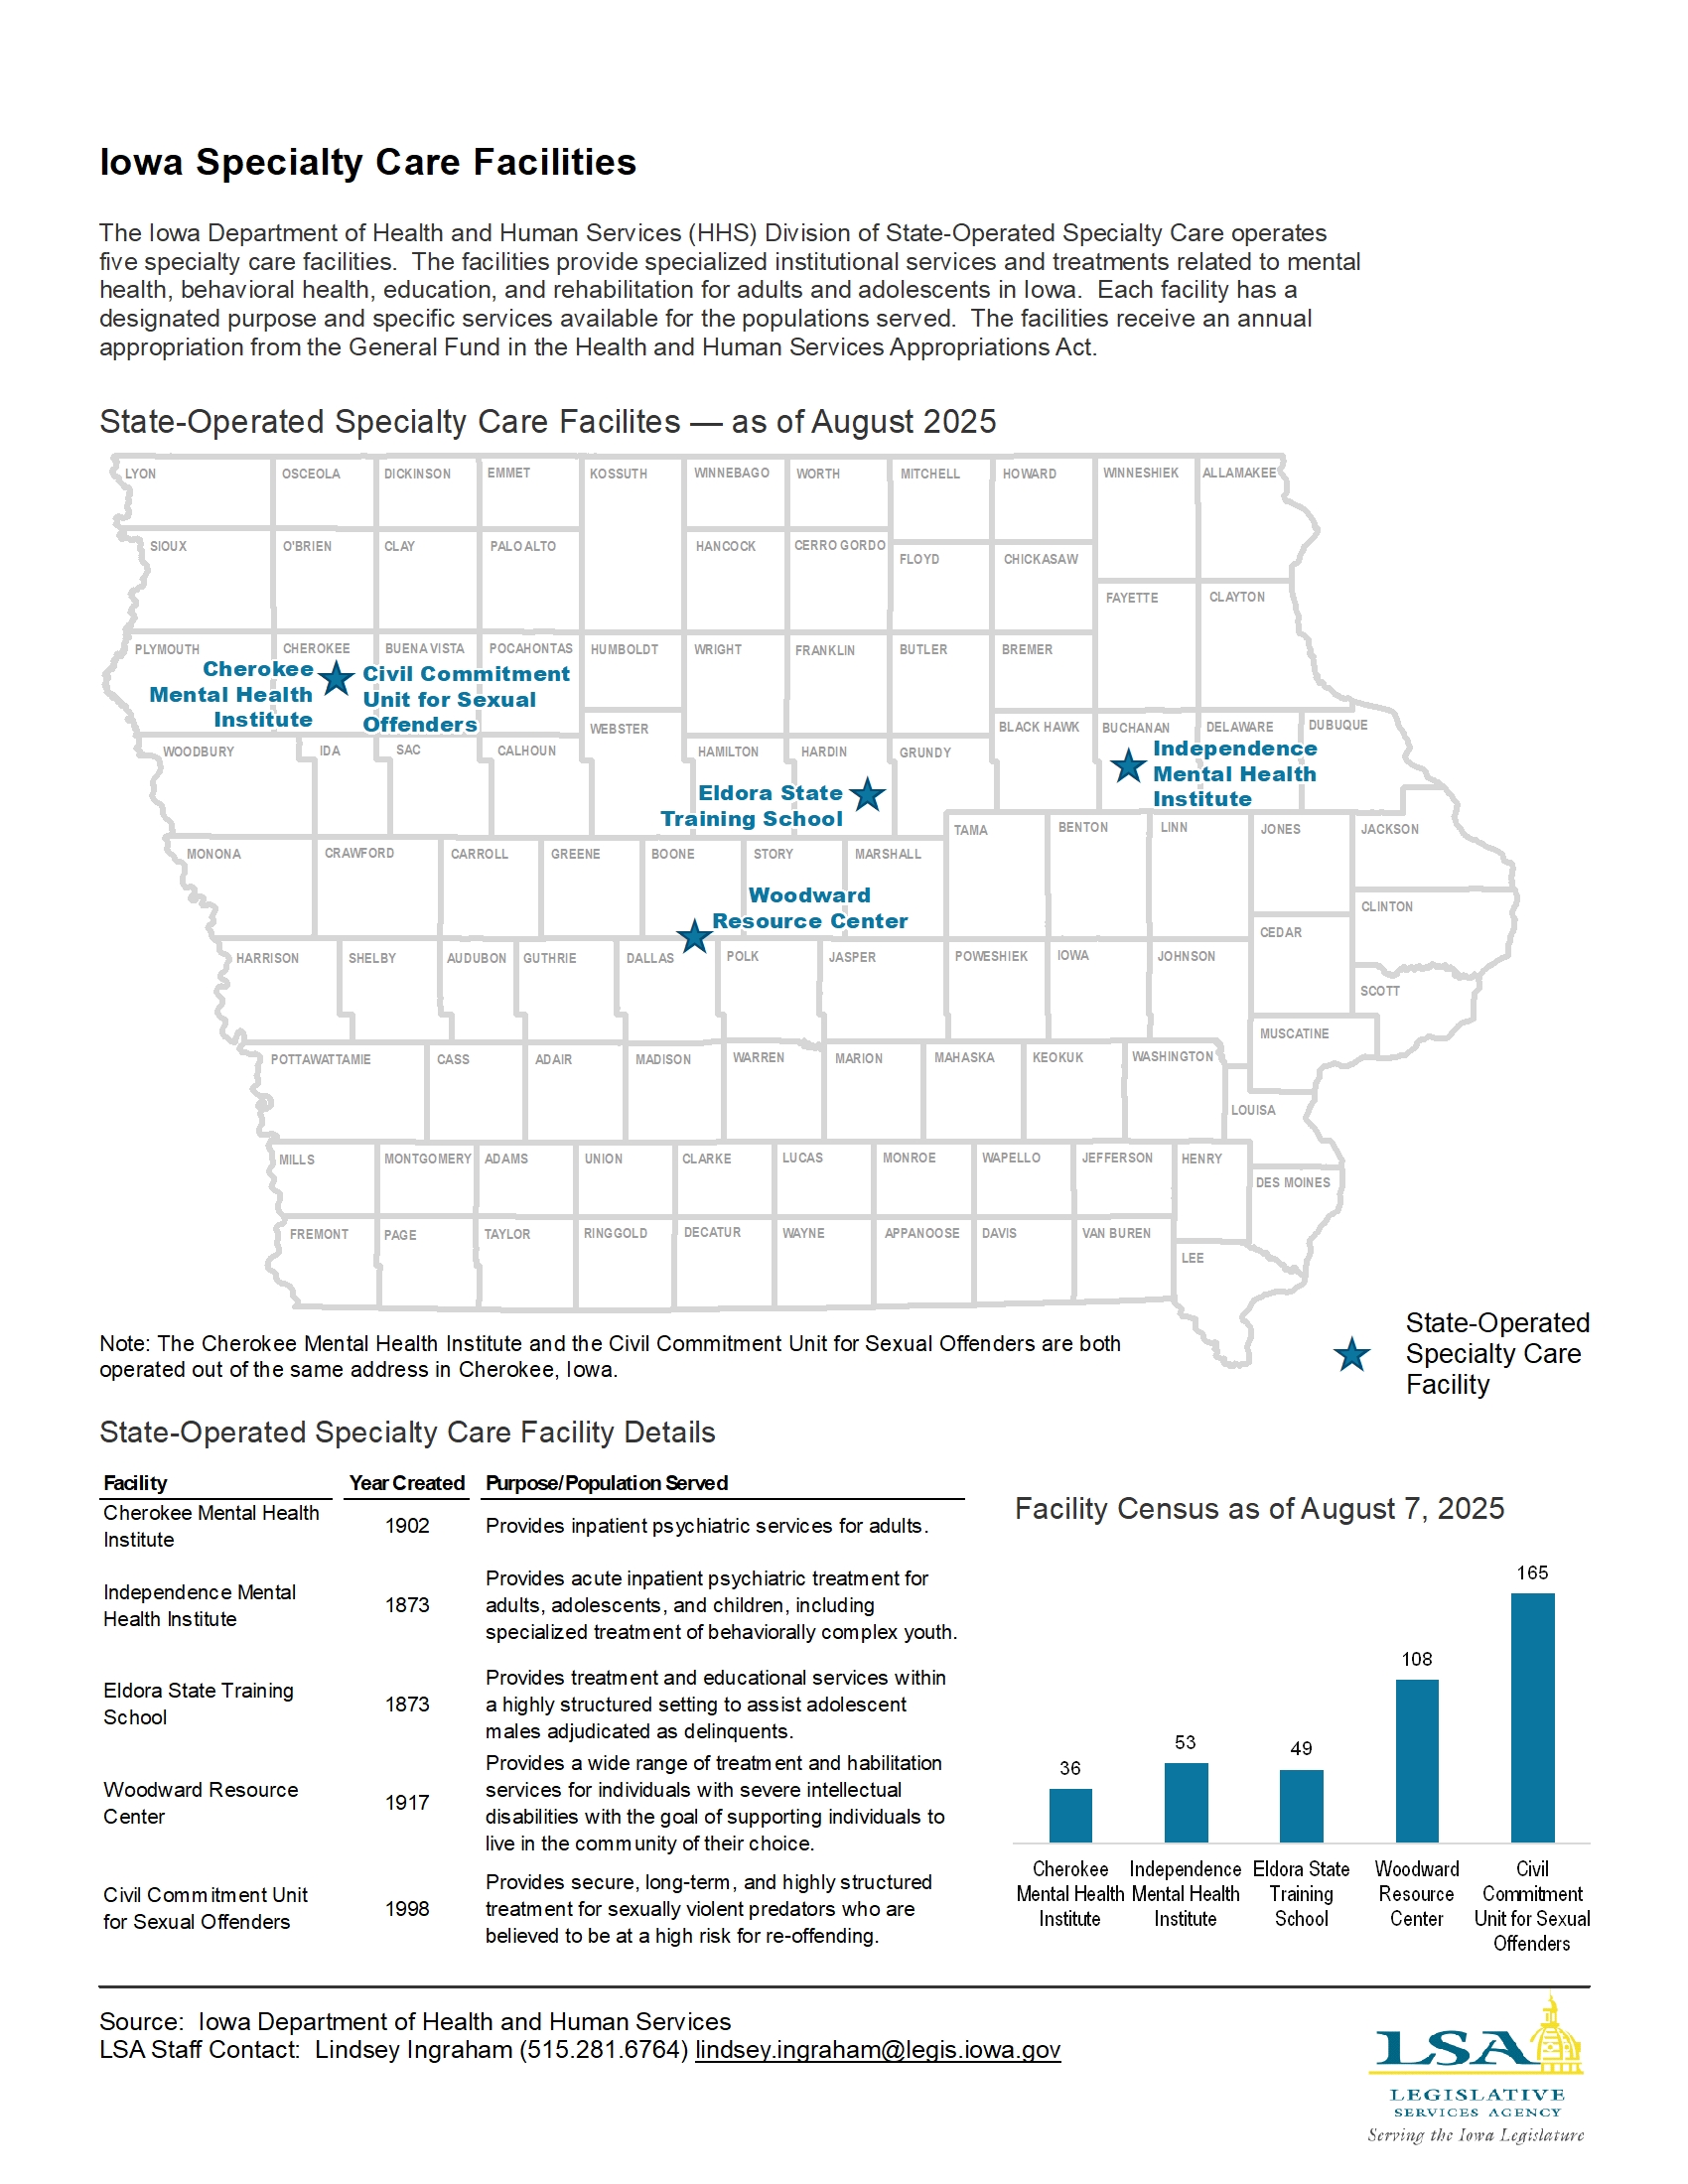
Iowa Specialty Care Facilities
|
|
|
|
|
| 08/21/2025 |
Iowa Insights |
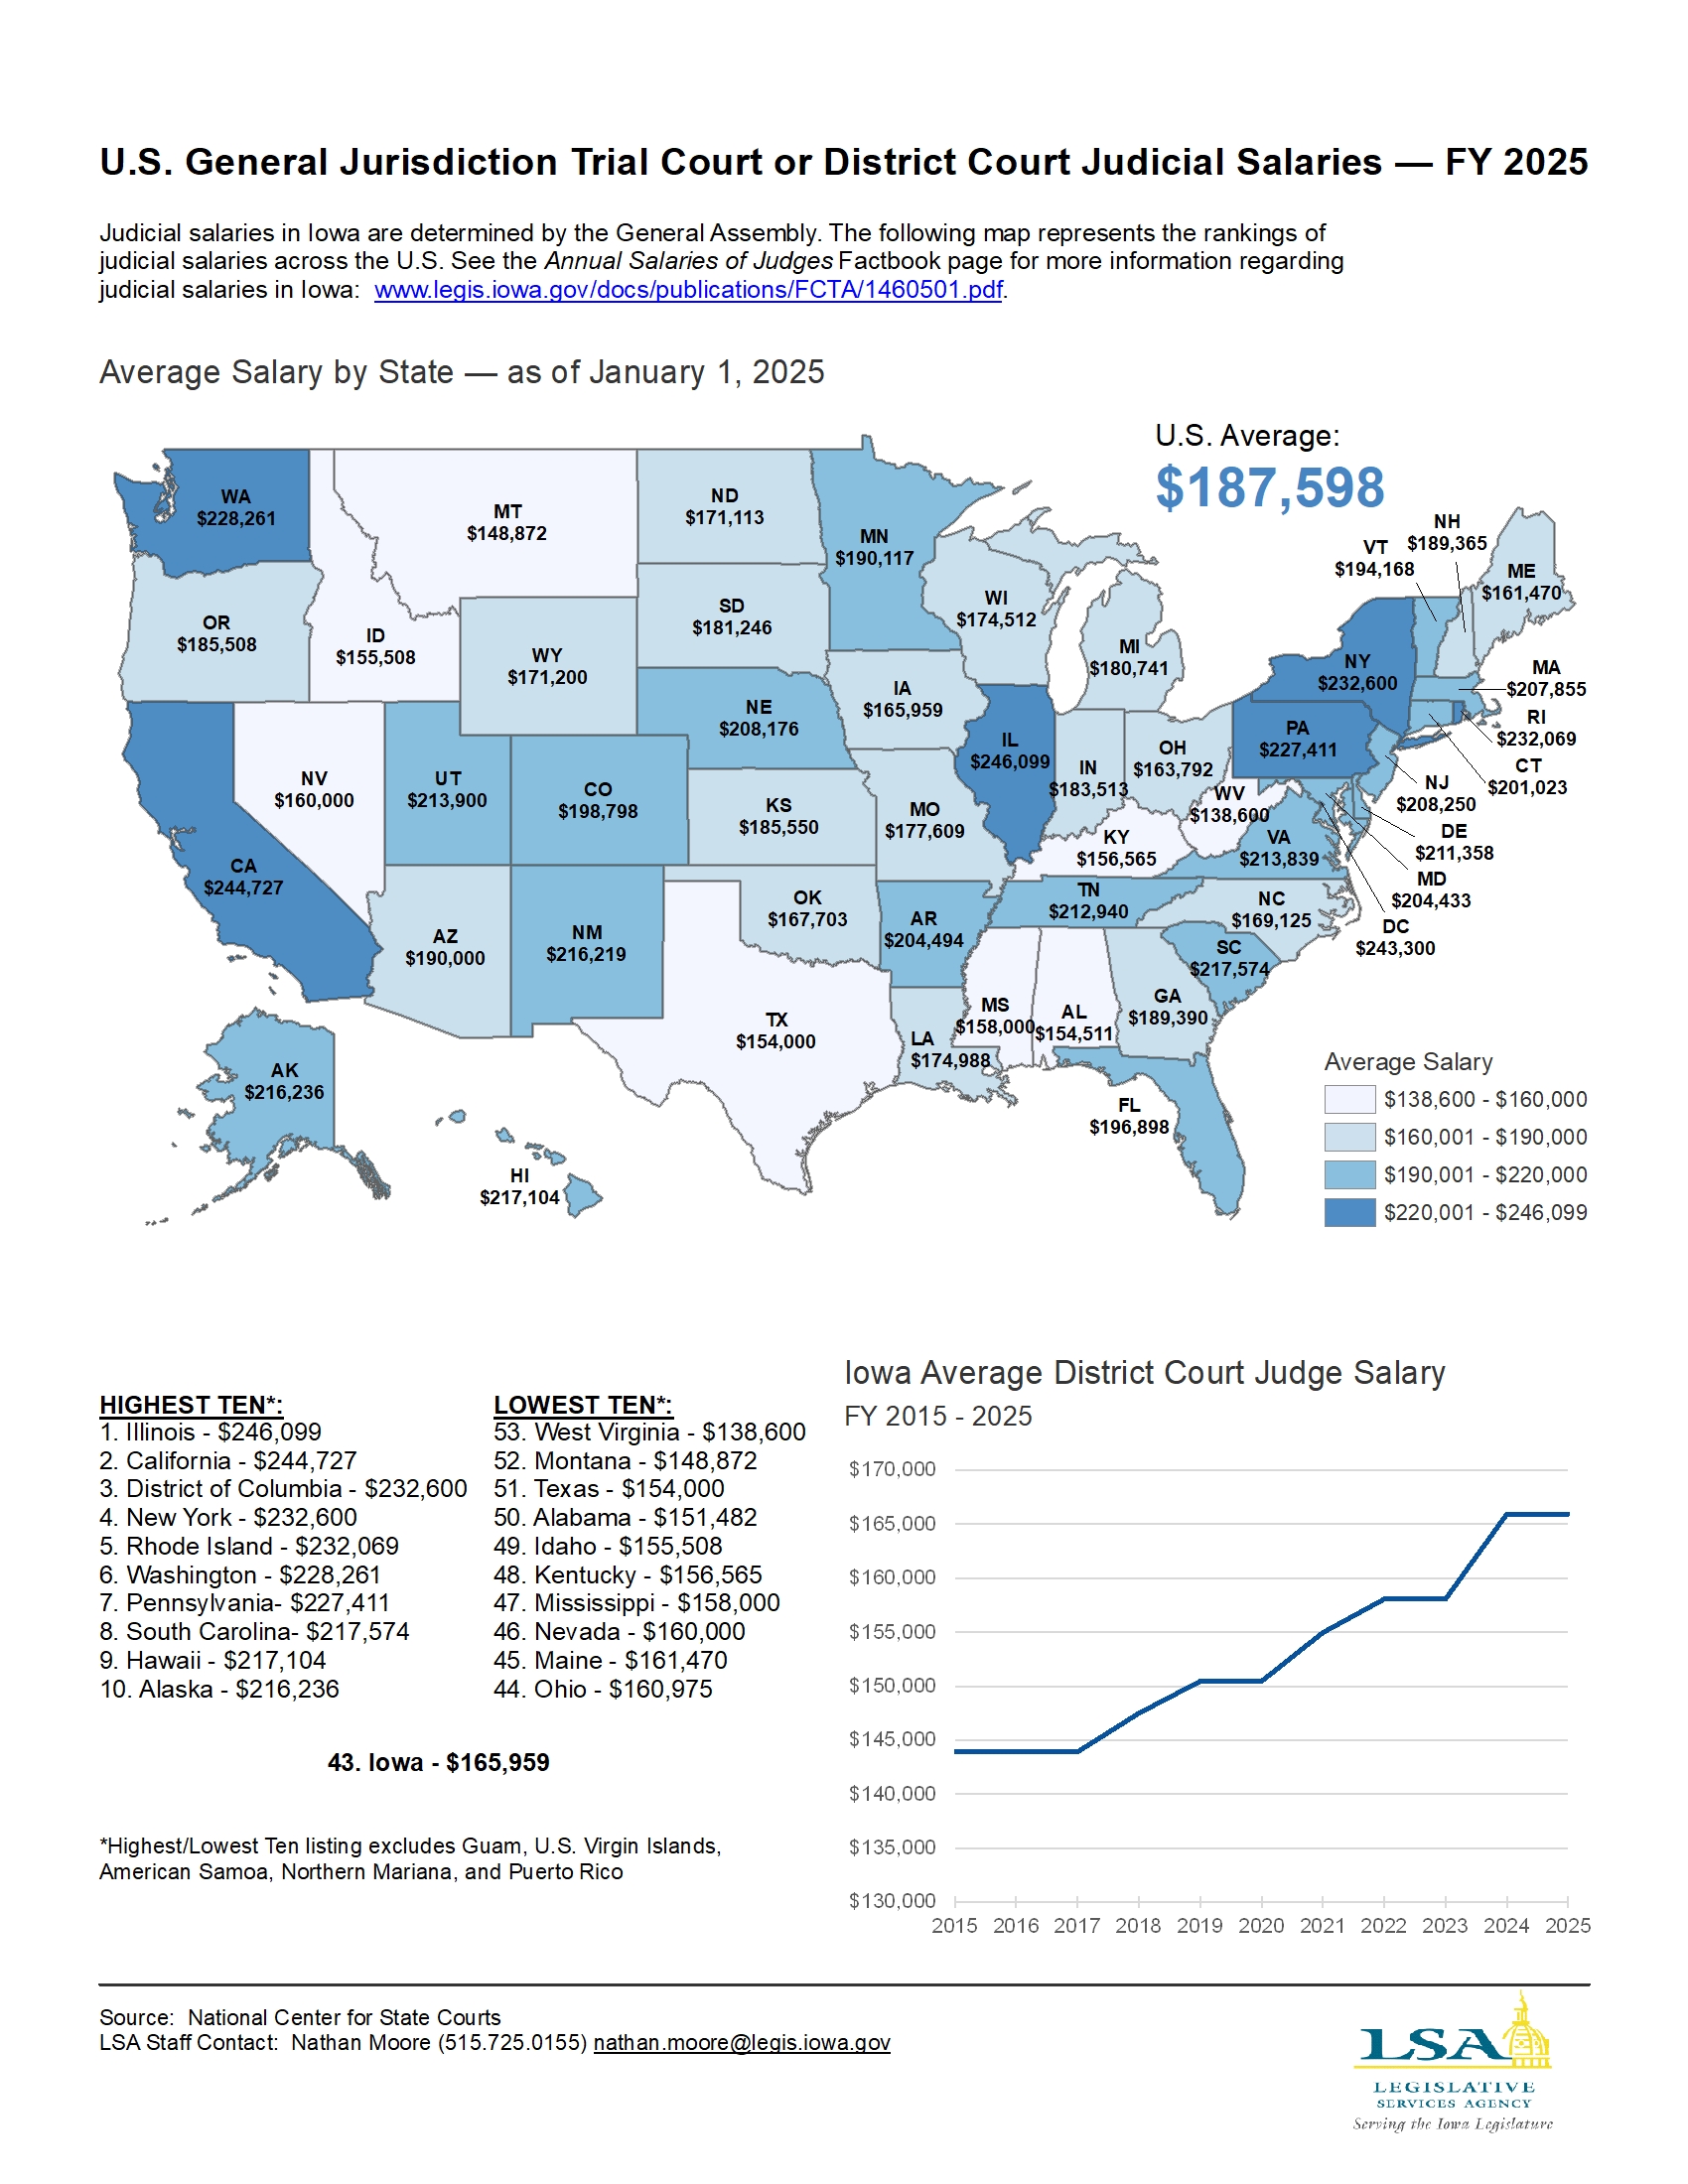
U.S. General Jurisdiction Trial Court or District Court Judicial Salaries — FY 2025
|
|
|
|
|
| 06/18/2025 |
Iowa Insights |
Forest and Fruit-Tree Reservation Program Acres by County — 2024
|
|
|
|
|
| 03/25/2024 |
Iowa Insights |
Housing Market Activity — December 2023
|
|
|
|
|
| 03/20/2023 |
Iowa Insights |
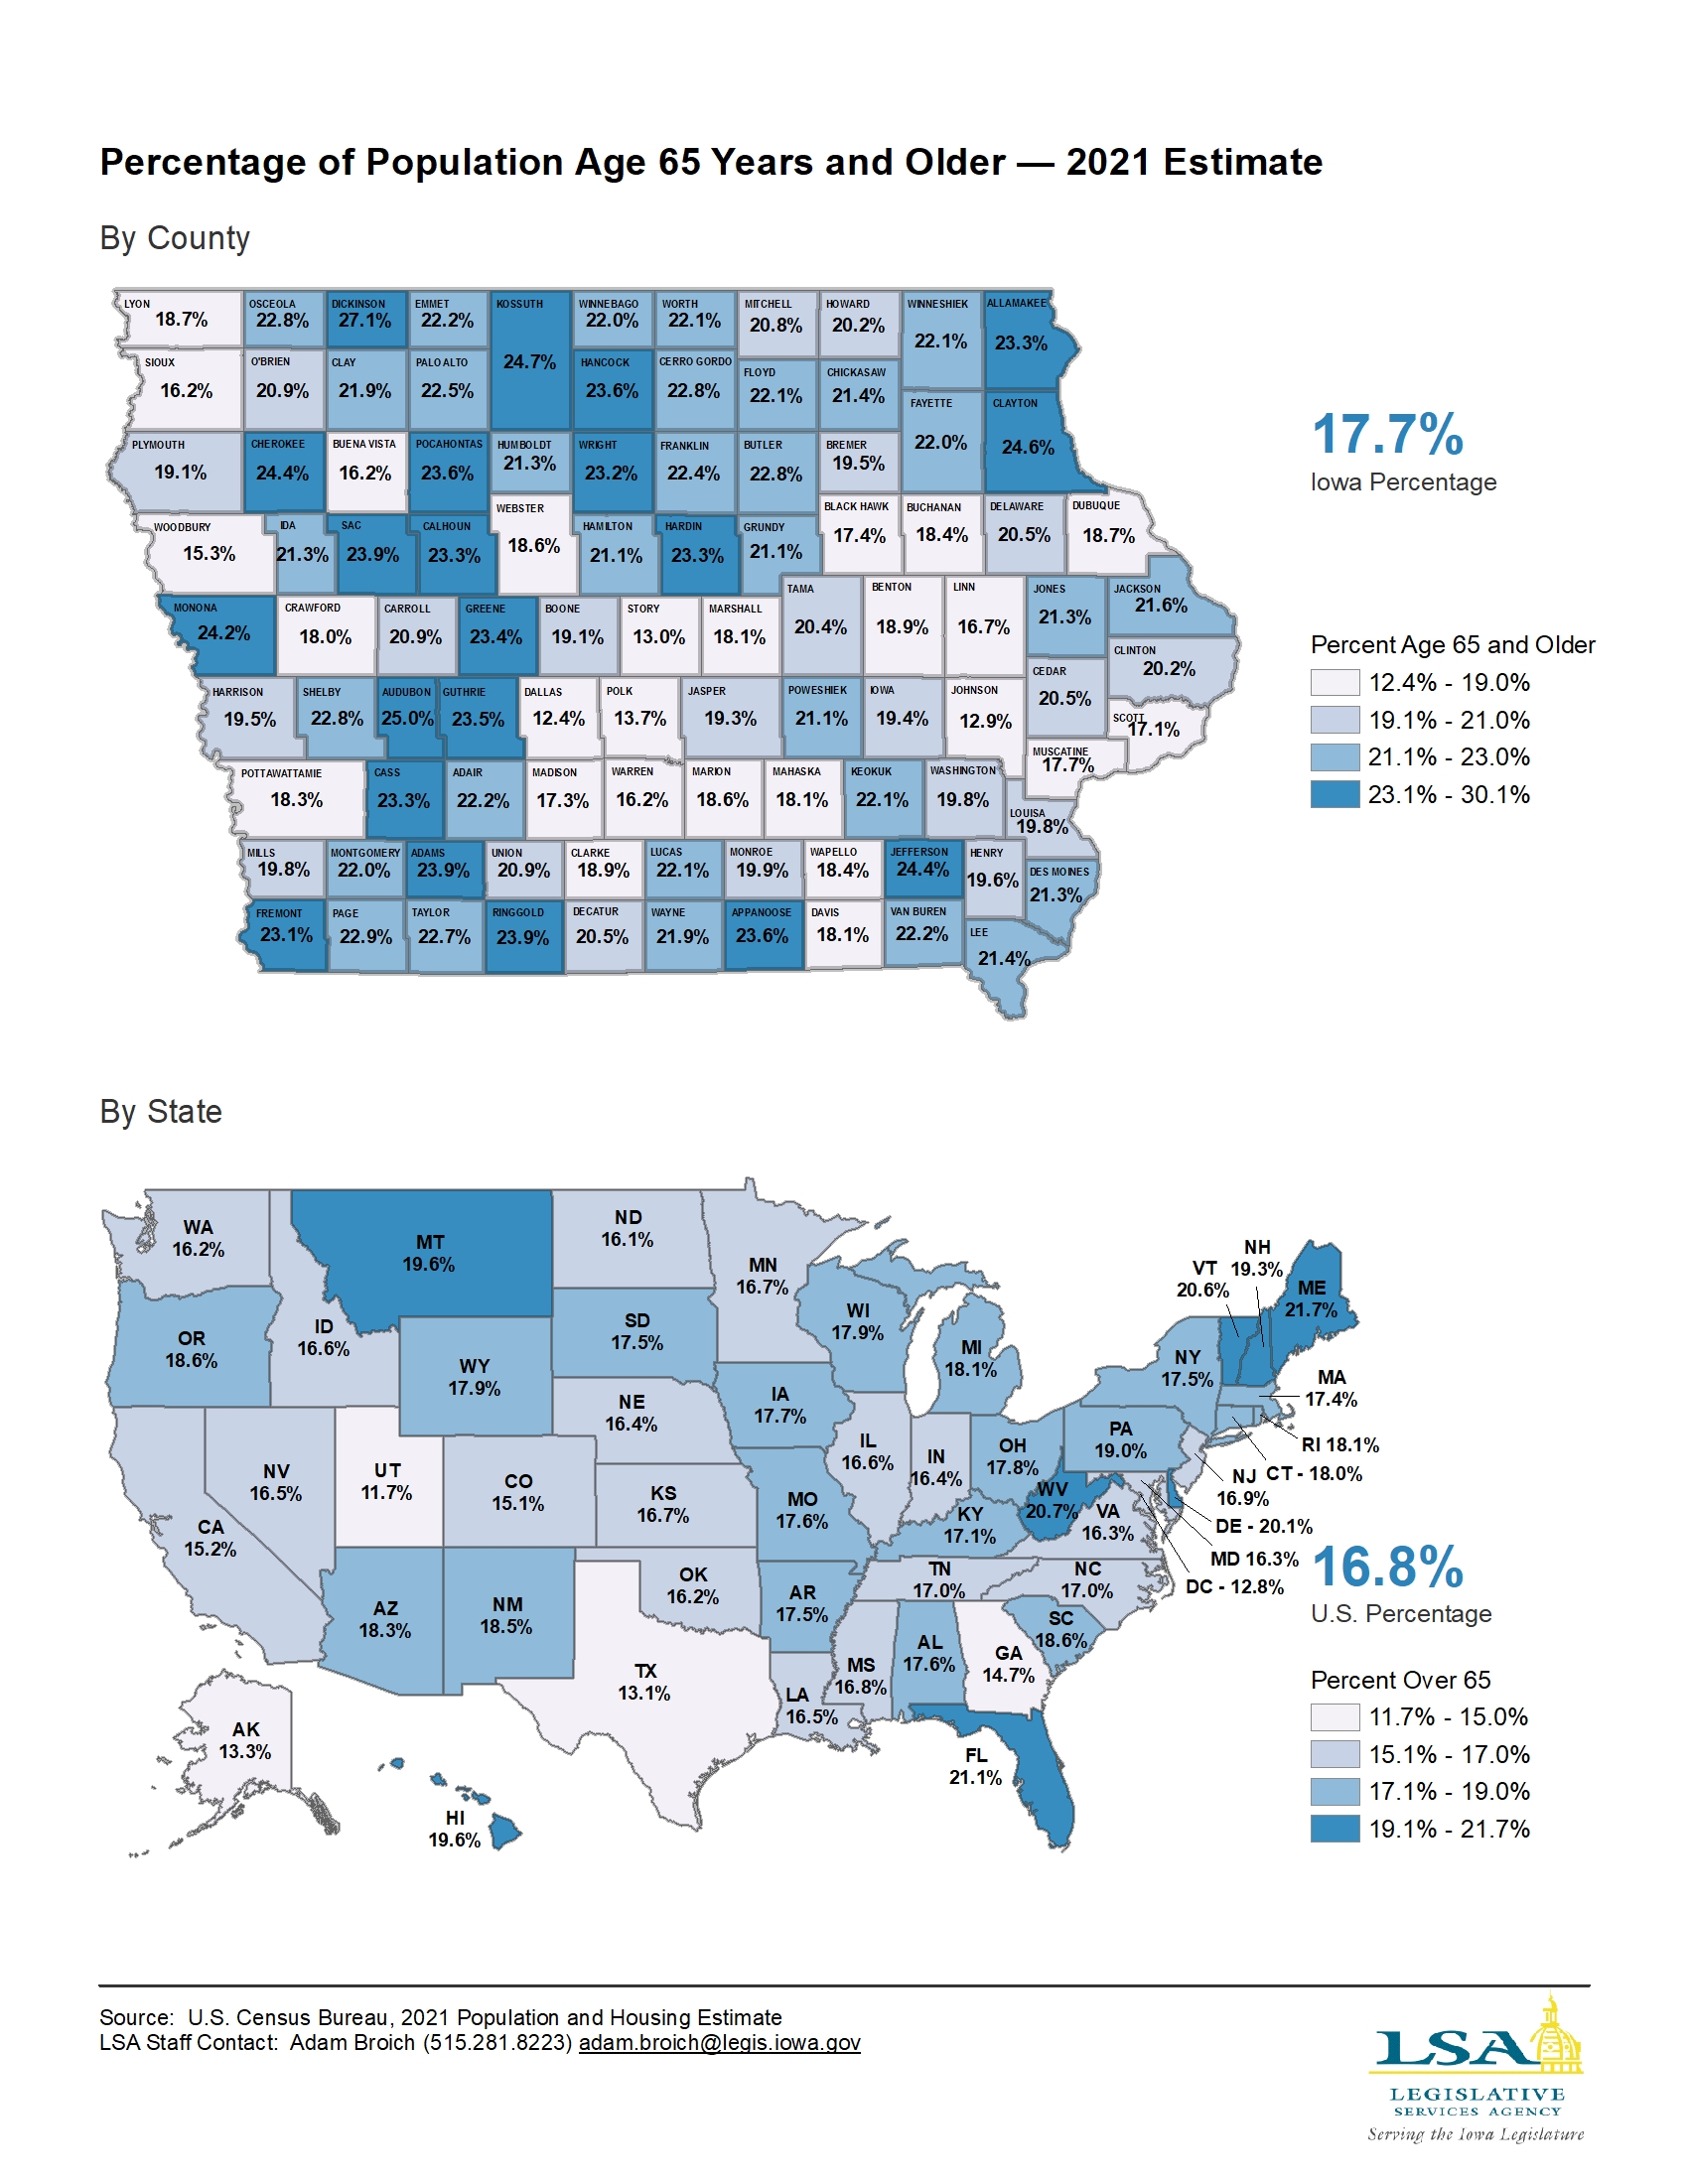
Percentage of Population Age 65 Years — 2021
|
|
|
|
|
| 03/06/2023 |
Iowa Insights |
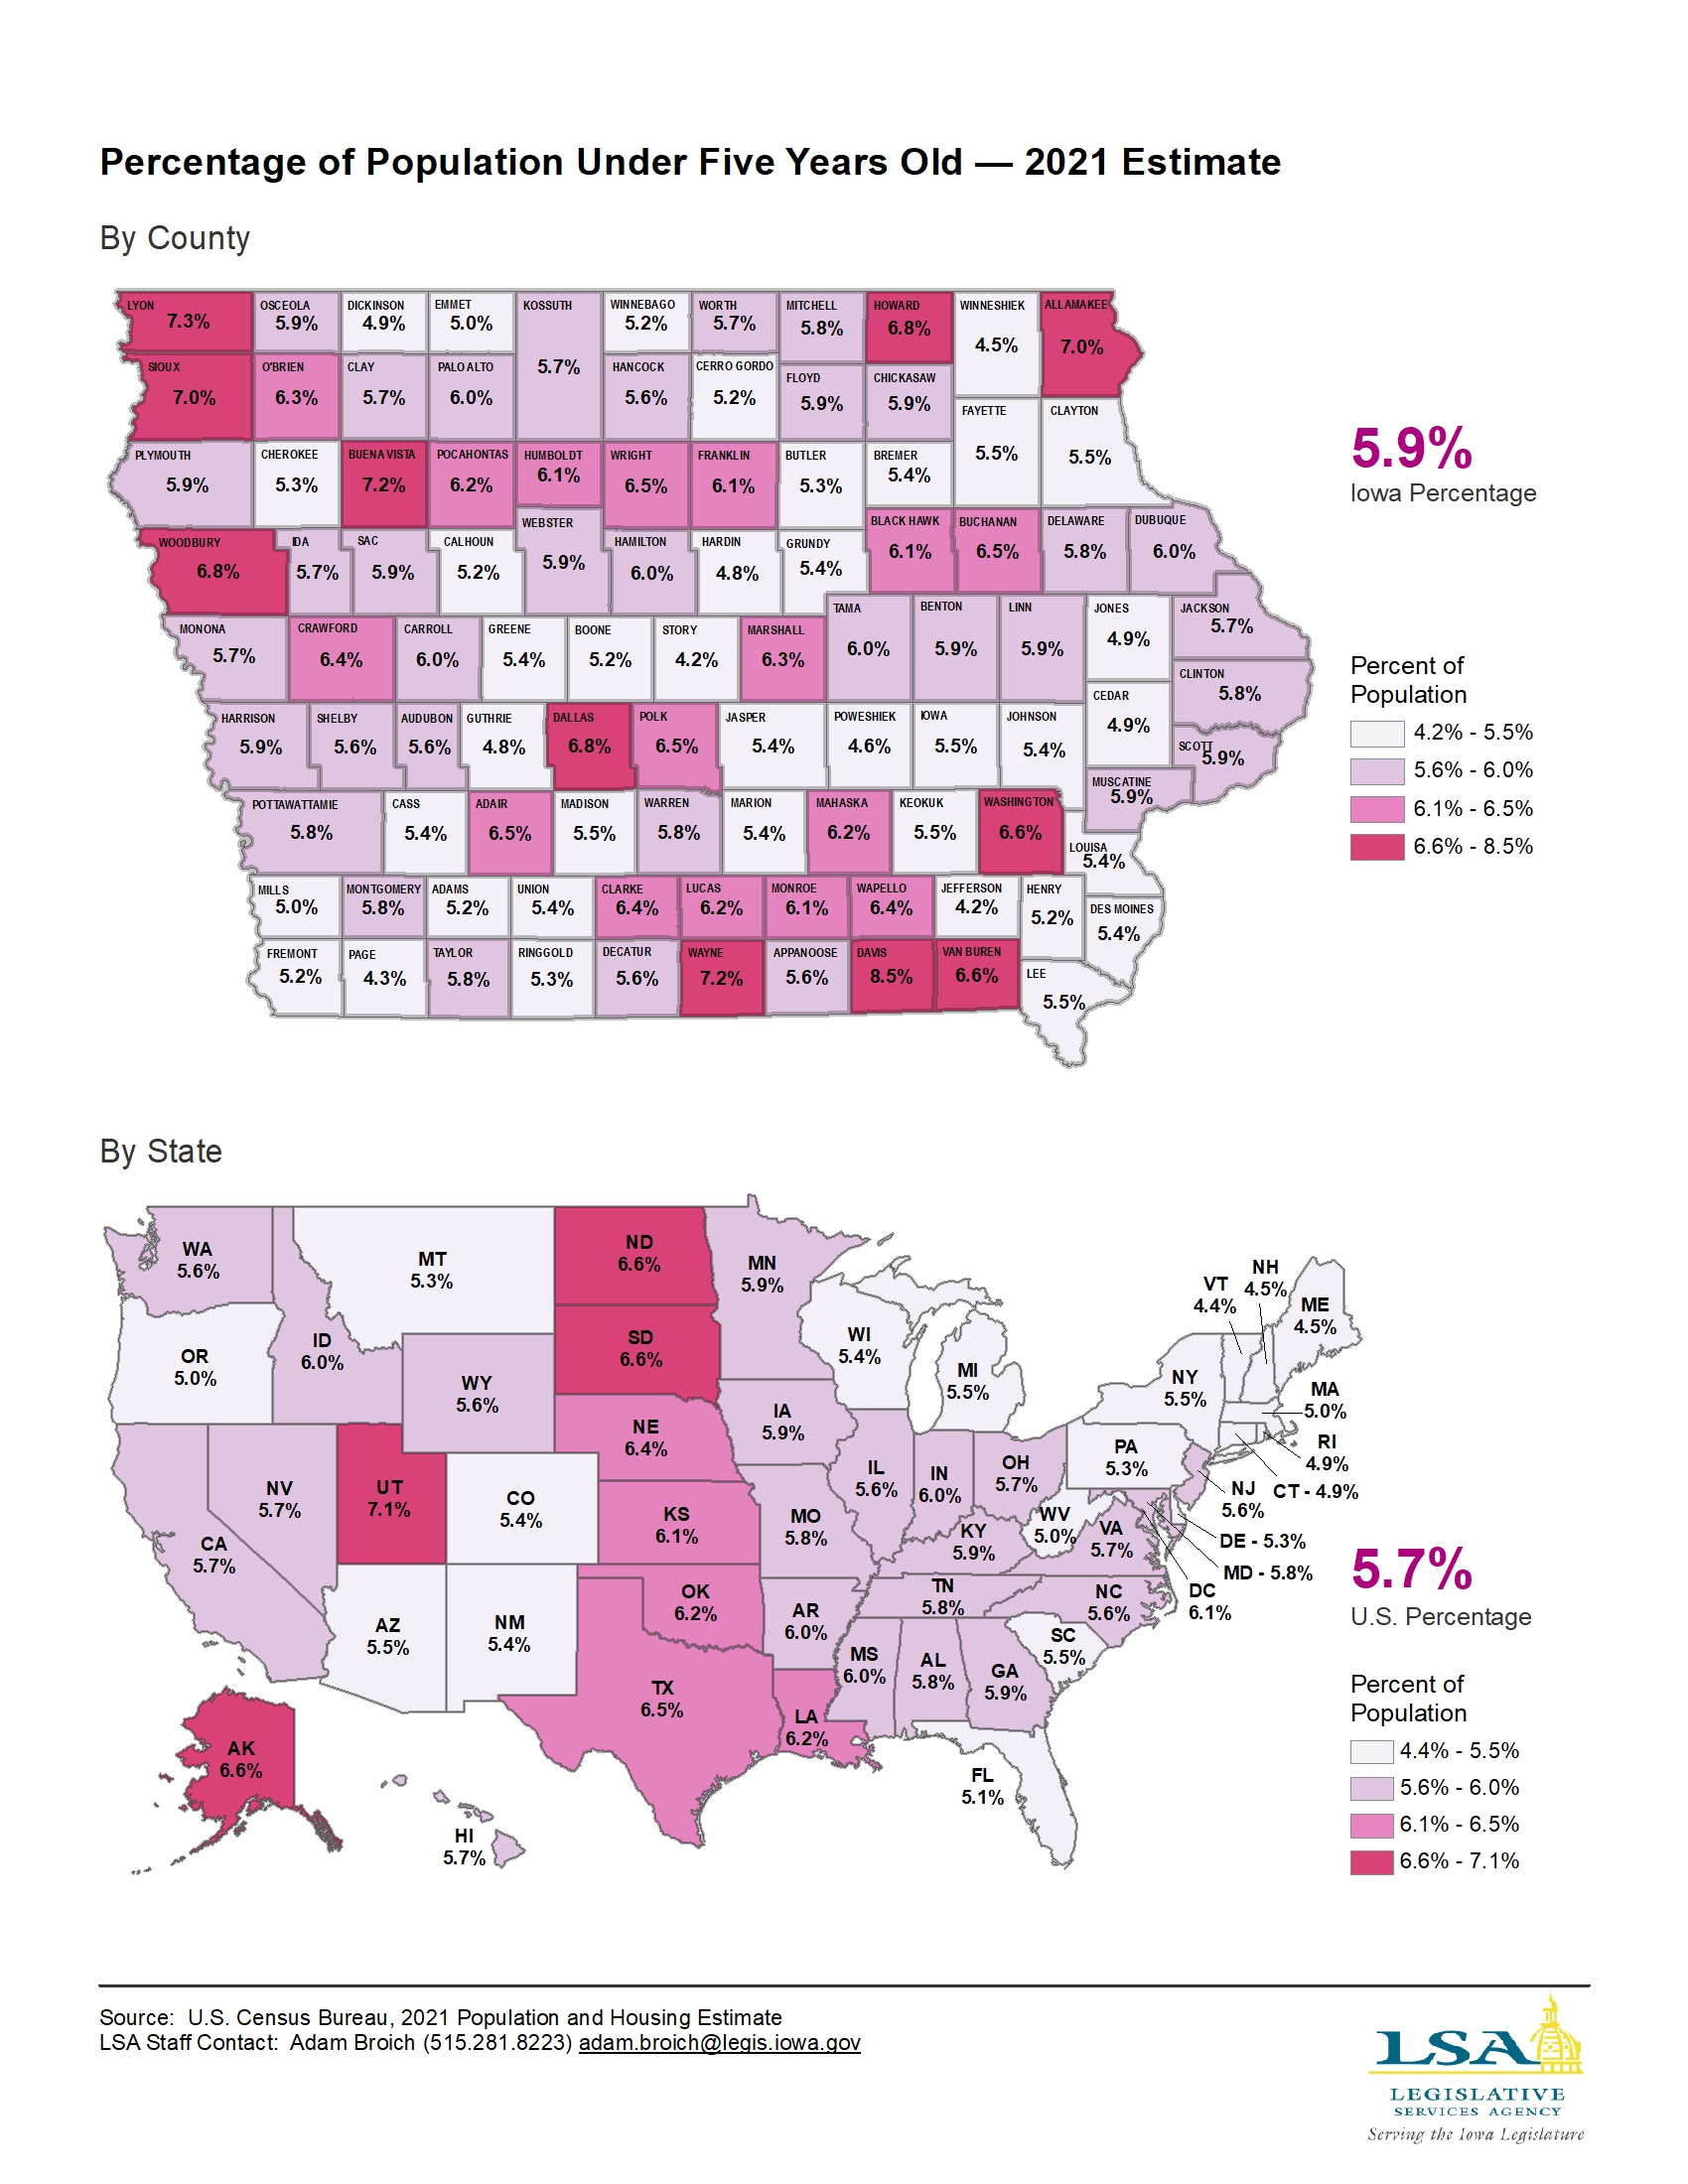
Percentage of Population Under Five Years Old — 2021
|
|
|
|
|
| 02/27/2023 |
Iowa Insights |
Median Age — 2021
|
|
|
|
|
| 02/13/2023 |
Iowa Insights |
Population Change by State — 2020-2022
|
|
|
|
|
| 02/06/2023 |
Iowa Insights |
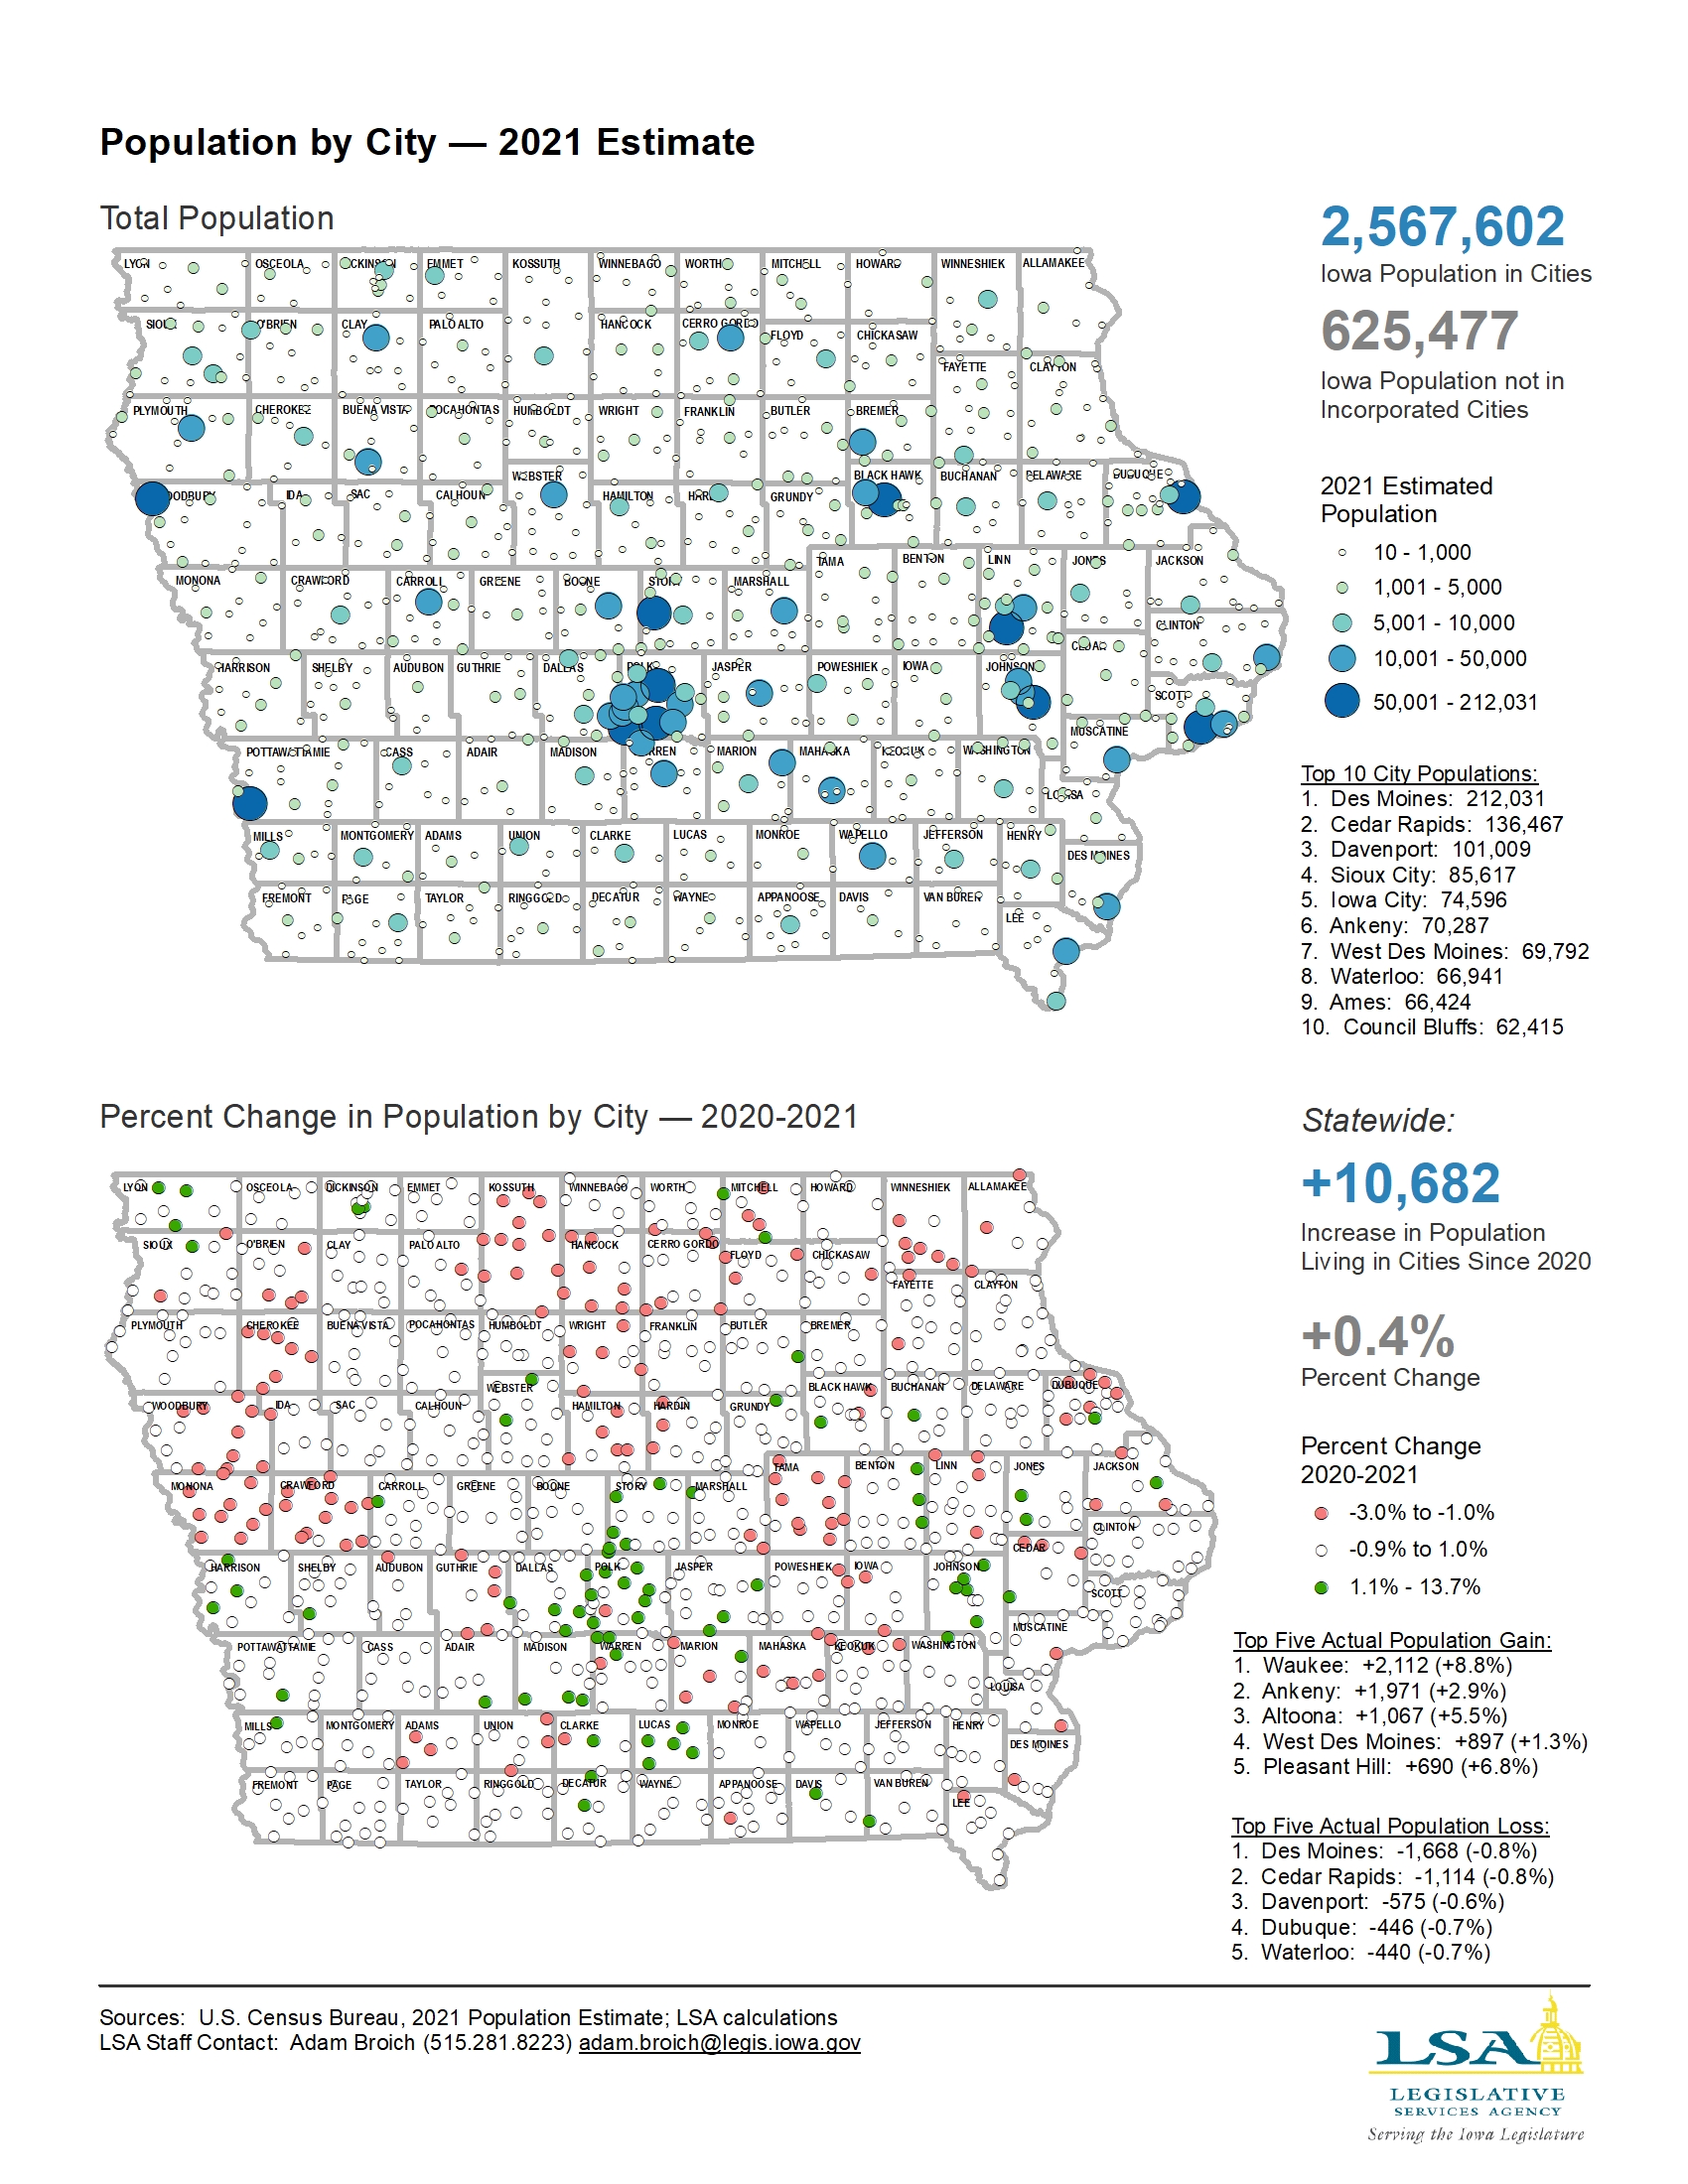
Population in Cities — 2021 Estimate
|
|
|
|
|
| 01/30/2023 |
Iowa Insights |
Vital Statistics for Iowa — 2021
|
|
|
|
|
| 01/23/2023 |
Iowa Insights |
Population by State — 2021

|
|
|
|
|
| 01/09/2023 |
Iowa Insights |
Population by County — 2021

|
|
|
|
|
| 12/21/2022 |
Iowa Insights |
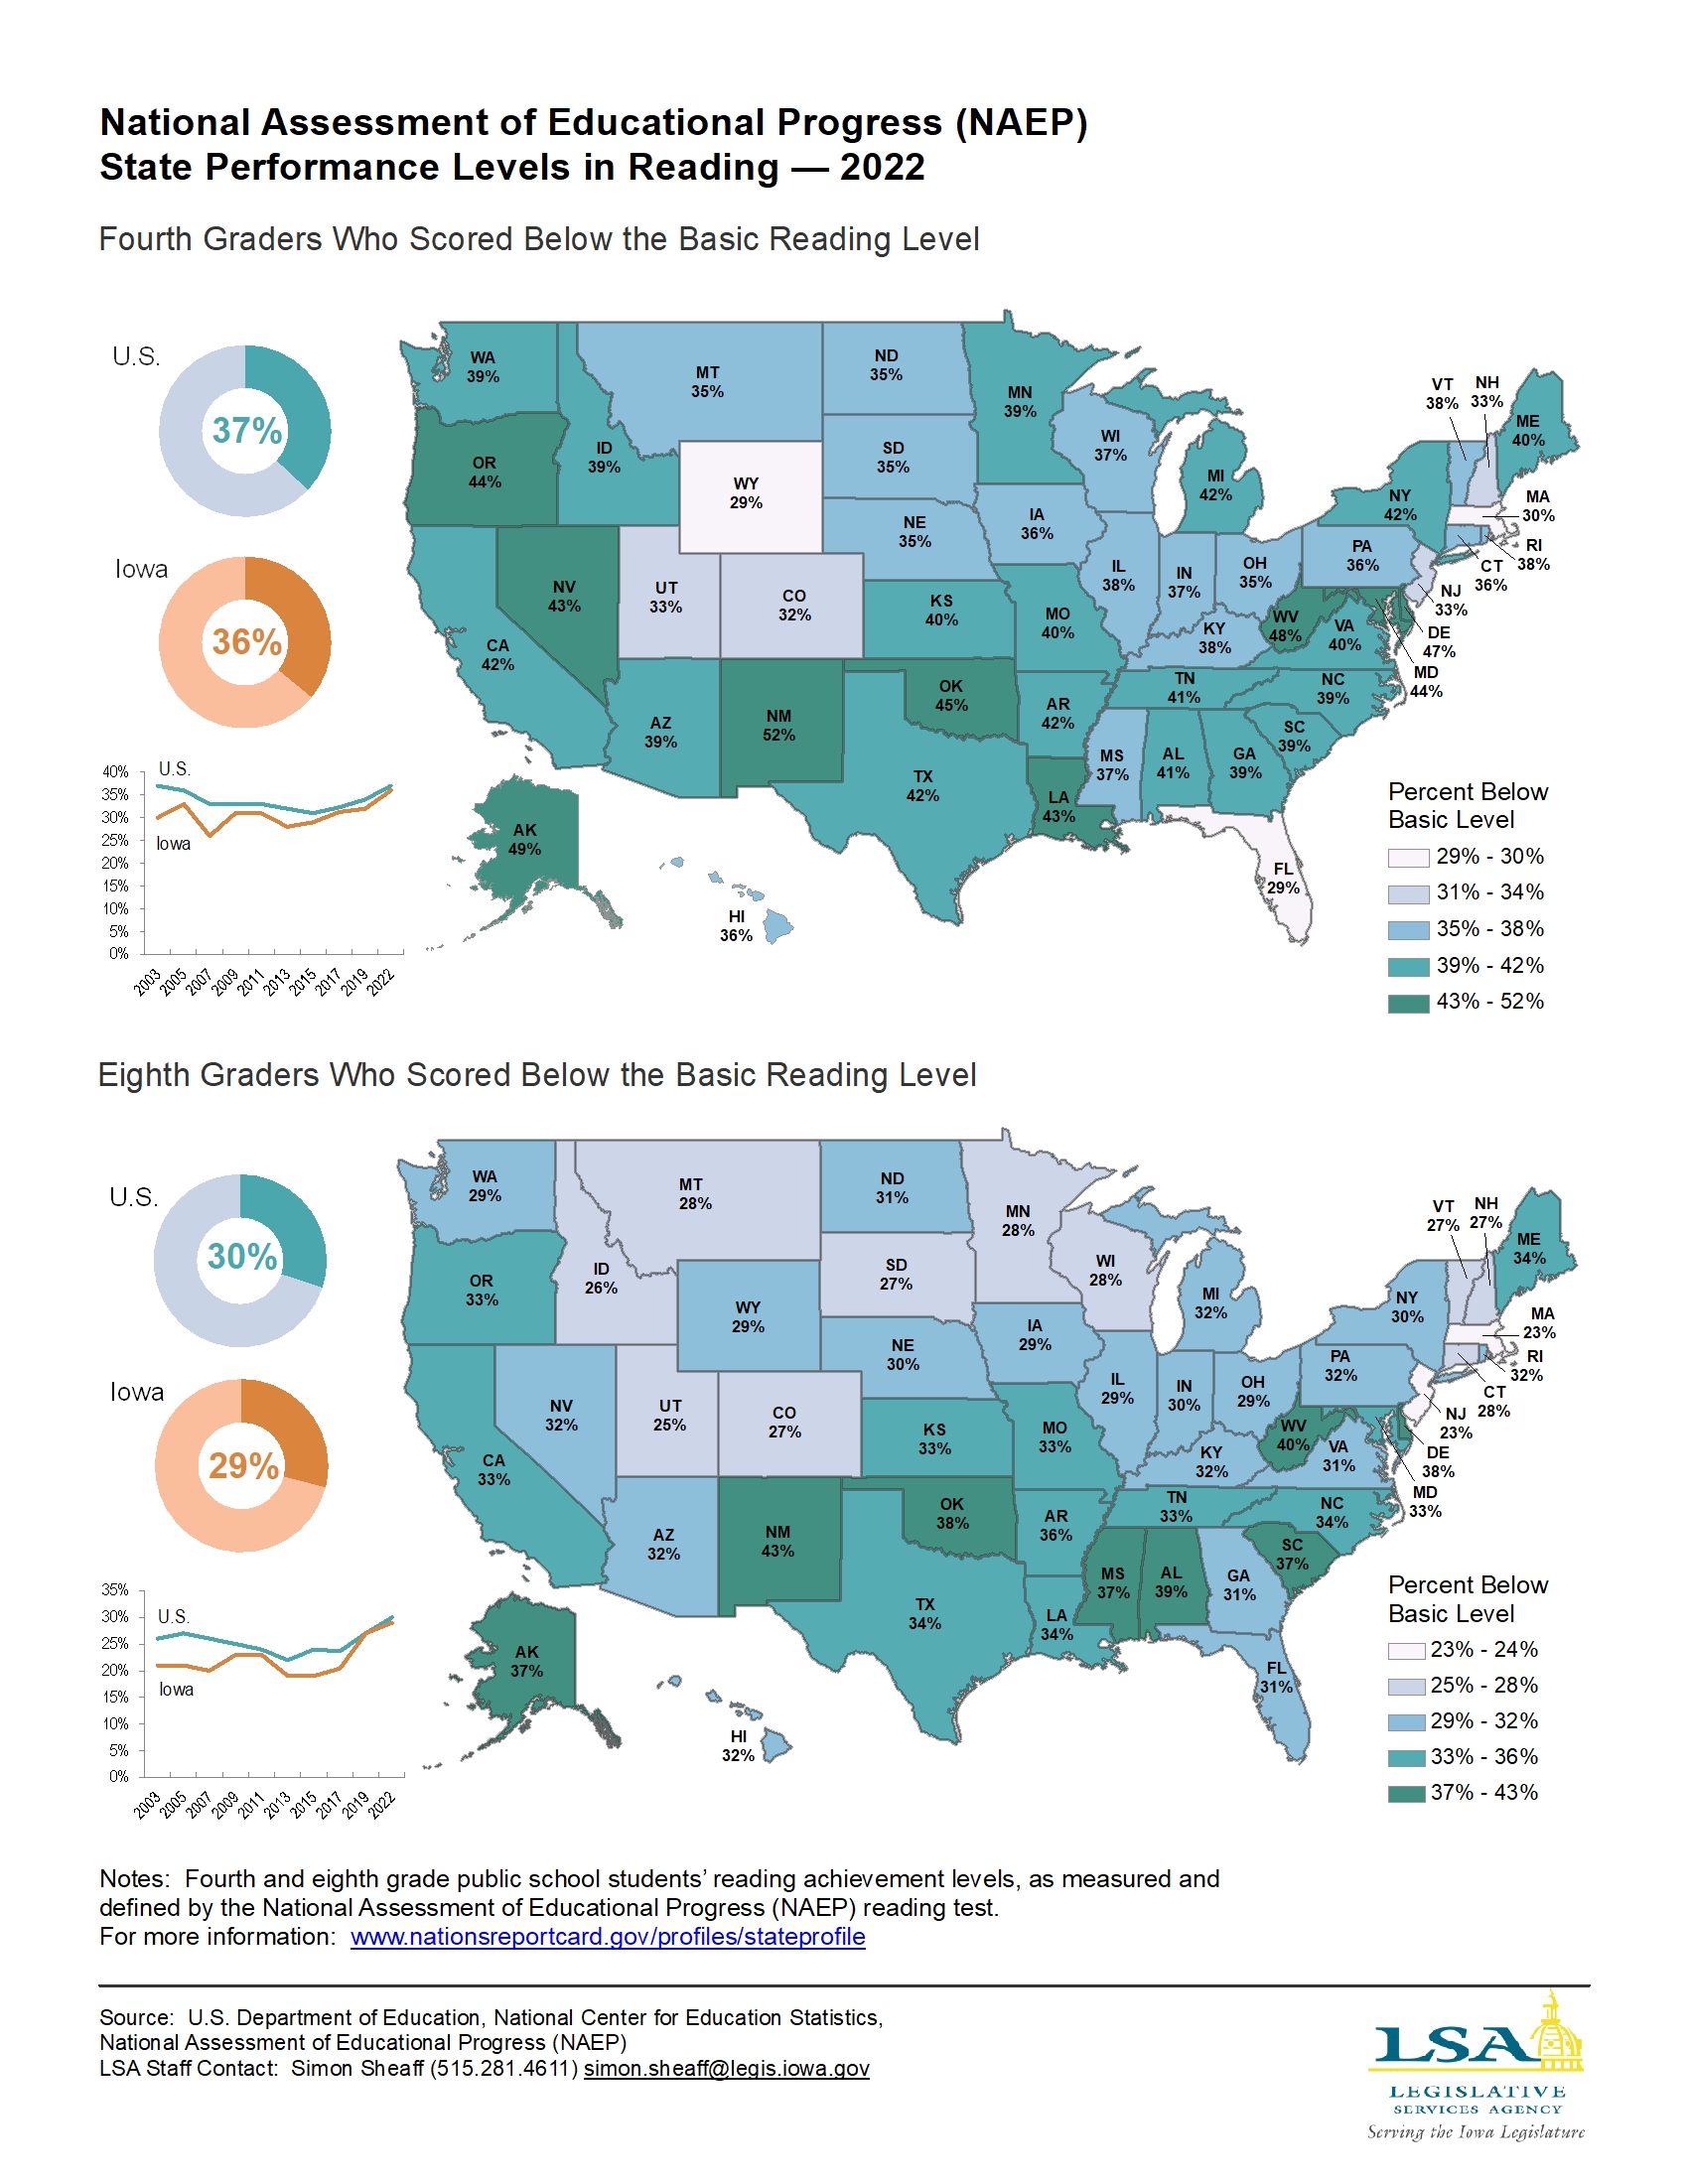
NAEP State Performance Levels in Reading — 2022
|
|
|
|
|
| 12/12/2022 |
Iowa Insights |
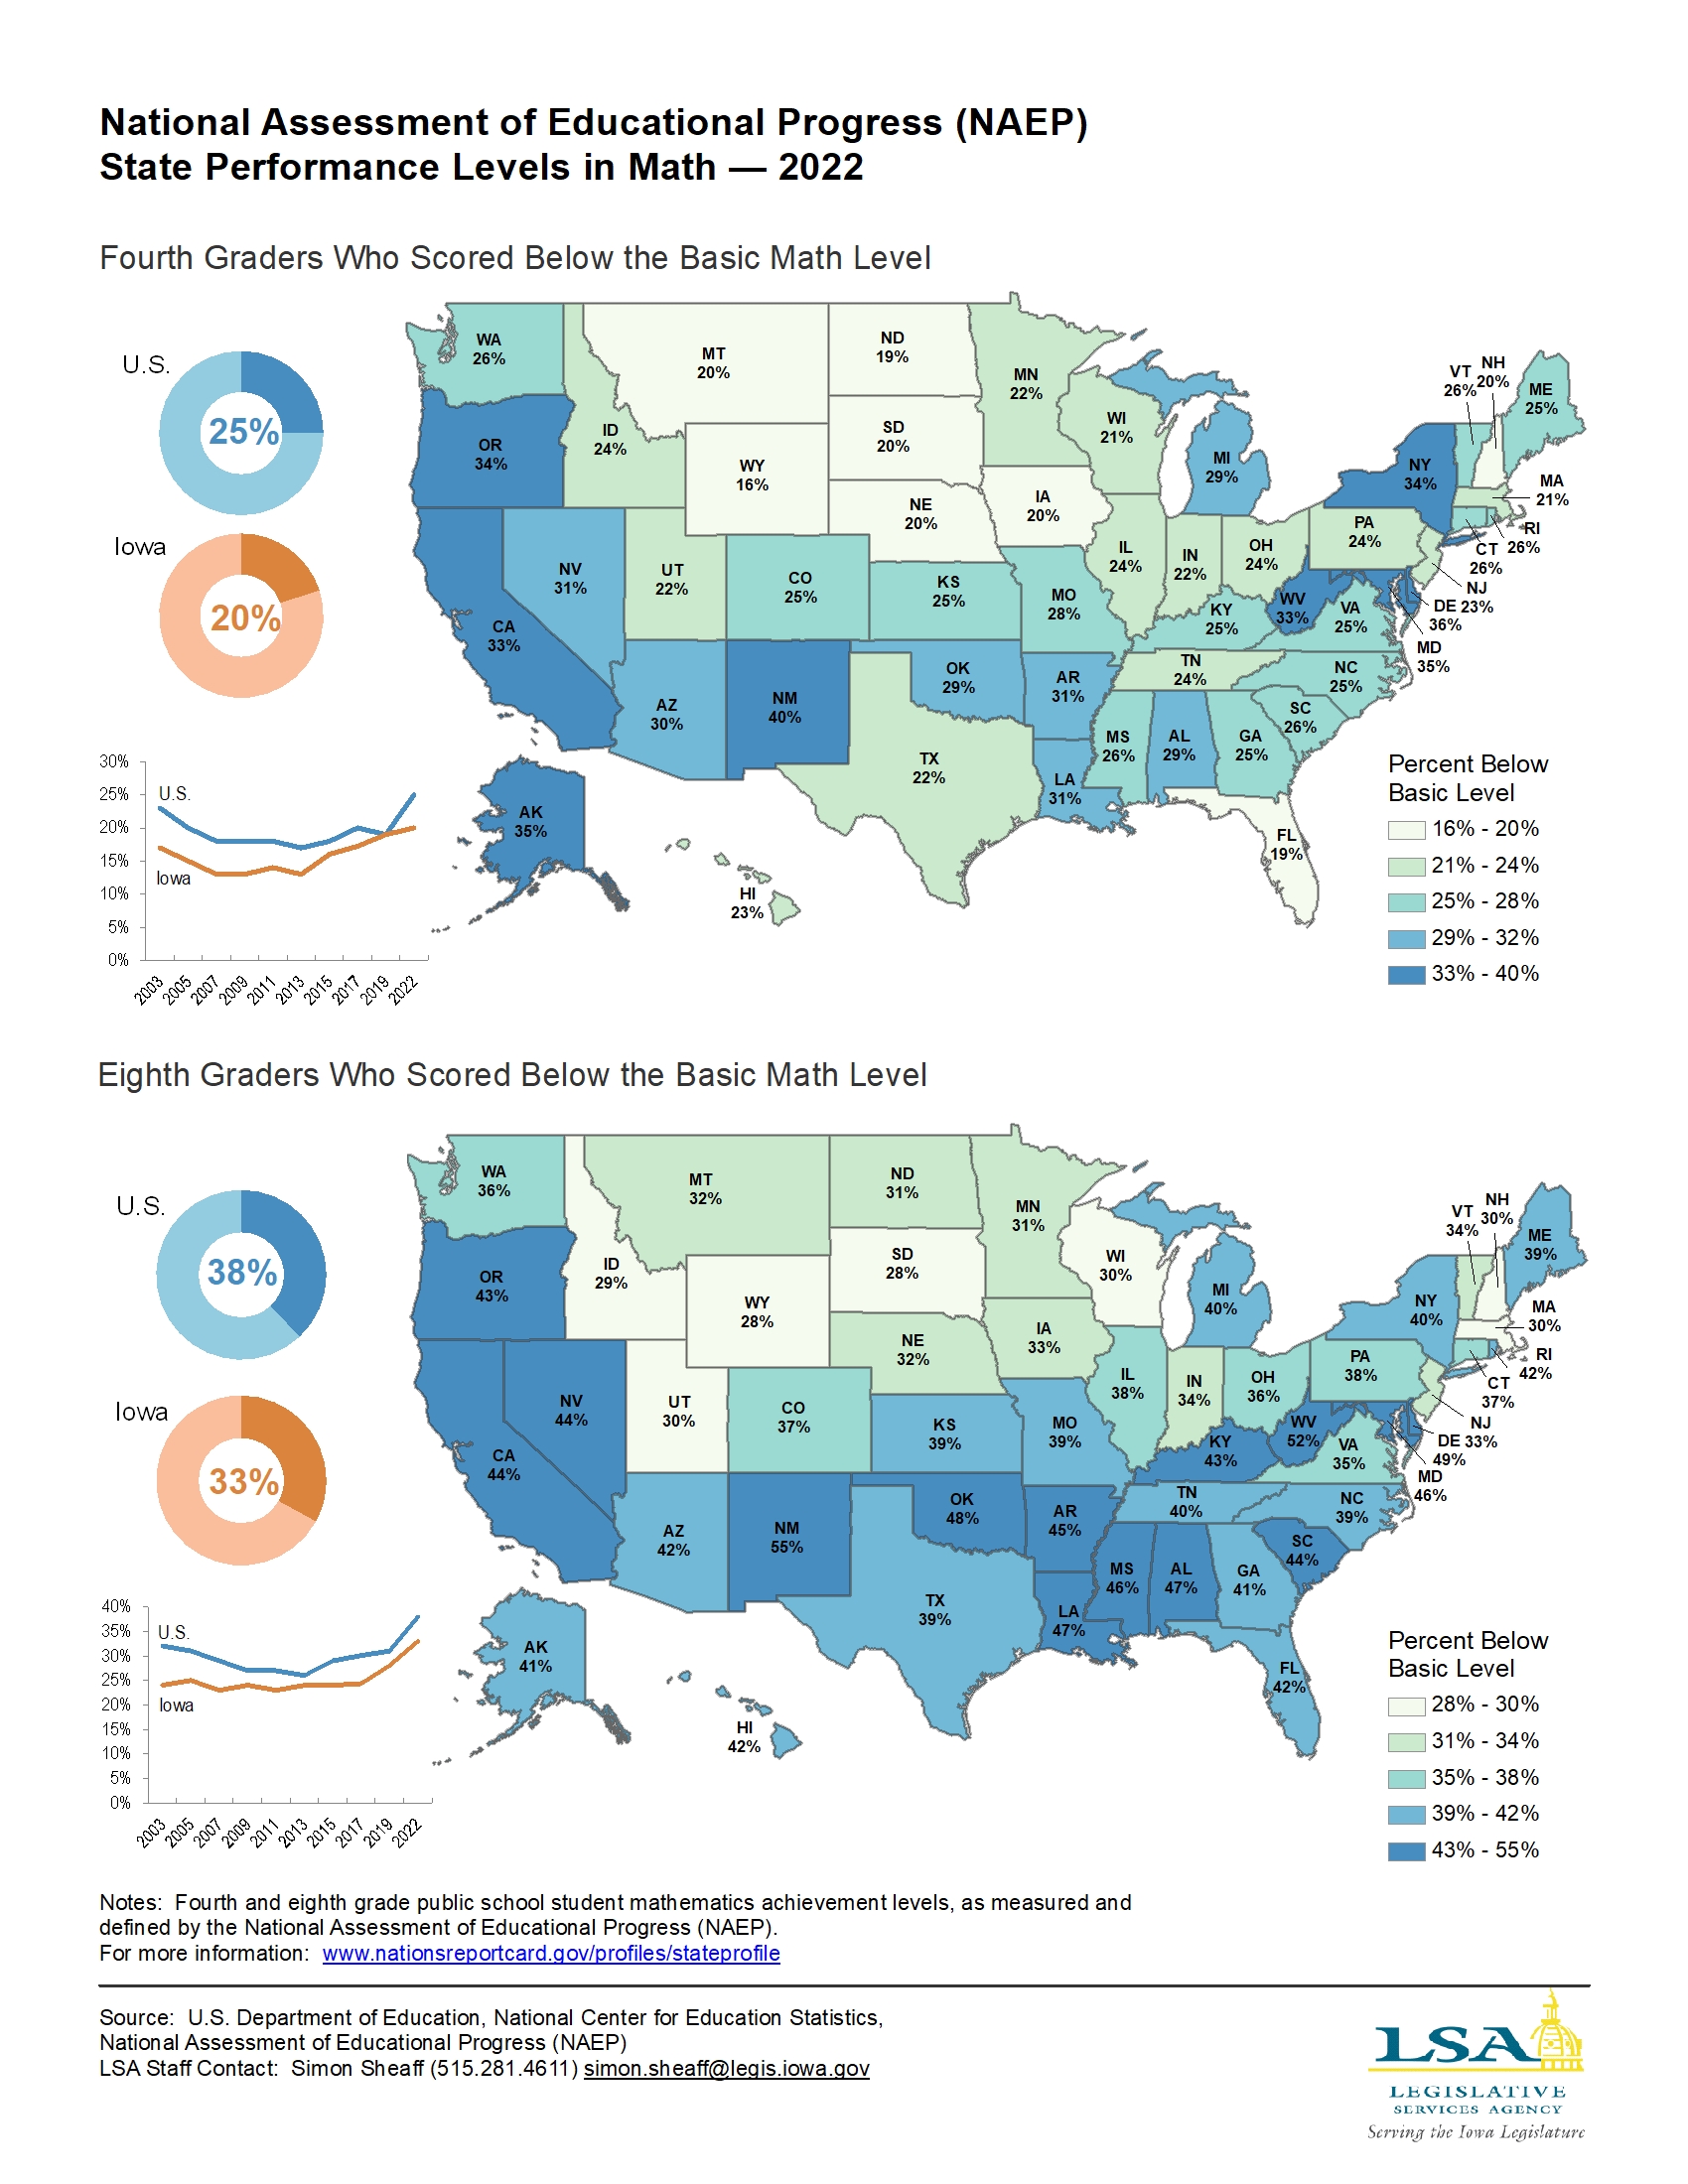
NAEP State Performance Levels in Math — 2022
|
|
|
|
|
| 12/05/2022 |
Iowa Insights |
Estimated Average Classroom Teacher Salary — 2021-2022

|
|
|
|
|
| 11/28/2022 |
Iowa Insights |
Salary by School District for Teachers and Superintendents — FY 2022
|
|
|
|
|
| 11/07/2022 |
Iowa Insights |
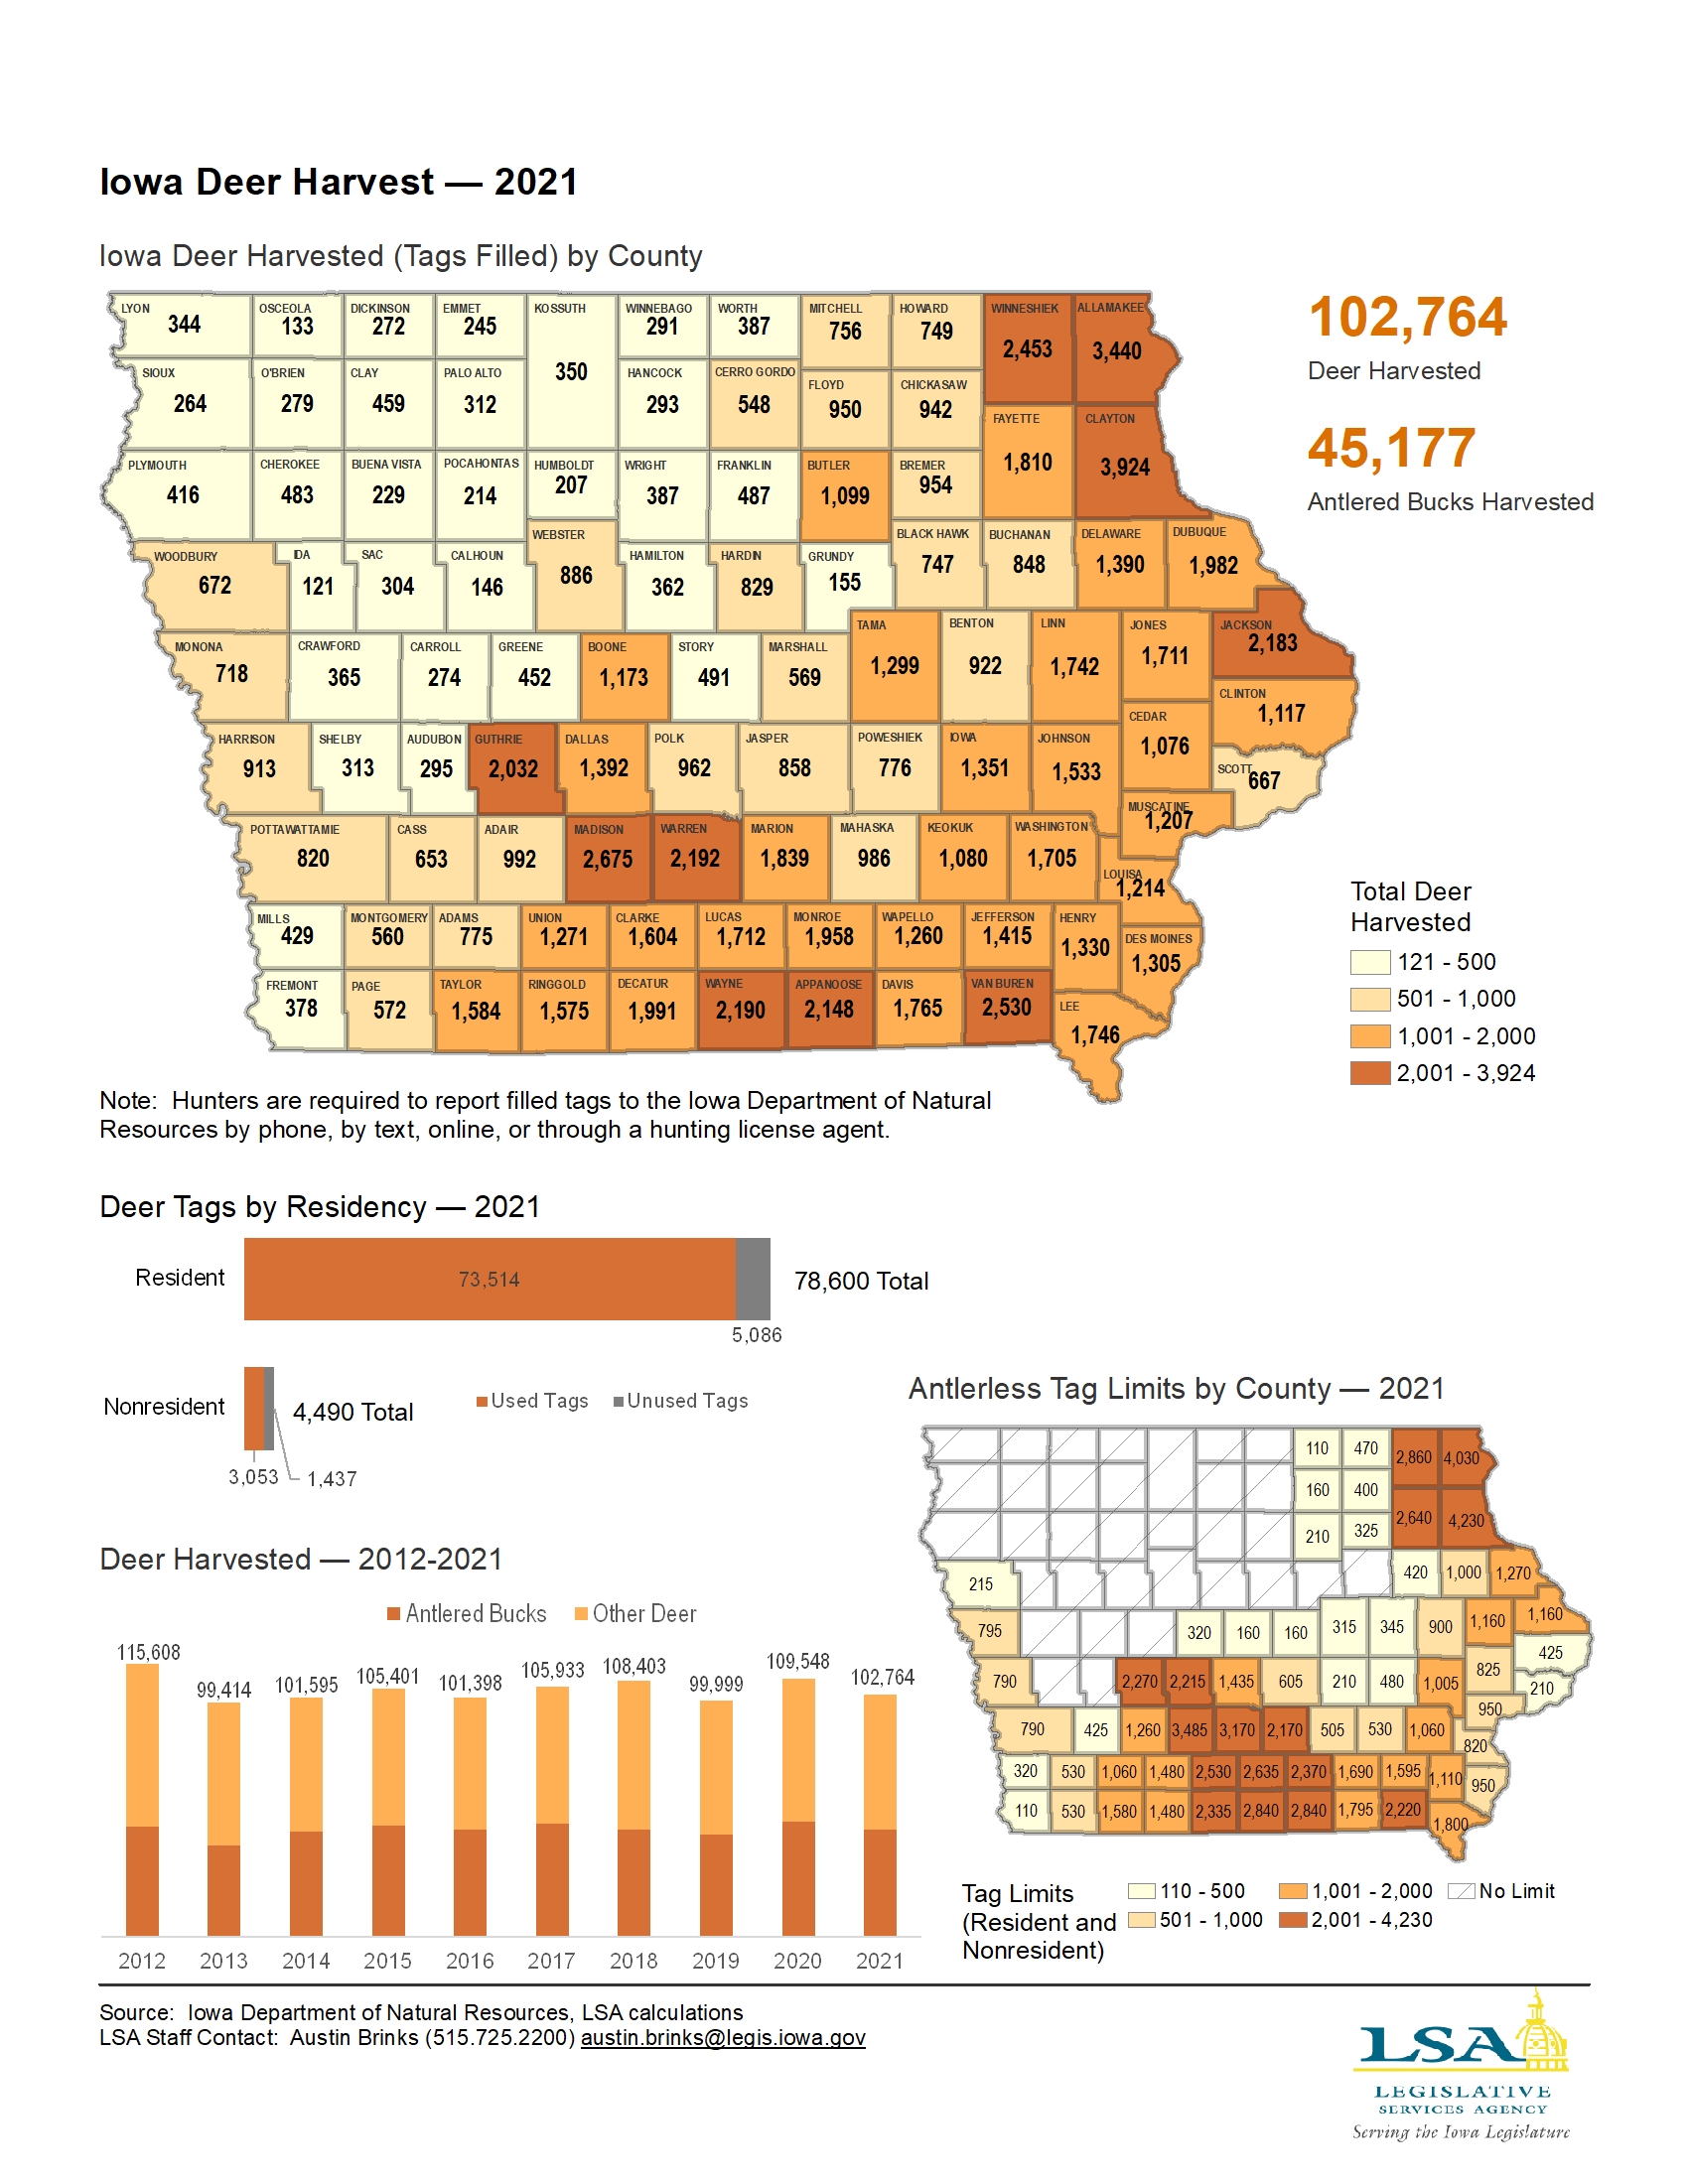
Iowa Deer Harvest — 2021
|
|
|
|
|
| 10/31/2022 |
Iowa Insights |
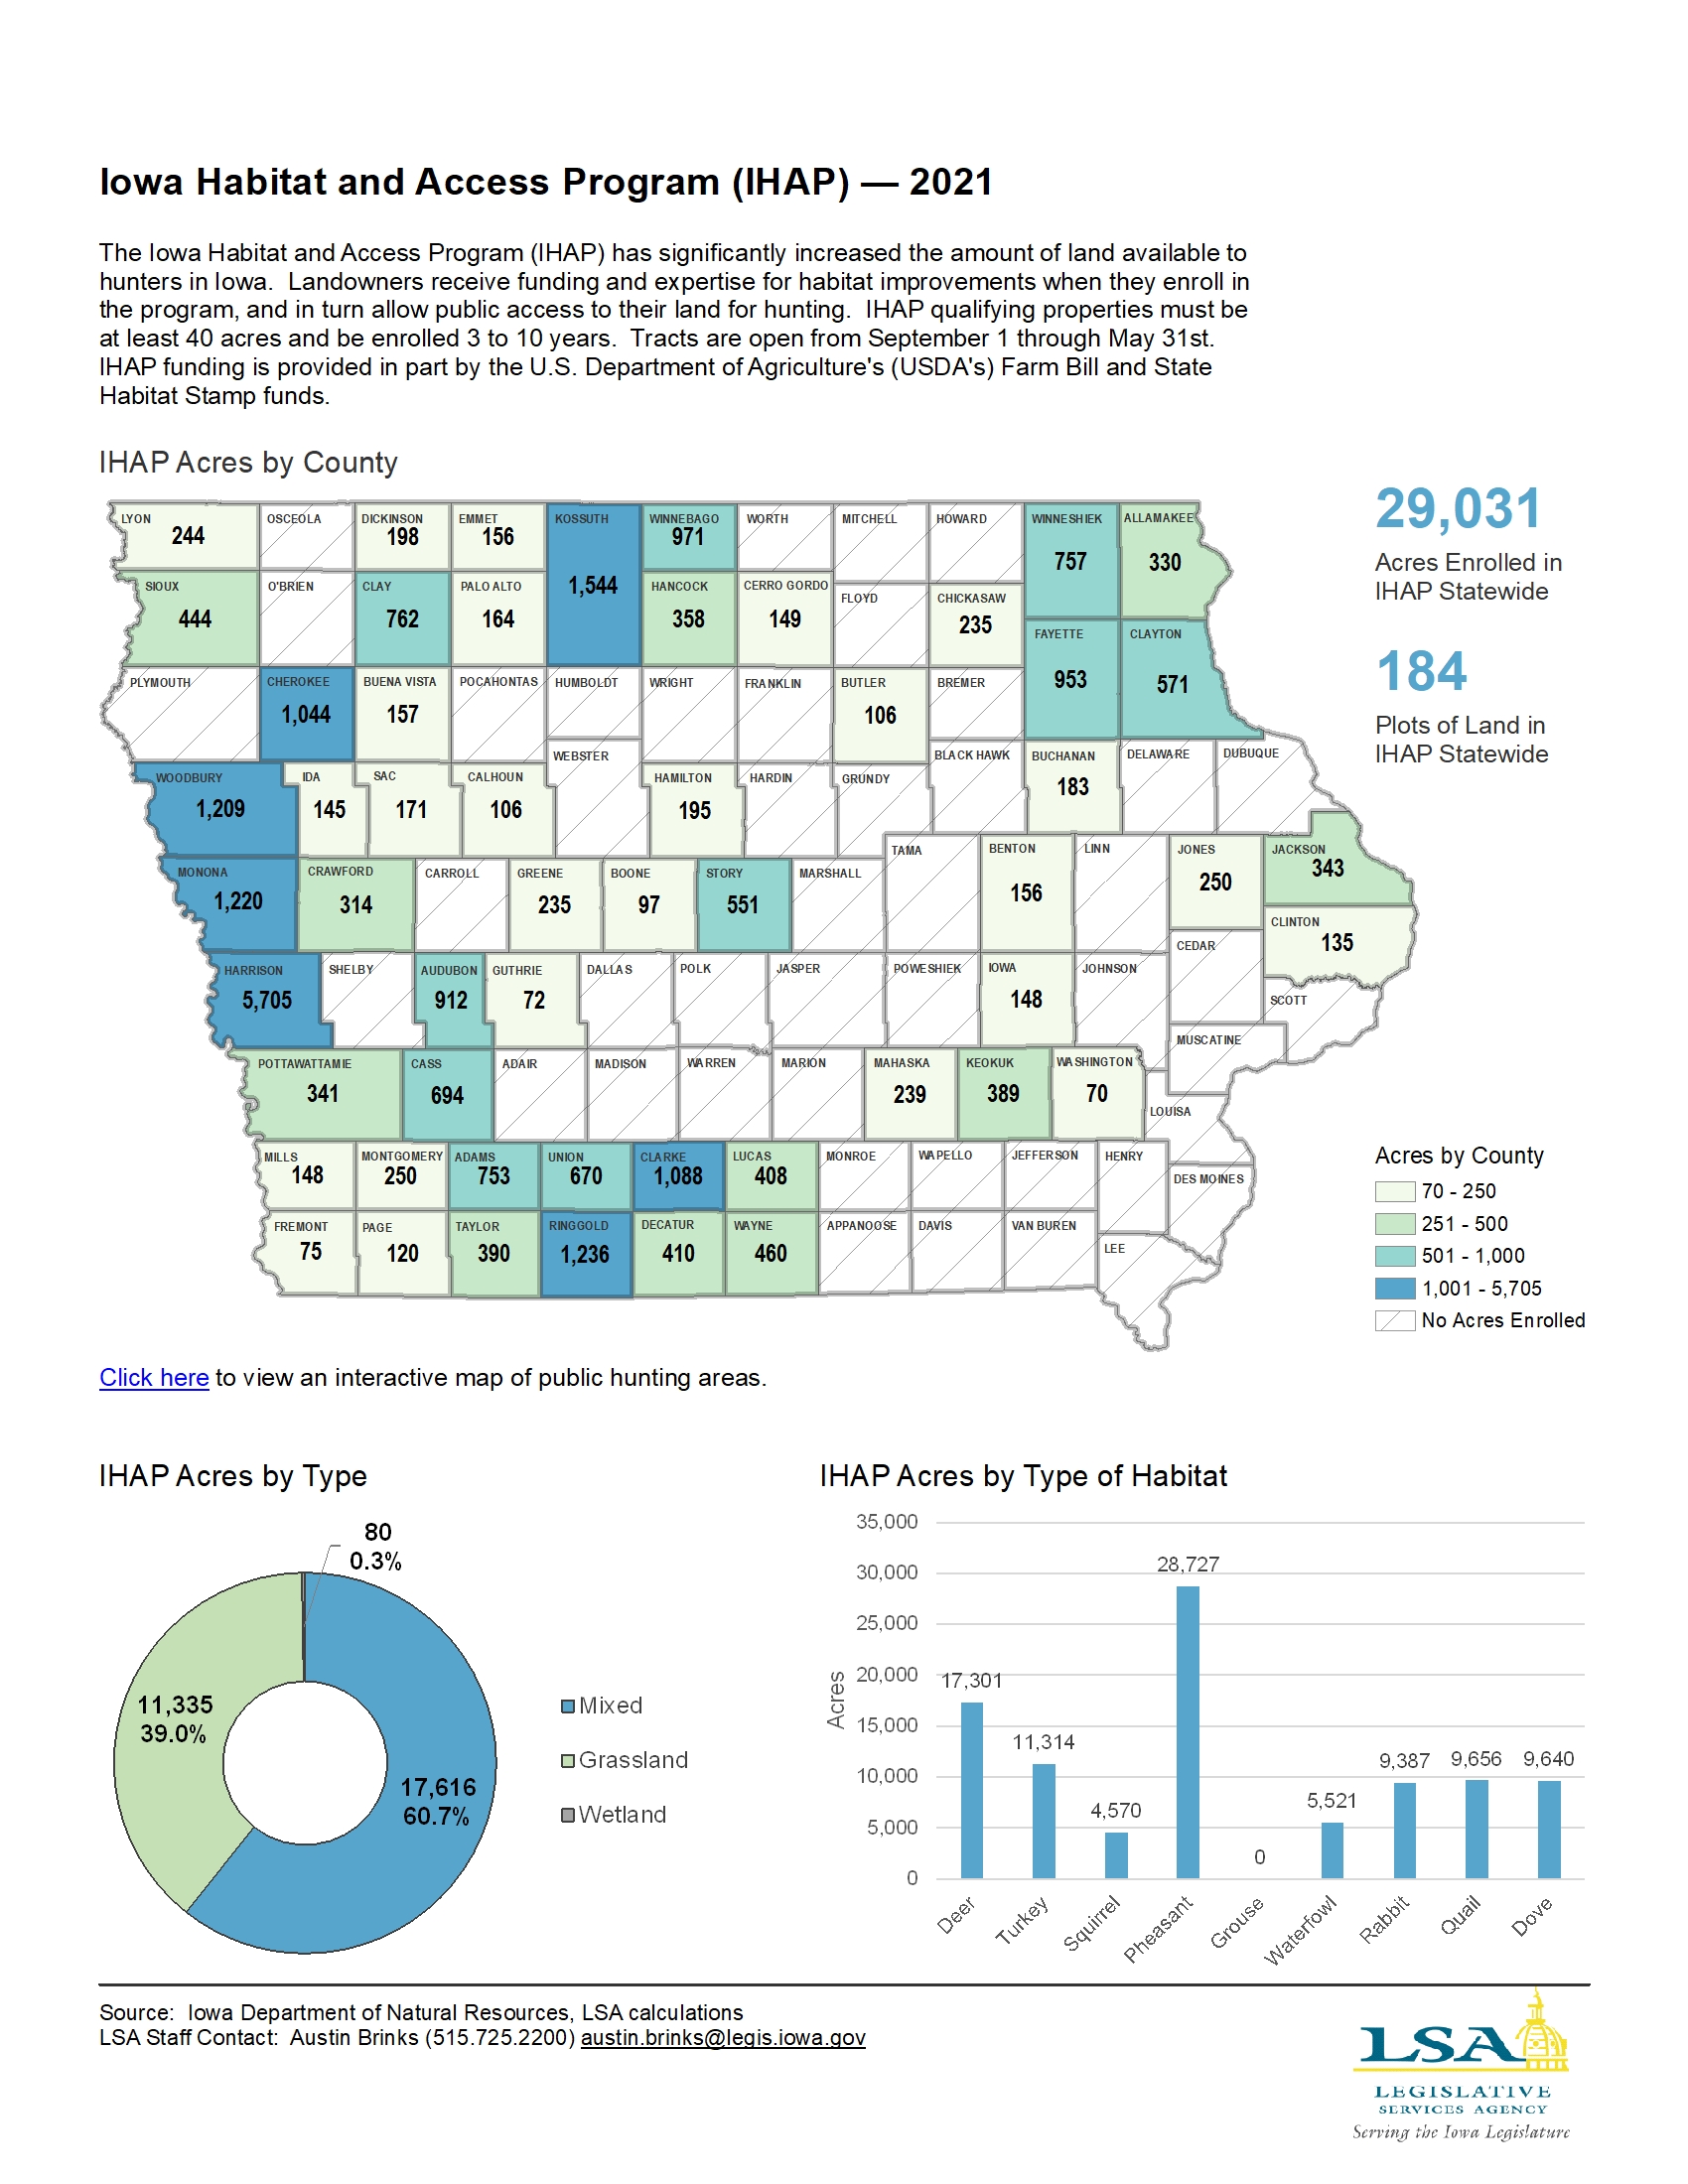
Iowa Habitat and Access Program (IHAP) — 2021
|
|
|
|
|
| 10/24/2022 |
Iowa Insights |
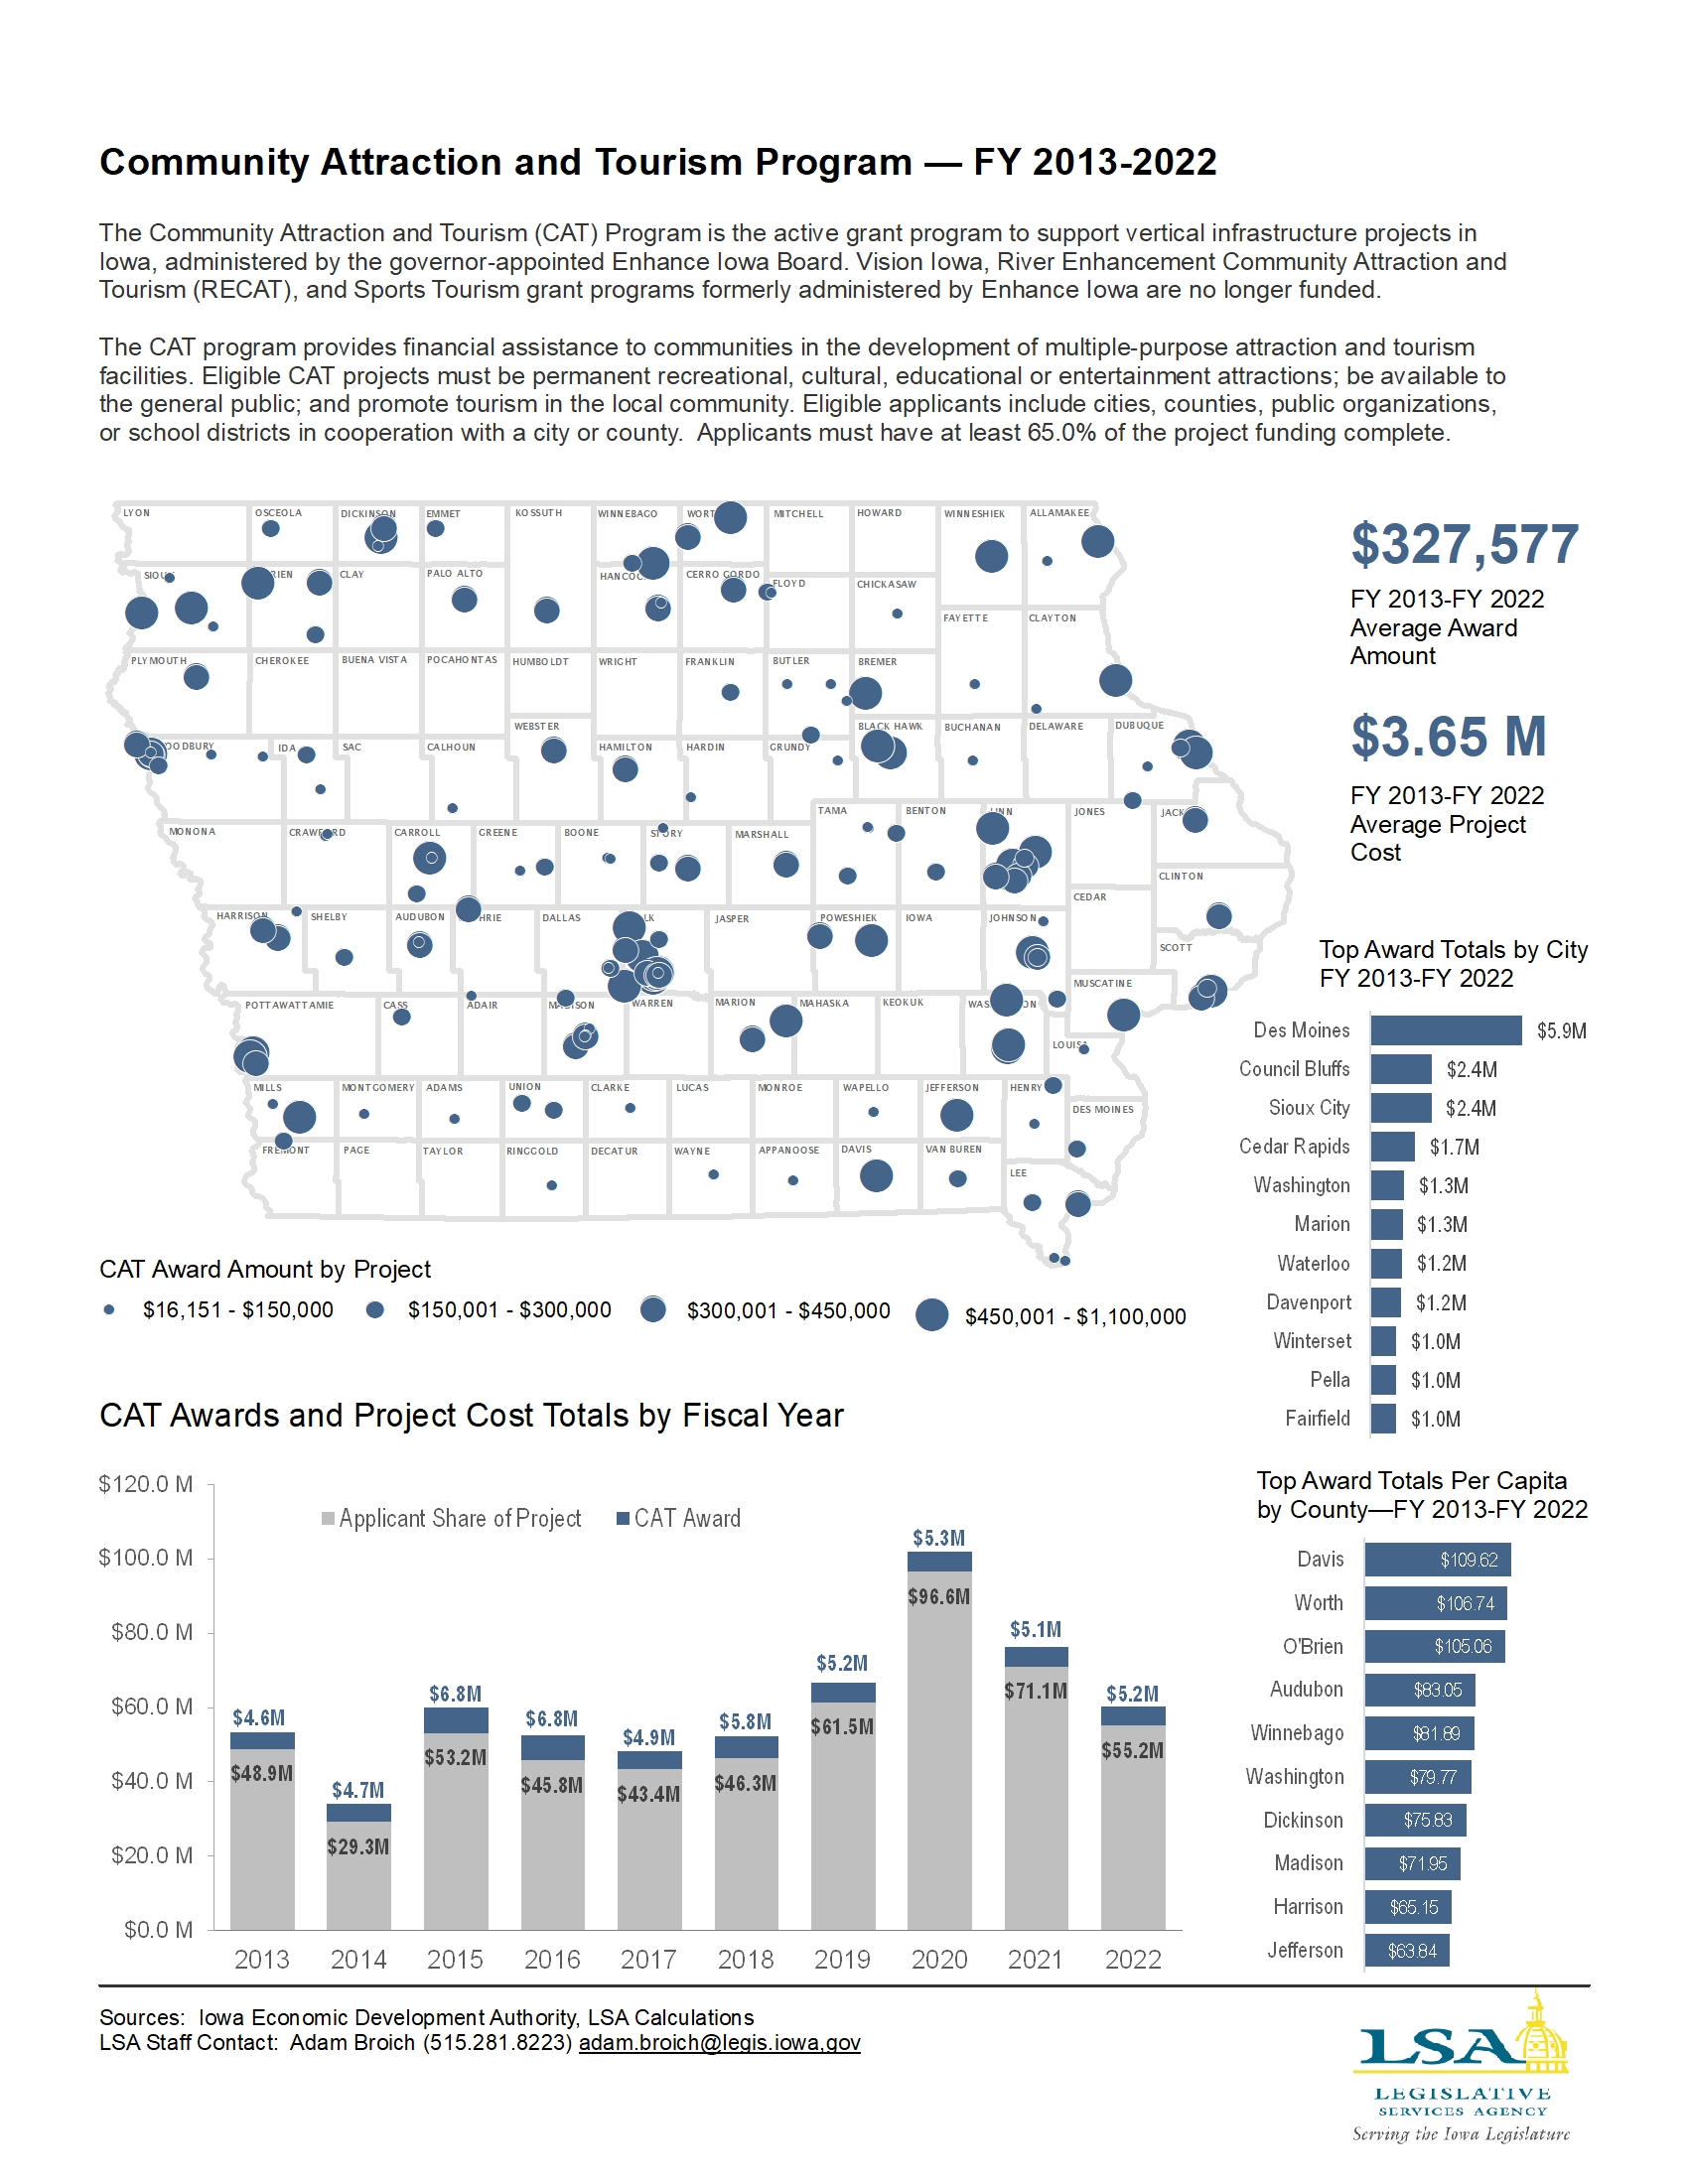
Community Attraction and Tourism Program — FY 2013-2022
|
|
|
|
|
| 10/17/2022 |
Iowa Insights |
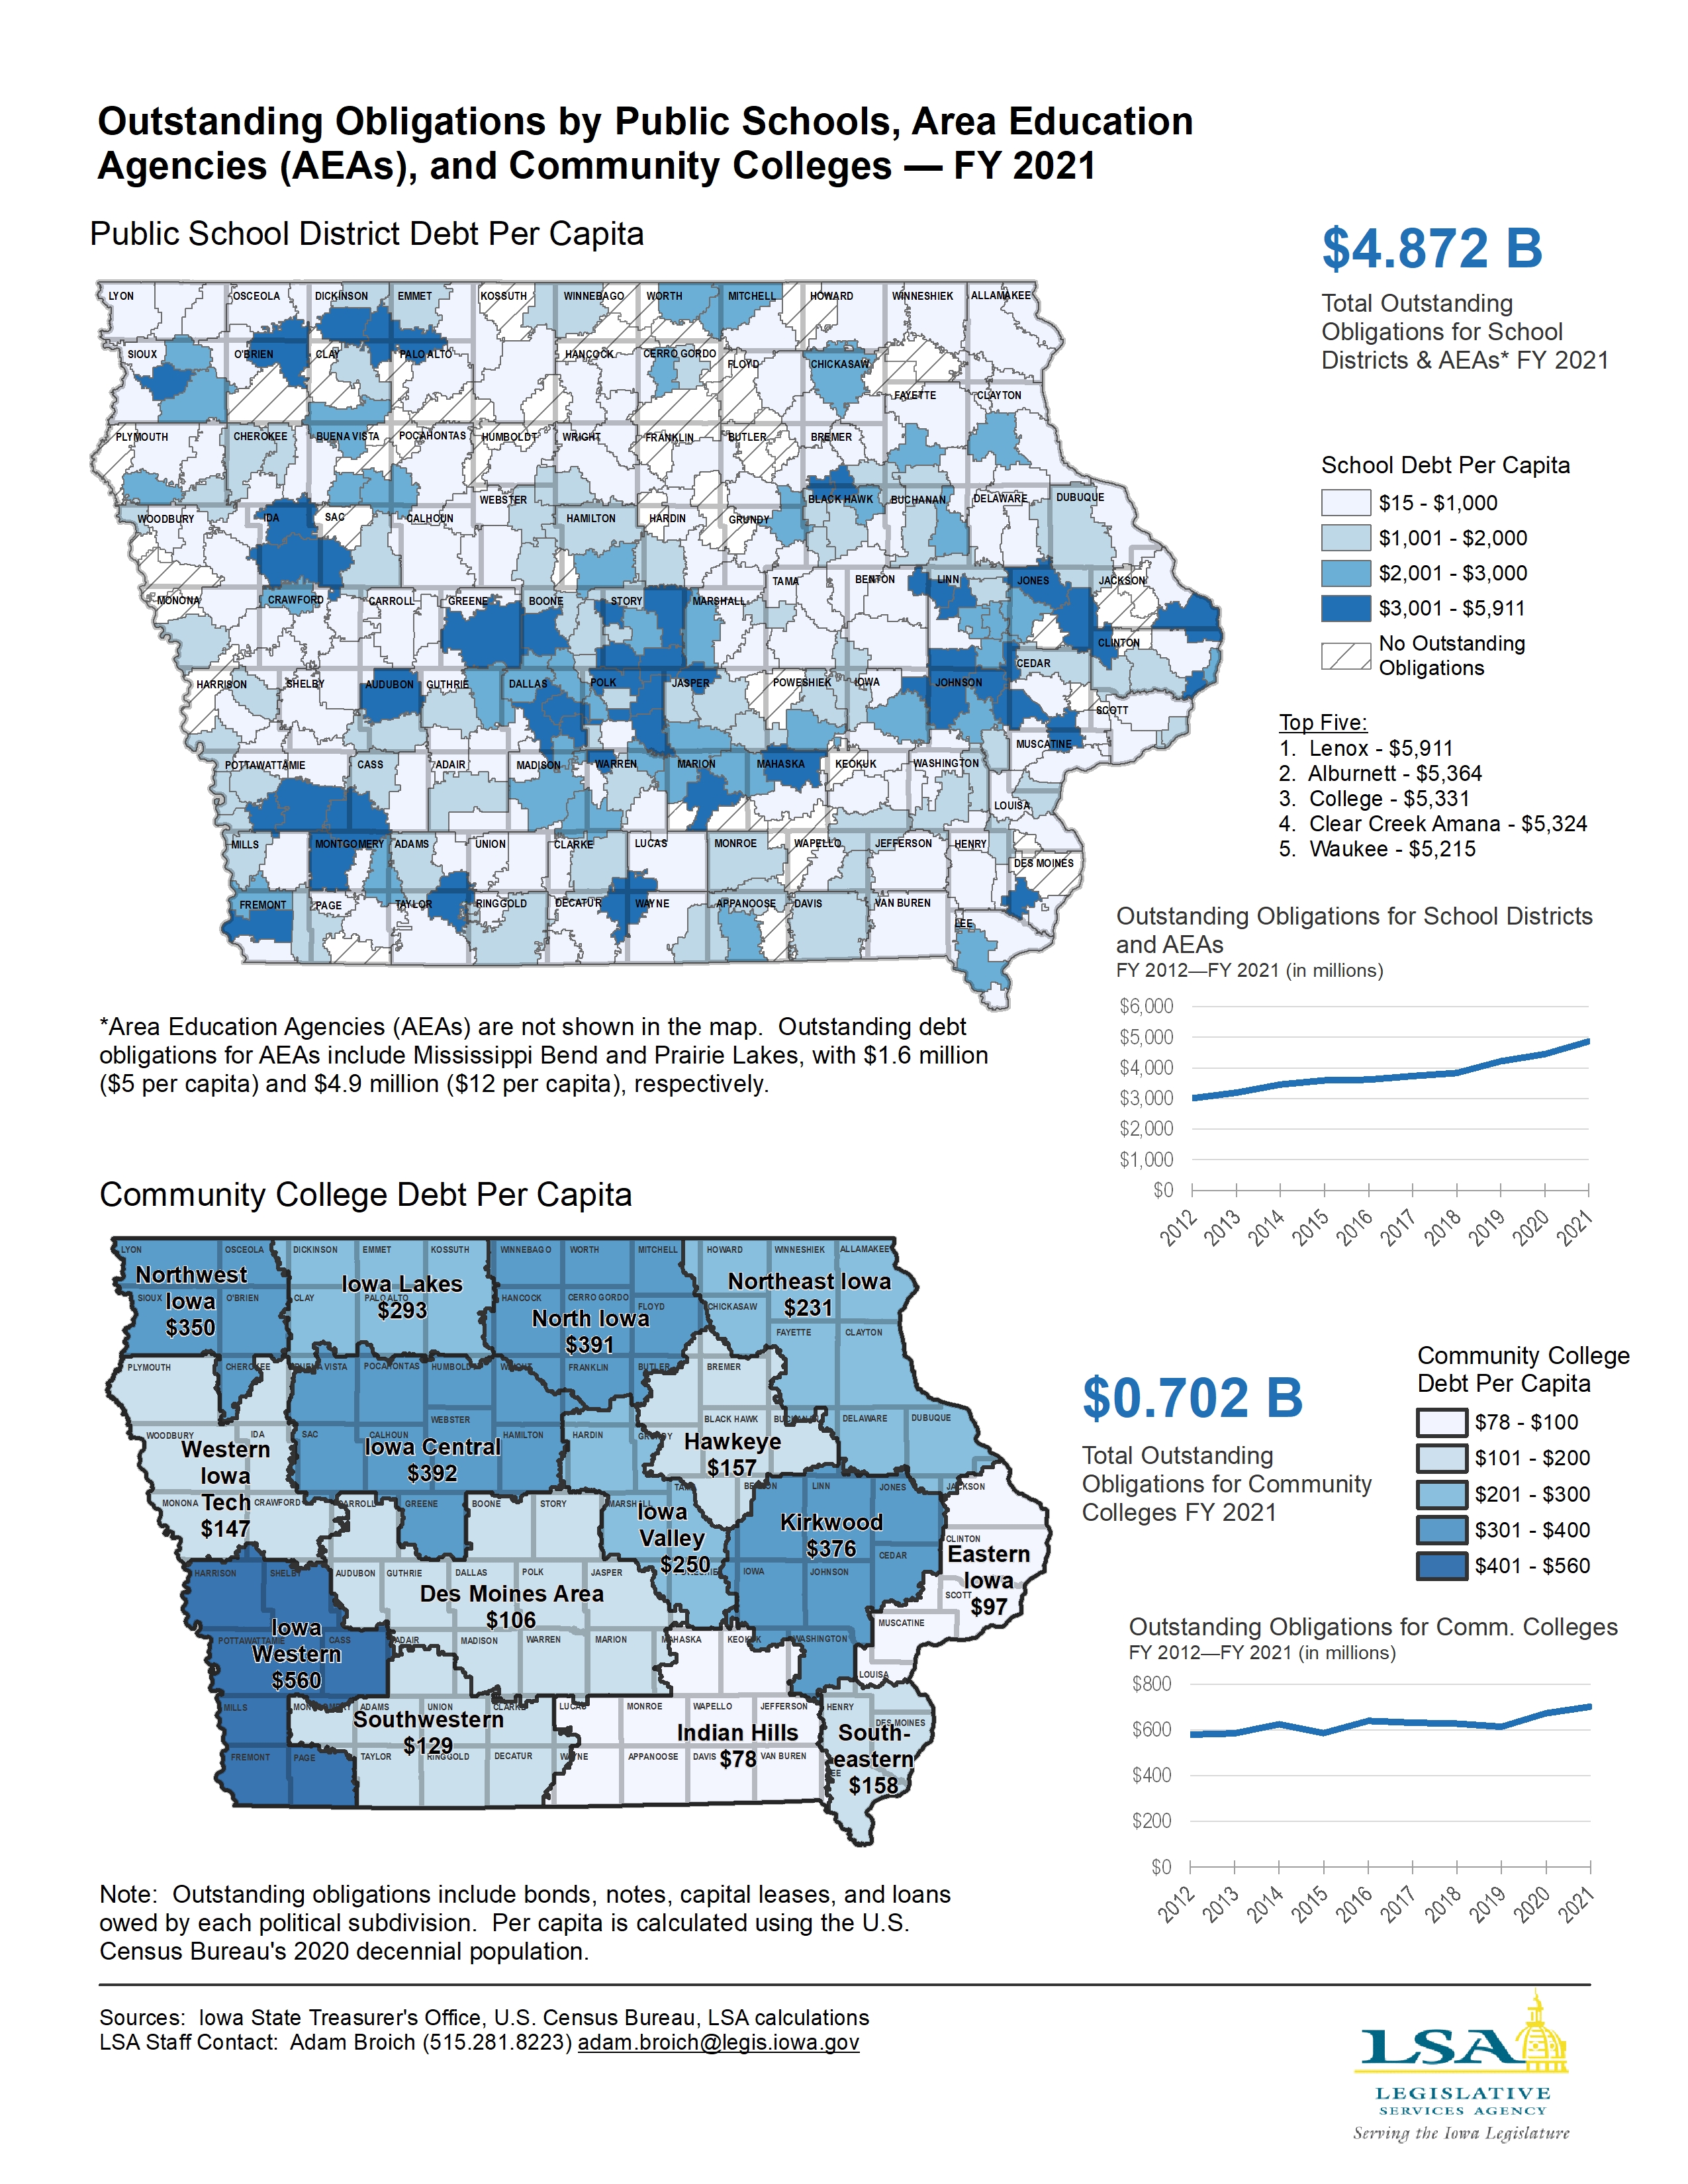
Oustanding Obligations by Public Schools, Area Education Agencies (AEAs), and Community Colleges — FY 2021
|
|
|
|
|
| 10/10/2022 |
Iowa Insights |
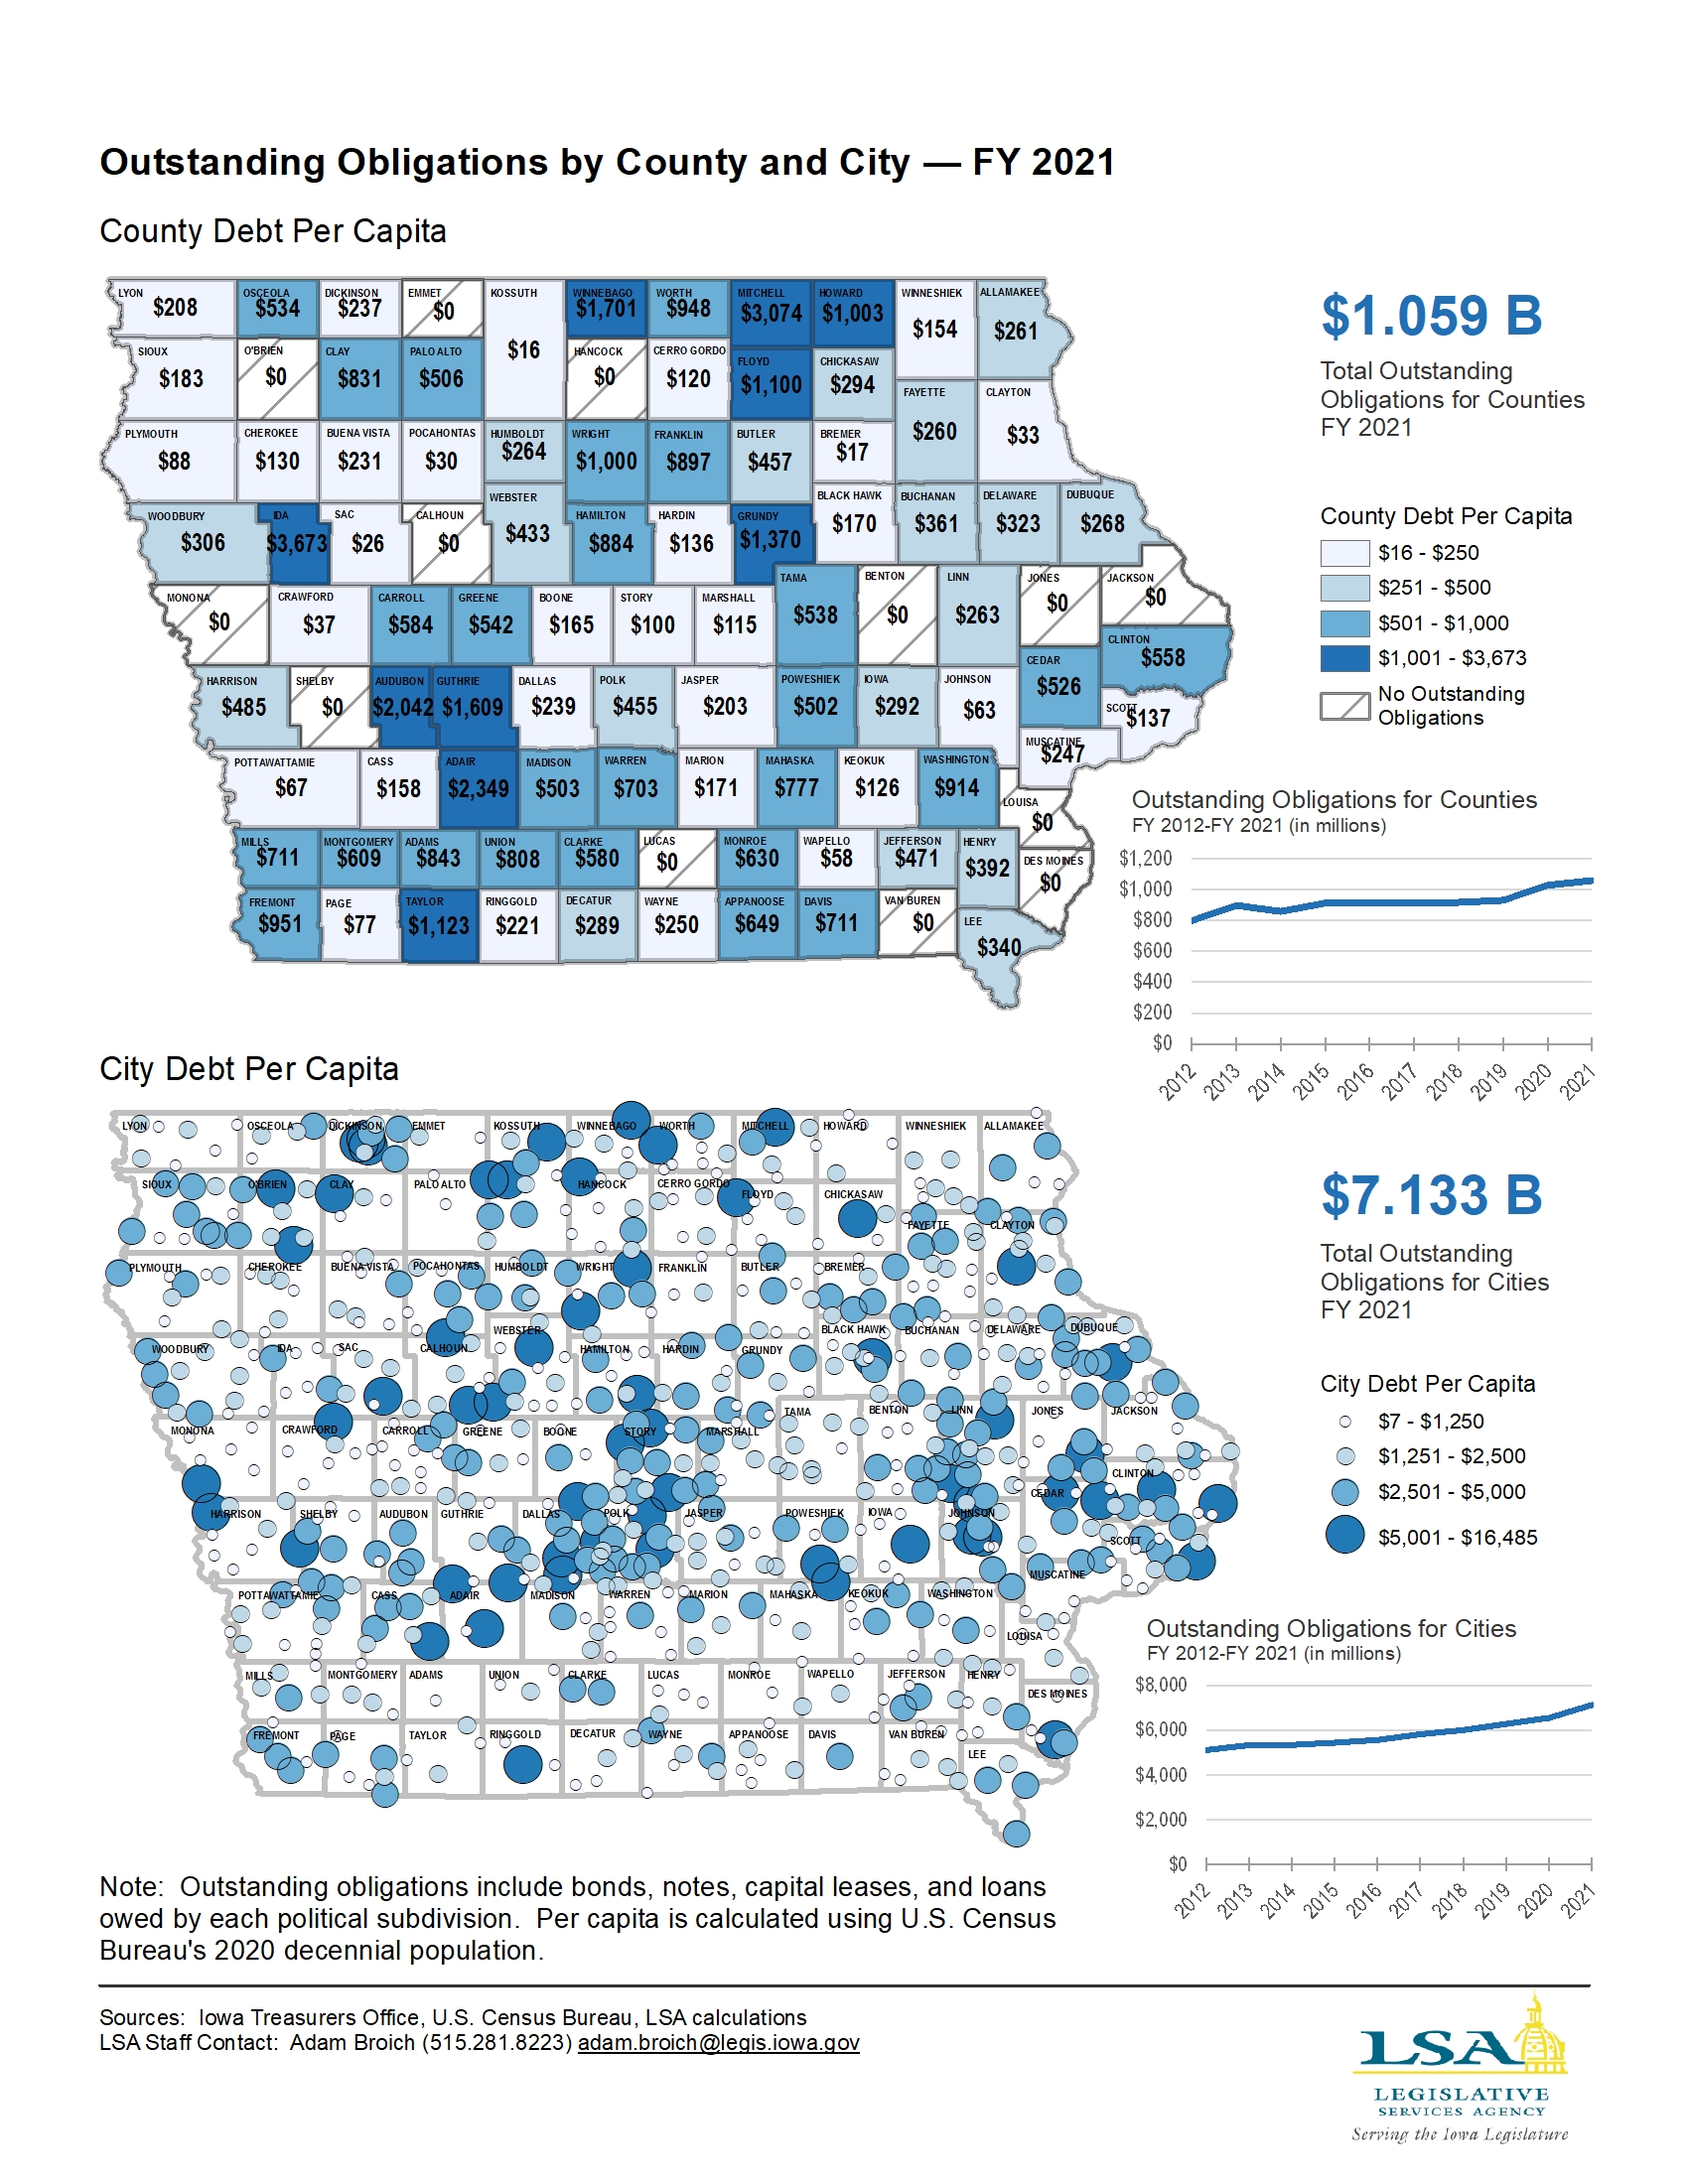
Outstanding Obligations by County and City — FY 2021
|
|
|
|
|
| 10/03/2022 |
Iowa Insights |
Annual Rail Tonnage — 2021
|
|
|
|
|
| 09/26/2022 |
Iowa Insights |
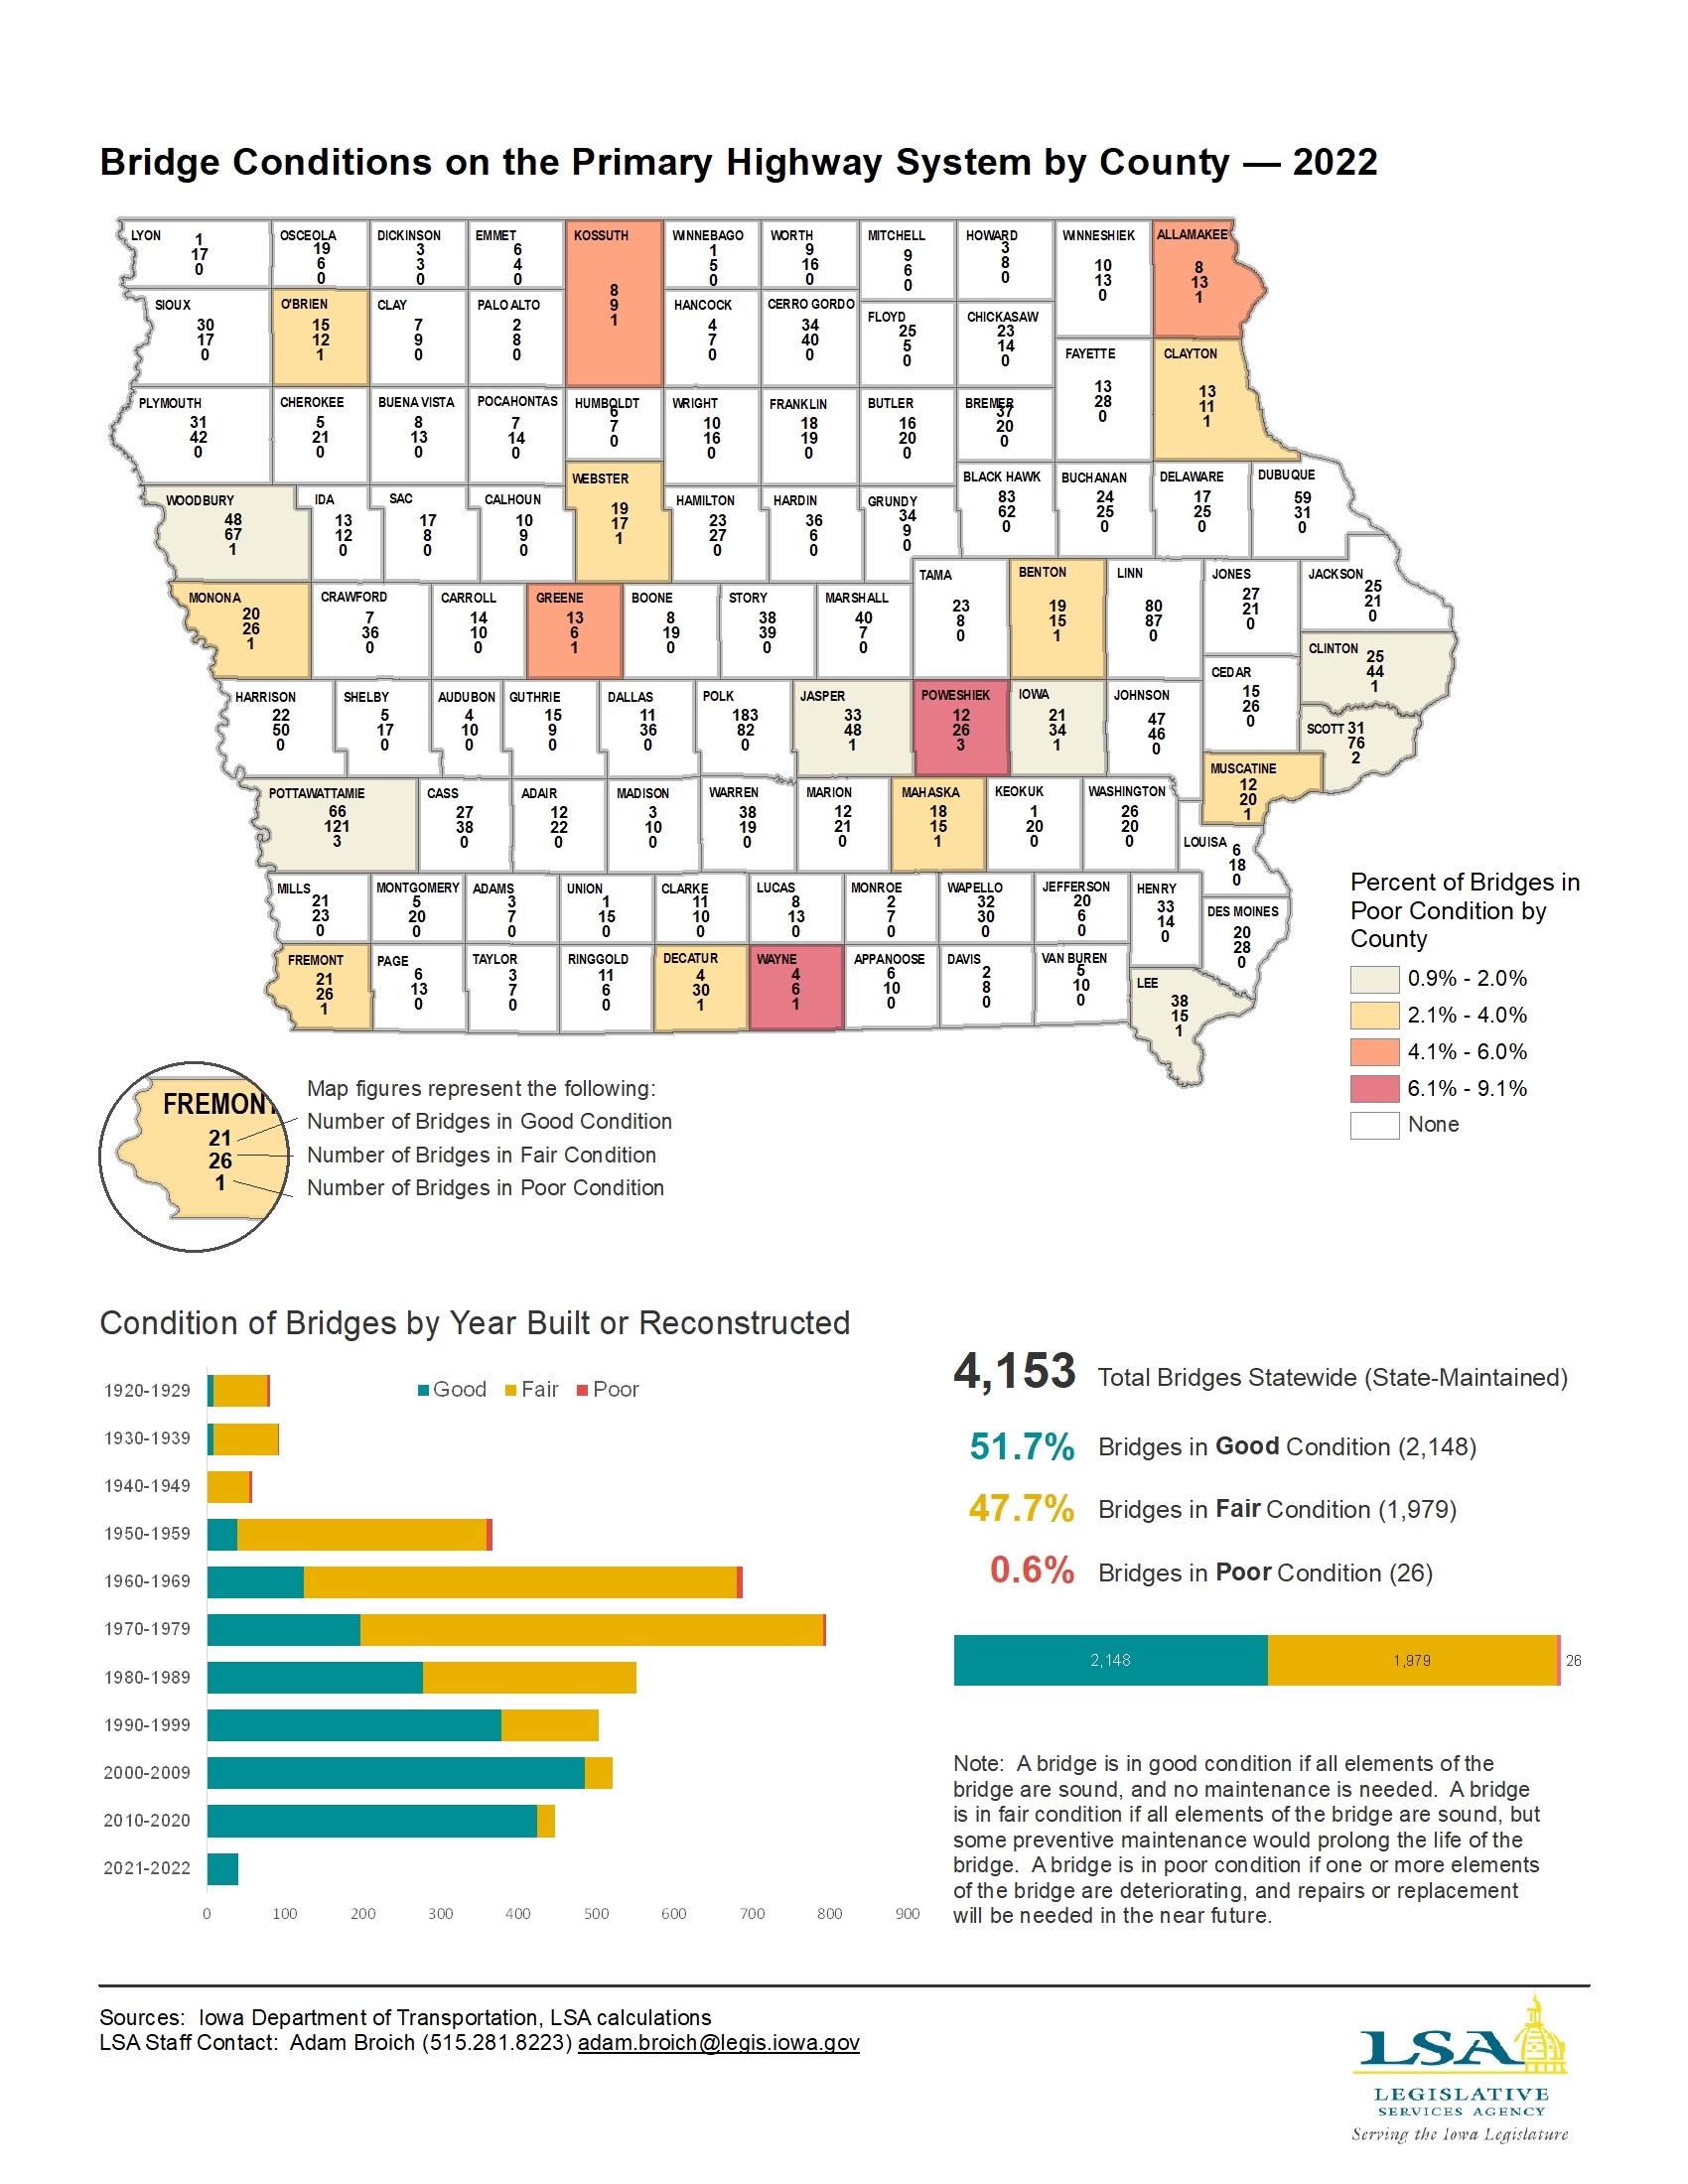
Bridge Conditions on the Primary Road System — 2022
|
|
|
|
|
| 09/19/2022 |
Iowa Insights |
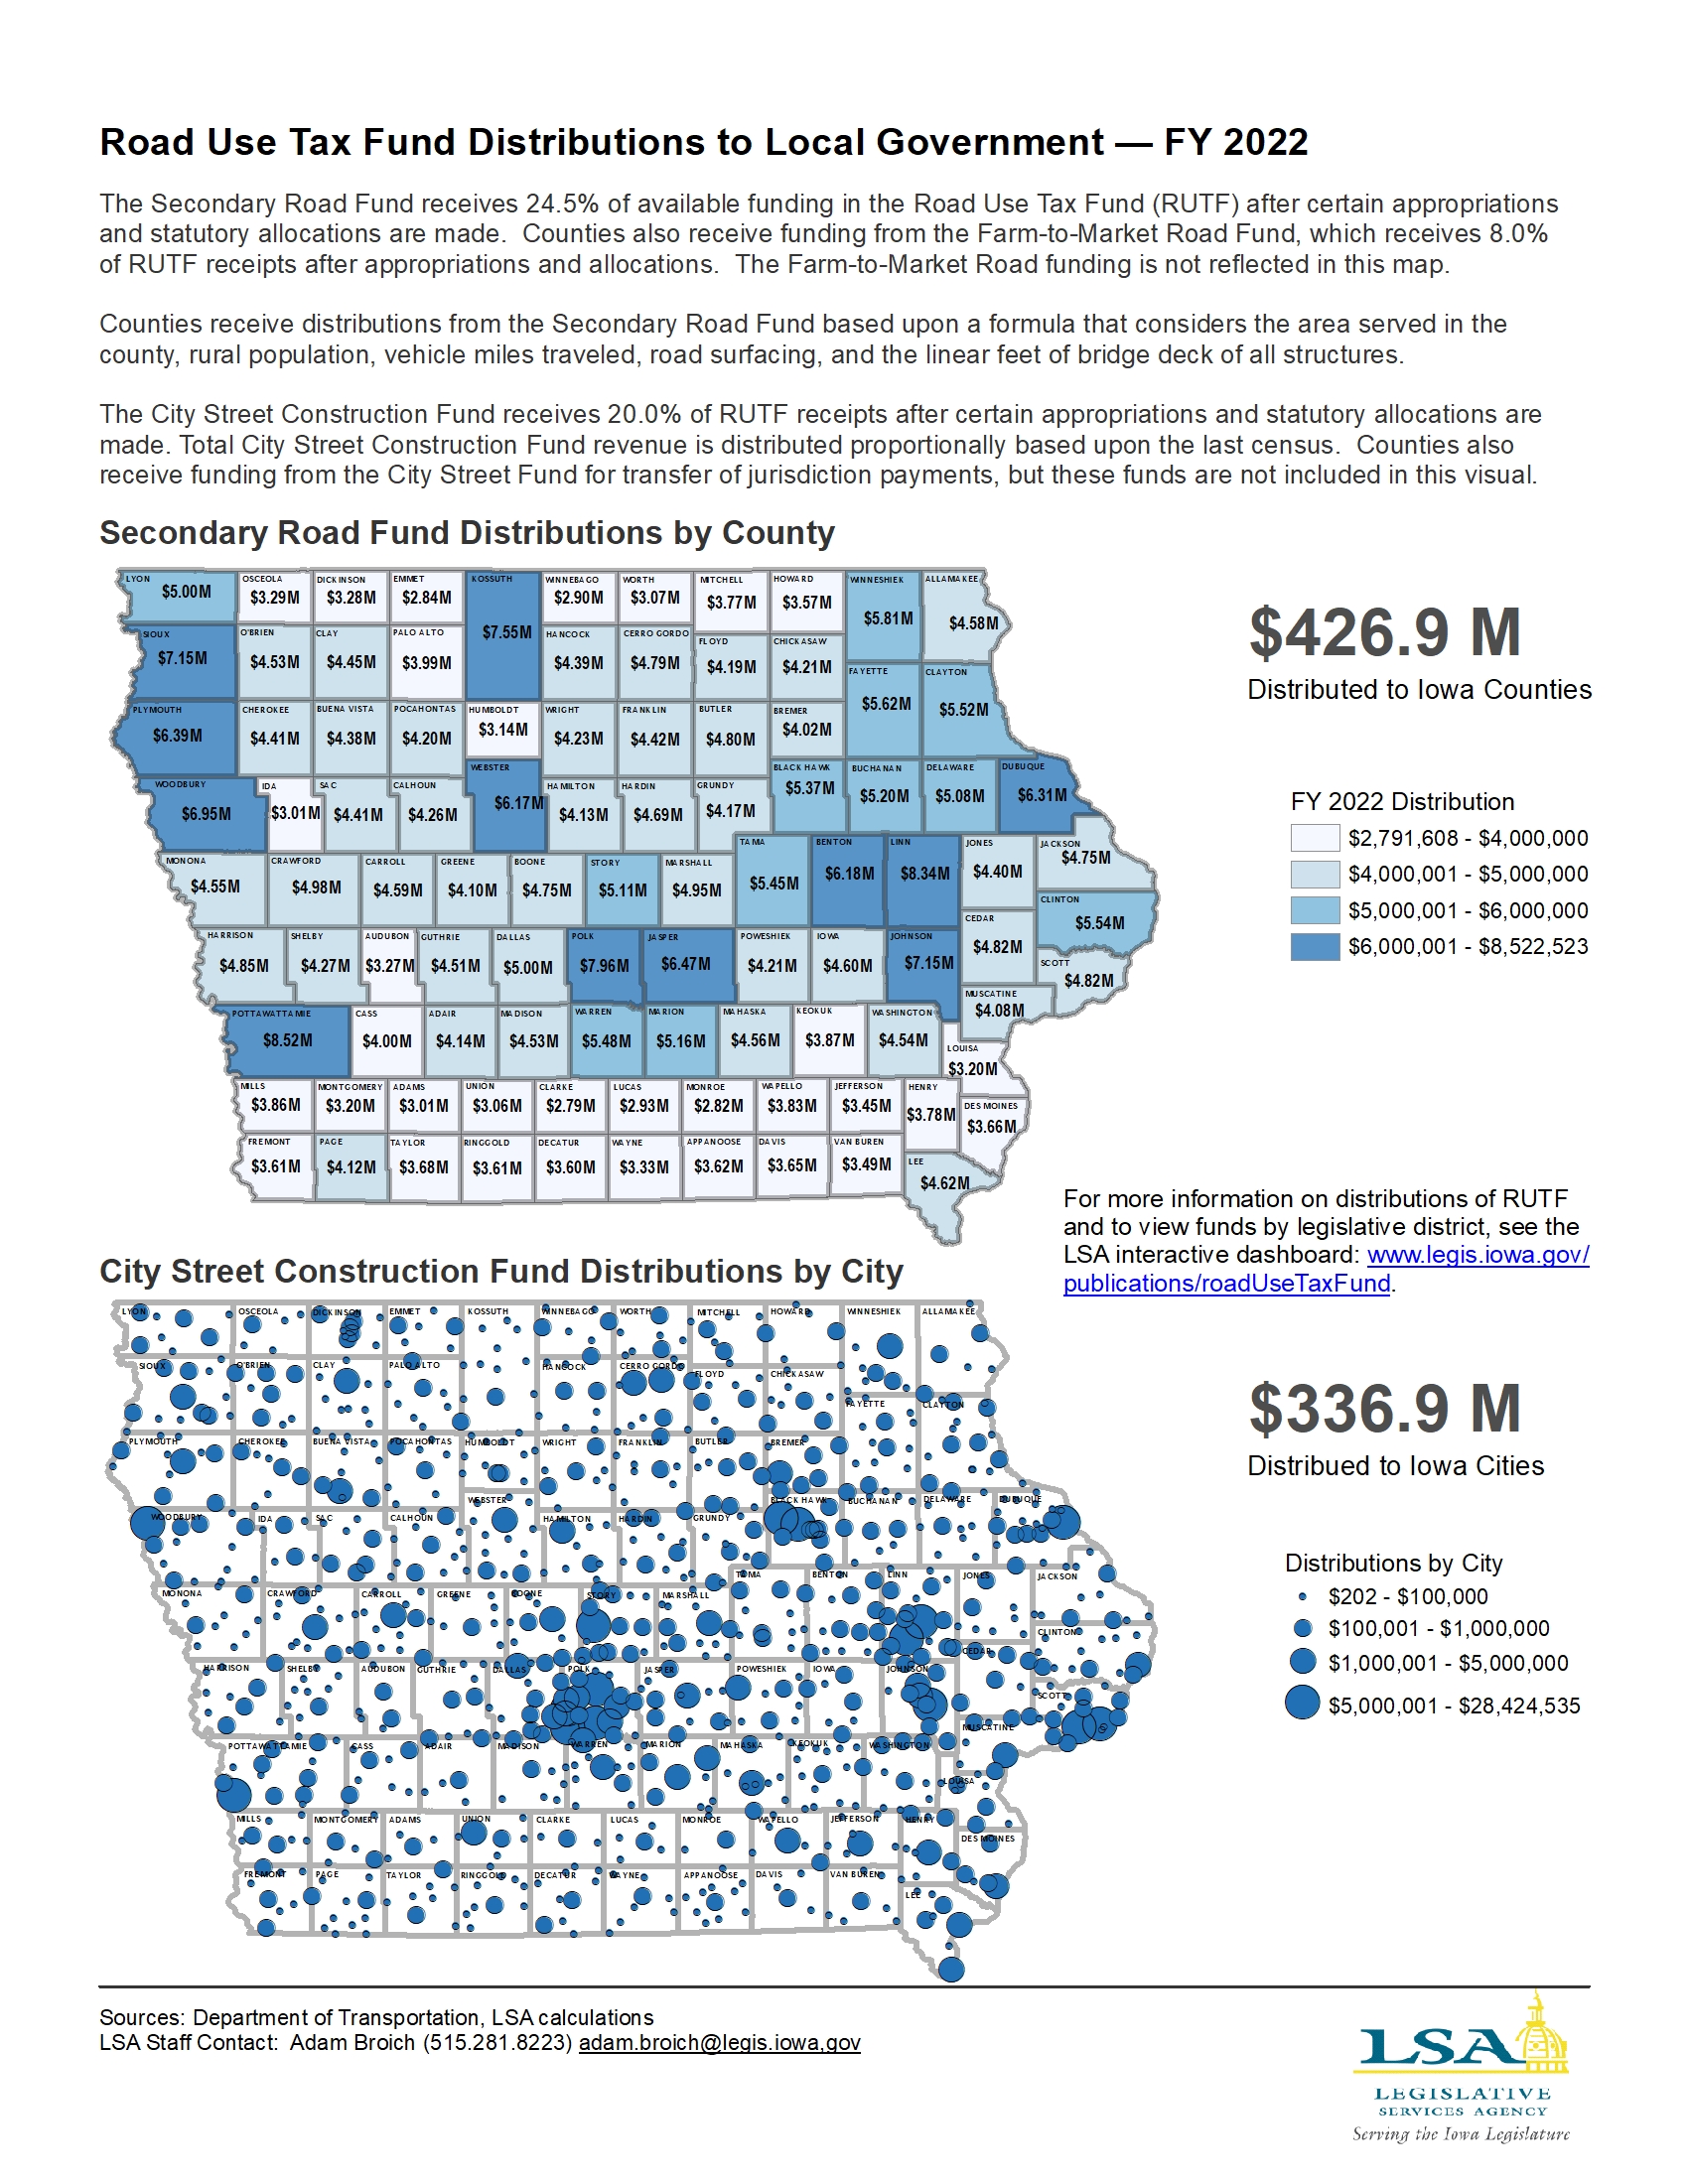
Road Use Tax Fund Distributions to Local Government — FY 2022
|
|
|
|
|
| 09/12/2022 |
Iowa Insights |
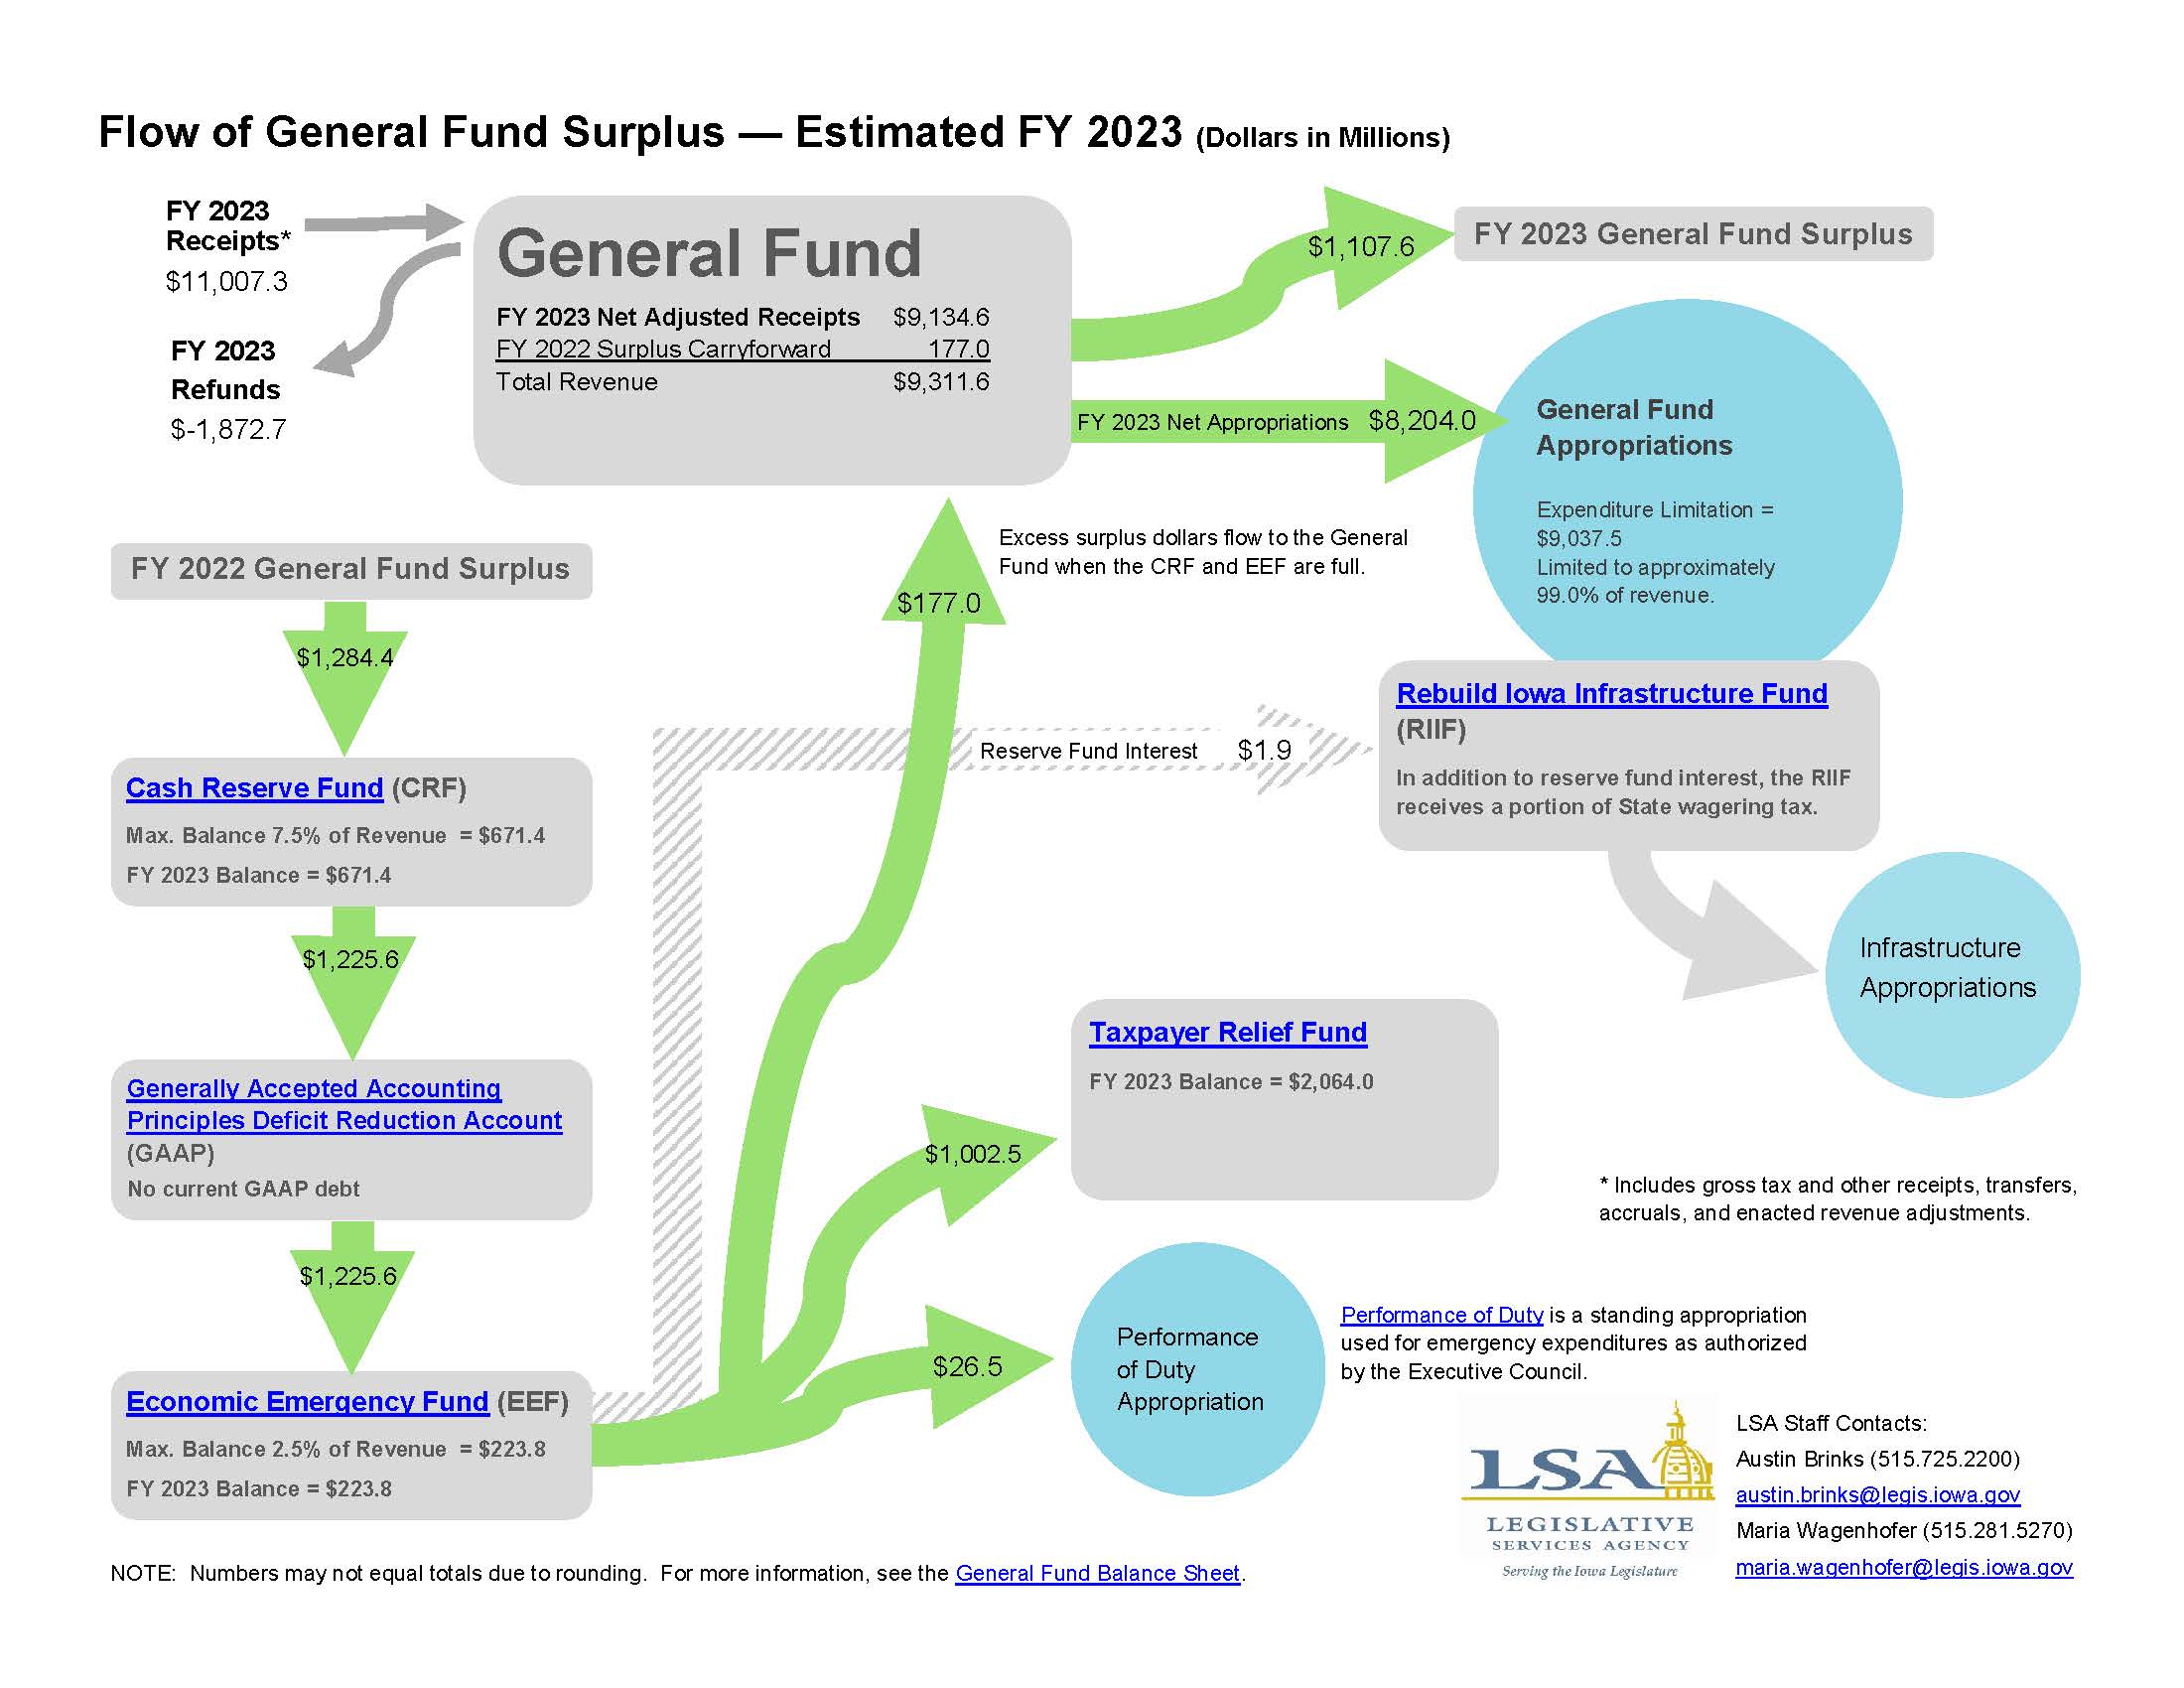
FY 2023 Estimated Flow of General Fund Surplus
|
|
|
|
|
| 09/06/2022 |
Iowa Insights |
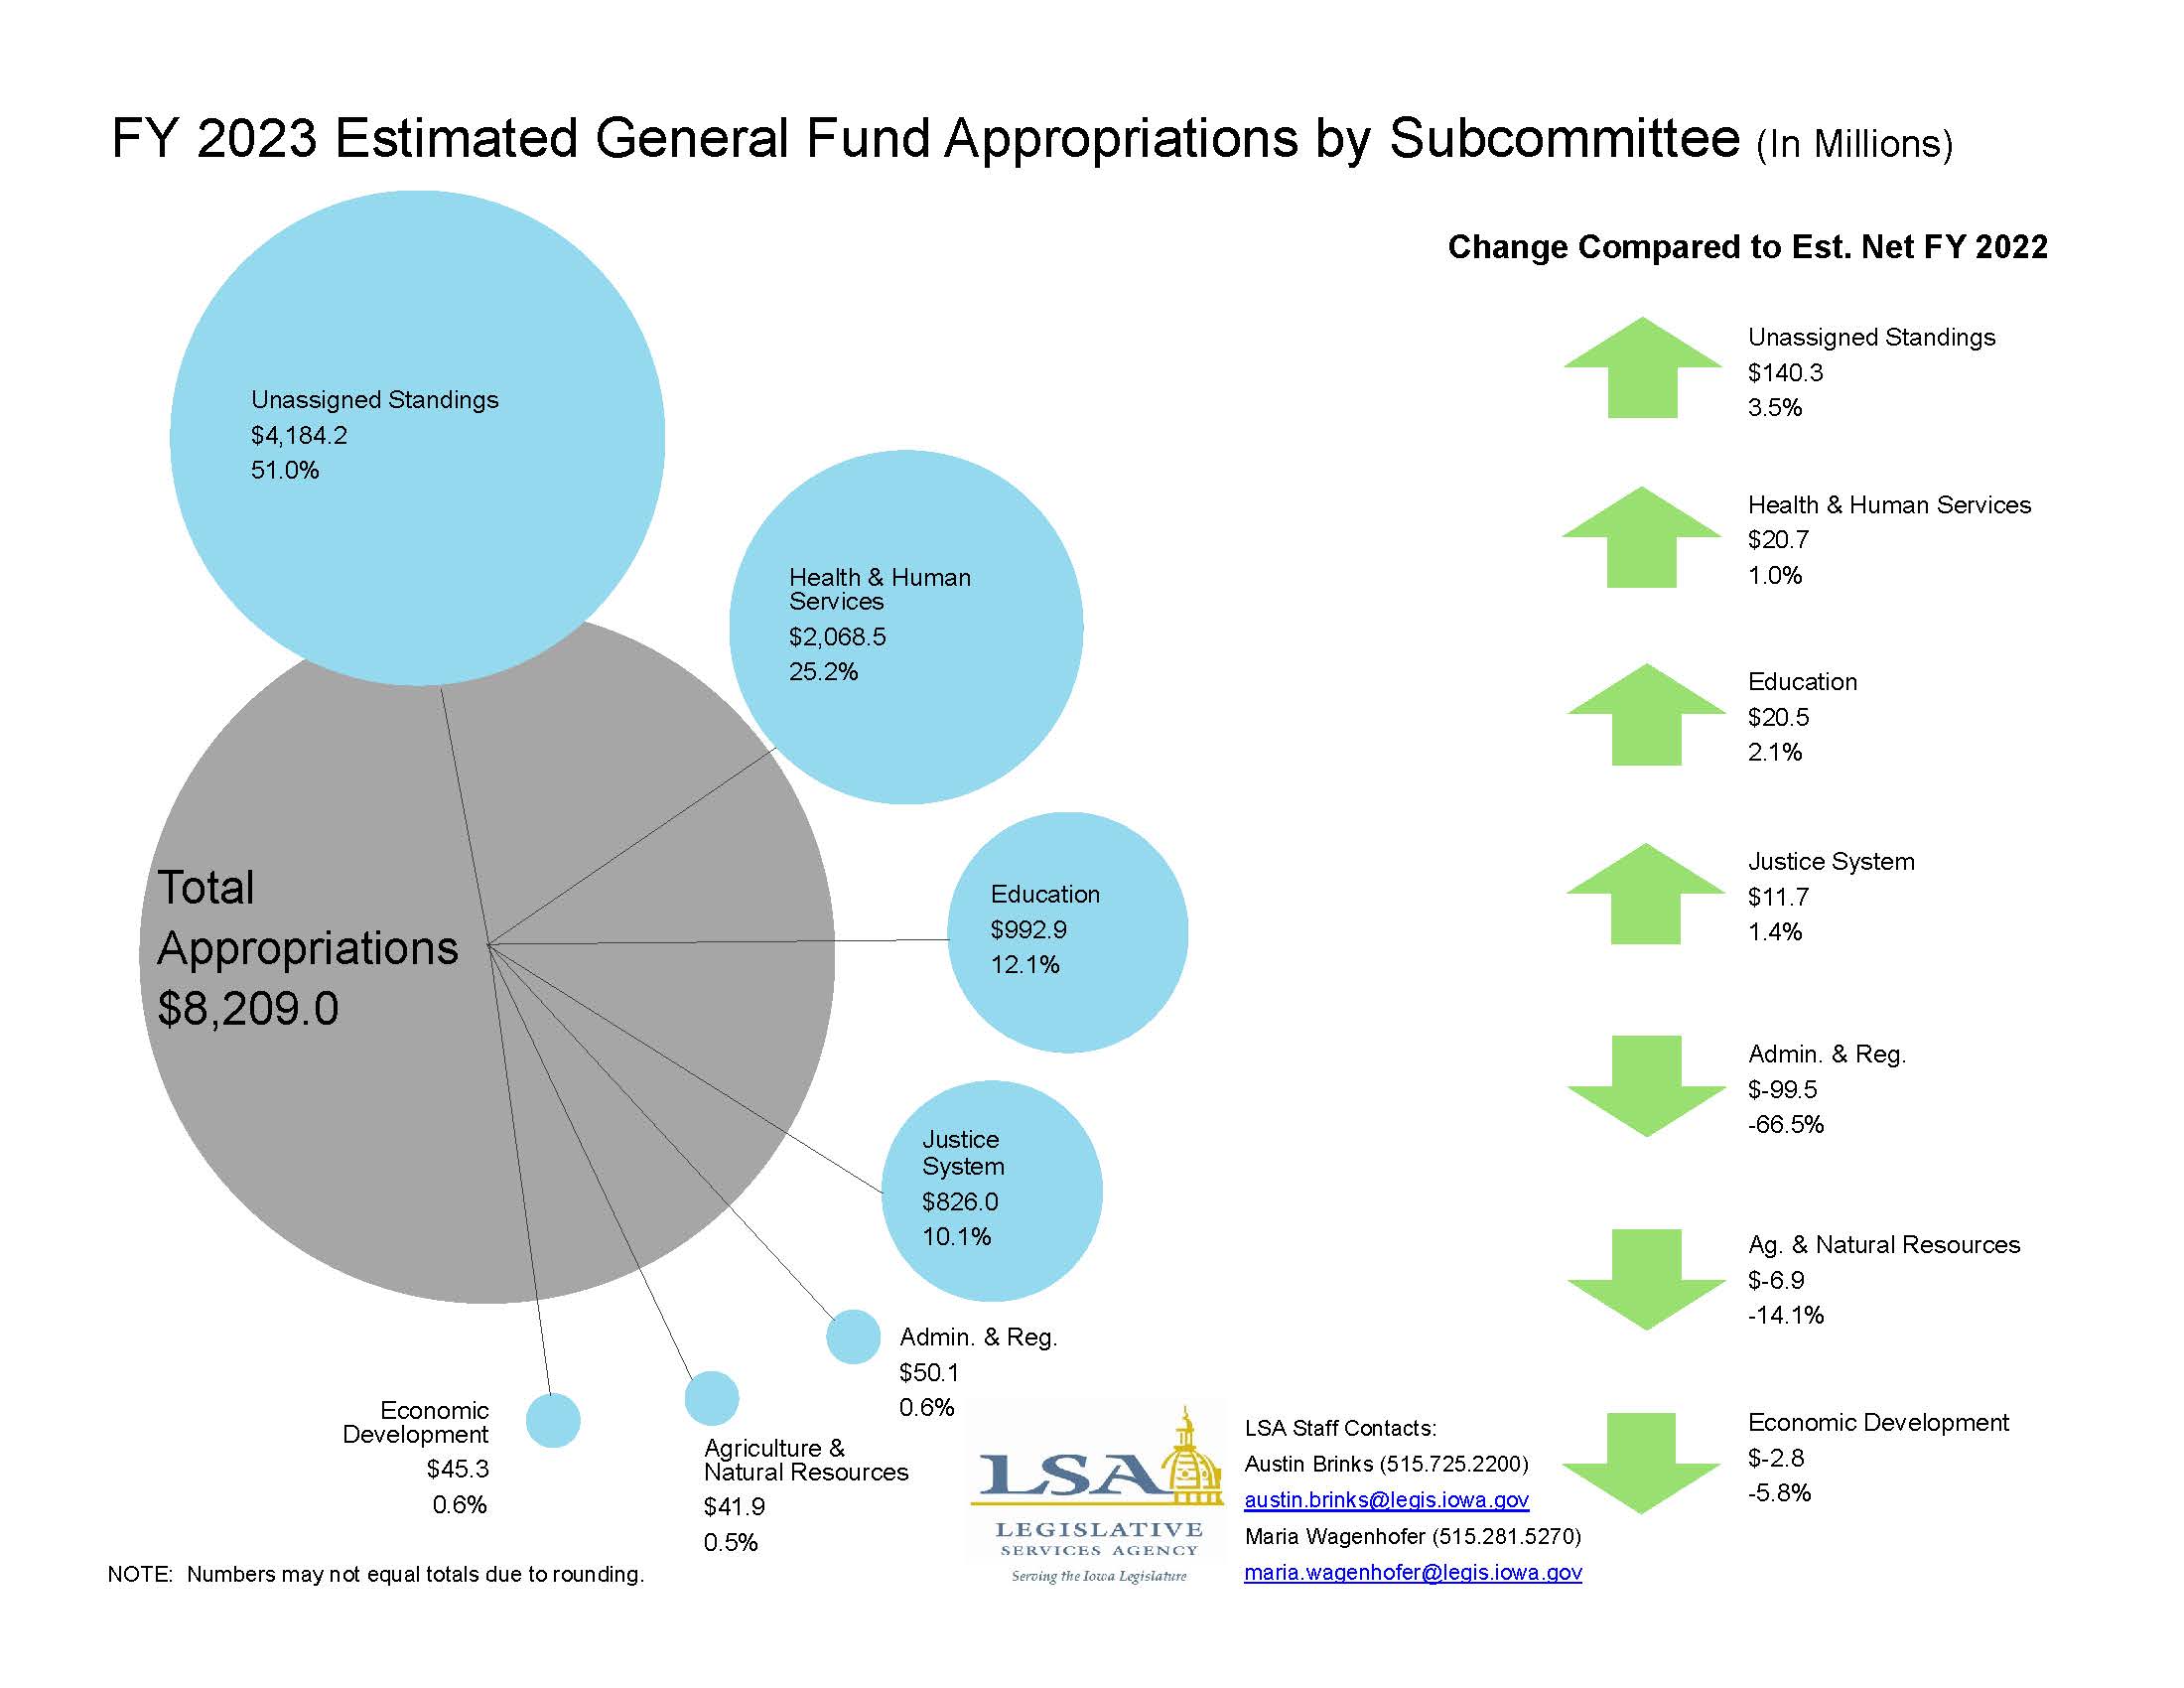
FY 2023 Estimated General Fund Appropriations by Subcommittee
|
|
|
|
|
| 08/29/2022 |
Iowa Insights |
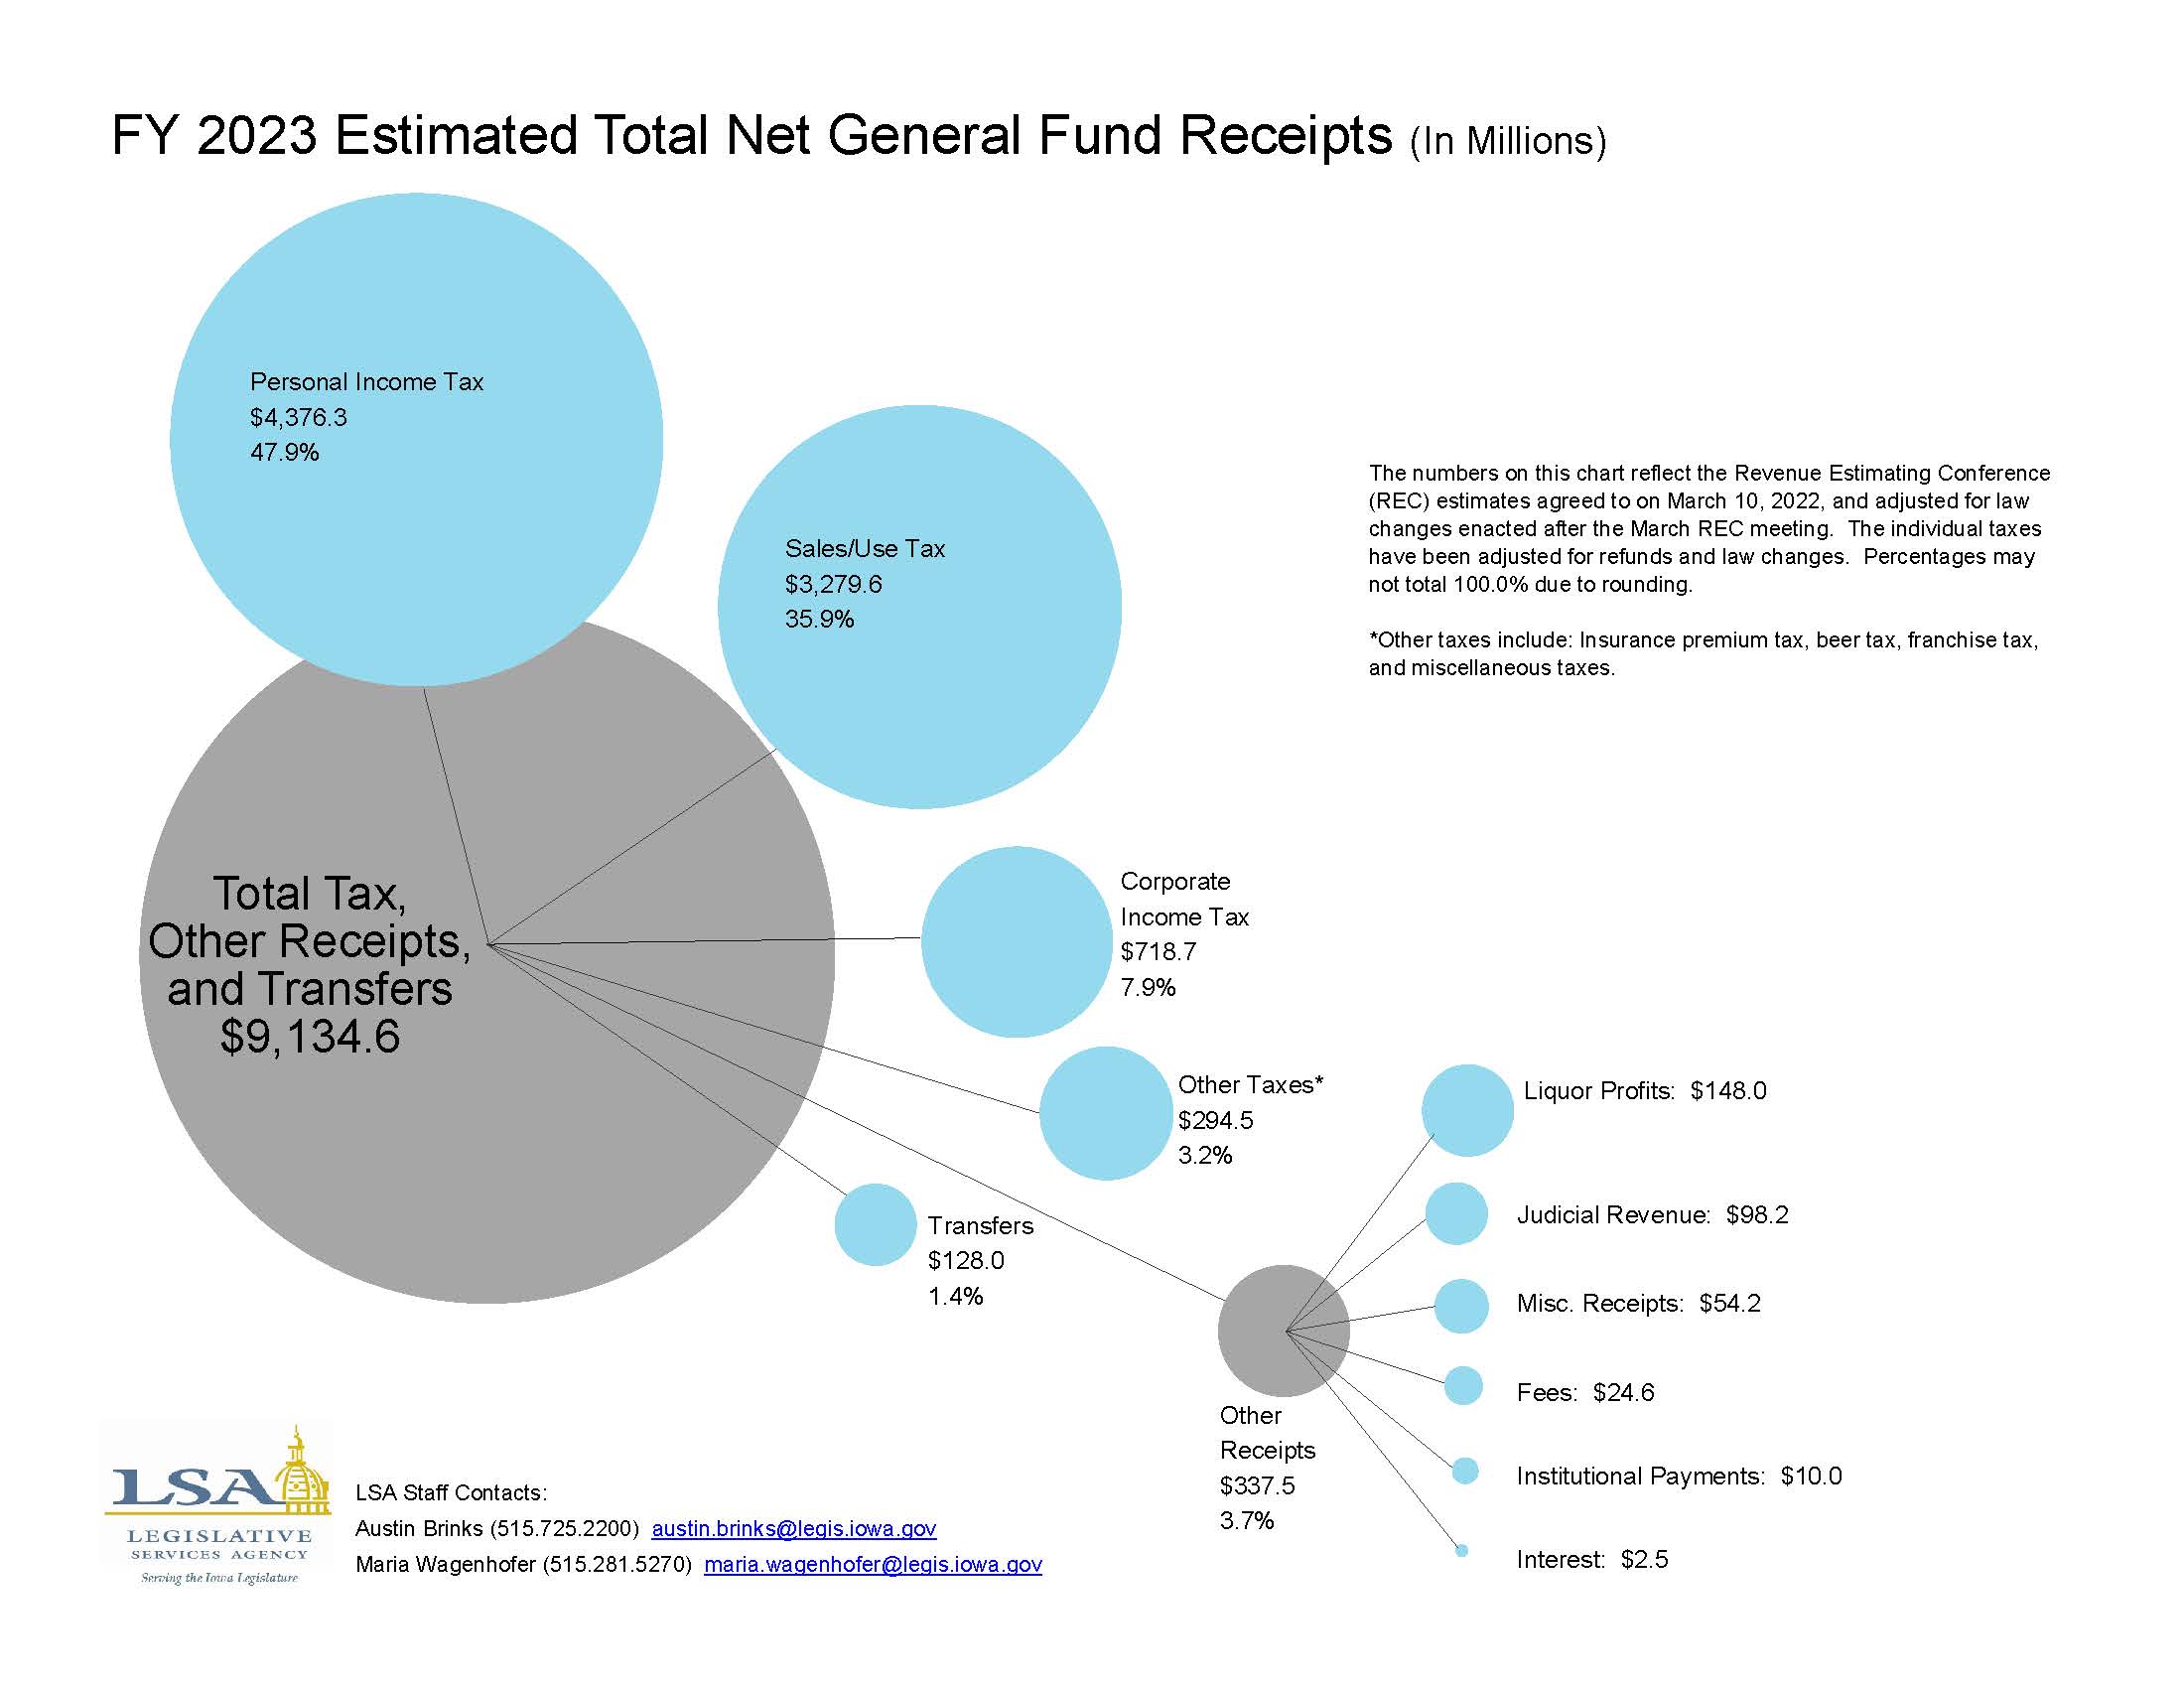
FY2023 Estimated Total Net General Fund Receipts
|
|
|
|
|
| 08/15/2022 |
Iowa Insights |
Percentage of Families in Poverty by County and State — 2016-2020
|
|
|
|
|
| 08/08/2022 |
Iowa Insights |
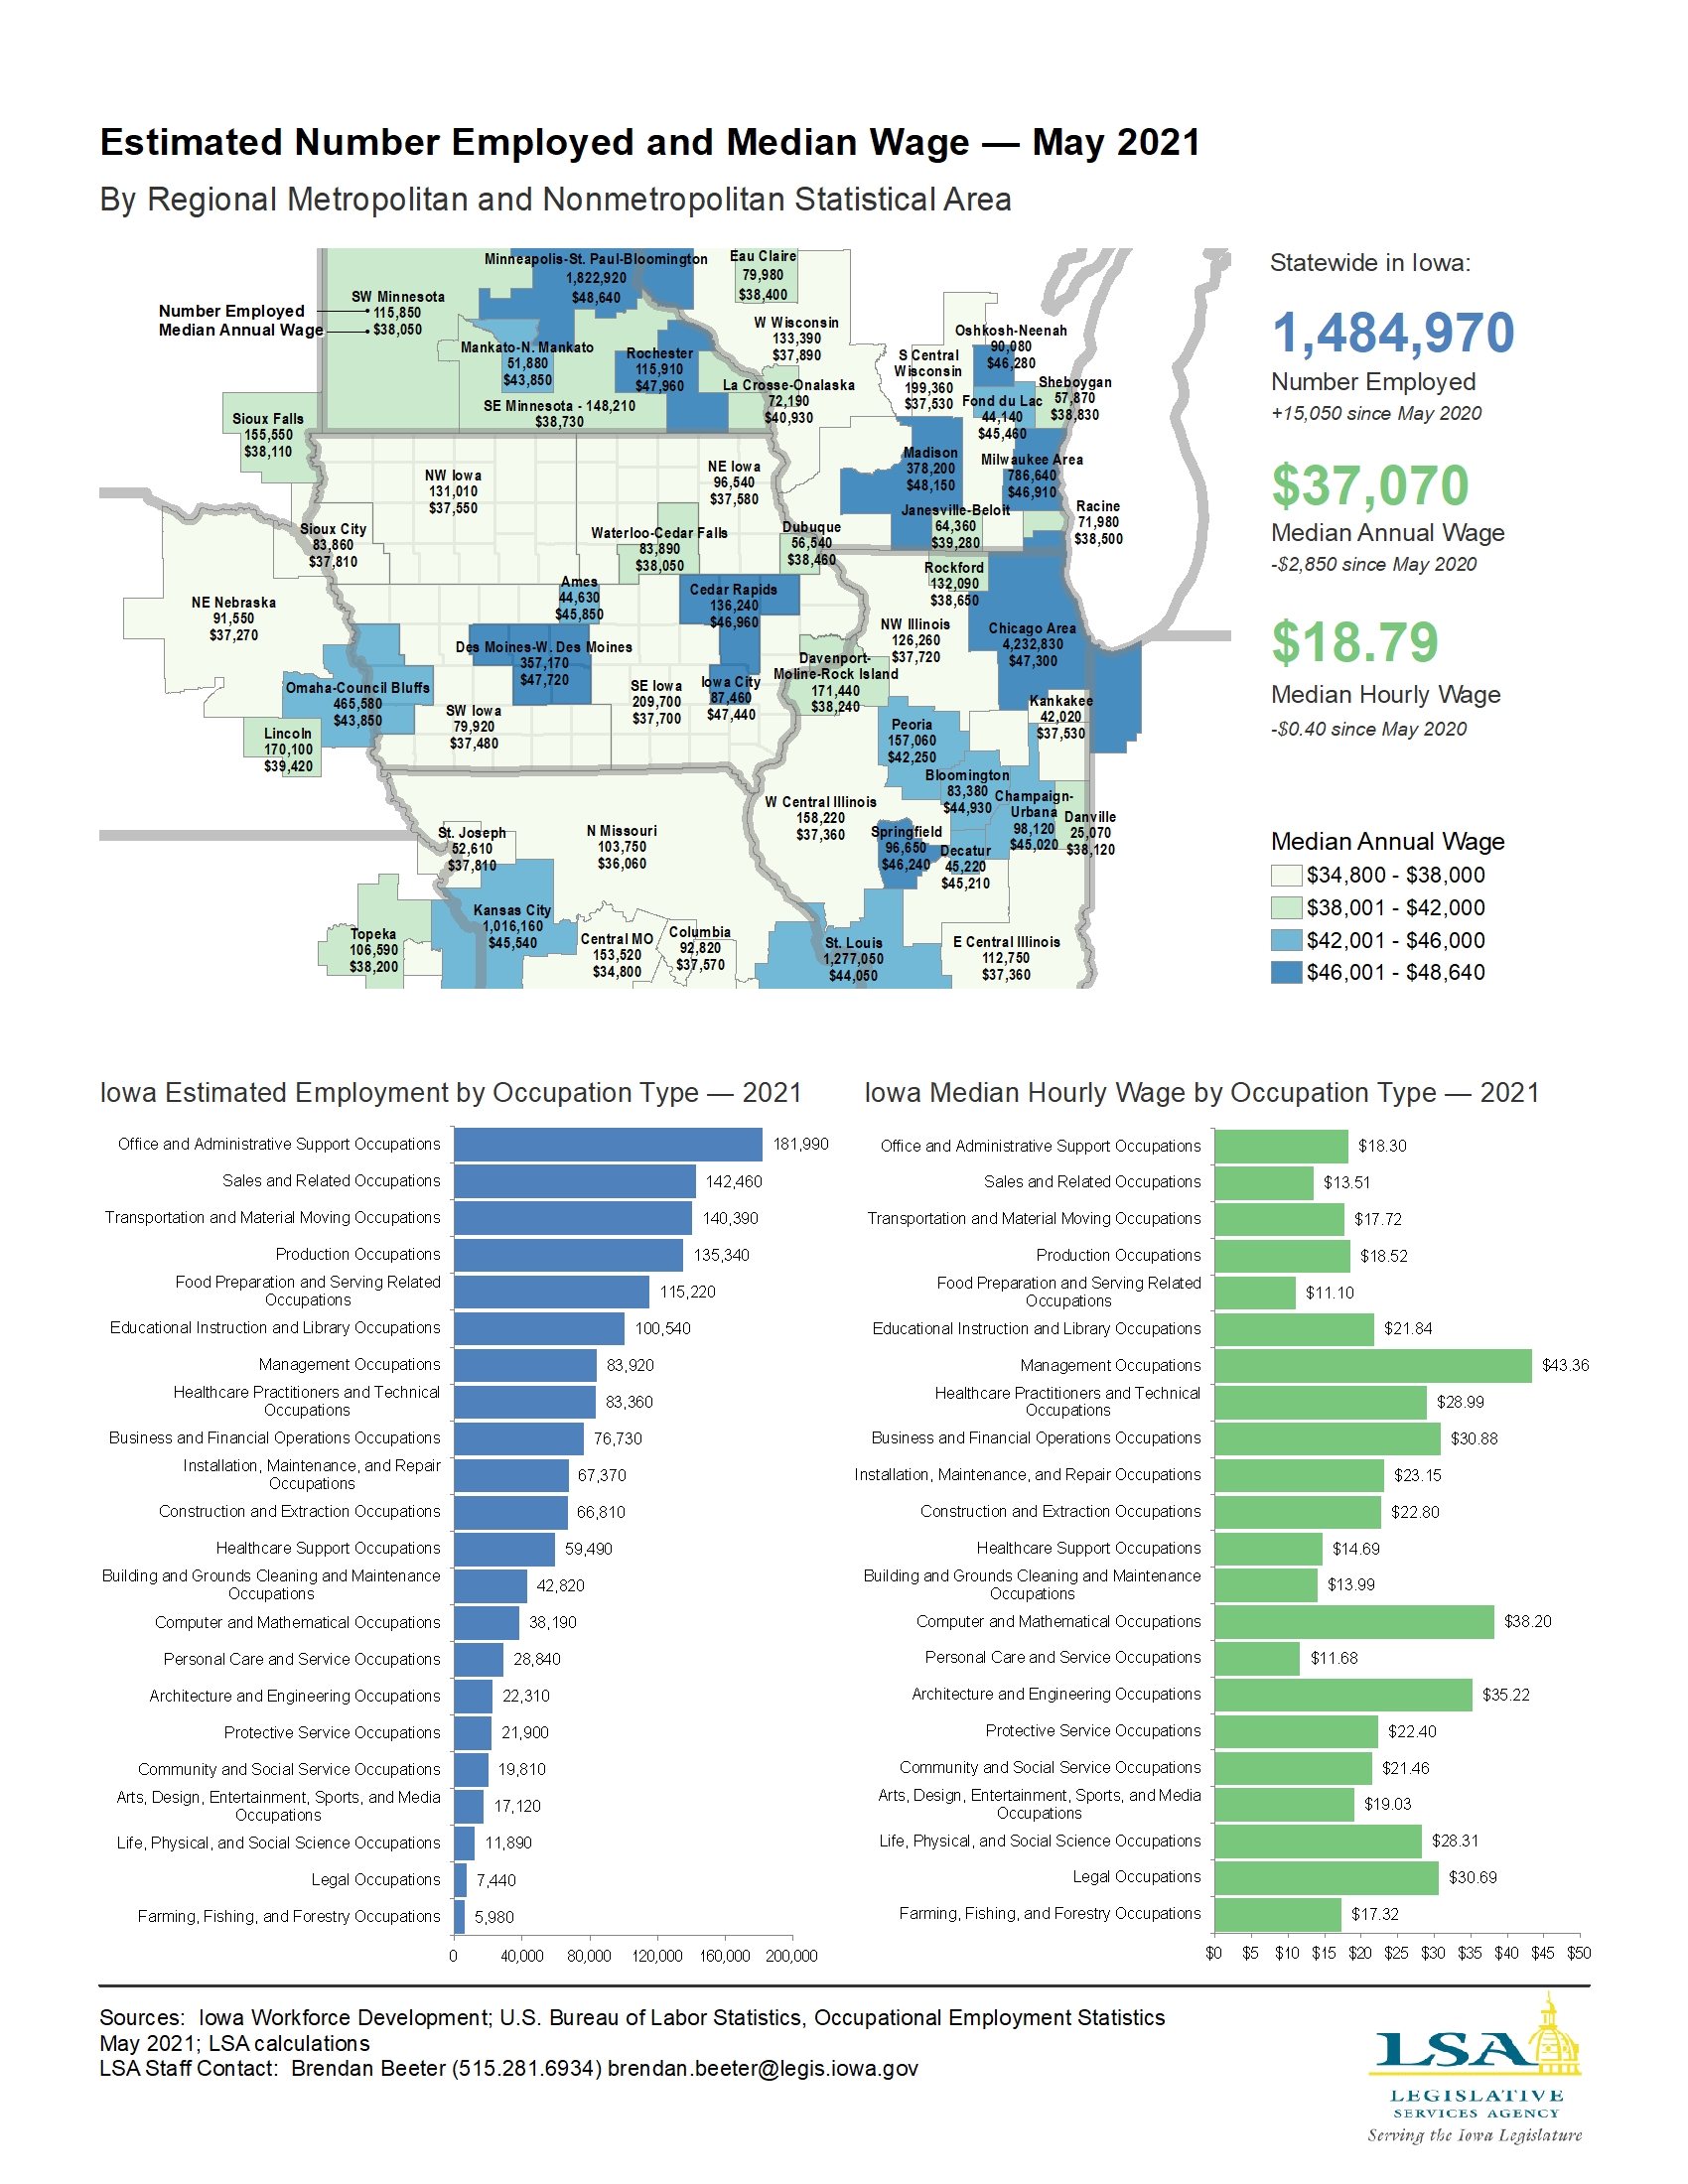
Estimated Number Employed and Median Wage — May 2021
|
|
|
|
|
| 08/01/2022 |
Iowa Insights |
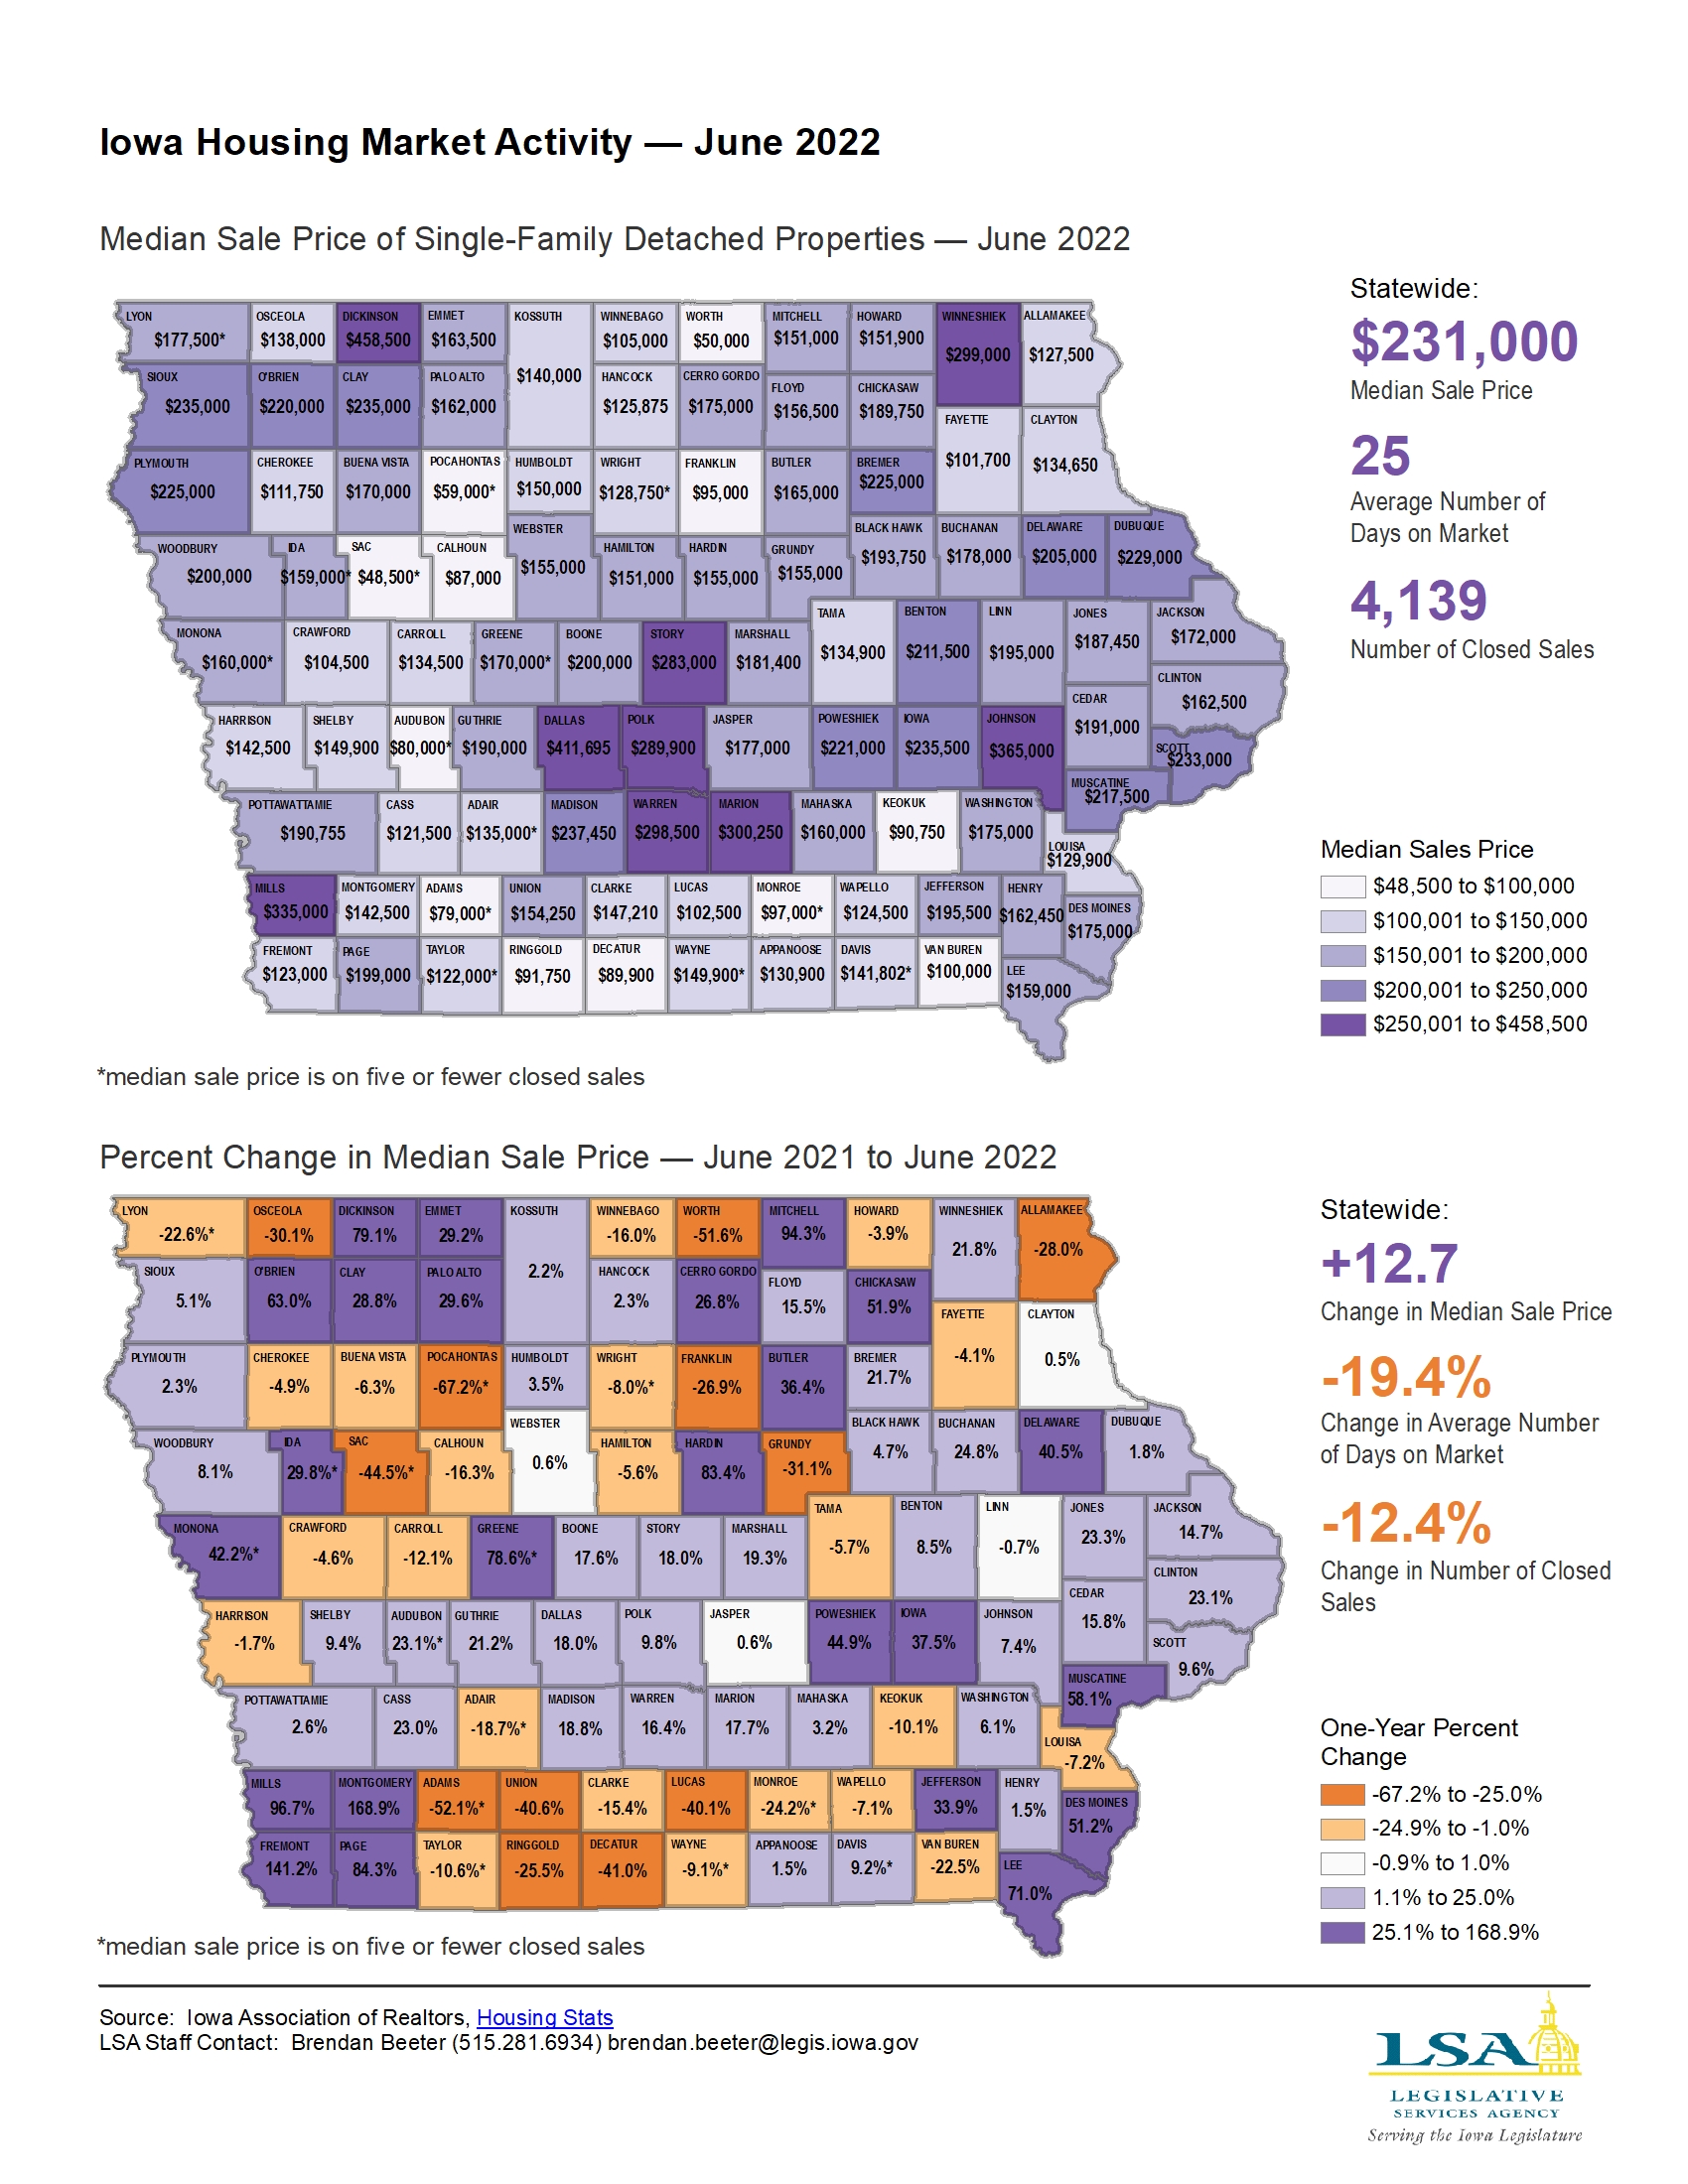
Iowa Housing Market Activity — June 2022
|
|
|
|
|
| 07/25/2022 |
Iowa Insights |
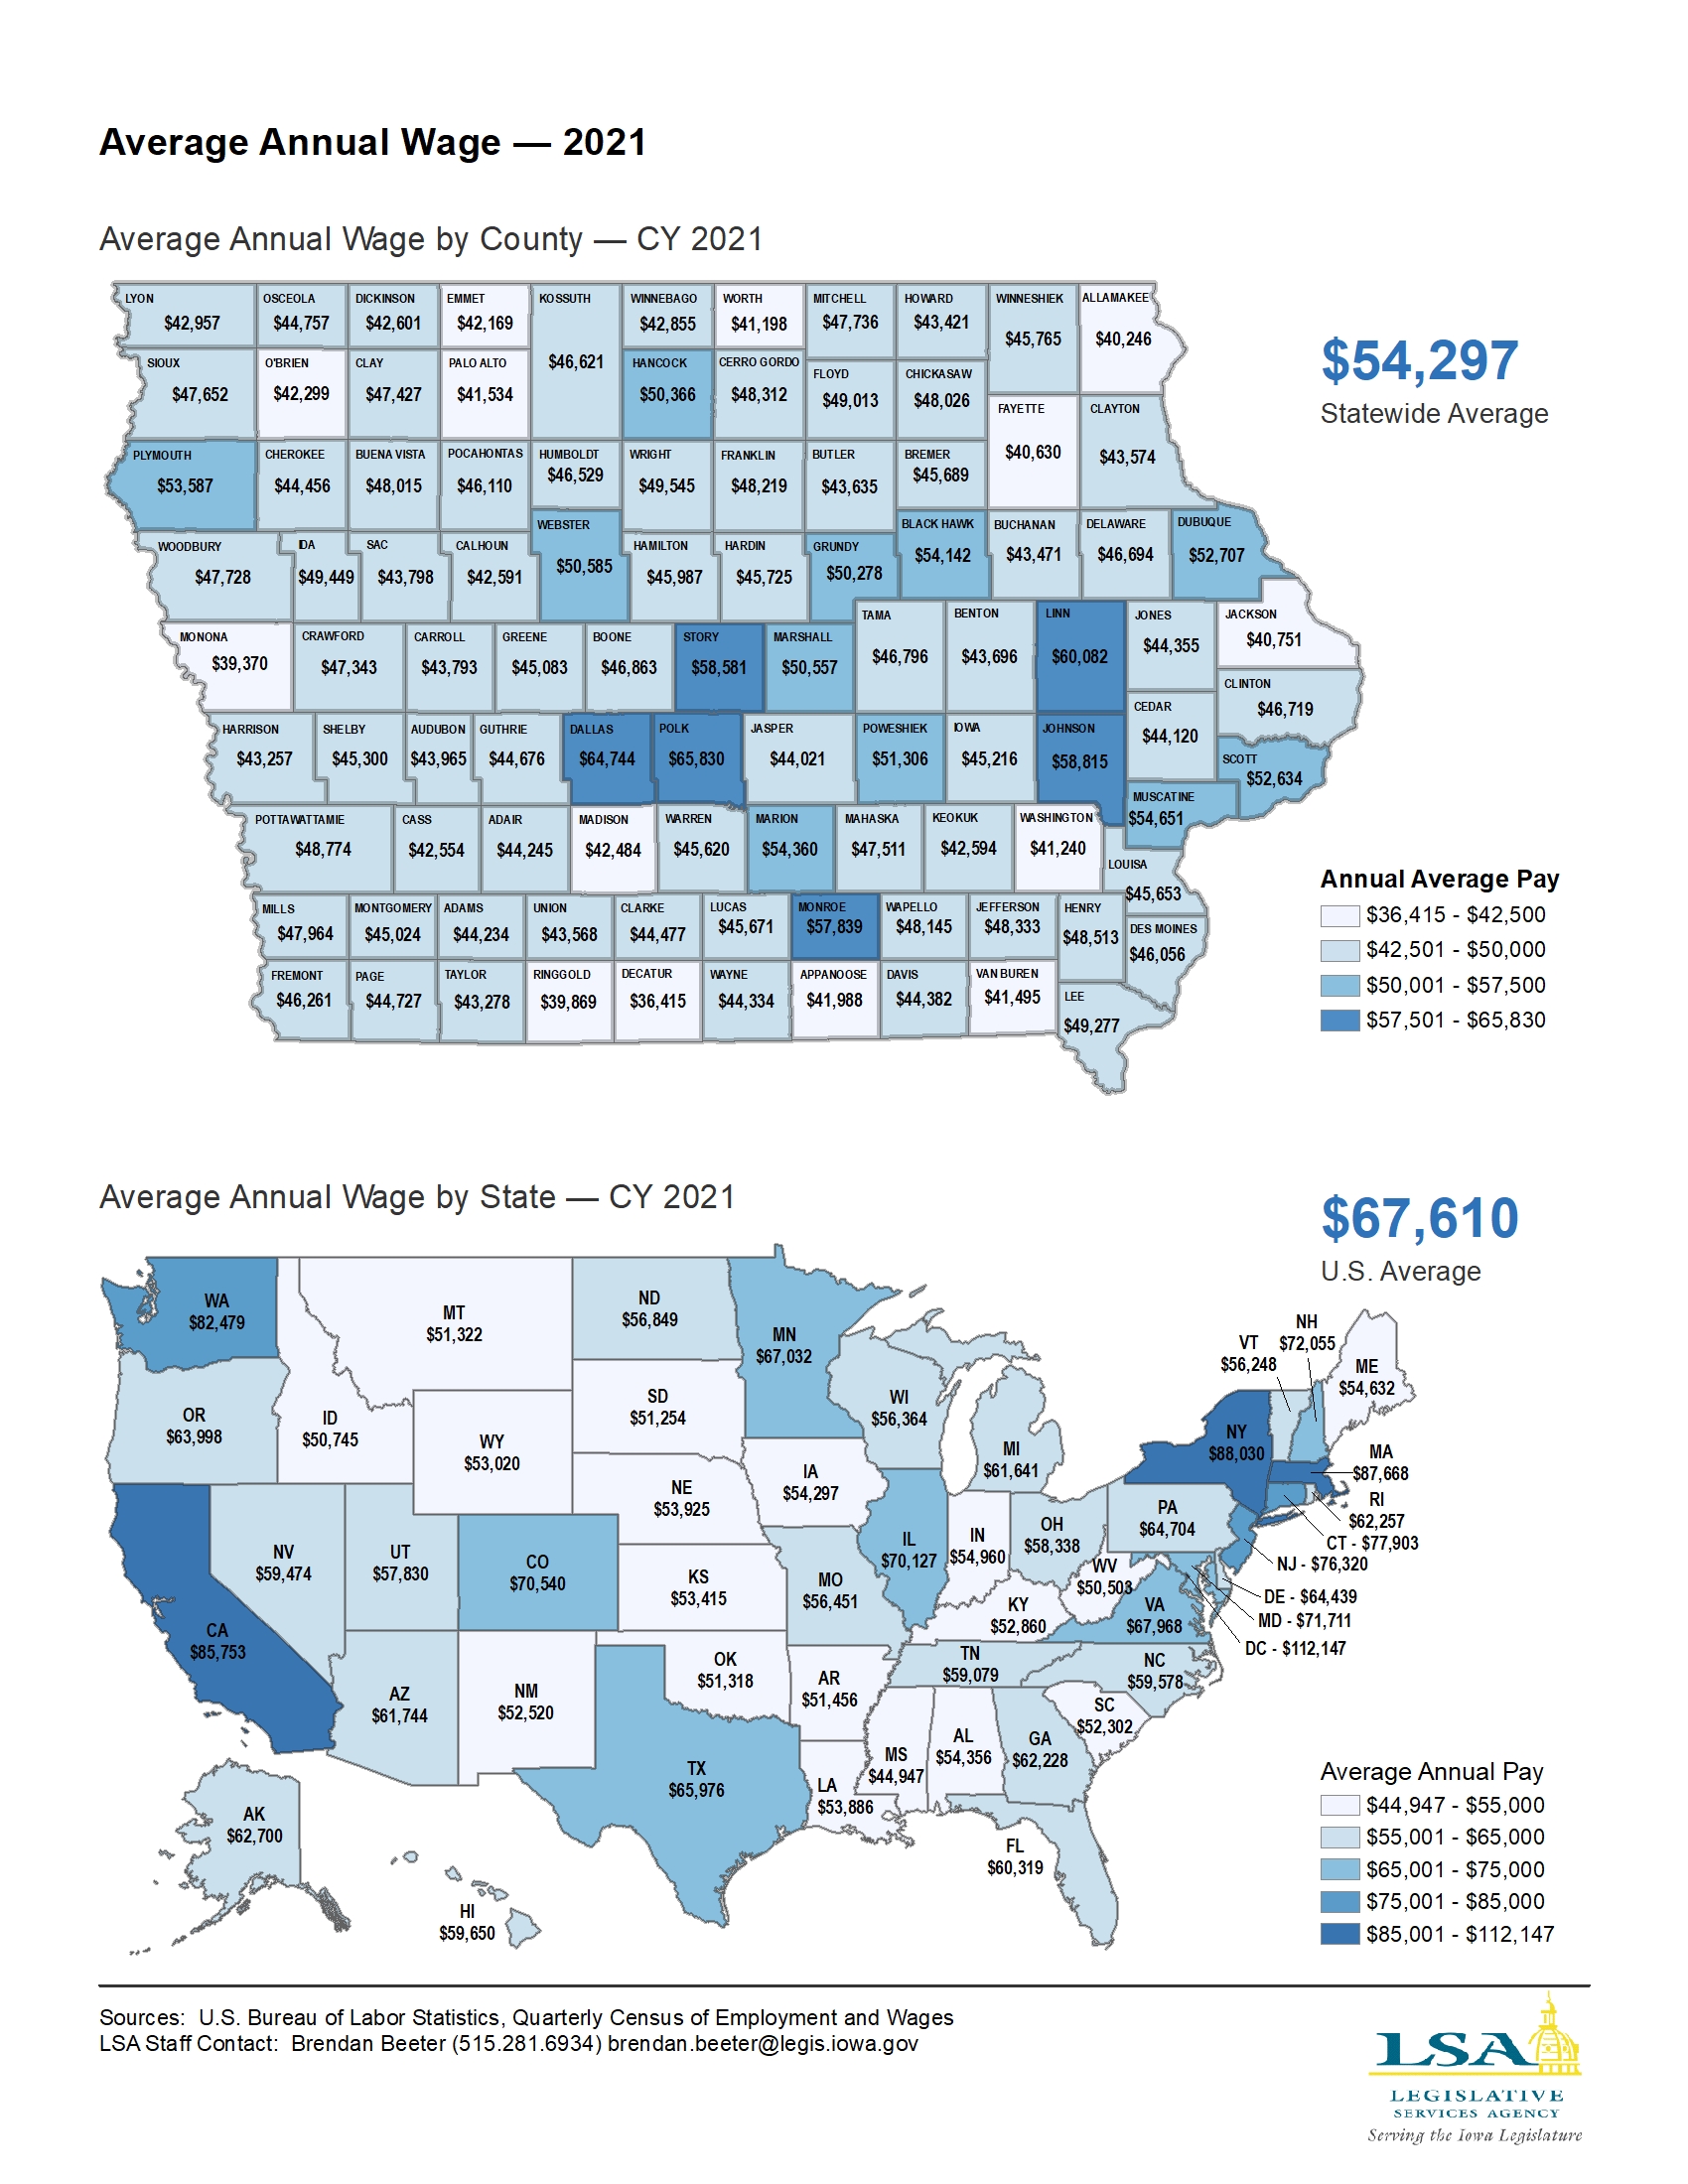
Average Annual Wage — 2021
|
|
|
|
|
| 07/18/2022 |
Iowa Insights |
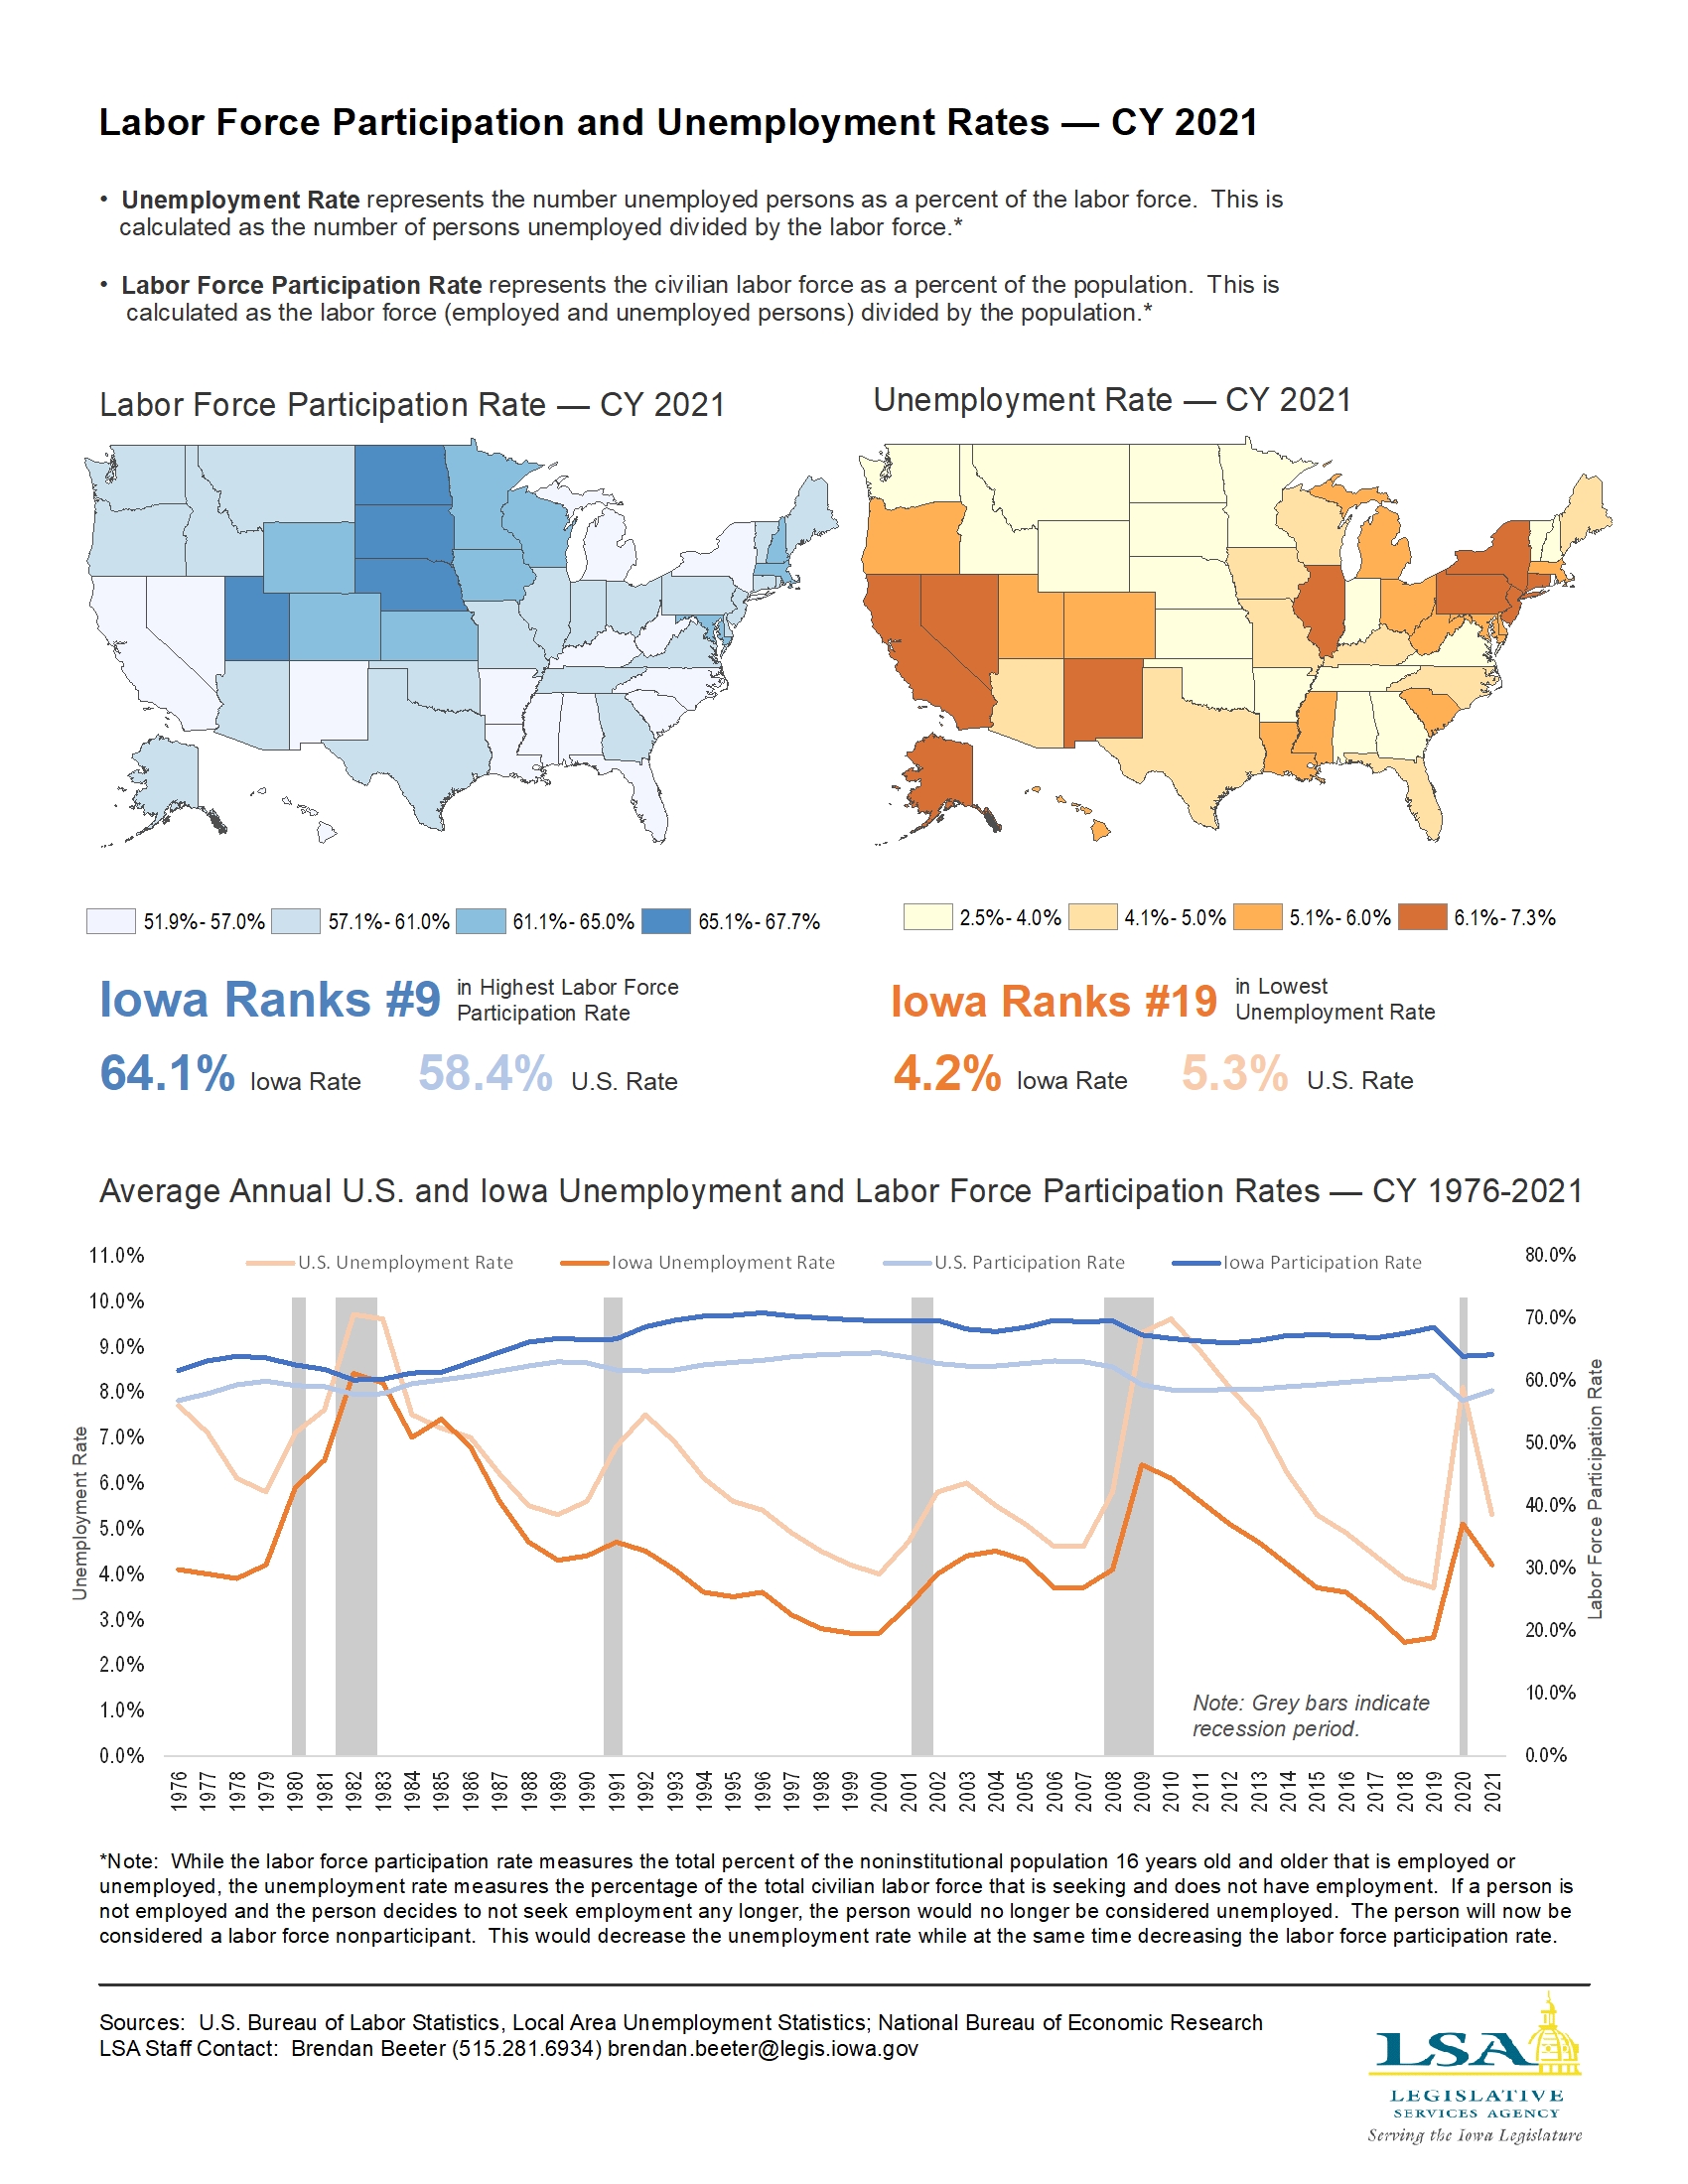
Labor Force Participation and Unemployment Rates — CY 2021
|
|
|
|
|
| 07/11/2022 |
Iowa Insights |
Empower Rural Iowa — FY 2022

|
|
|
|
|
| 07/05/2022 |
Iowa Insights |
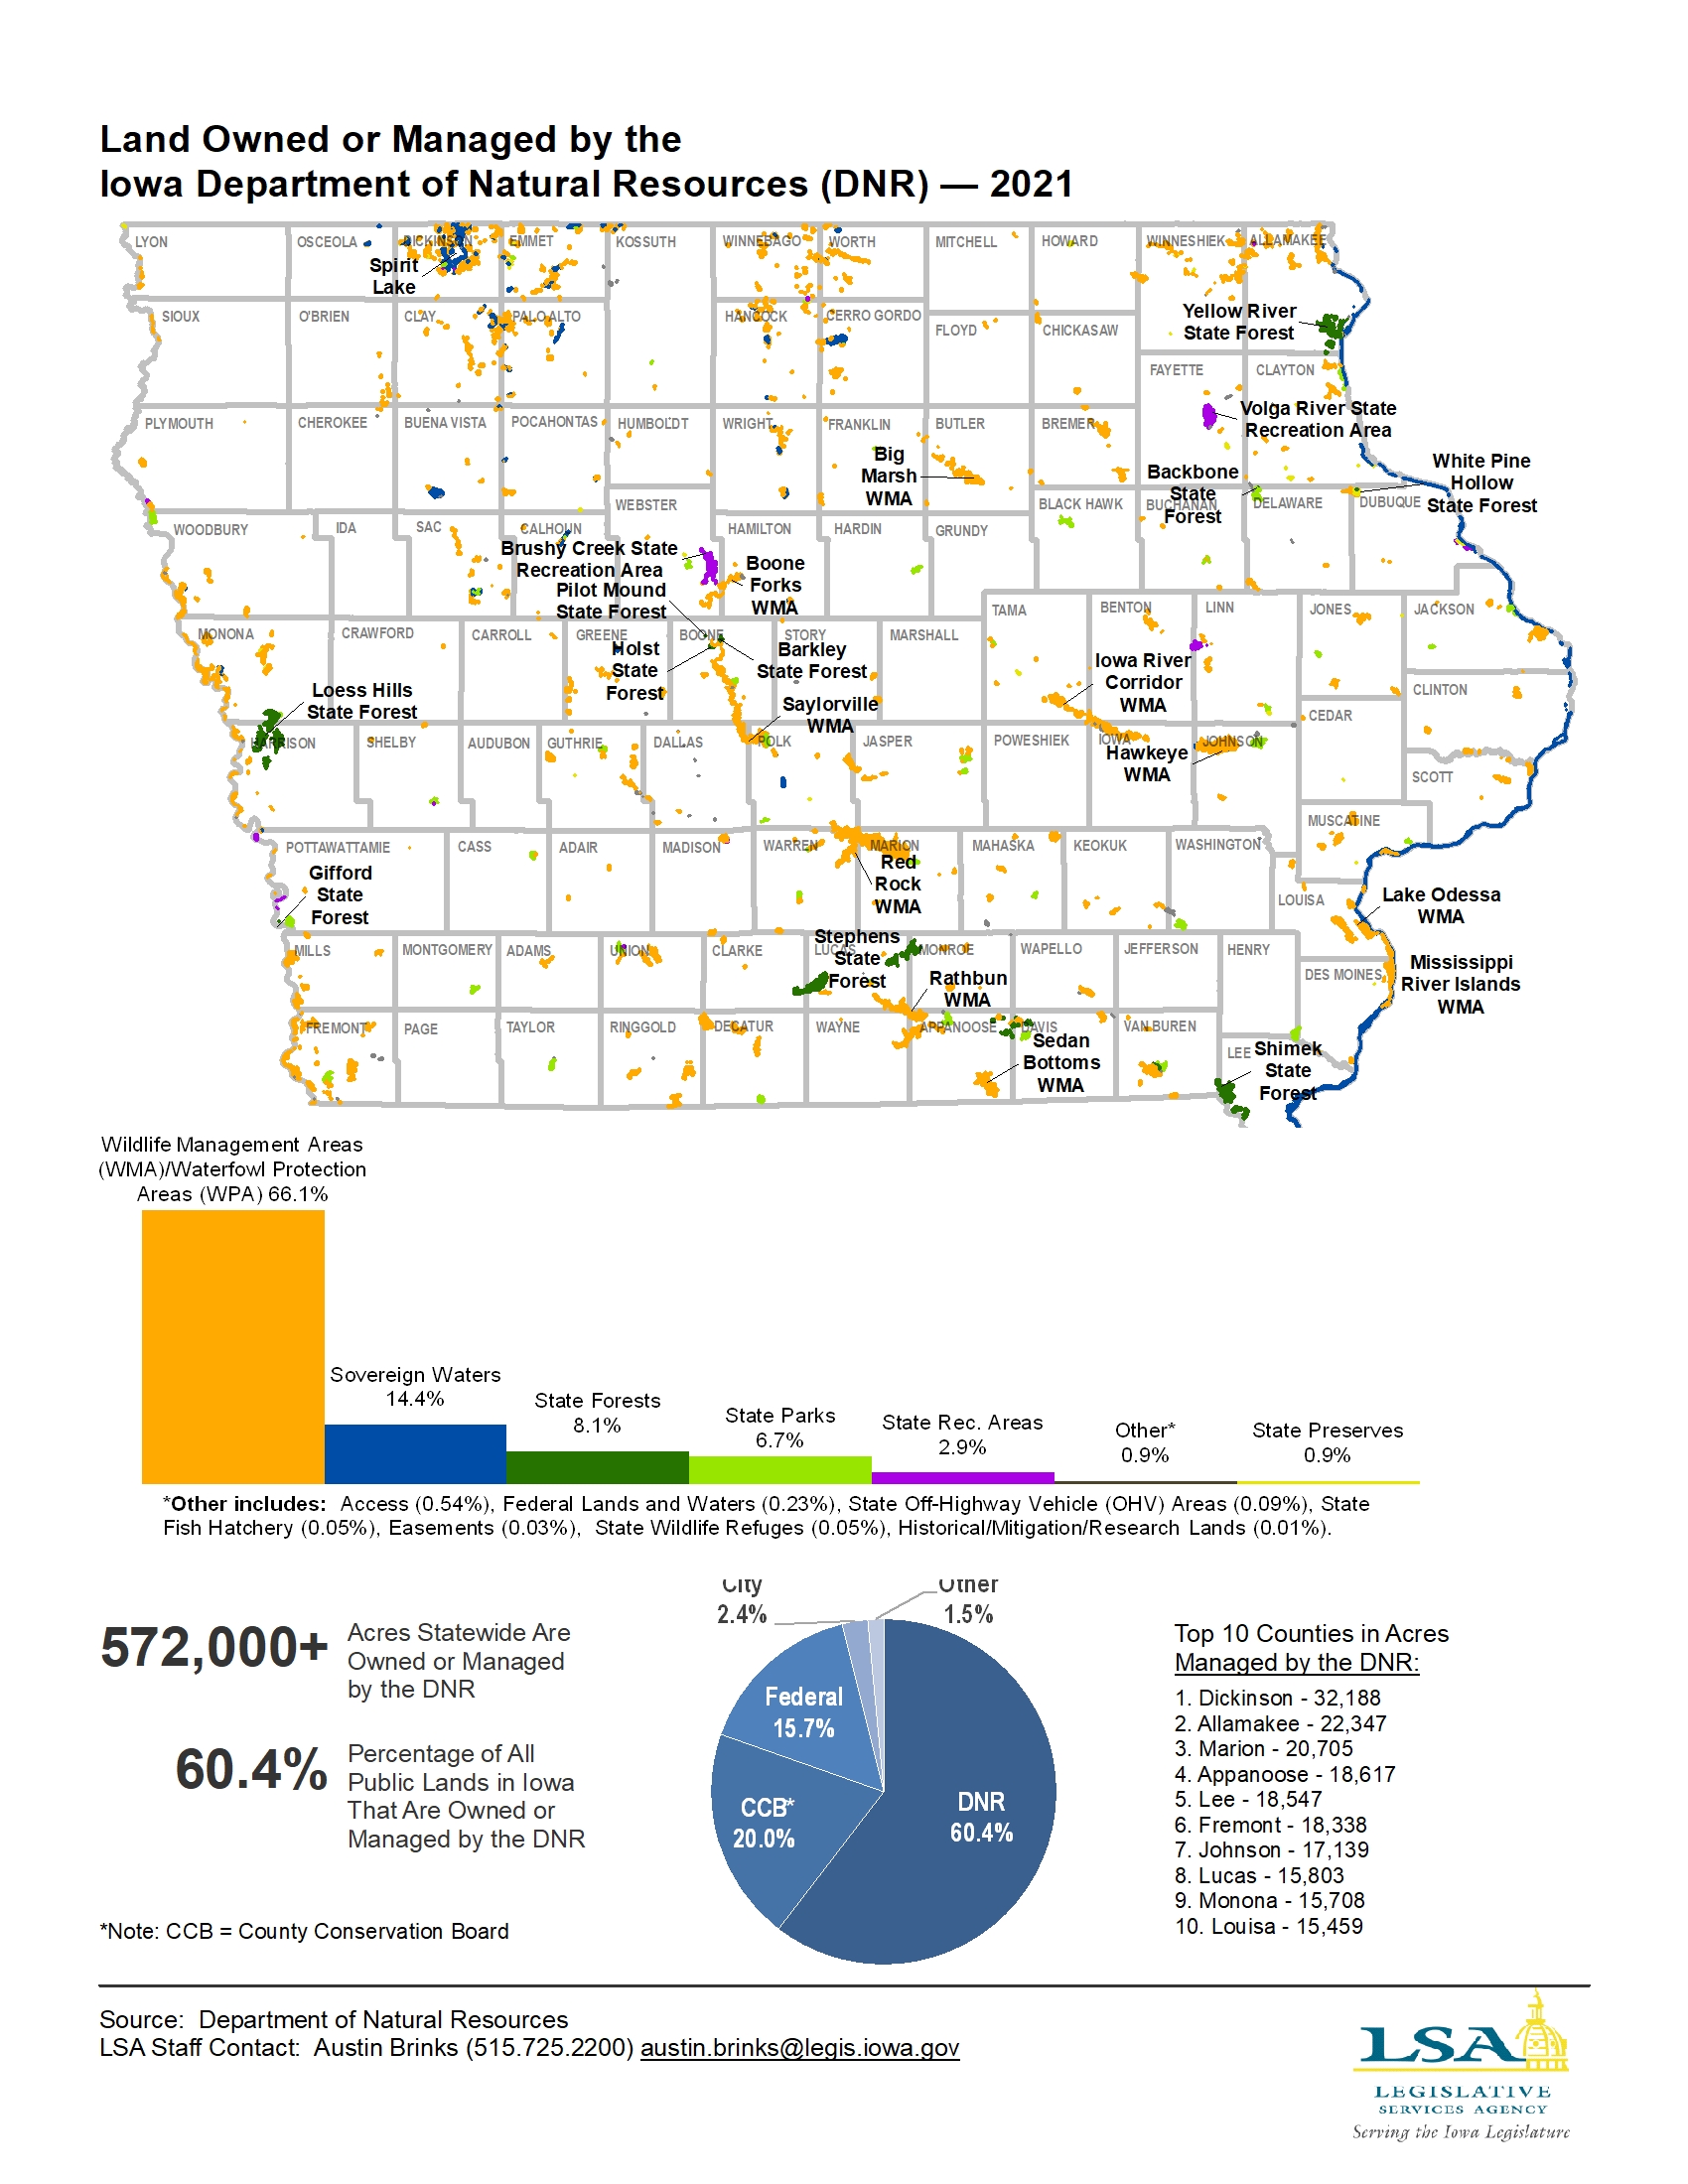
Land Owned or Managed by the Iowa Department of Natural Resources — 2021
|
|
|
|
|
| 06/27/2022 |
Iowa Insights |
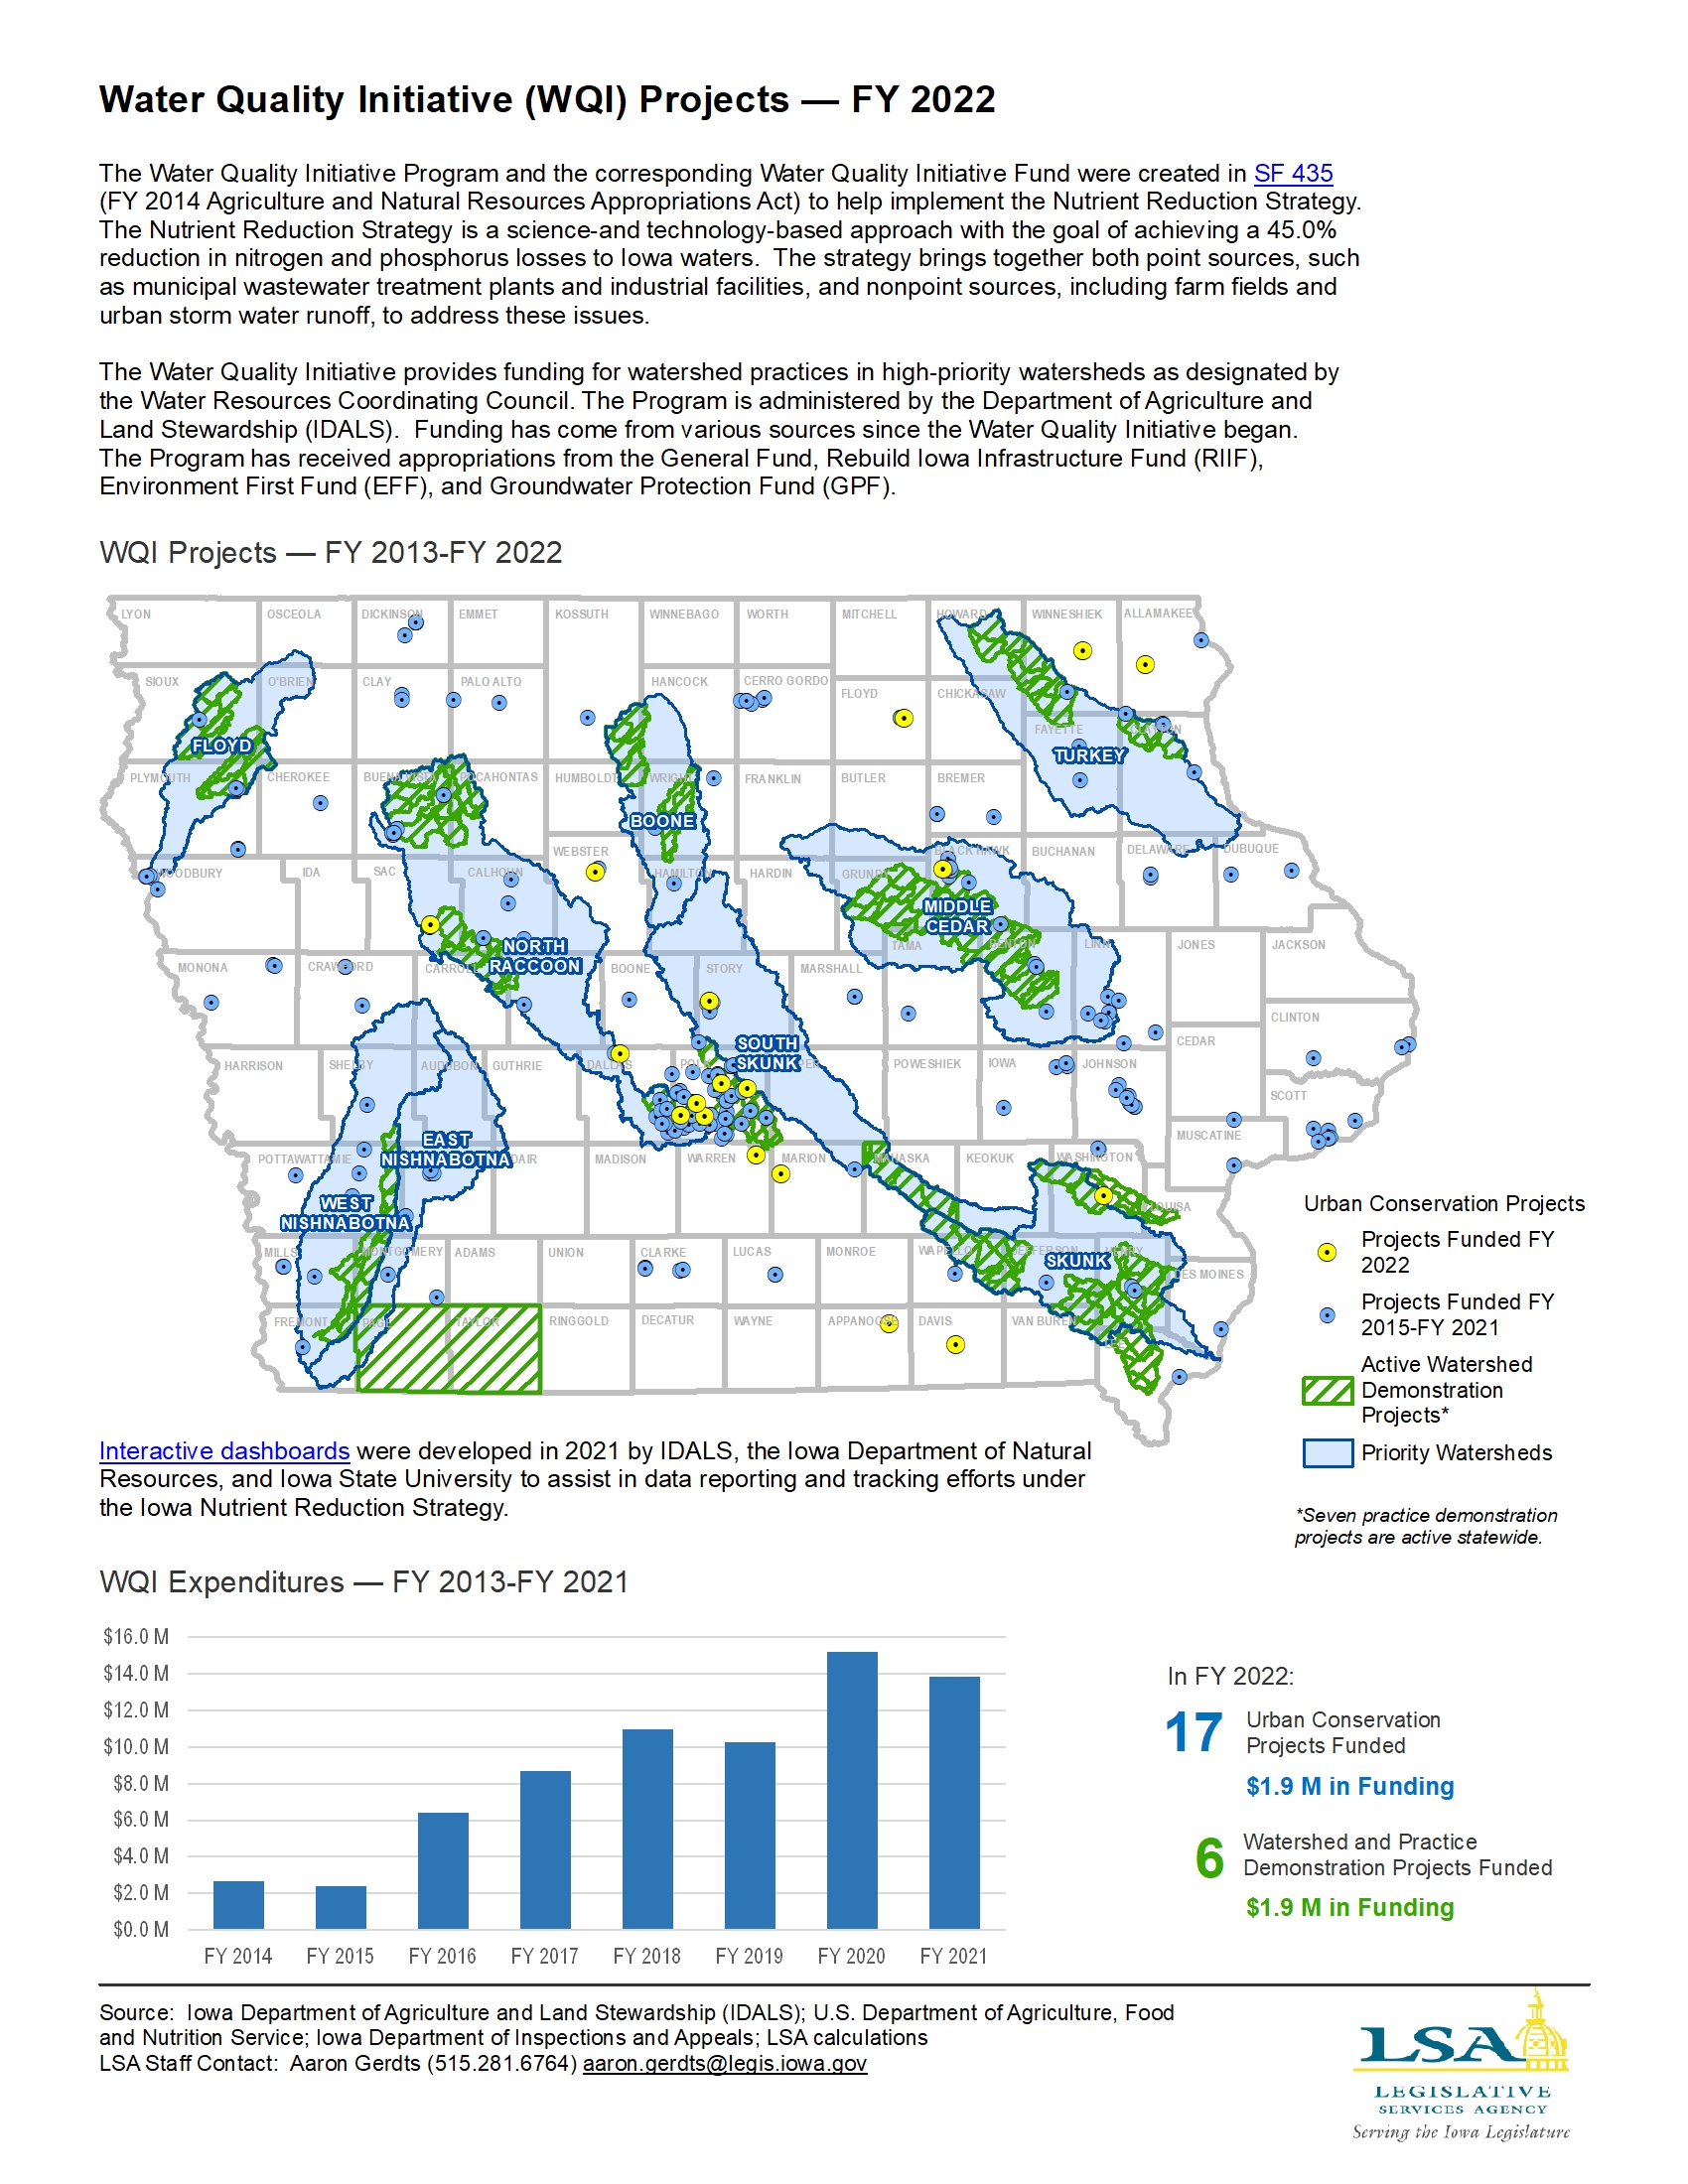
Water Quality Initiative — 2022
|
|
|
|
|
| 06/20/2022 |
Iowa Insights |
Farmer's Markets and Farm Stands — 2022

|
|
|
|
|
| 06/13/2022 |
Iowa Insights |
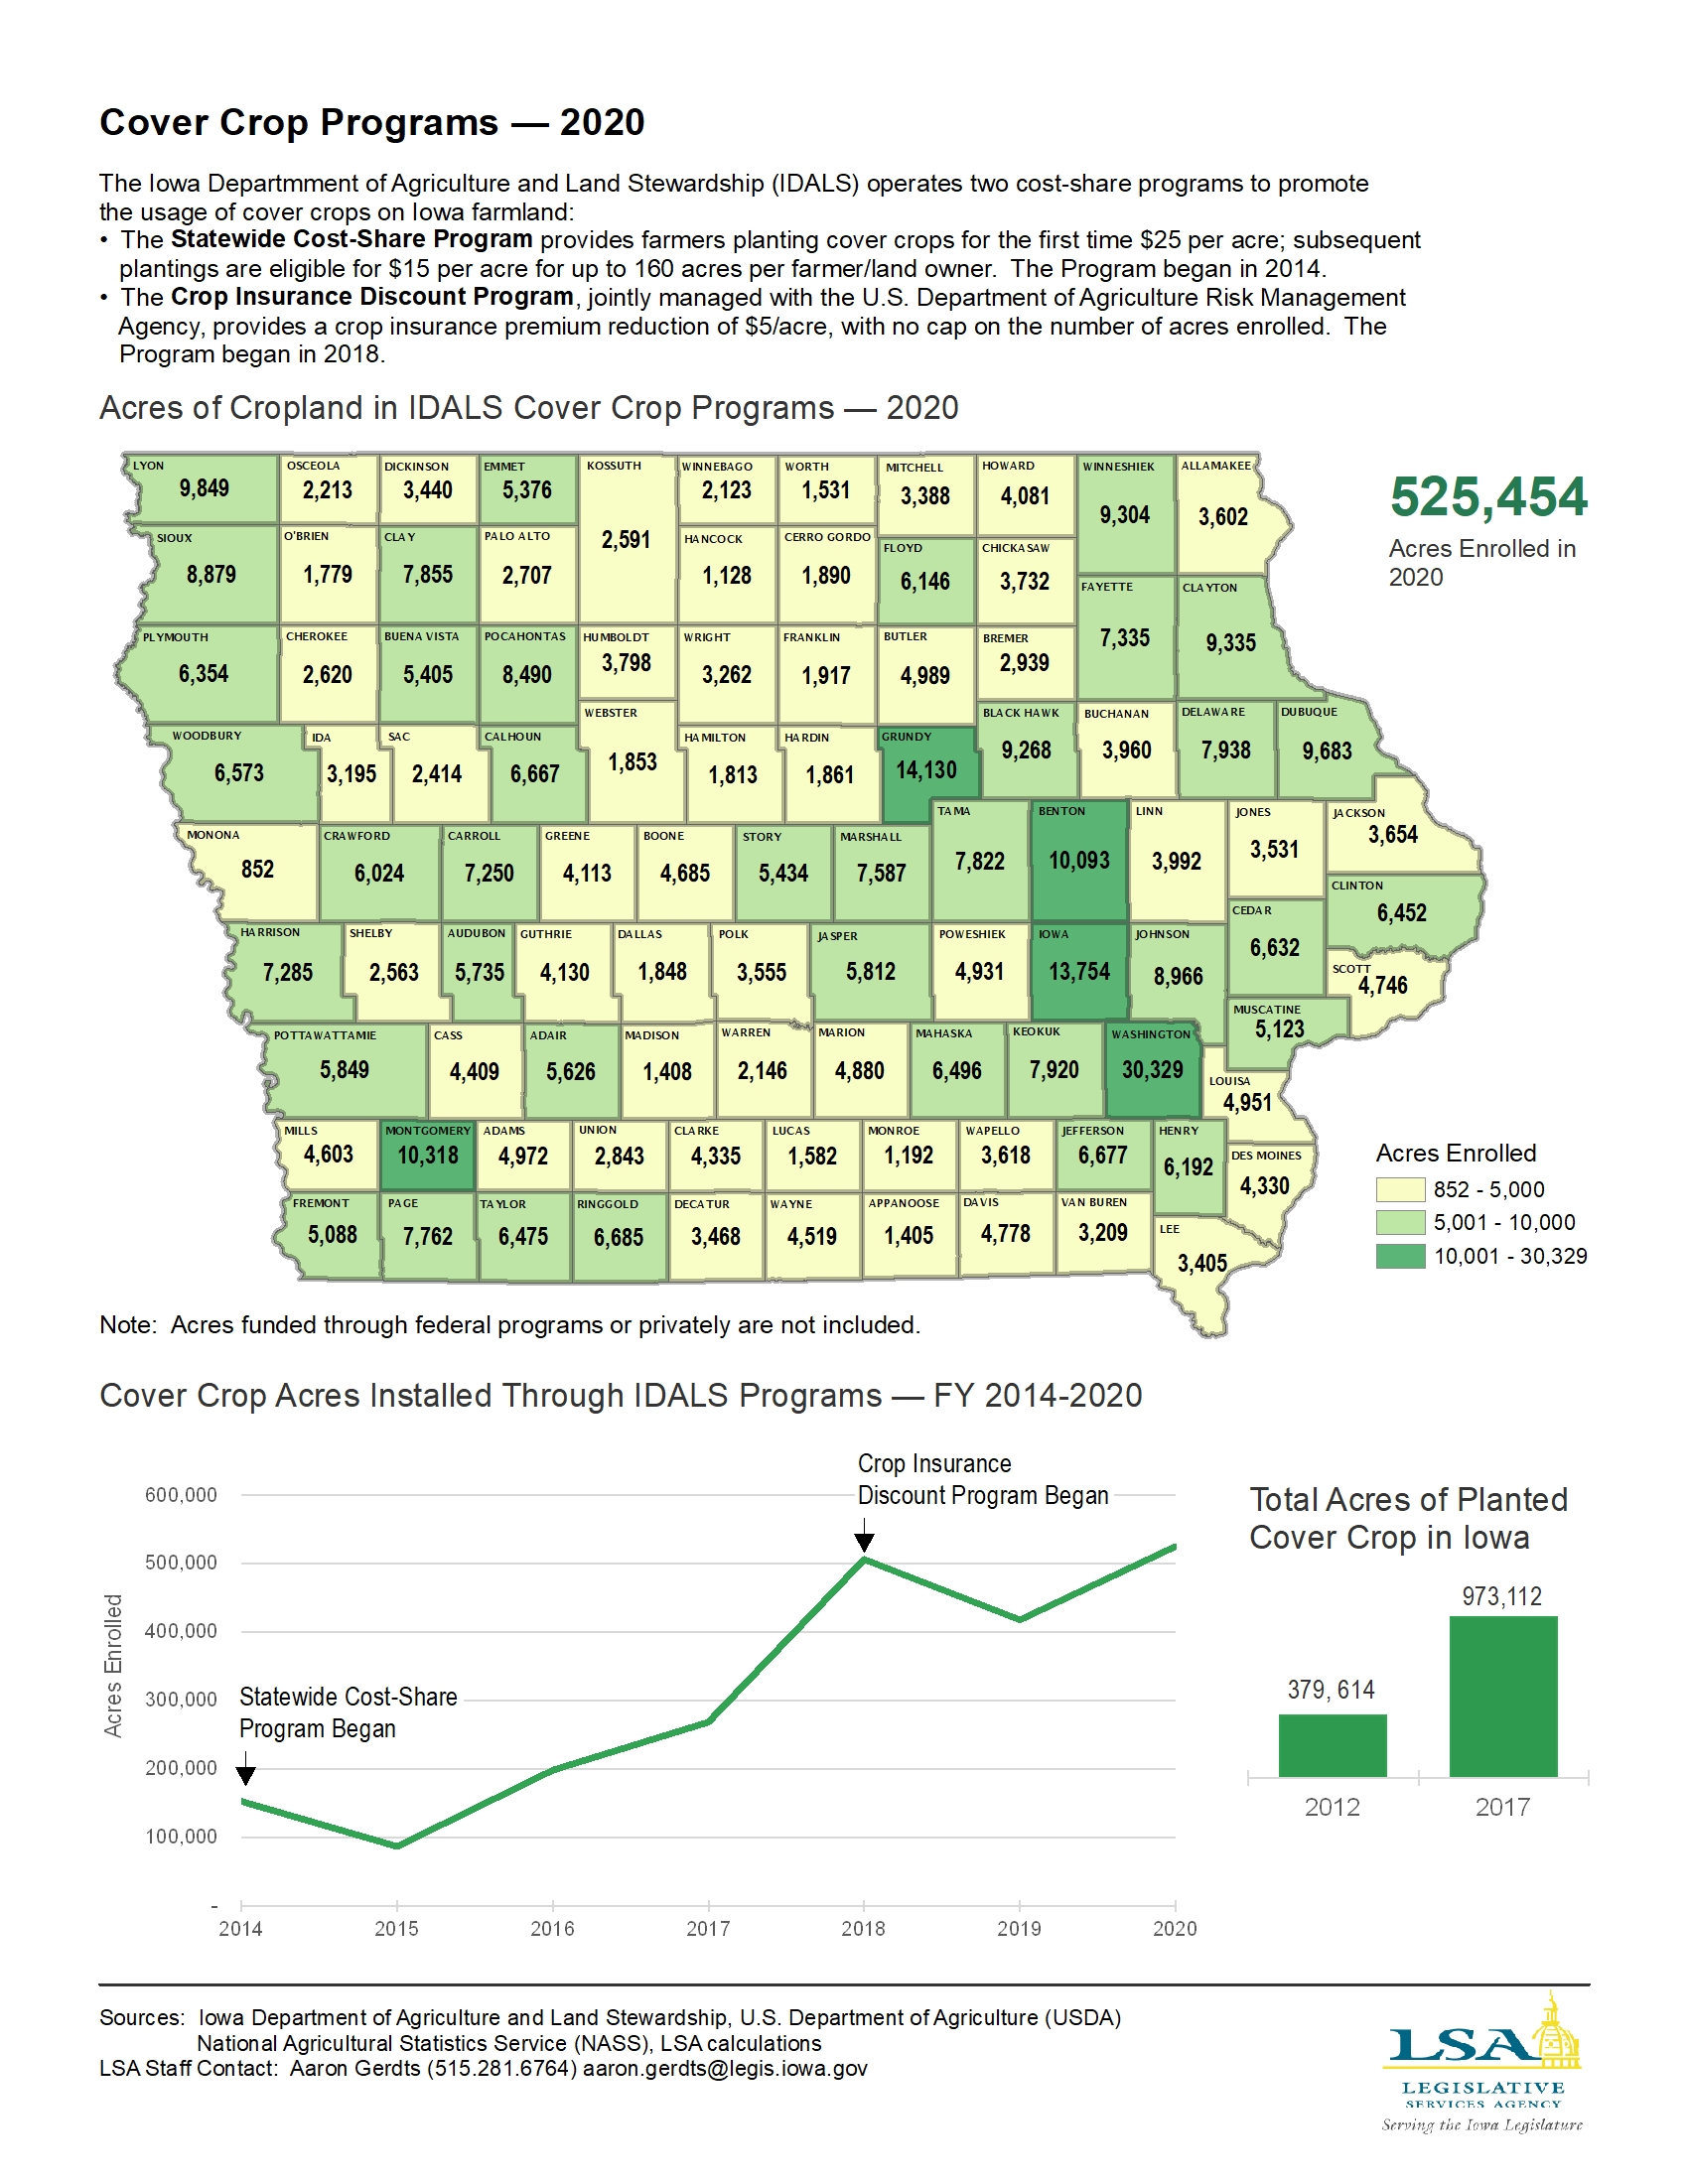
Cover Crop Programs — 2020
|
|
|
|
|
| 06/06/2022 |
Iowa Insights |
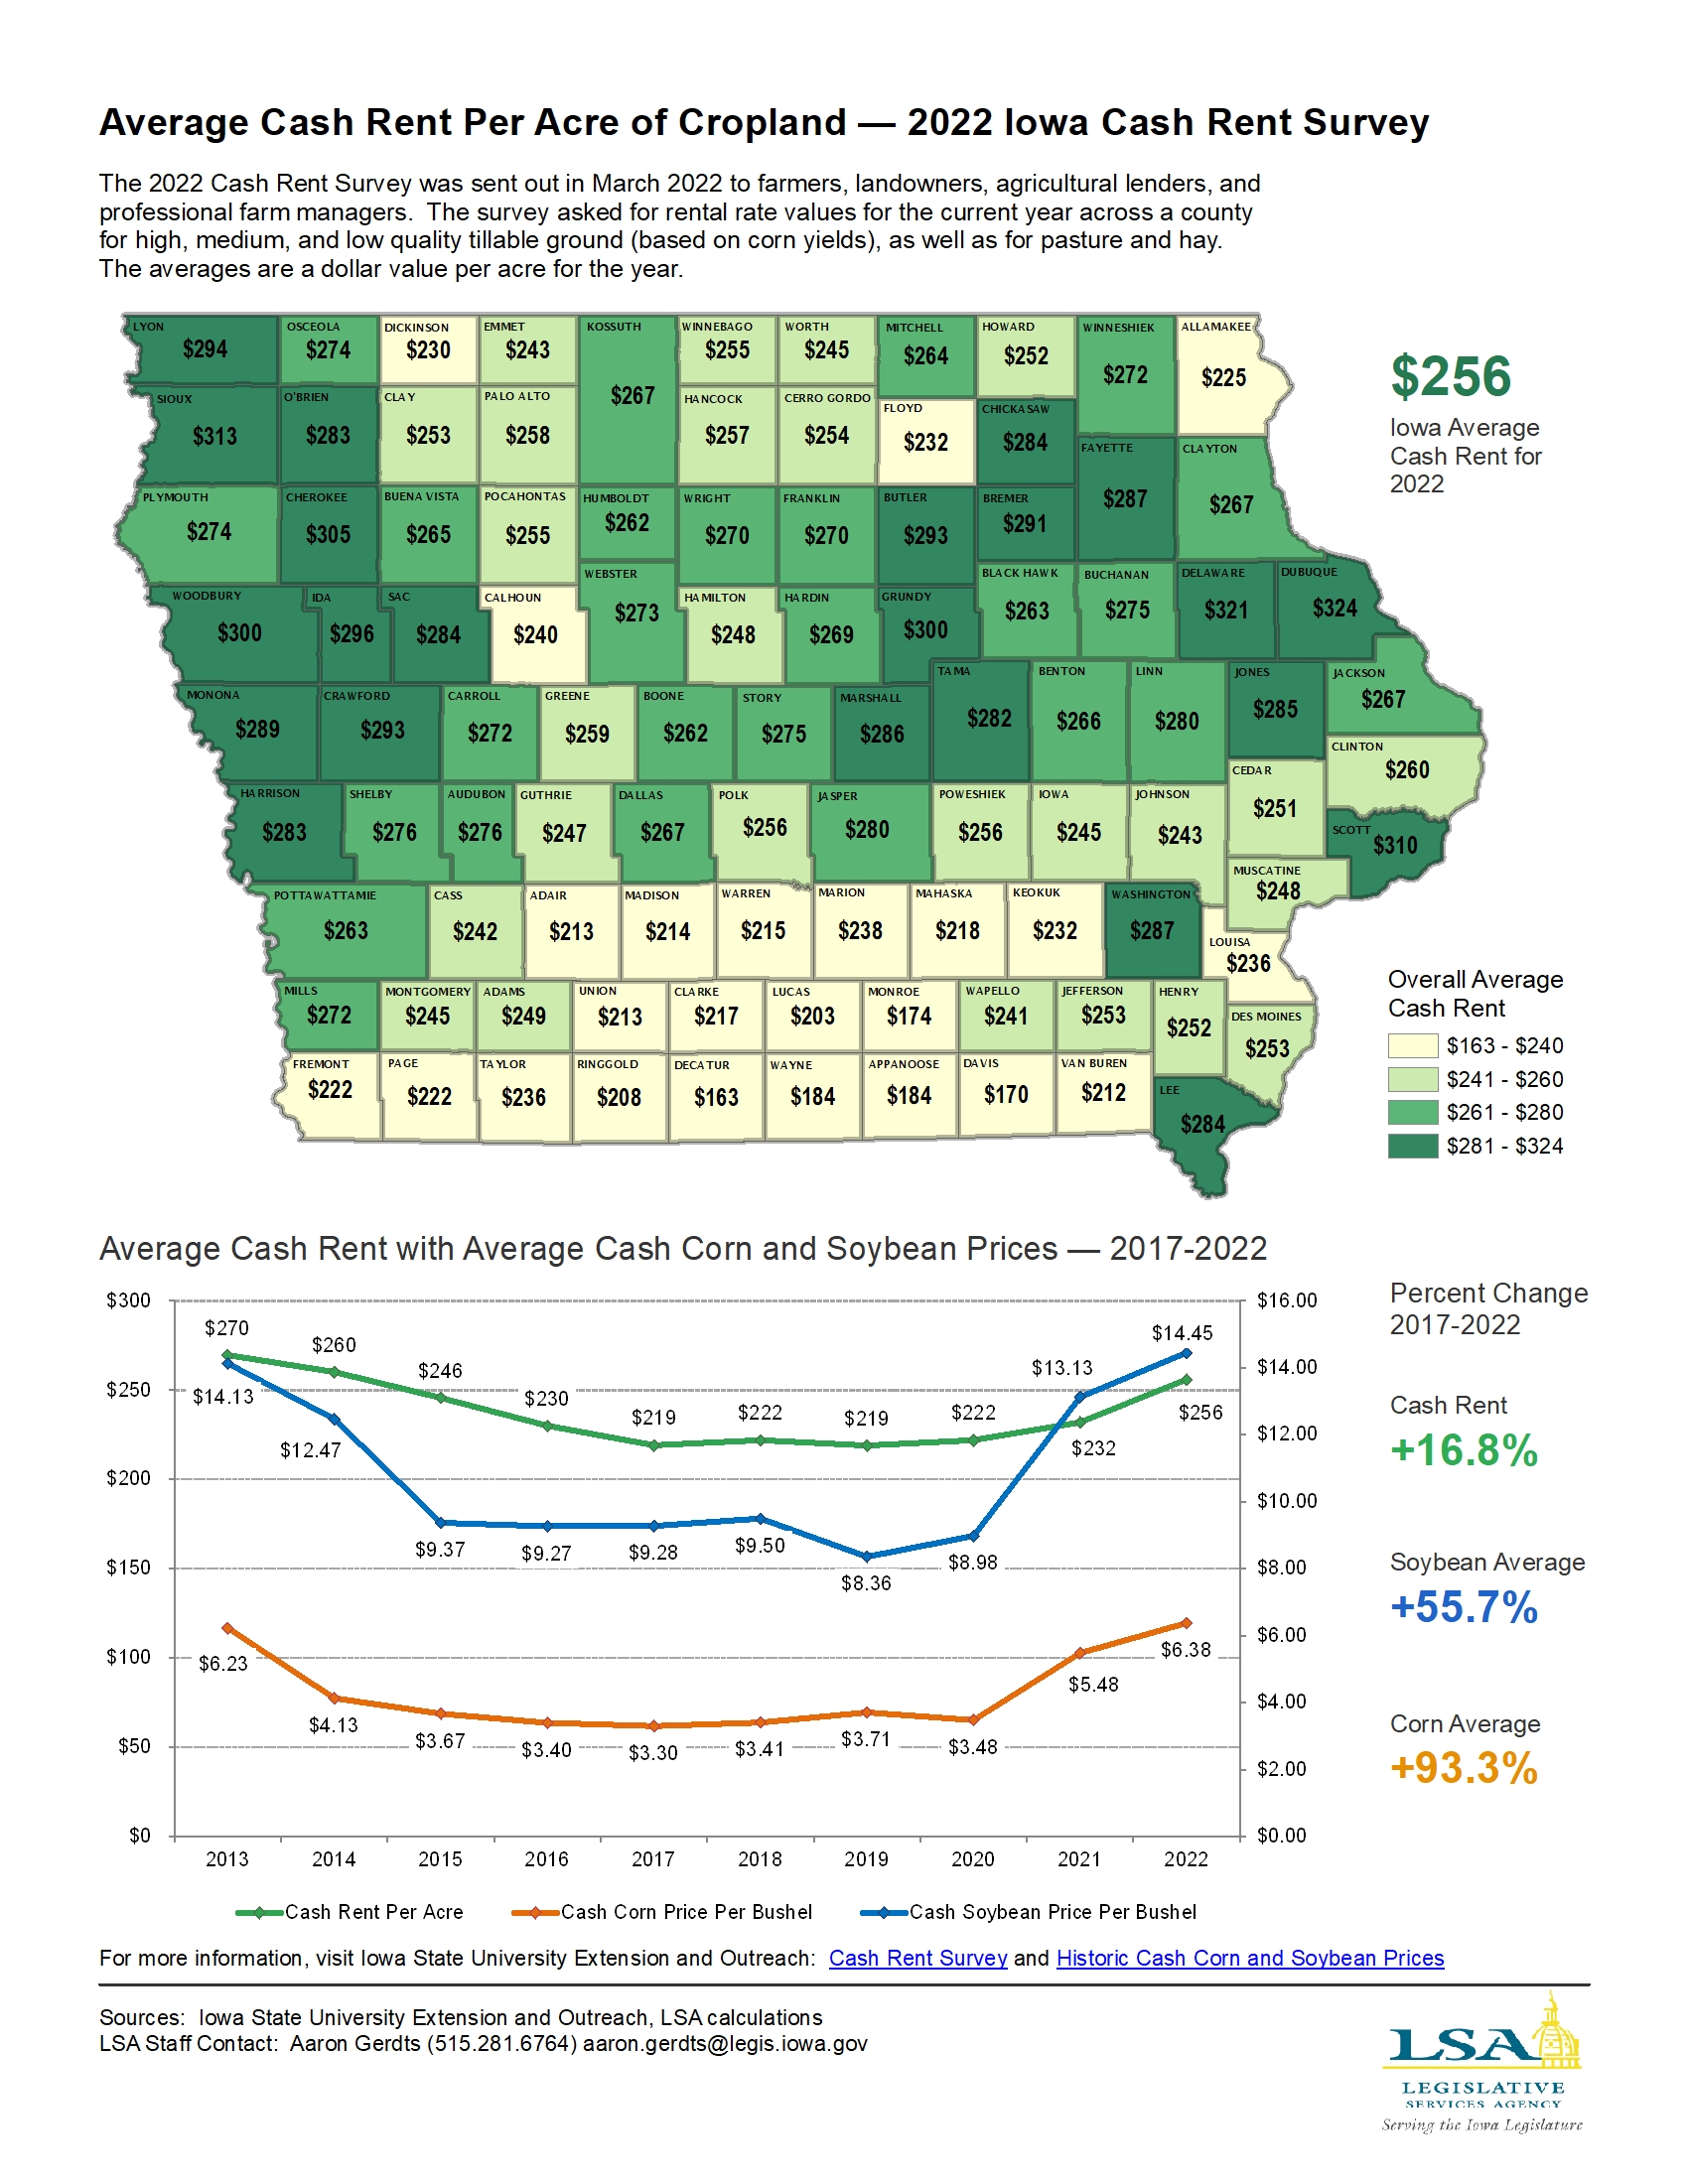
Average Cash Rent Per Acre of Cropland — 2022 Iowa Cash Rent Survey
|
|
|
|
|
| 05/31/2022 |
Iowa Insights |
Veteran Population — FFY 2020
|
|
|
|
|
| 05/16/2022 |
Iowa Insights |
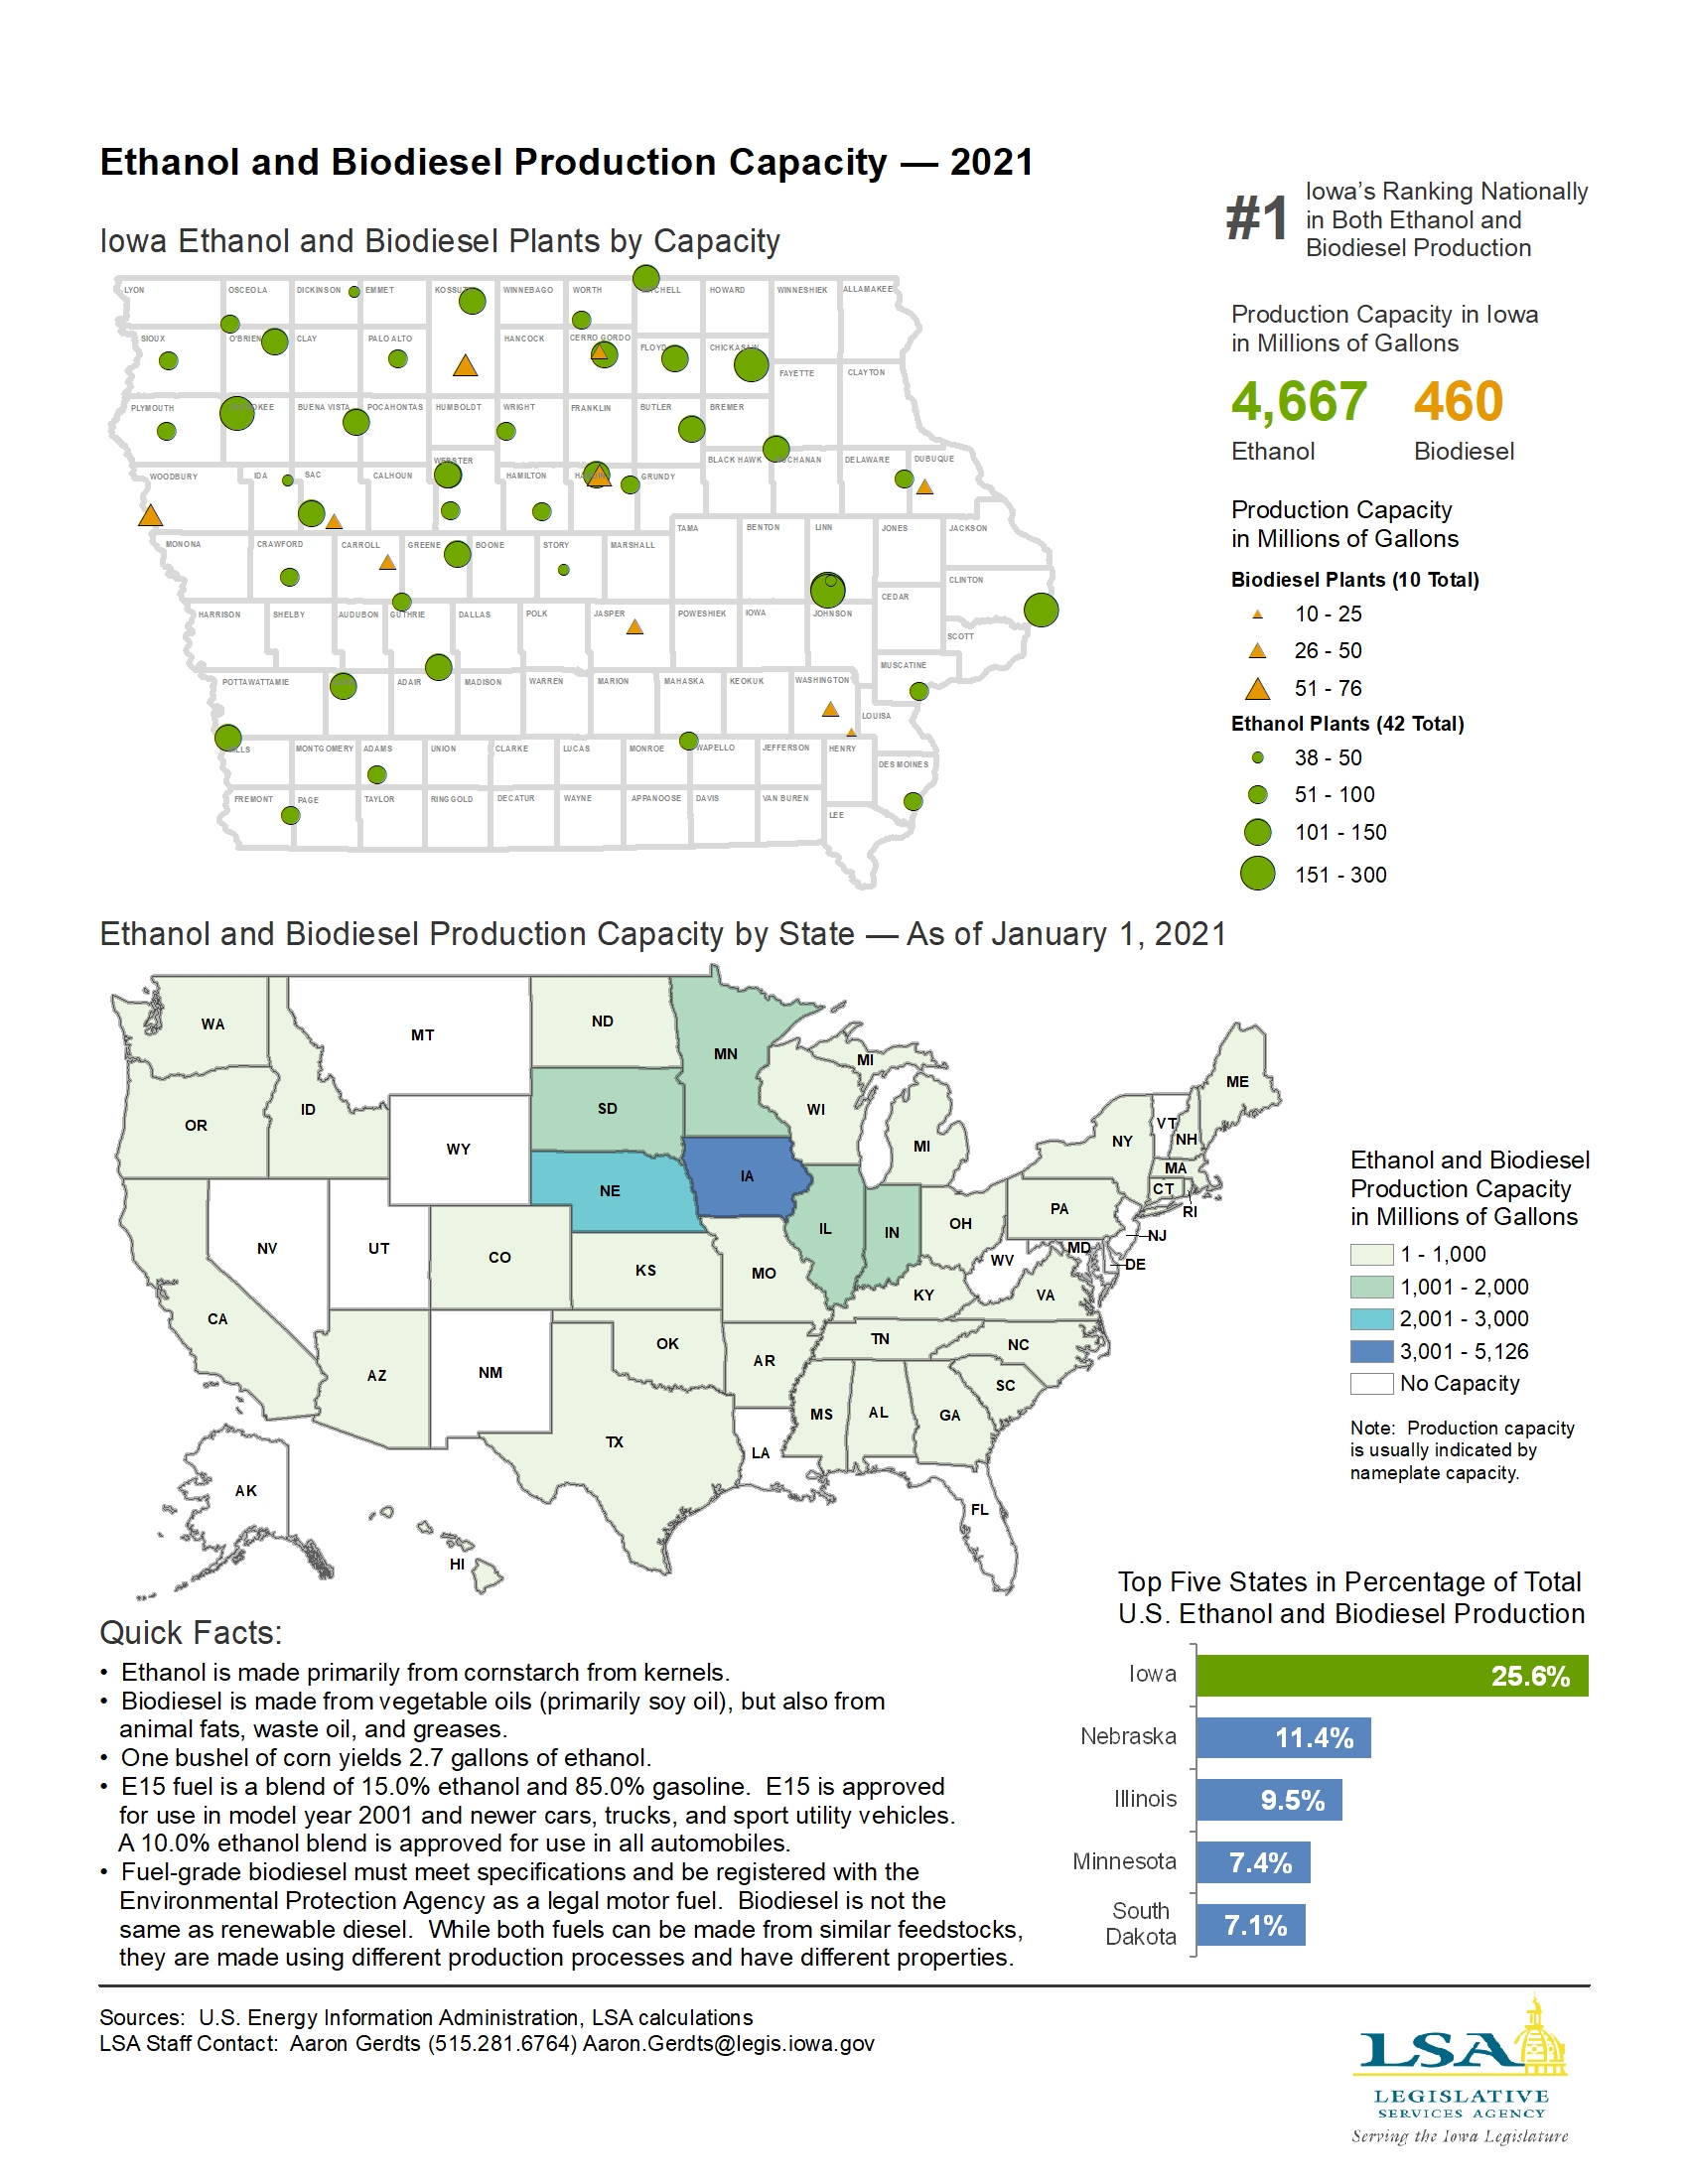
Ethanol and Biodiesel Producation Capacity — 2021
|
|
|
|
|
| 05/09/2022 |
Iowa Insights |
Consolidated Property Tax Rates by School District — FY 2022
|
|
|
|
|
| 04/25/2022 |
Iowa Insights |
City Consolidated Property Tax Rates — FY 2022
|
|
|
|
|
| 04/04/2022 |
Iowa Insights |
Area Agencies on Aging — FY 2021 Funding and Locations

|
|
|
|
|
| 03/28/2022 |
Iowa Insights |
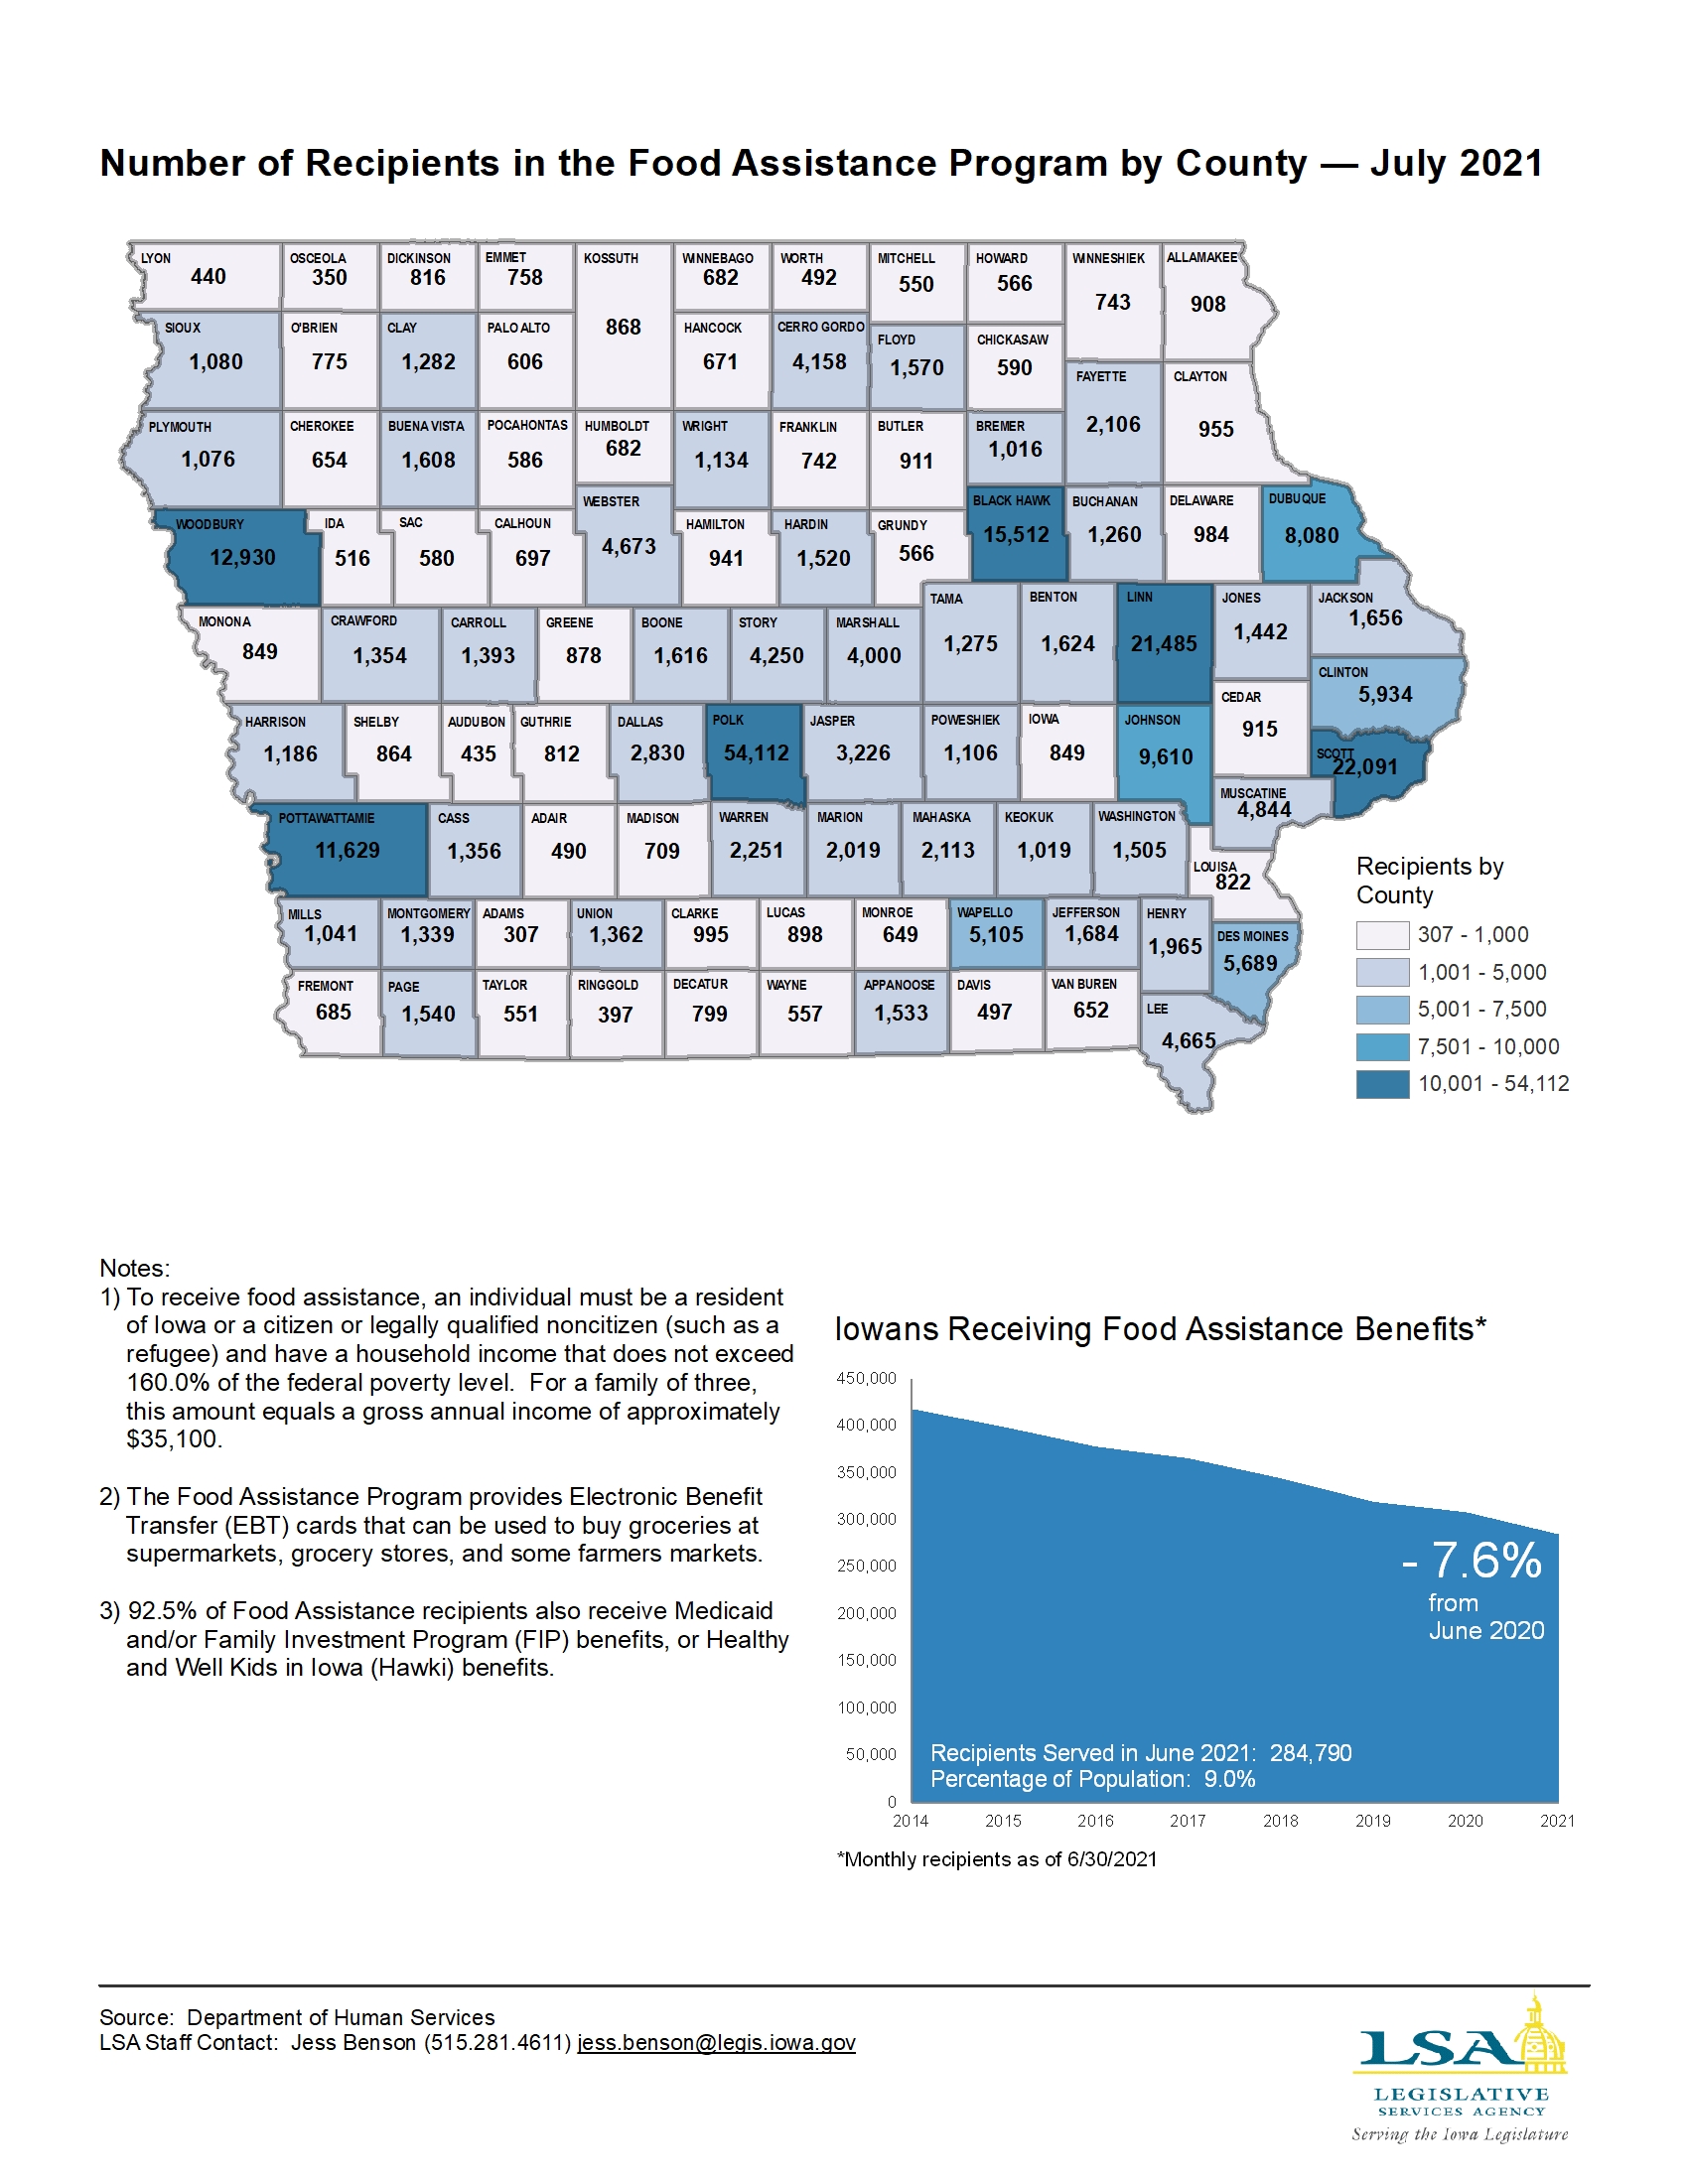
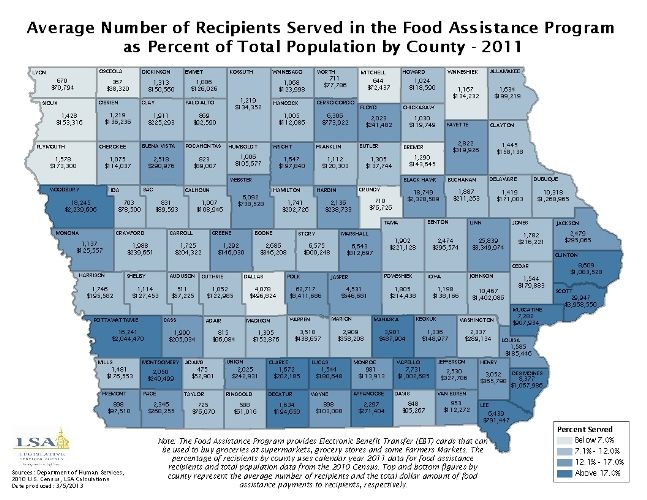
Recipients Served in the Food Assistance Program by County — 2021
|
|
|
|
|
| 03/21/2022 |
Iowa Insights |
Healthy and Well Kids in Iowa — FY 2021 and FY 2022

|
|
|
|
|
| 03/07/2022 |
Iowa Insights |
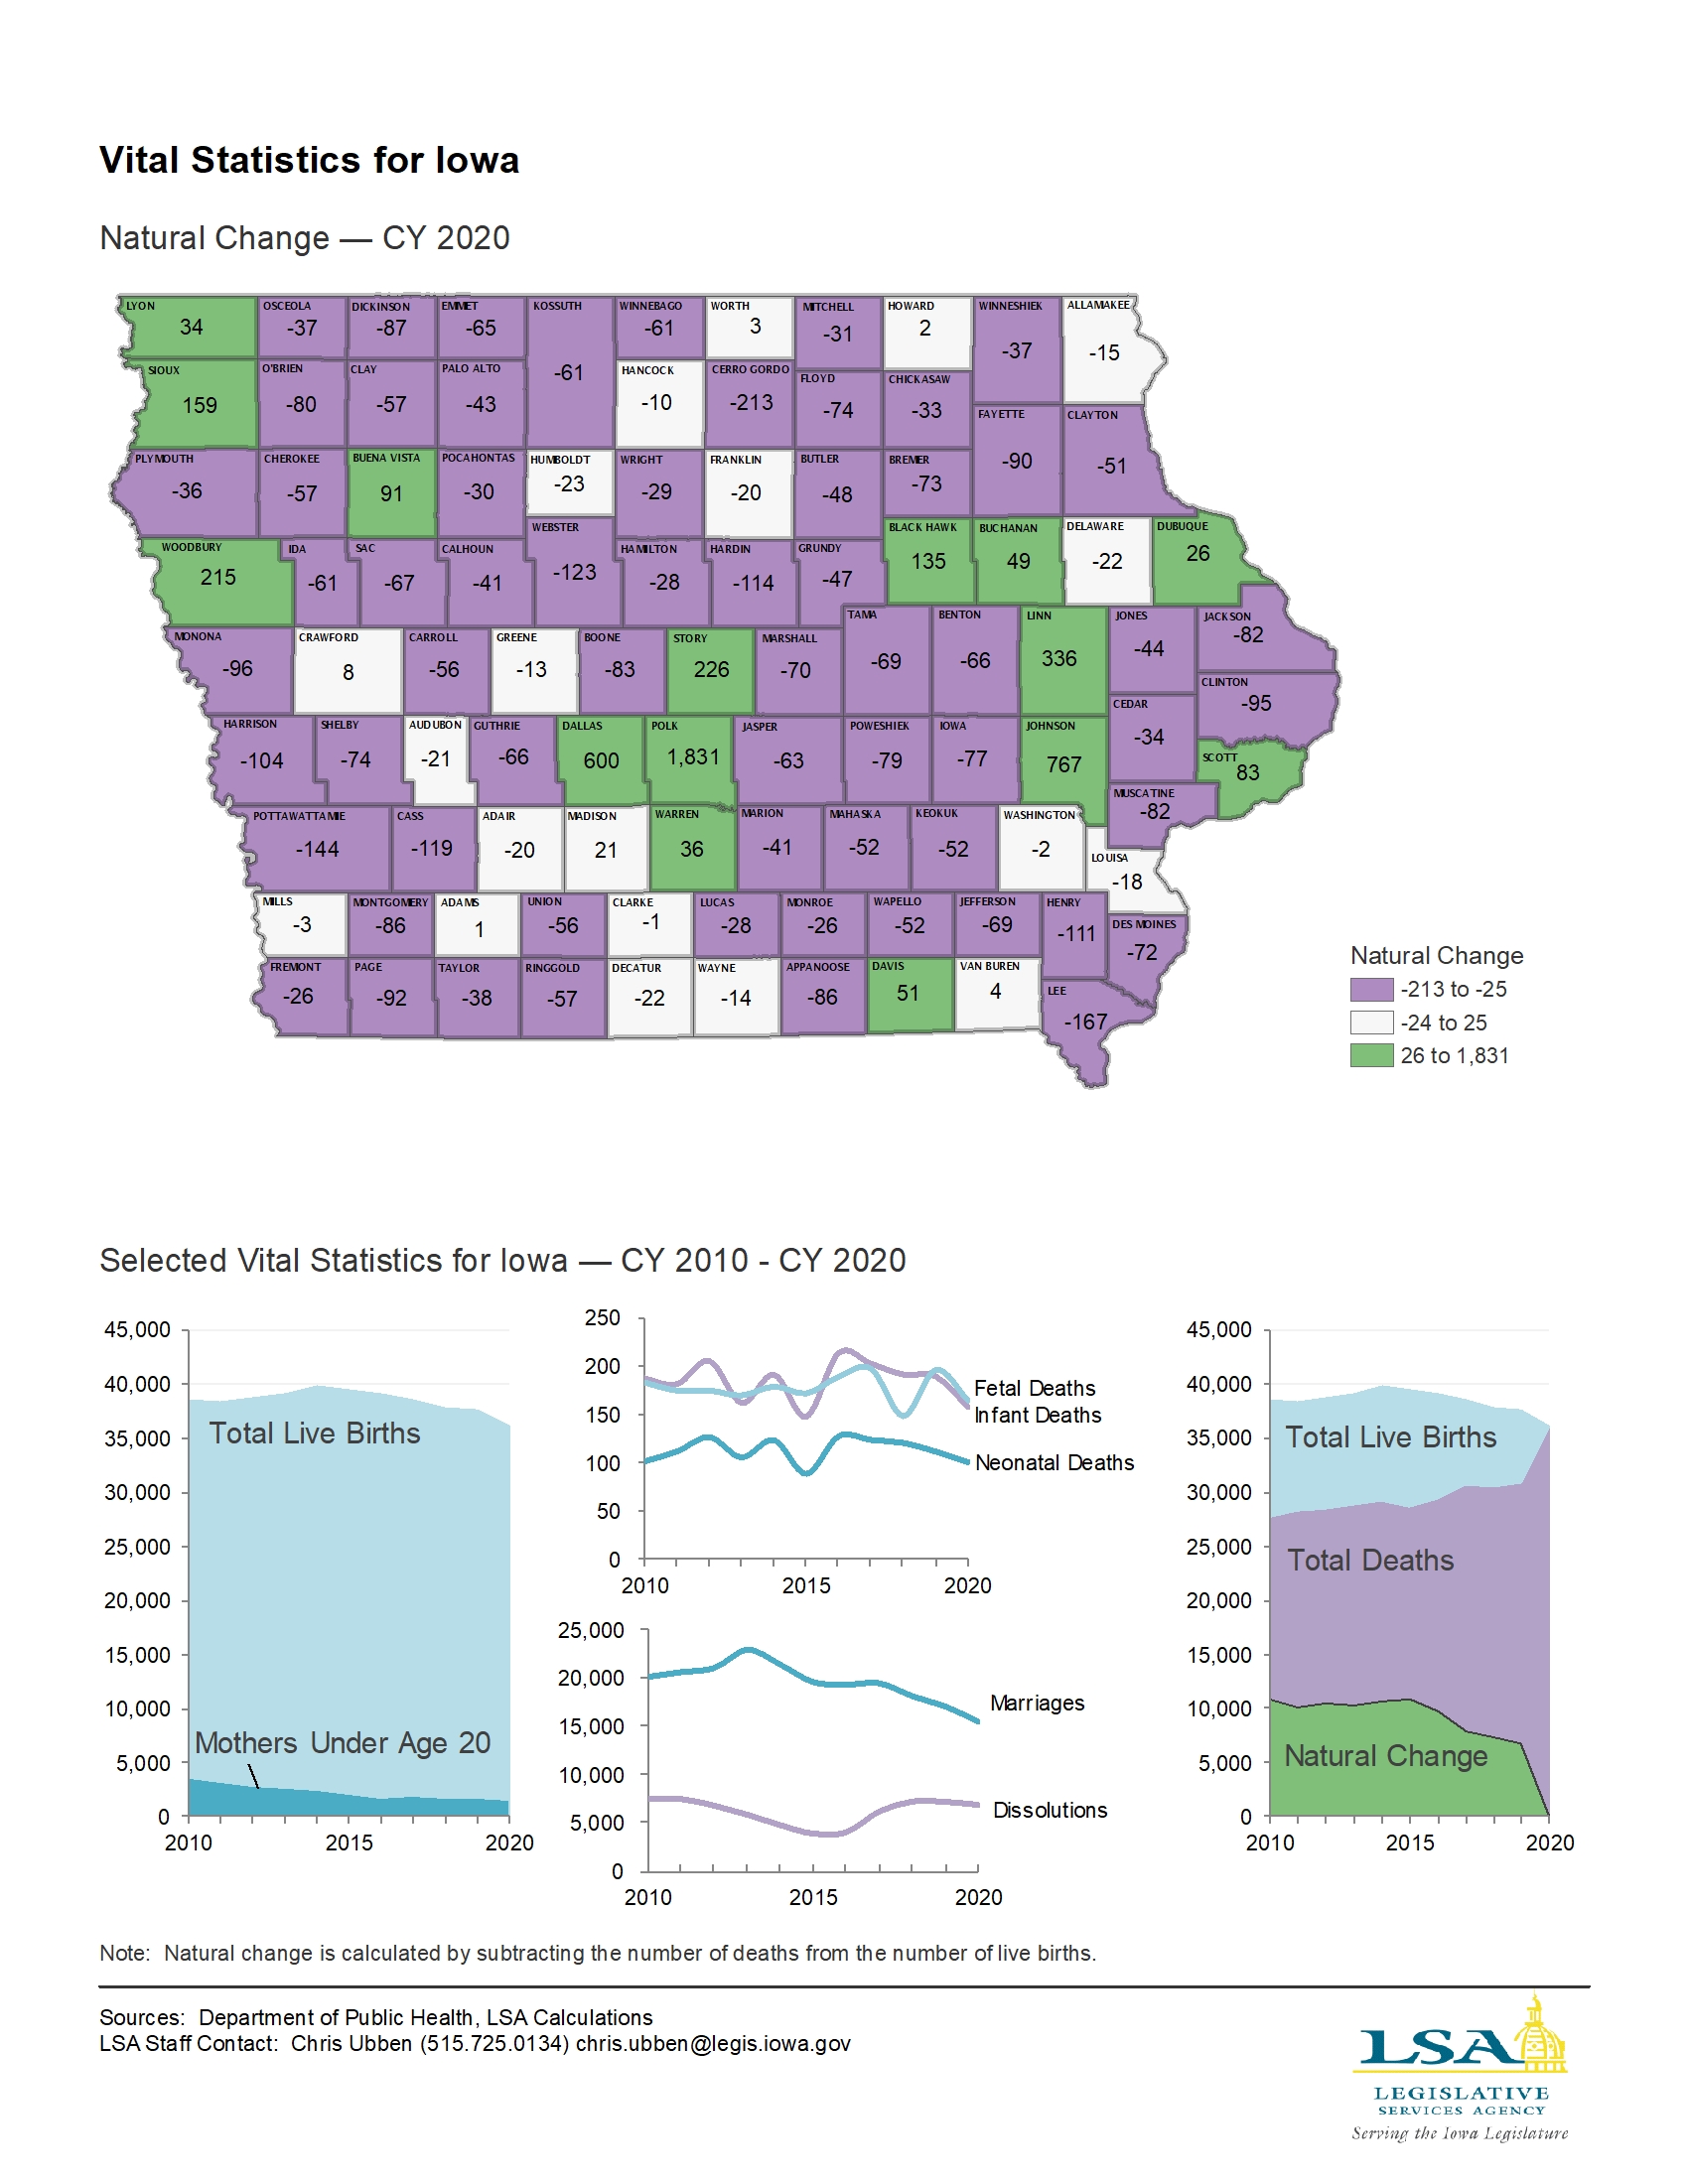
Vital Statistics for Iowa — 2020
|
|
|
|
|
| 01/31/2022 |
Iowa Insights |
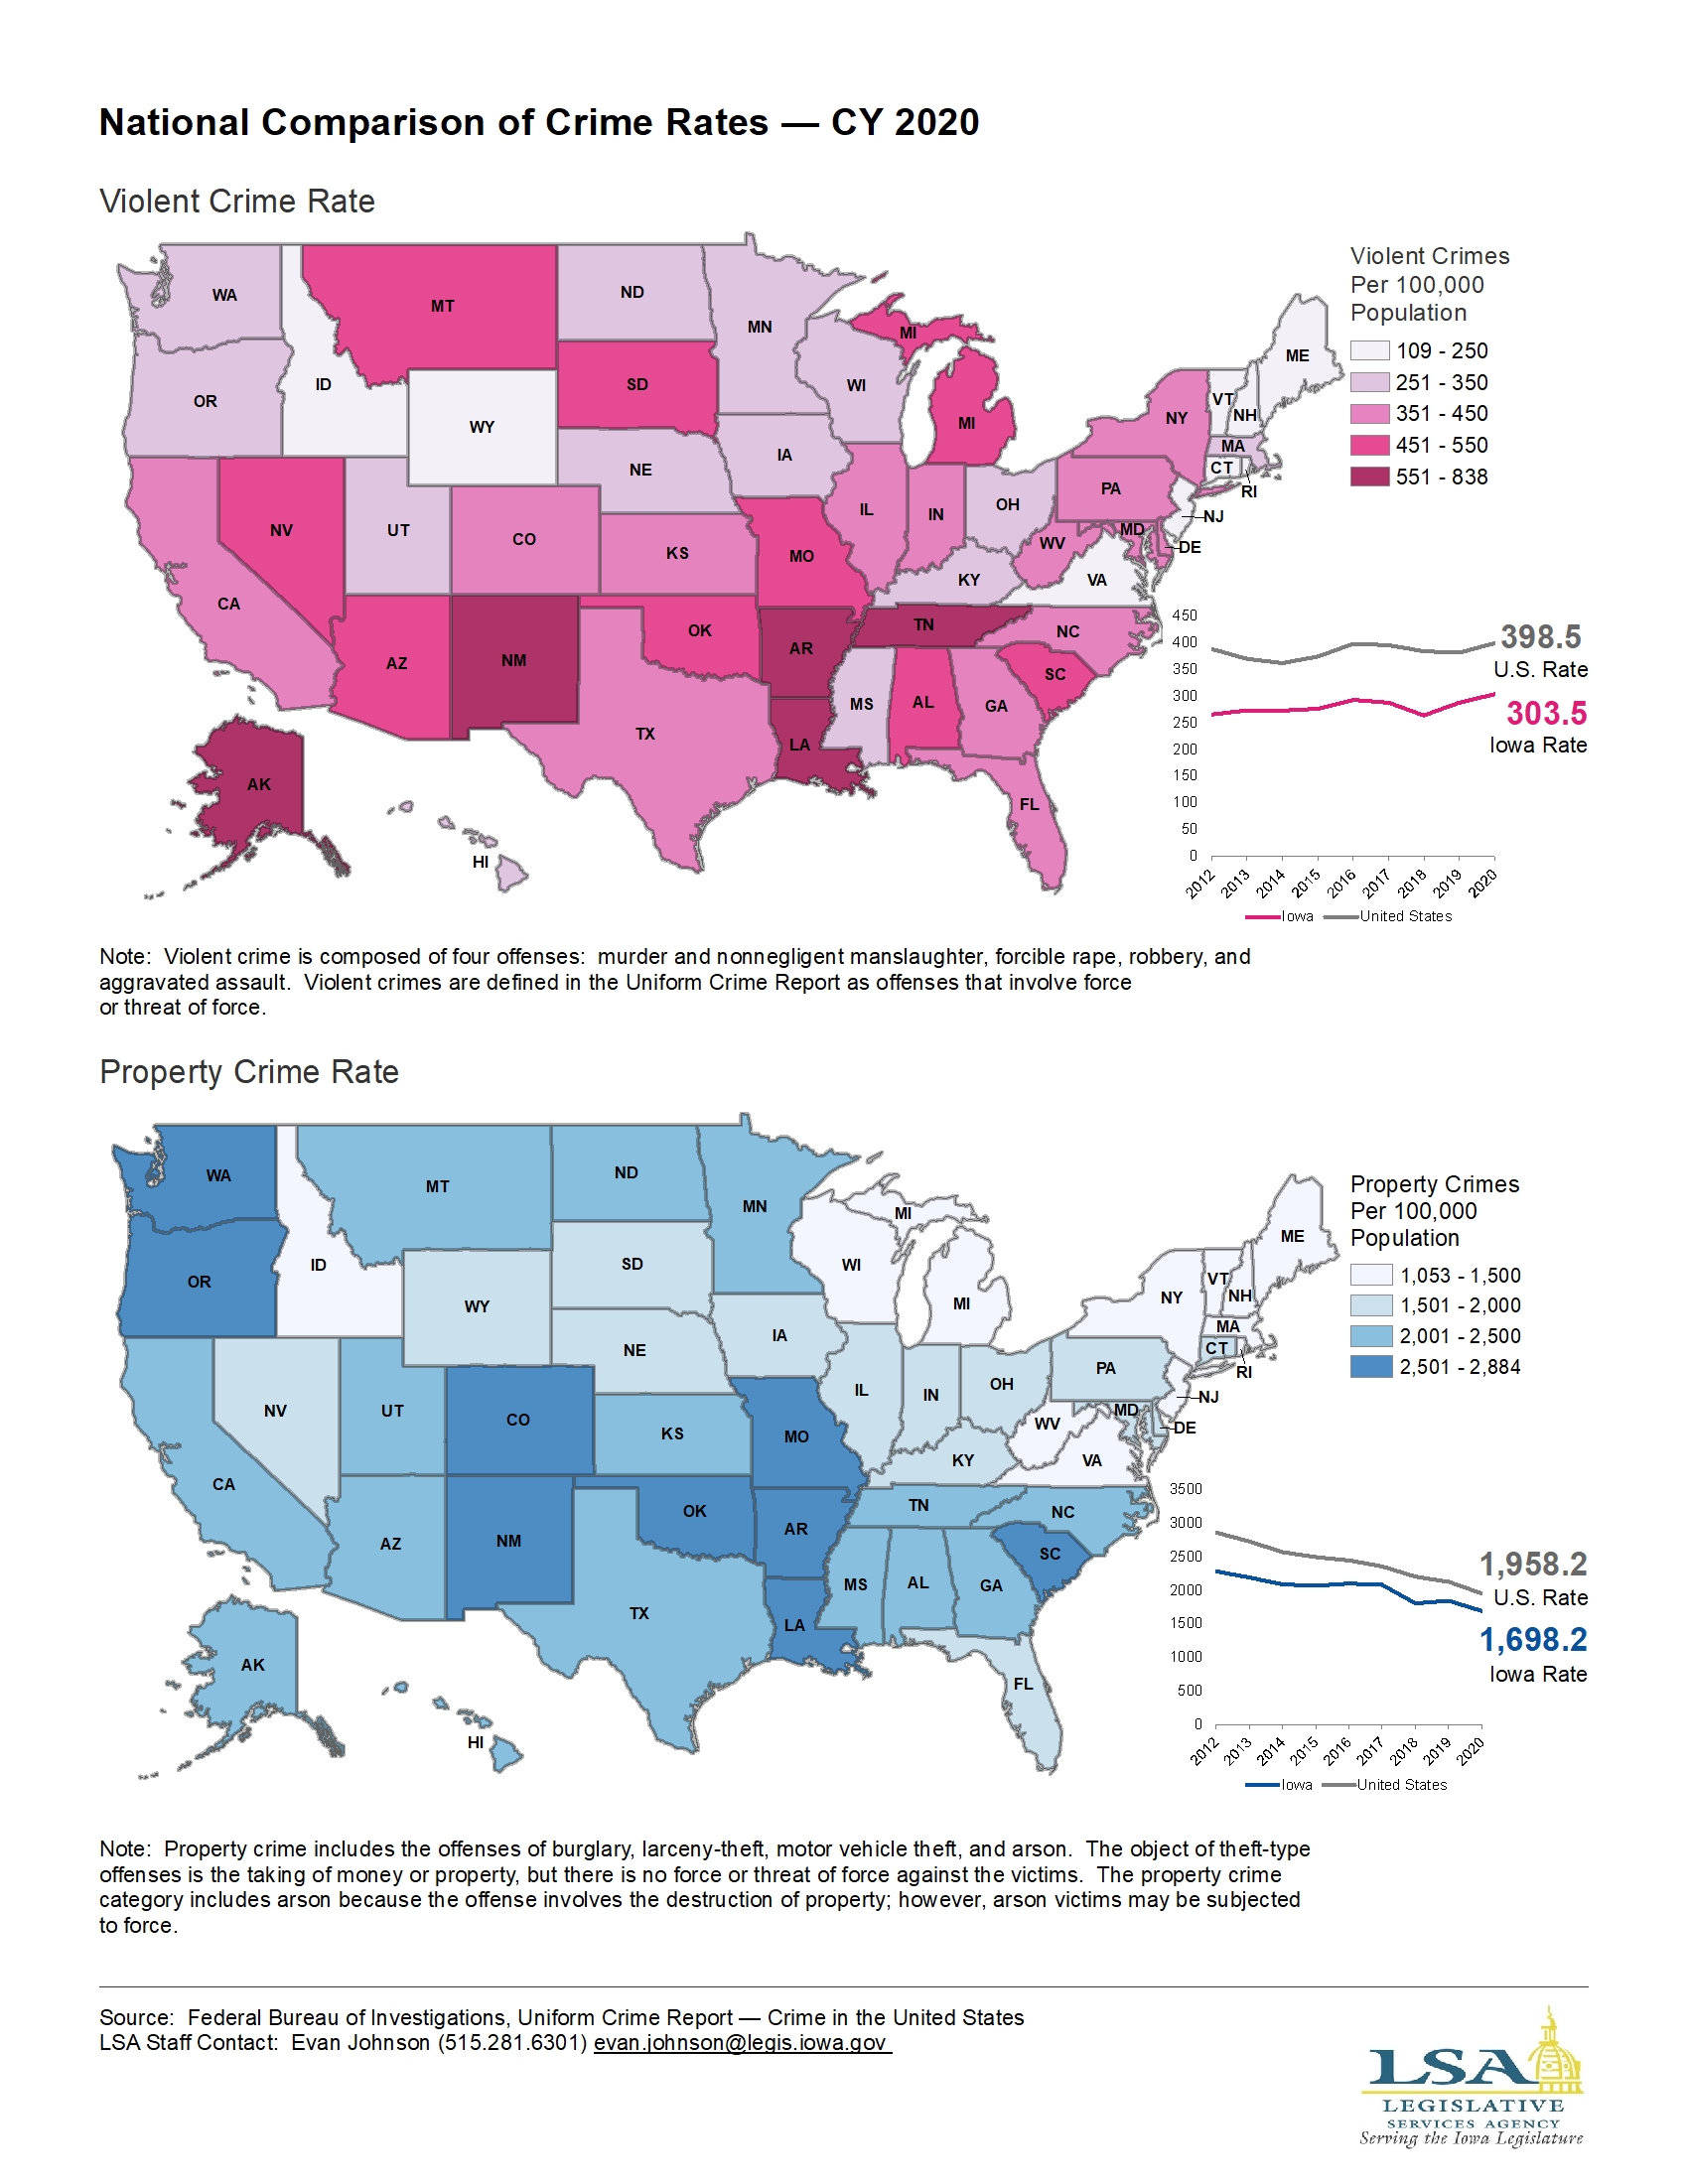
National Comparison of Crime Rates — CY 2020
|
|
|
|
|
| 01/25/2022 |
Iowa Insights |
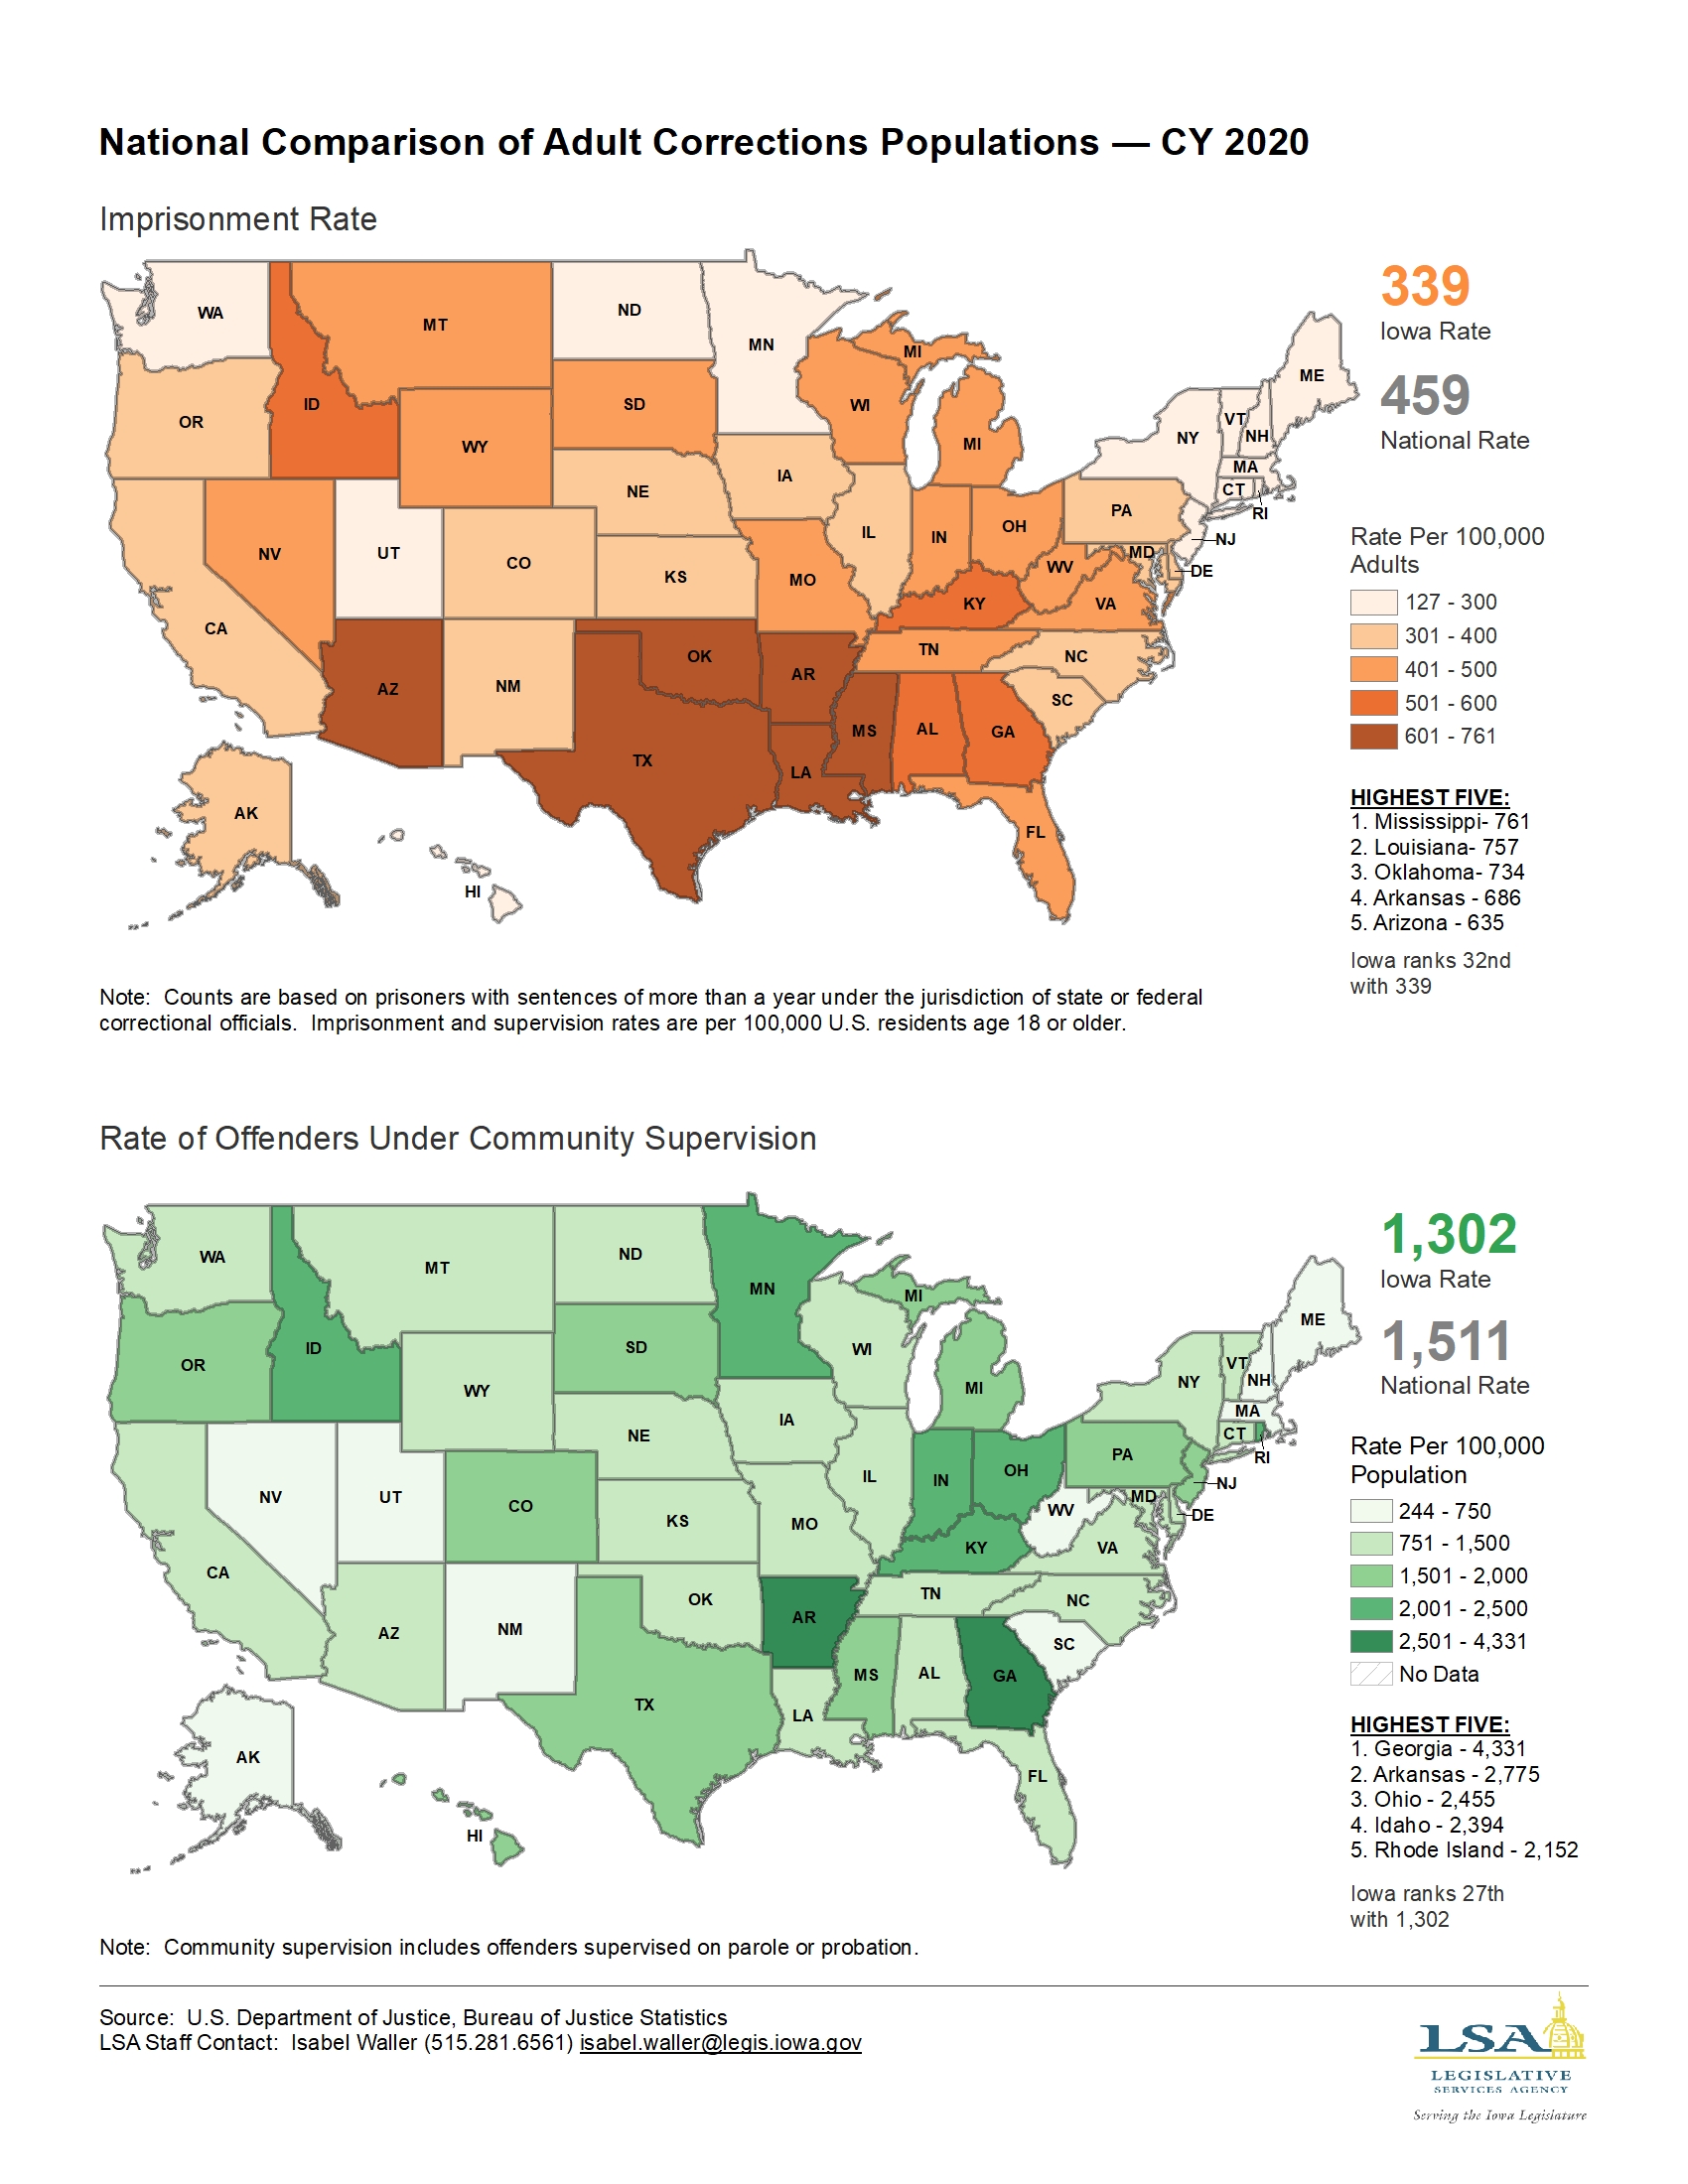
National Comparison of Adult Corrections Populations — CY 2020
|
|
|
|
|
| 12/20/2021 |
Iowa Insights |
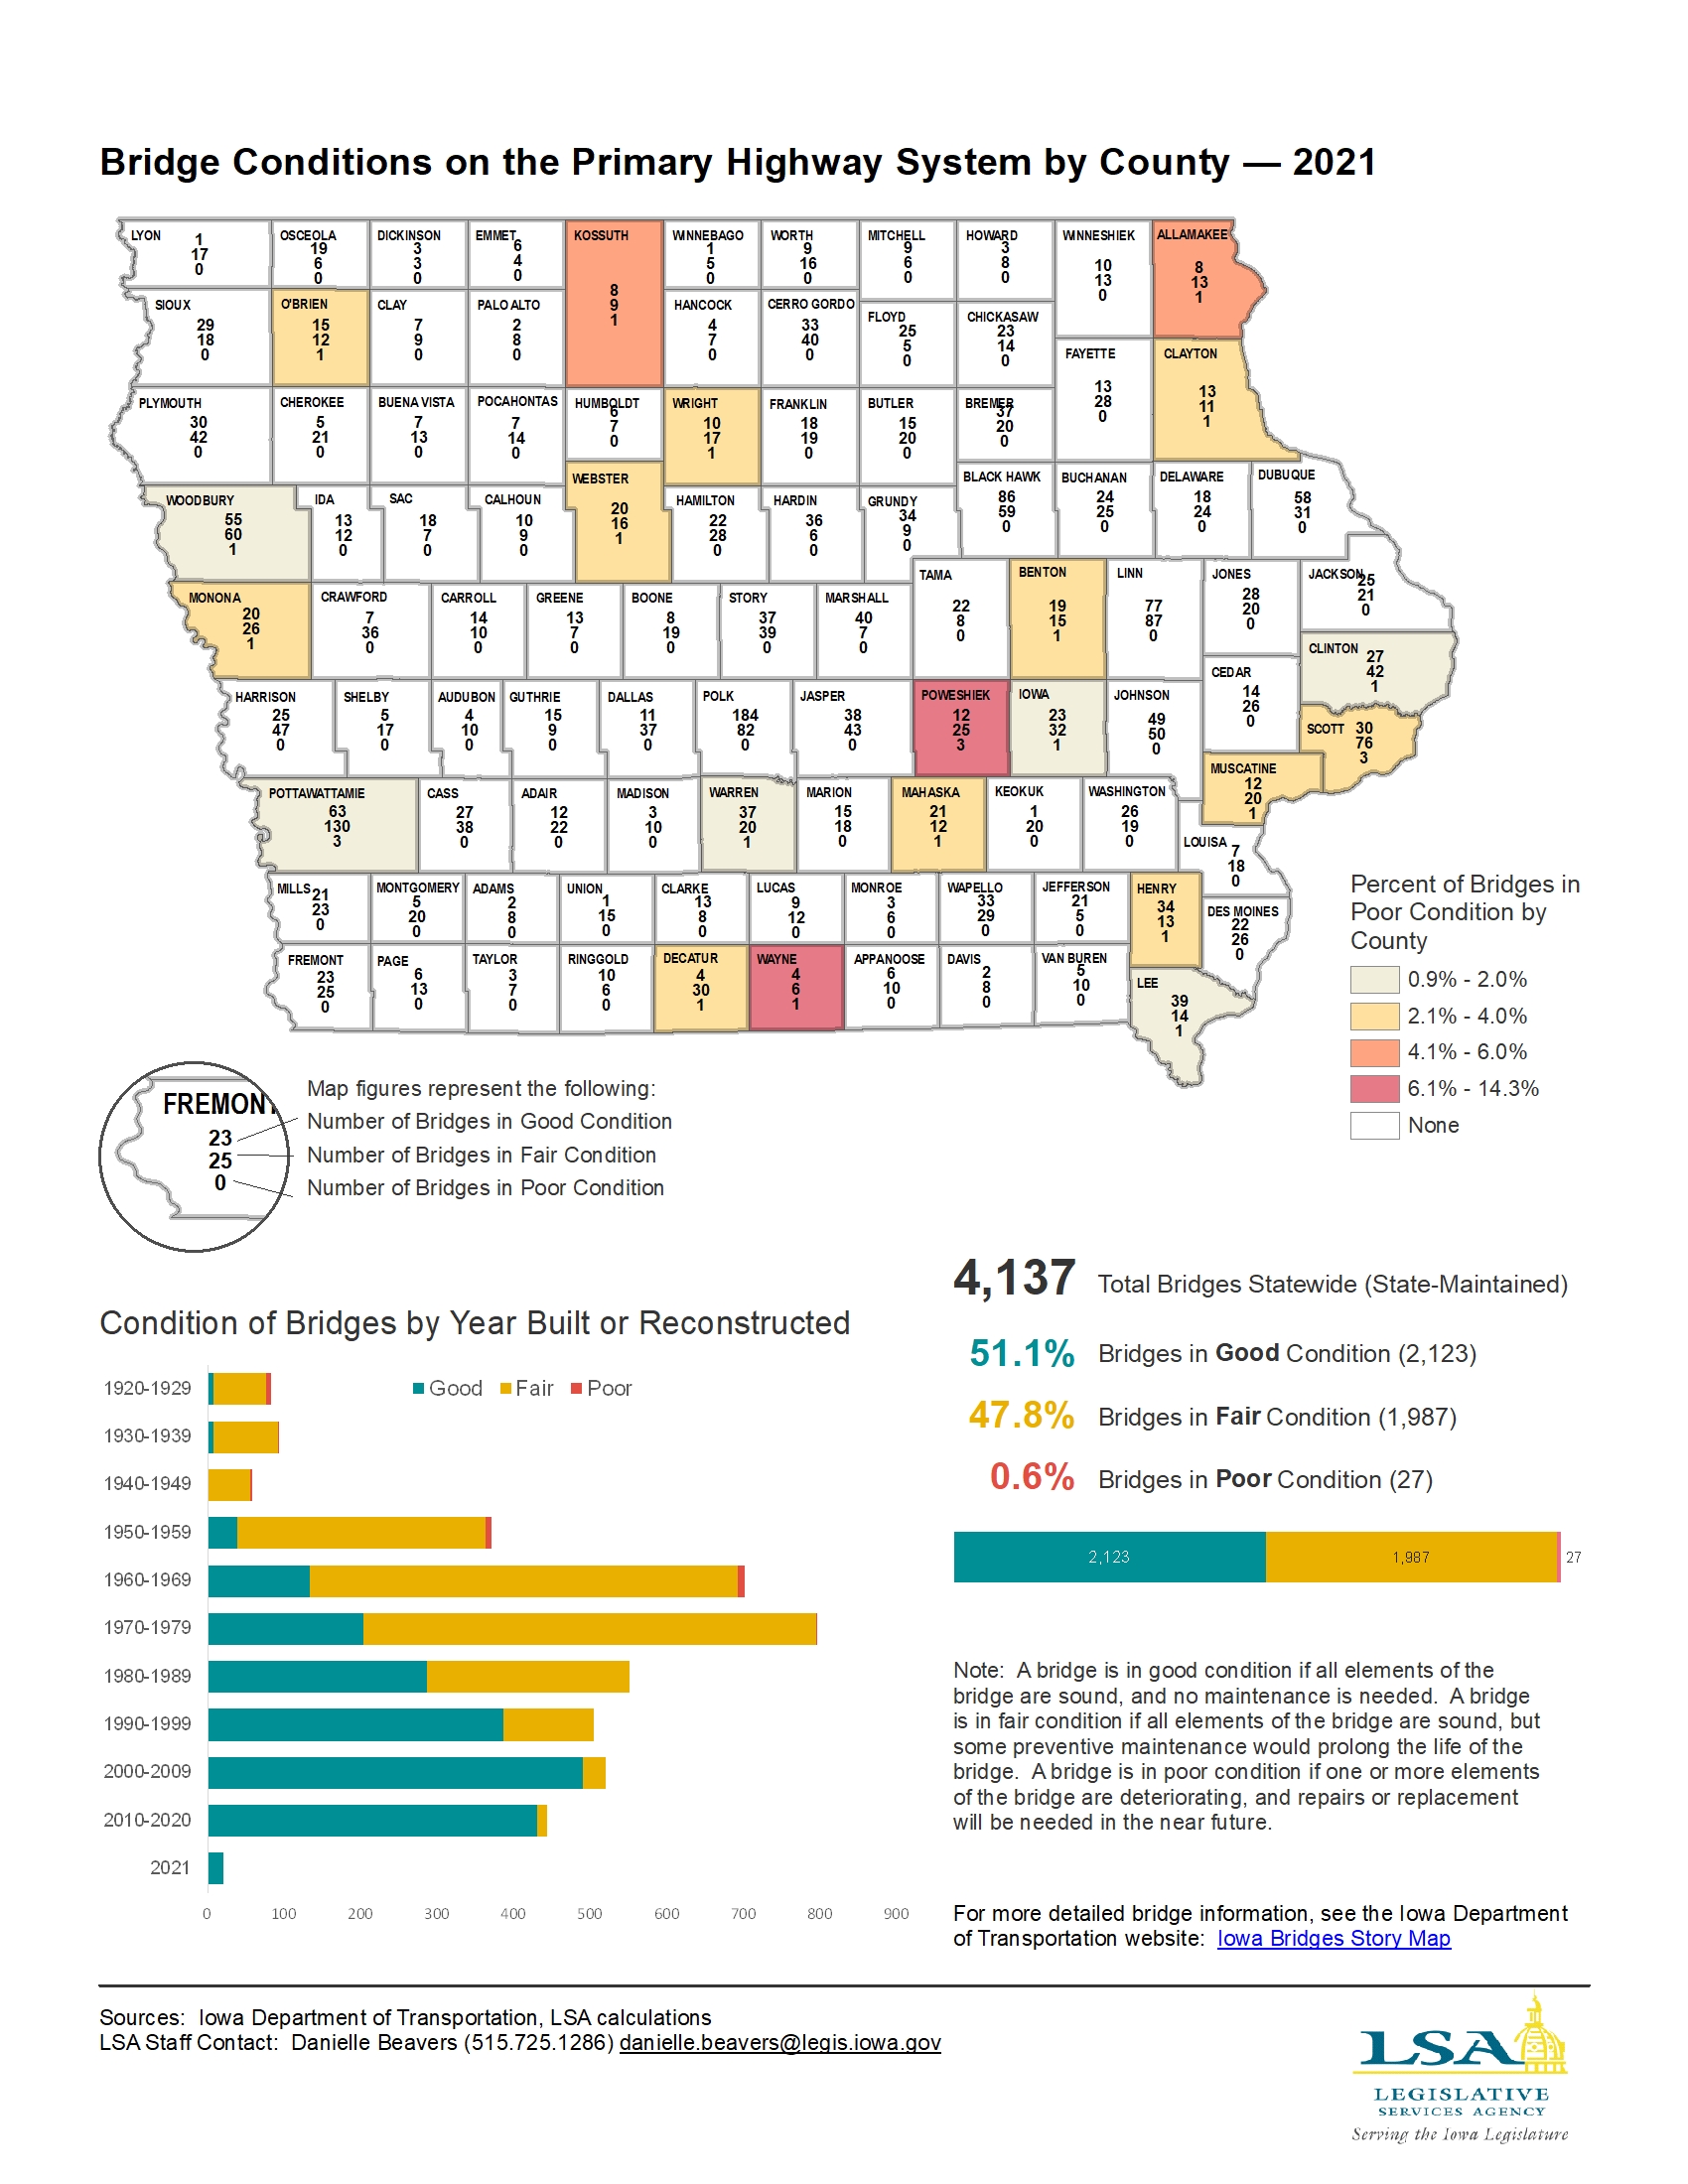
Bridge Conditions of the Primary Highway System by County — 2021
|
|
|
|
|
| 12/13/2021 |
Iowa Insights |
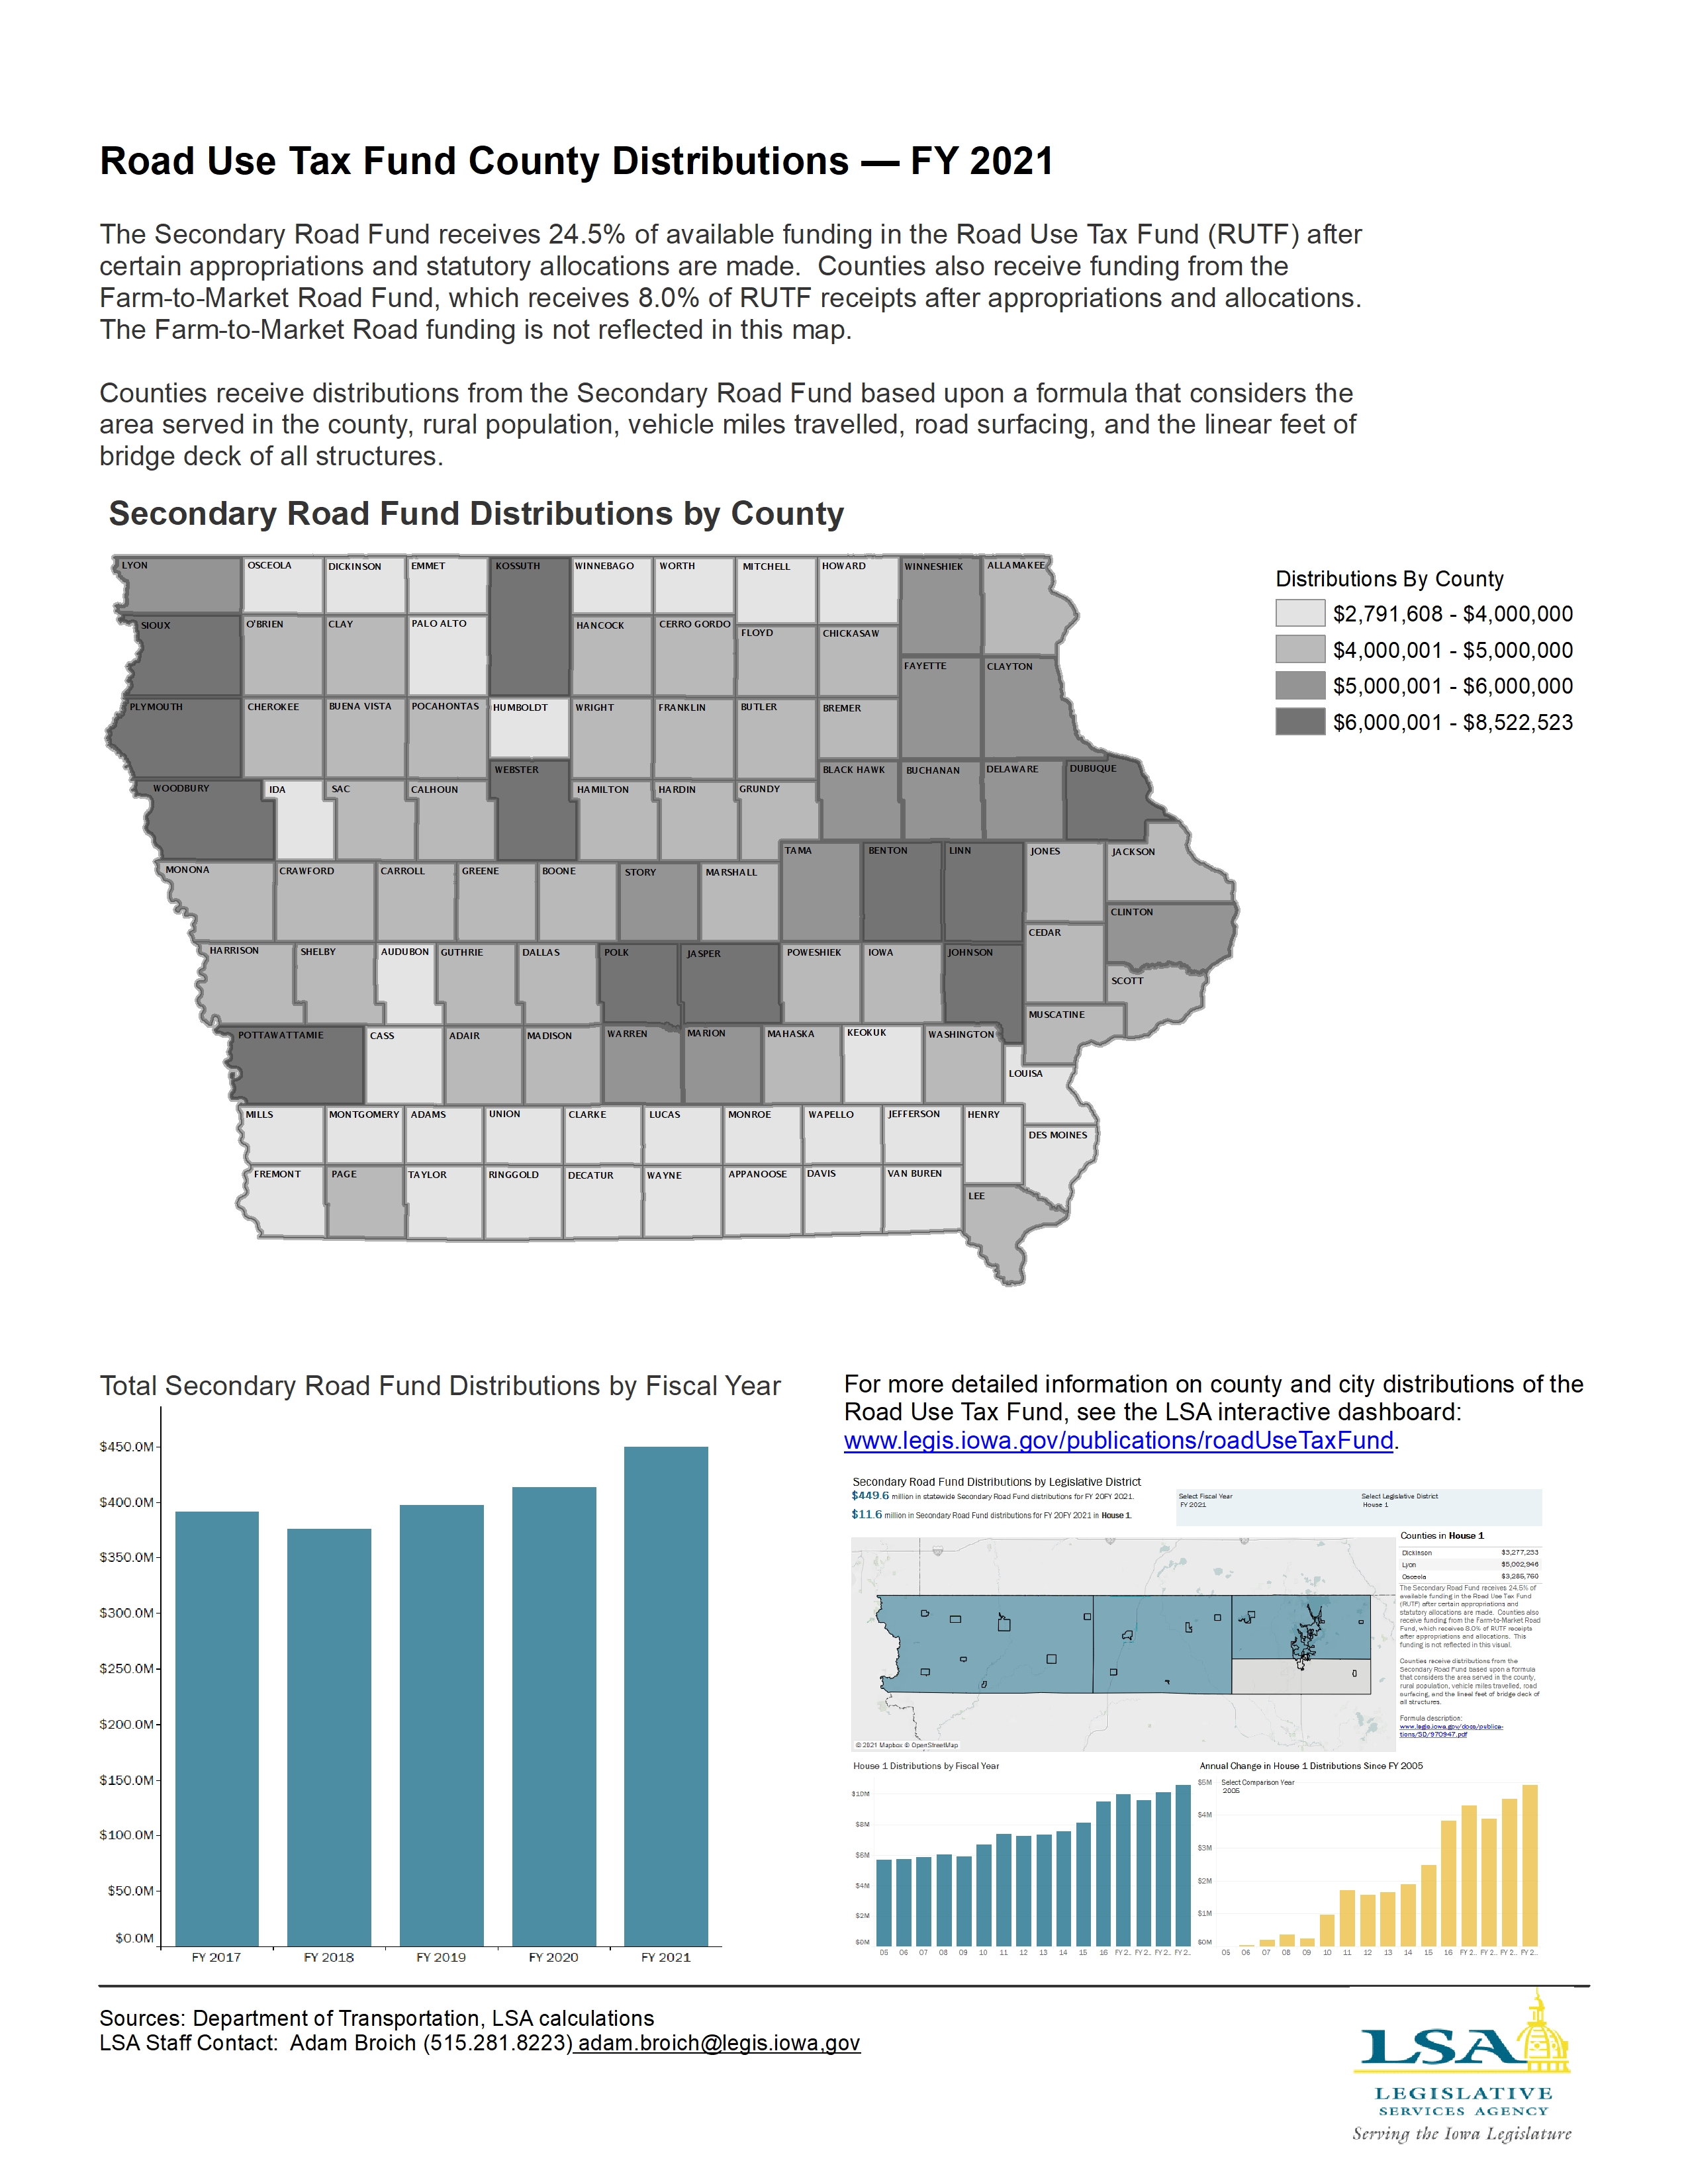
Road Use Tax Fund County Distributions — FY 2021
|
|
|
|
|
| 12/06/2021 |
Iowa Insights |
County Road Fund Expenditures by Category
|
|
|
|
|
| 11/29/2021 |
Iowa Insights |
Retailers Fuel Gallons Annual Report — 2020

|
|
|
|
|
| 11/22/2021 |
Iowa Insights |
Iowa Regents Enrollment by Decade — 1870-2020
|
|
|
|
|
| 11/15/2021 |
Iowa Insights |
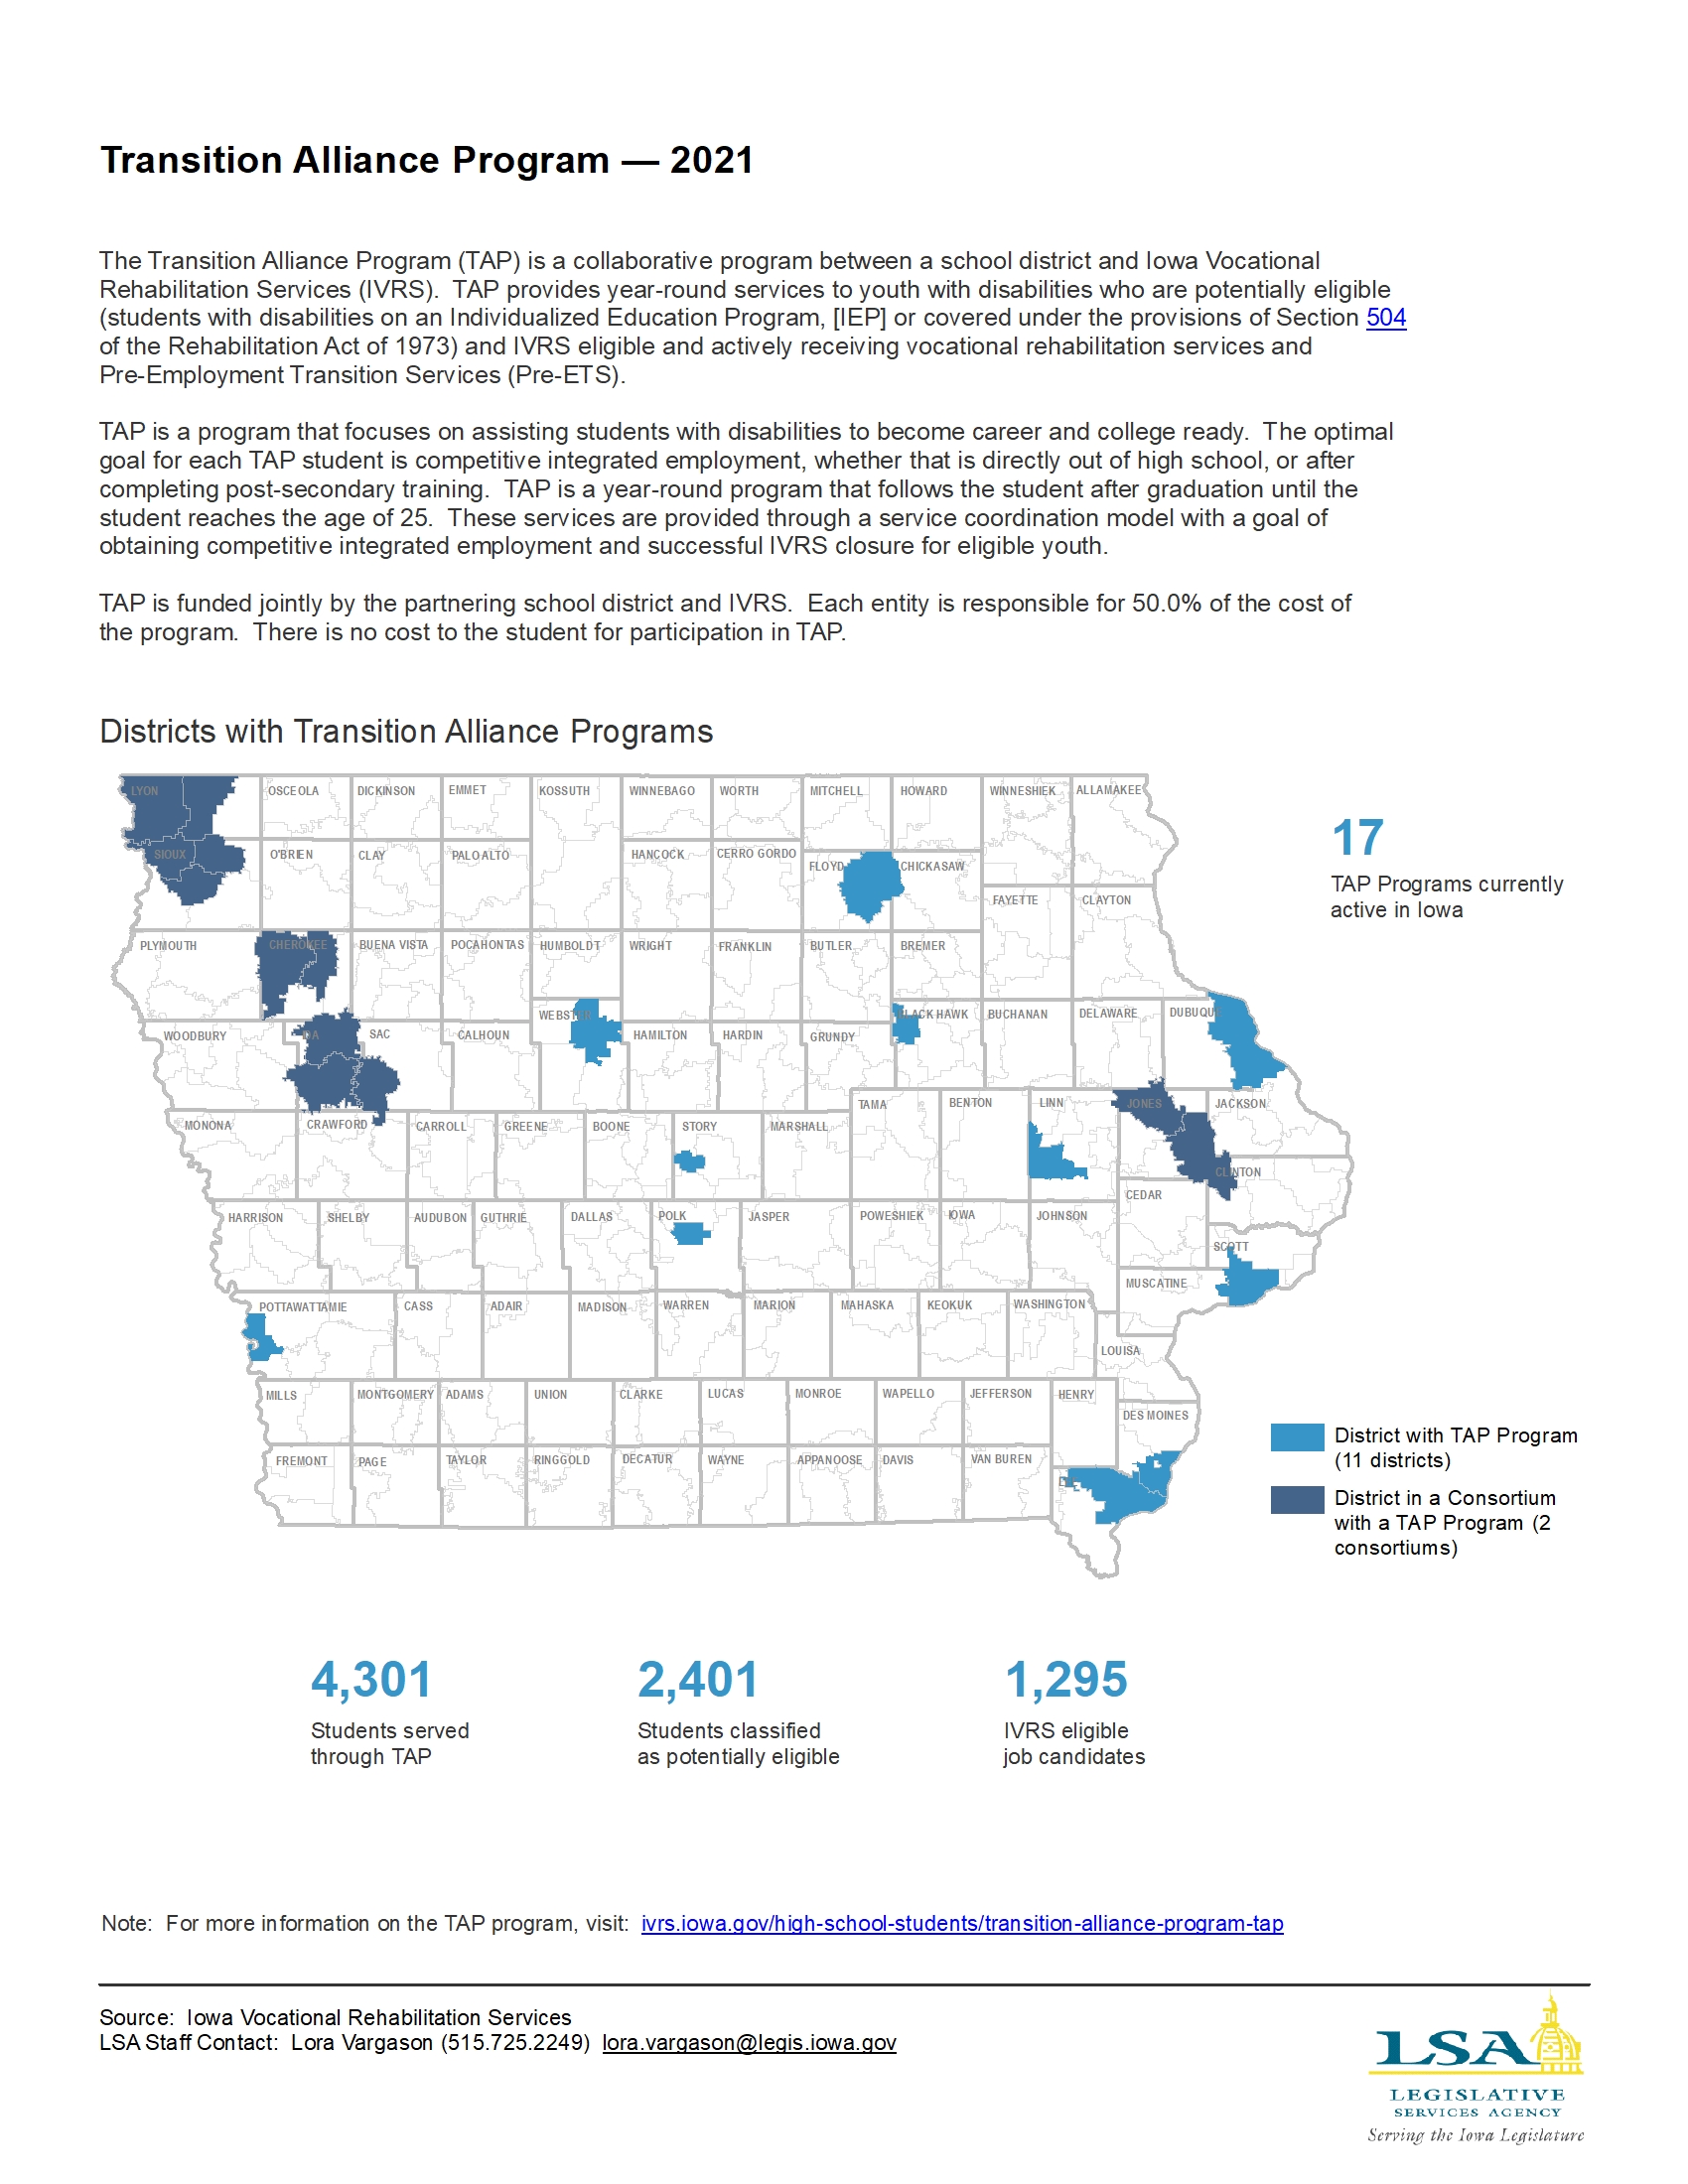
Transition Alliance Program — 2021
|
|
|
|
|
| 11/08/2021 |
Iowa Insights |
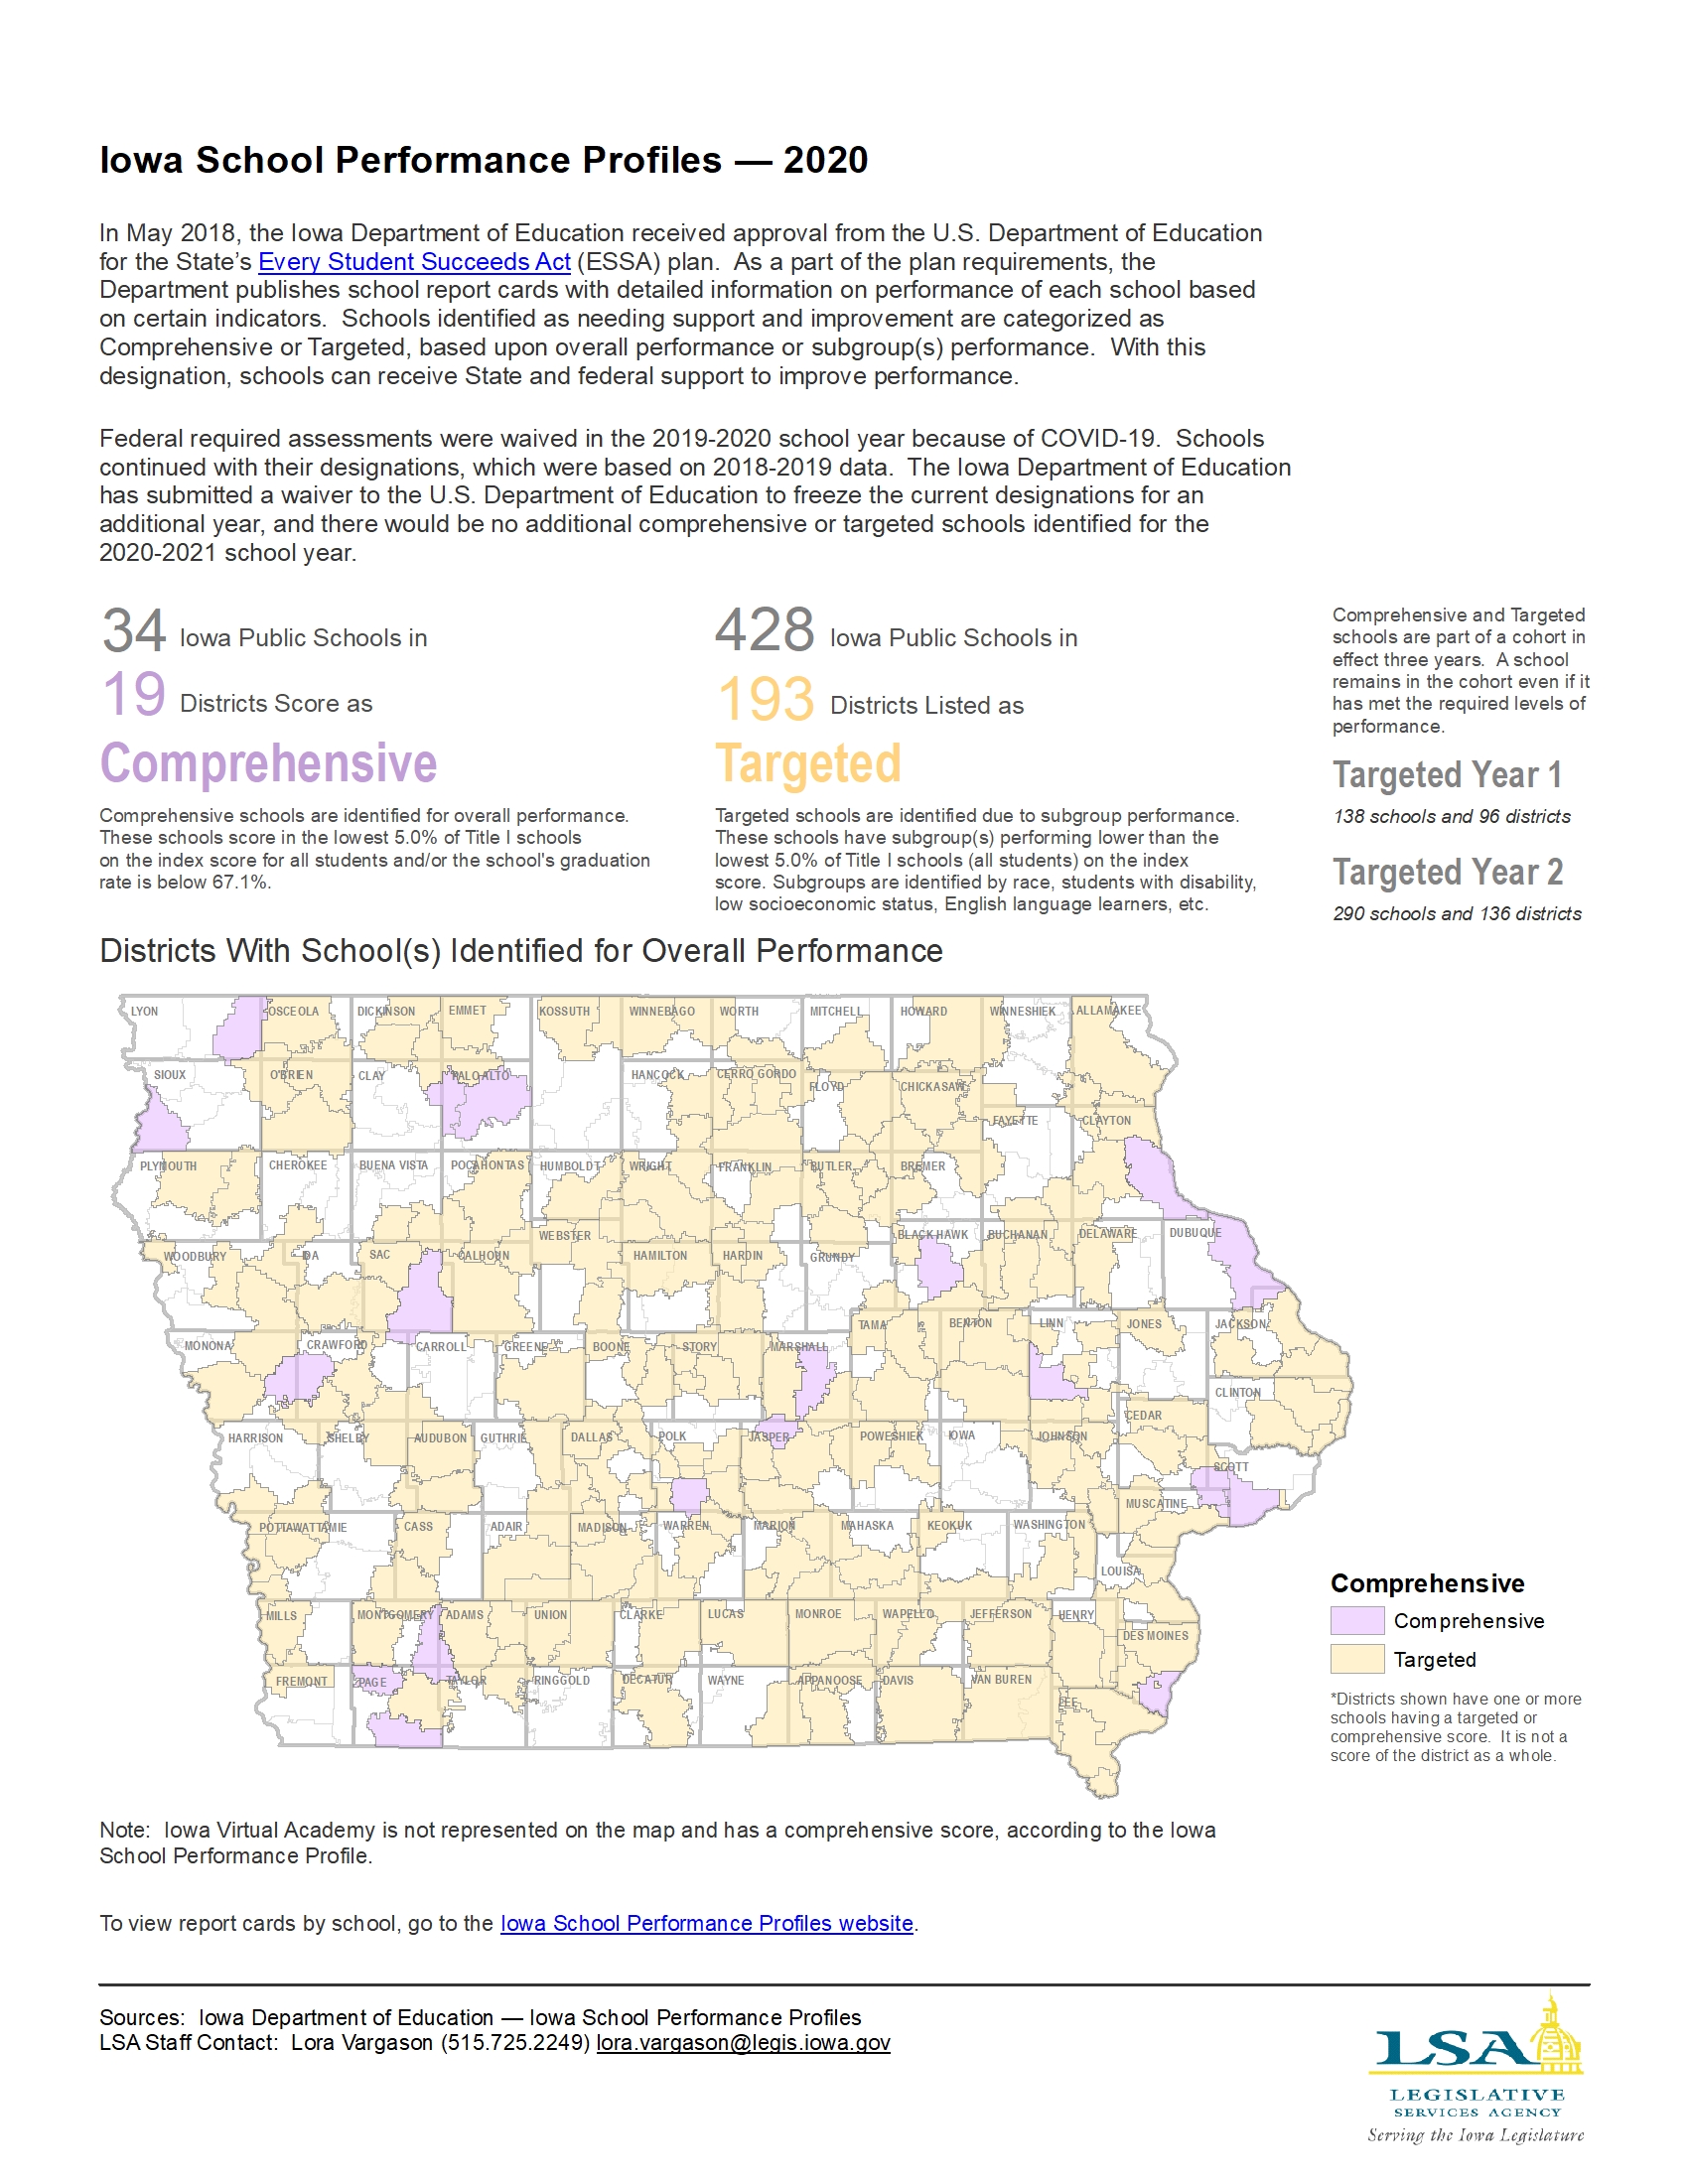
Iowa School Performance Profiles — 2020
|
|
|
|
|
| 11/01/2021 |
Iowa Insights |
School District Management Fund Levy — FY 2022

|
|
|
|
|
| 10/25/2021 |
Iowa Insights |
Total Property Tax Relief Aid and Rate Reduction by School District — FY 2022

|
|
|
|
|
| 10/18/2021 |
Iowa Insights |
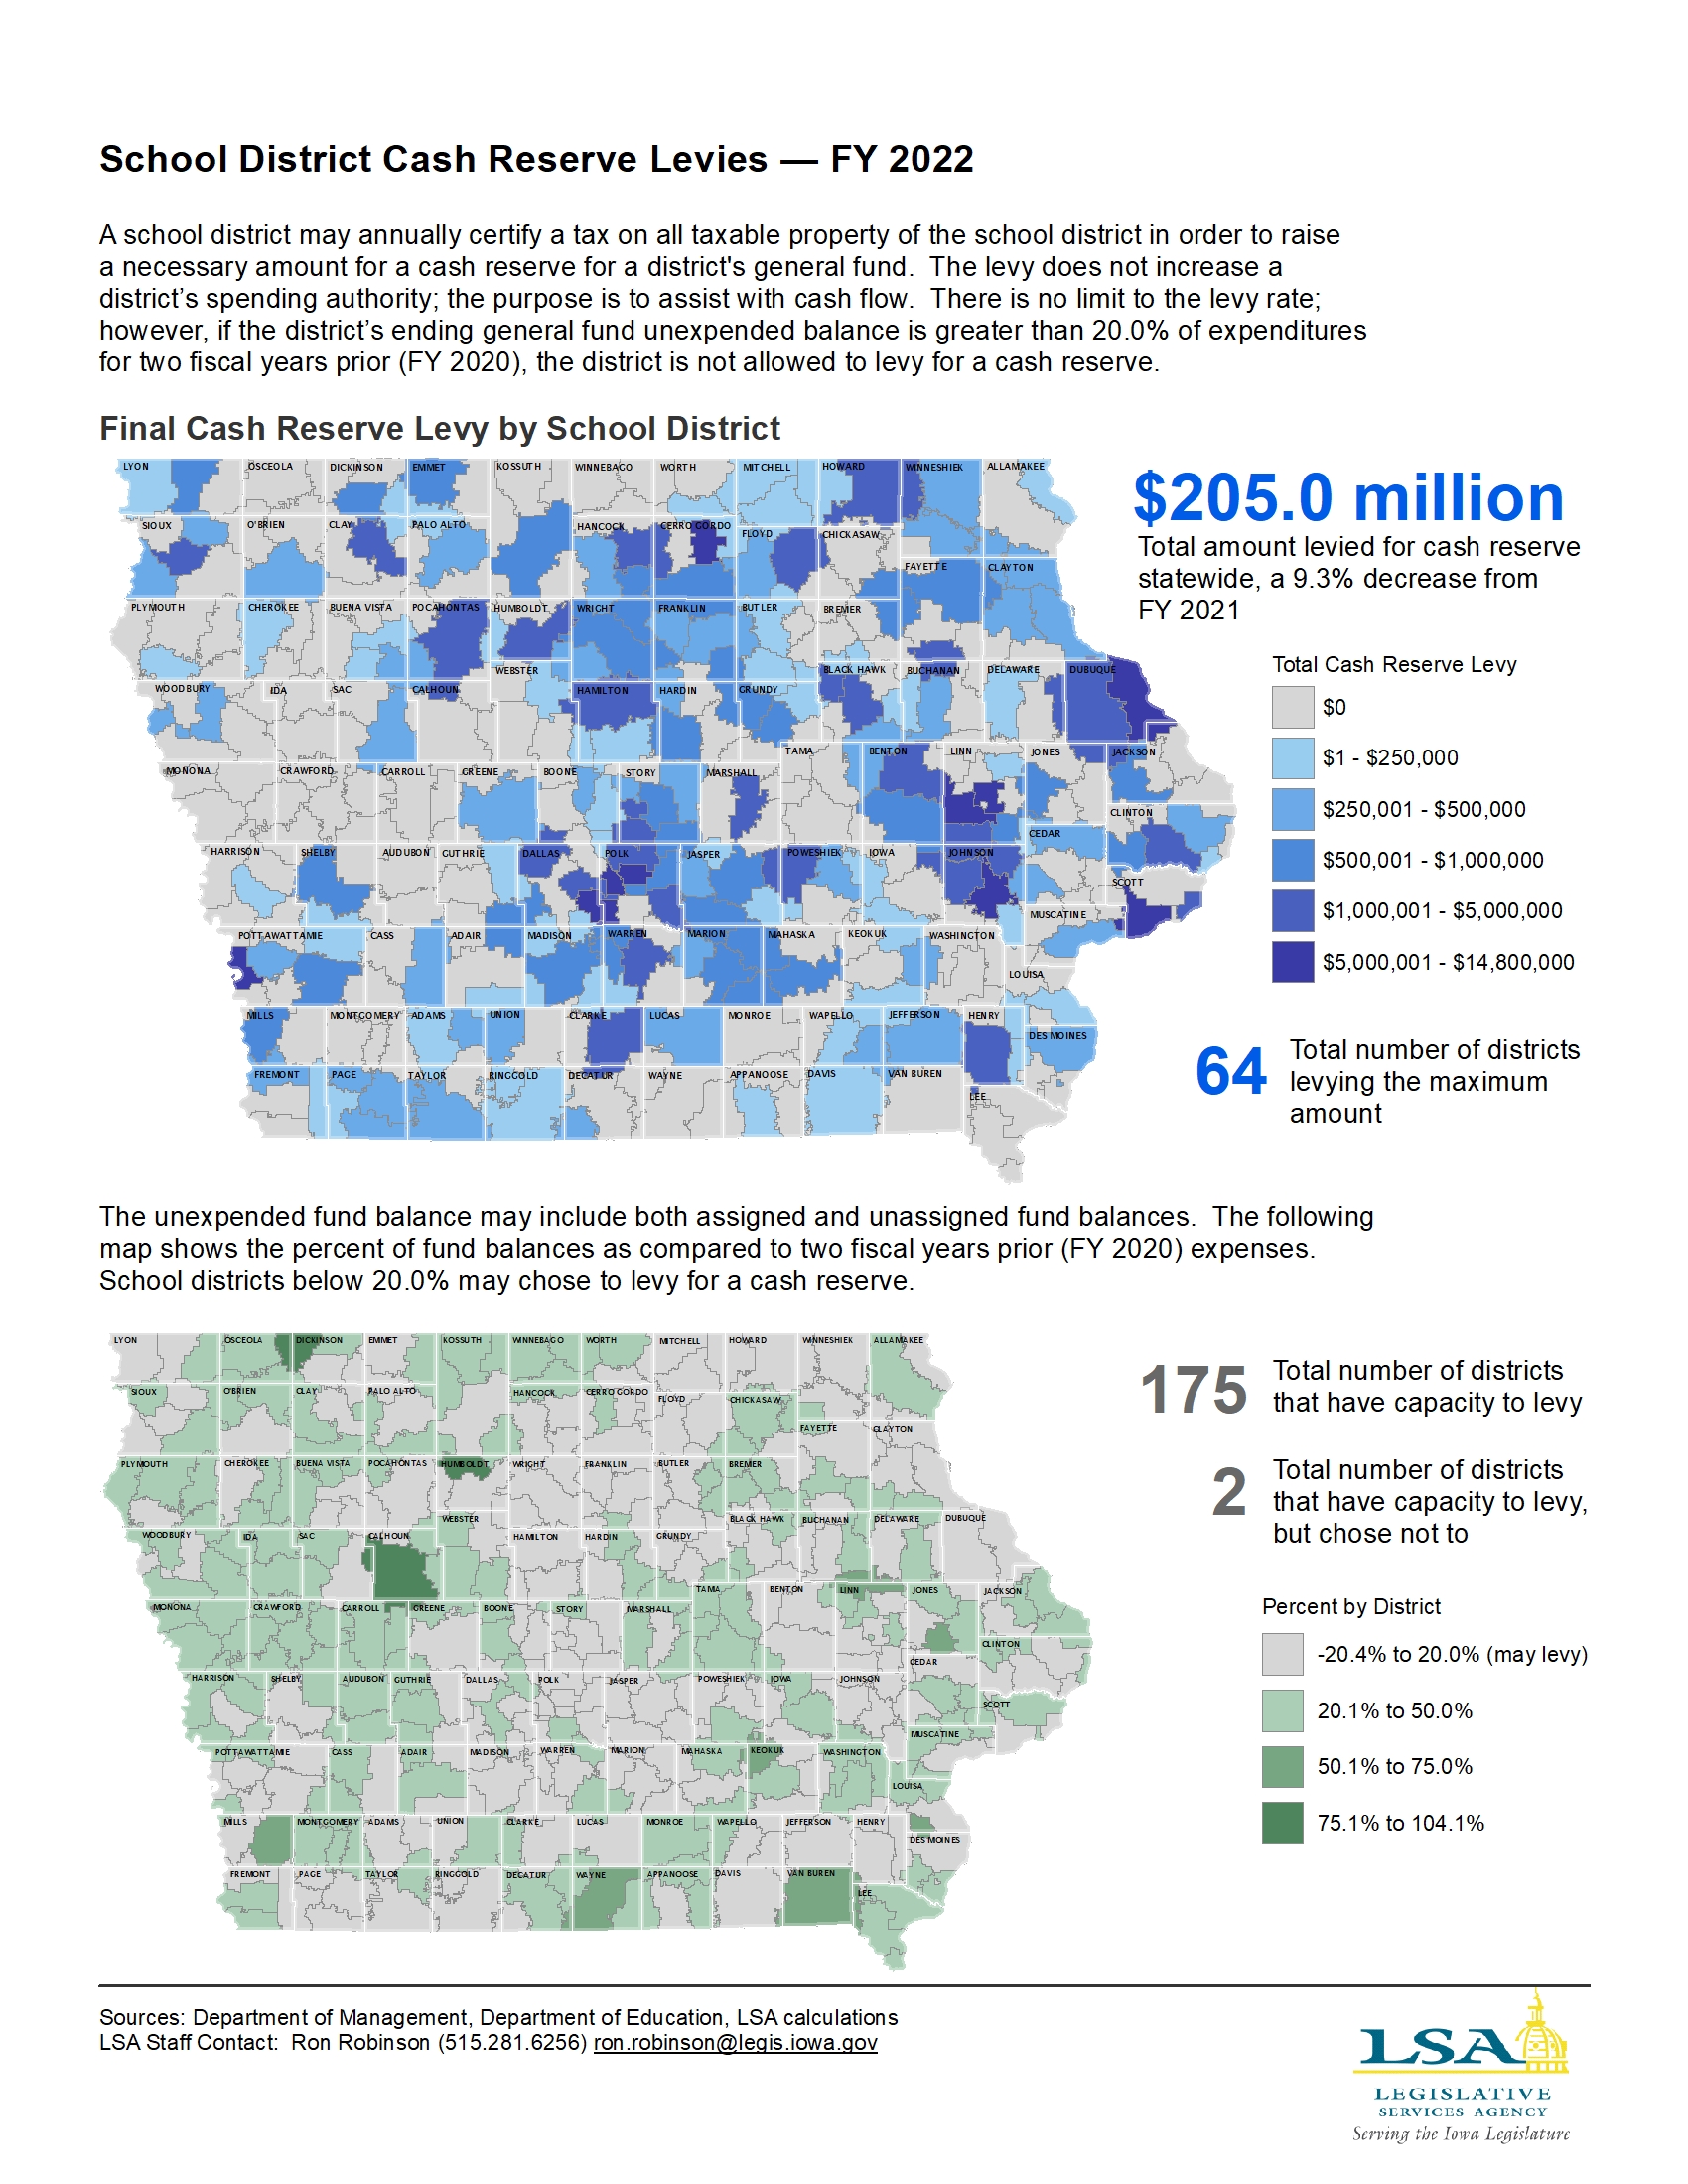
School District Cash Reserve Levies — FY 2022
|
|
|
|
|
| 10/11/2021 |
Iowa Insights |
School Aid — Additional Levy Components
|
|
|
|
|
| 10/04/2021 |
Iowa Insights |
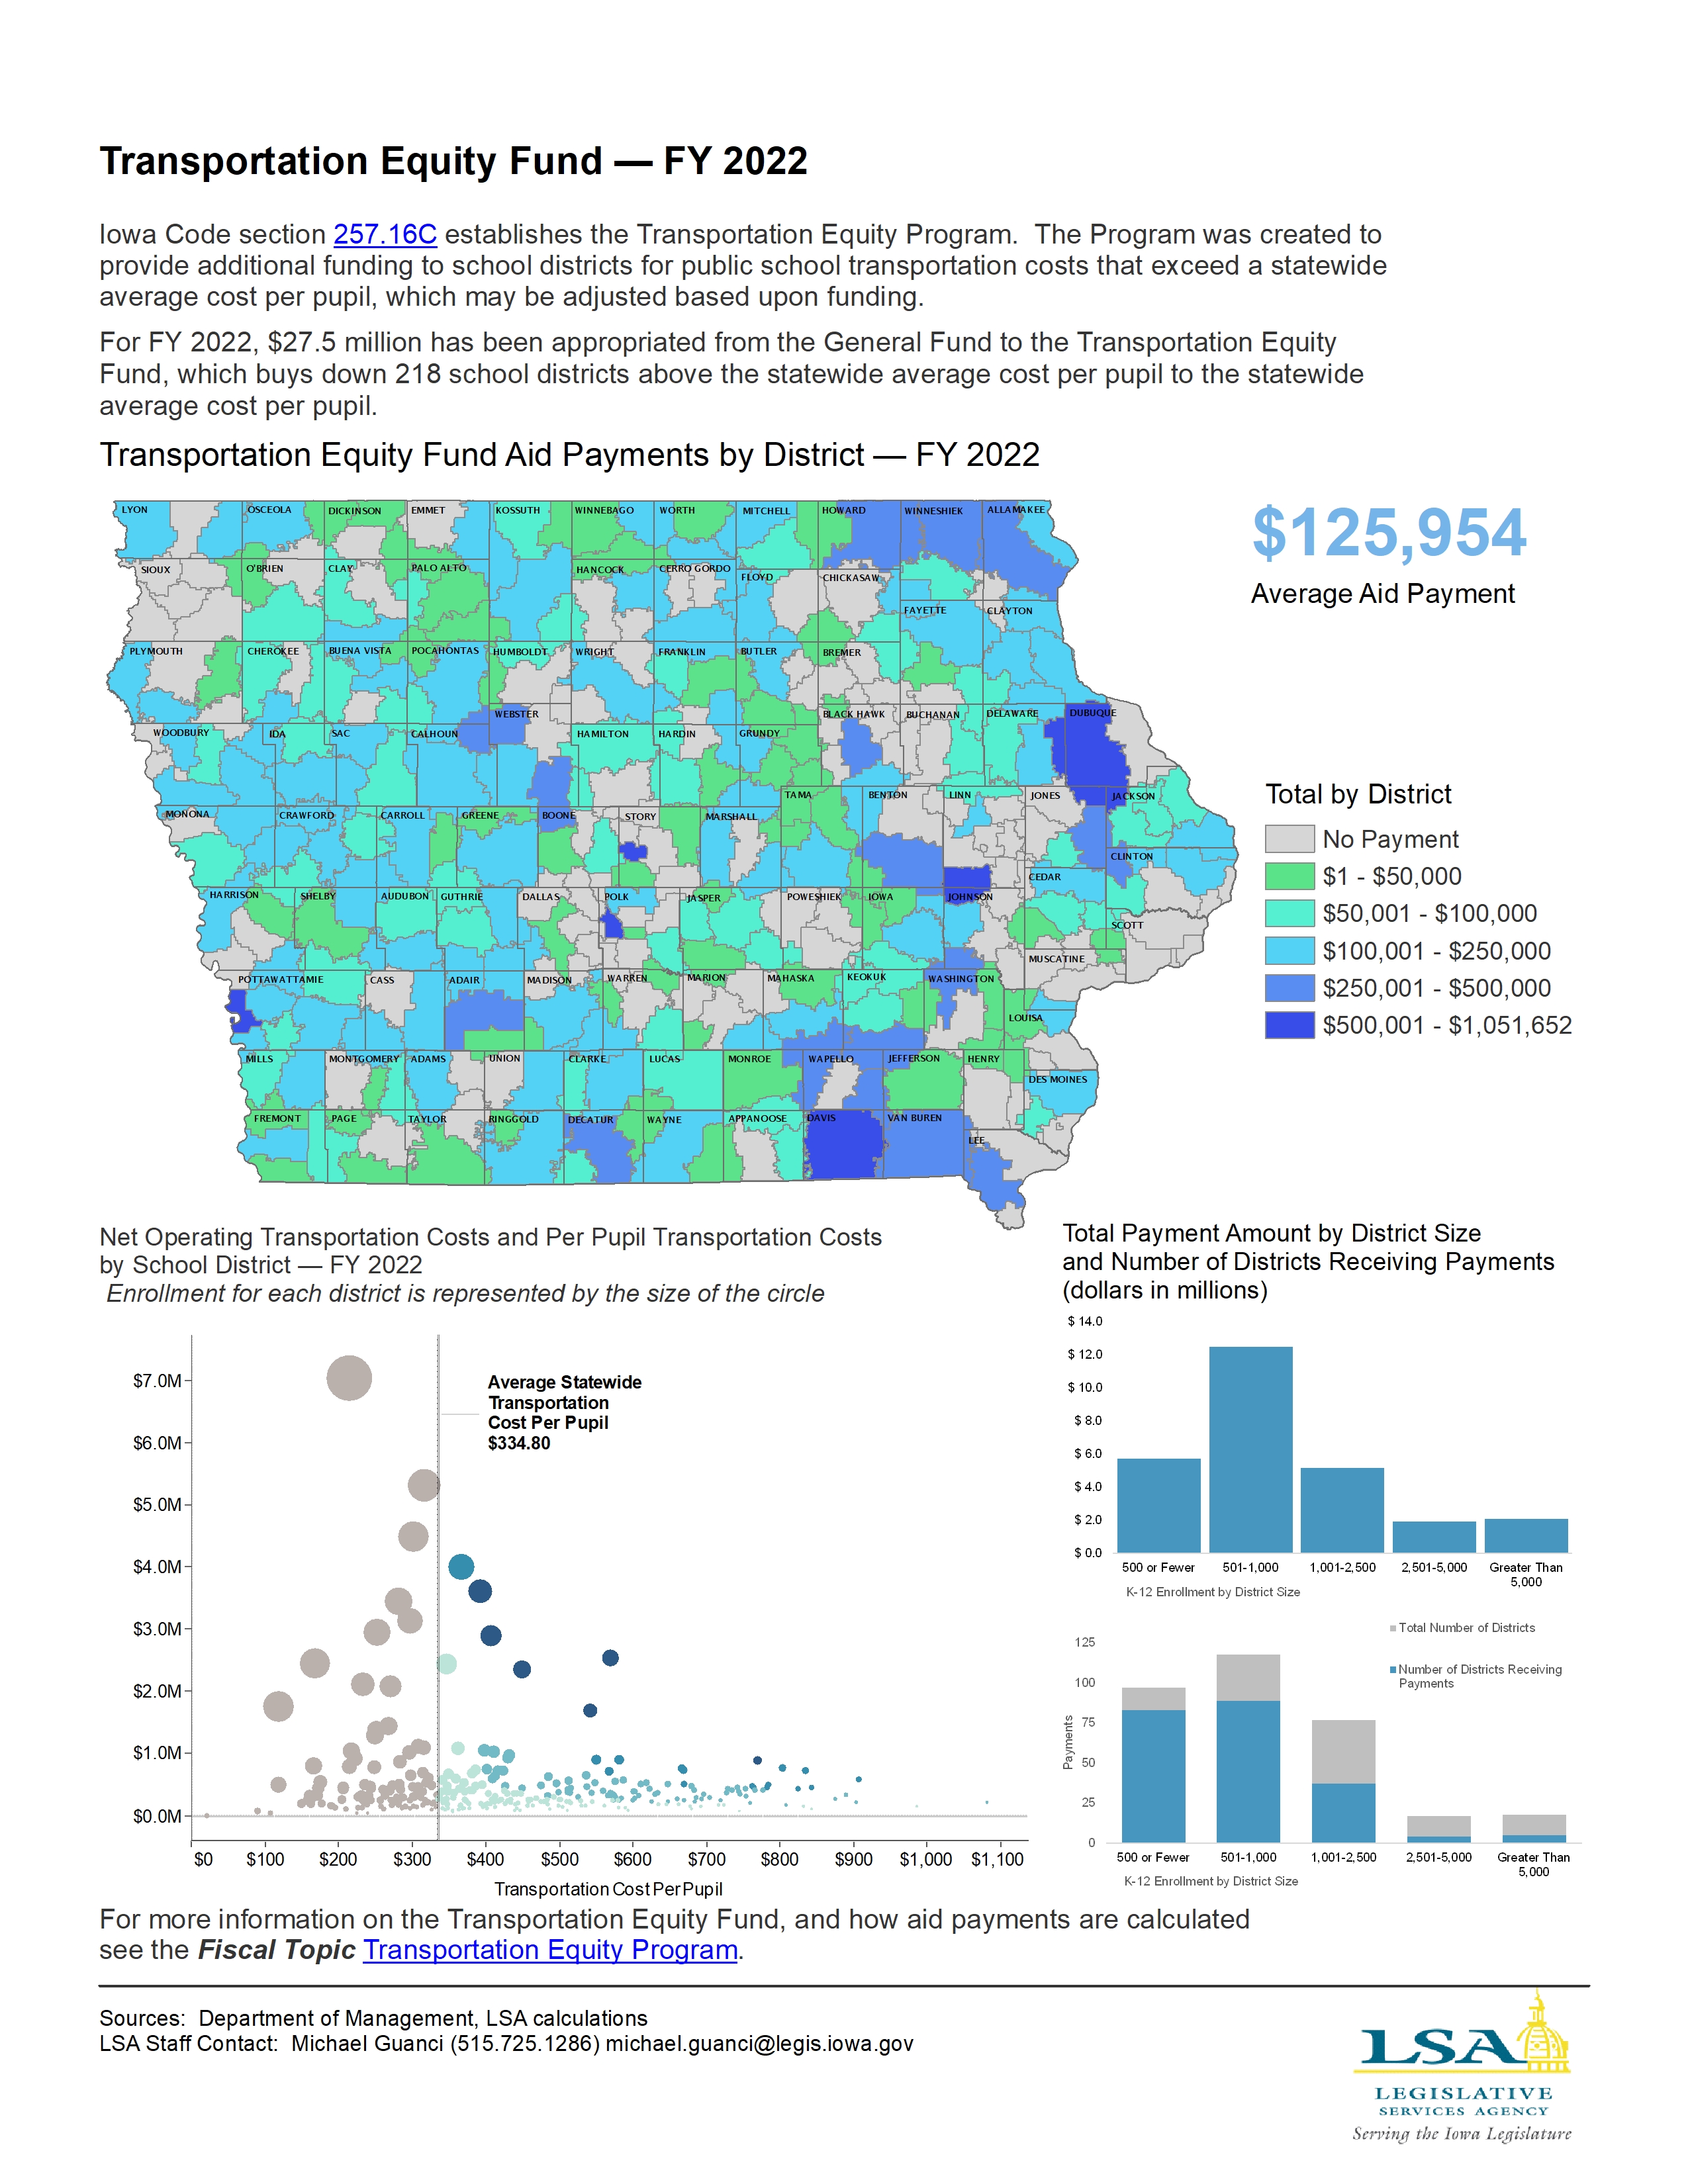
Transportation Equity Program
|
|
|
|
|
| 09/27/2021 |
Iowa Insights |
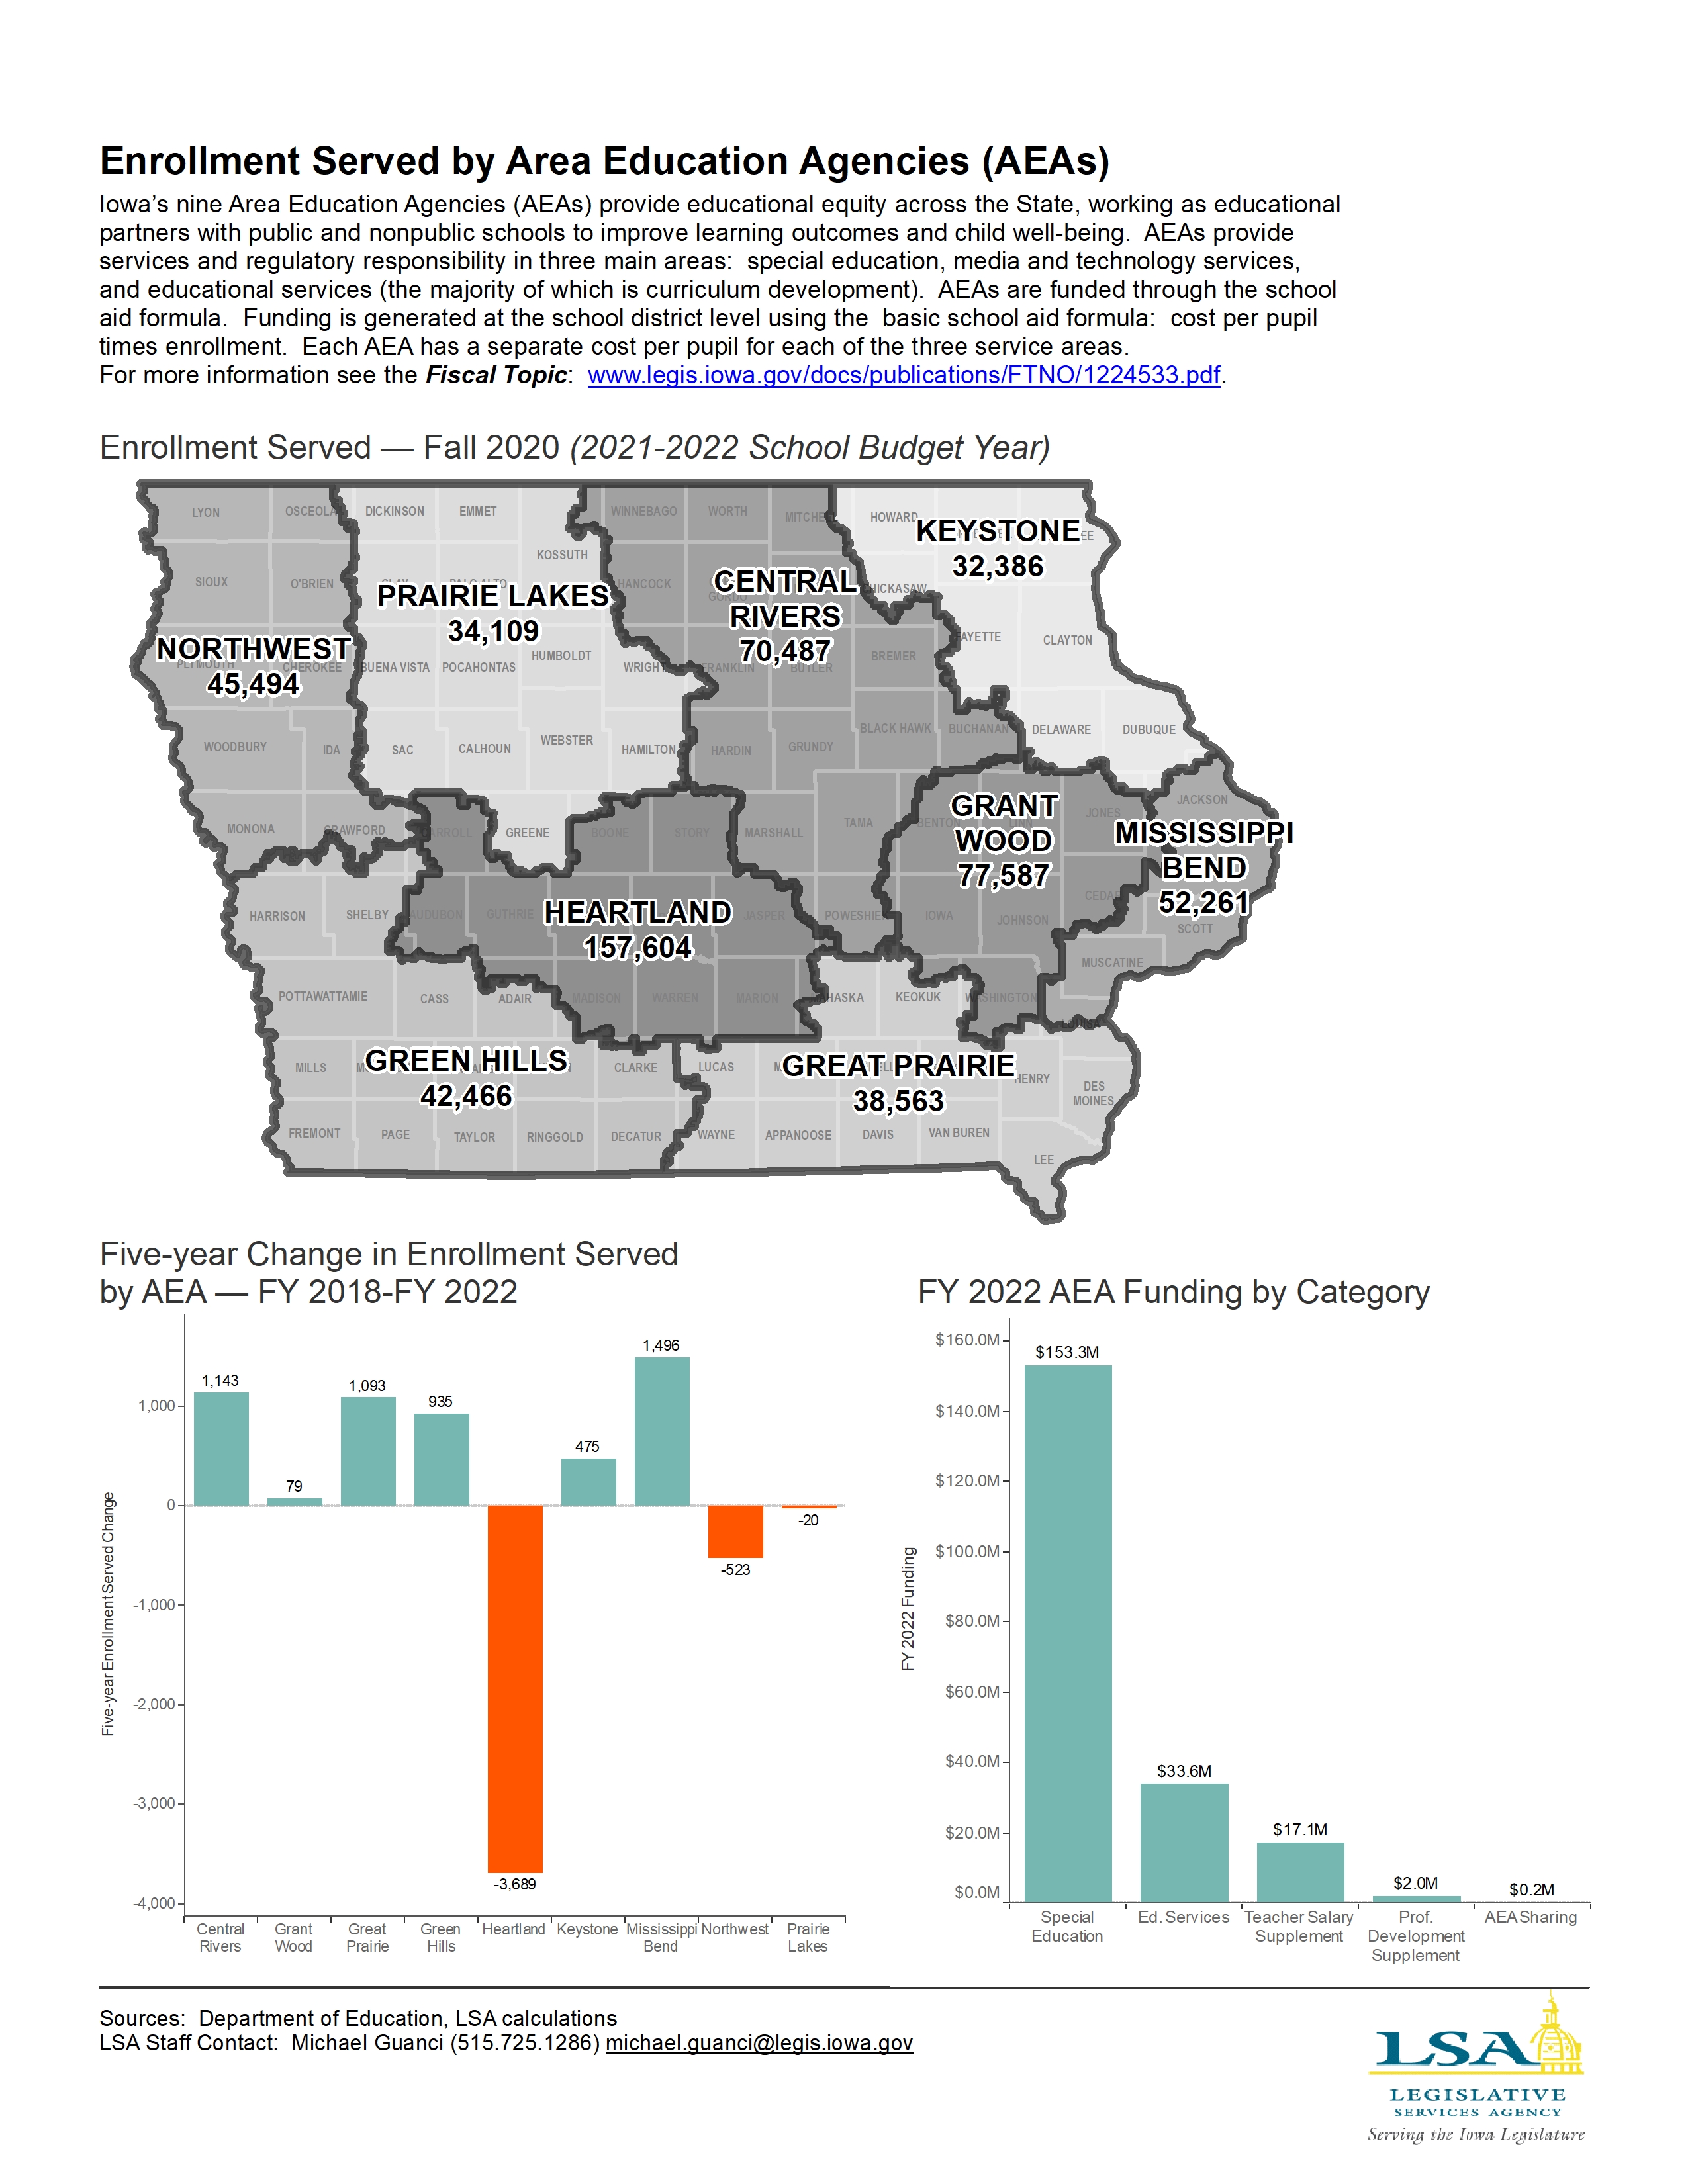
Enrollment Served by Area Education Agencies
|
|
|
|
|
| 09/13/2021 |
Iowa Insights |
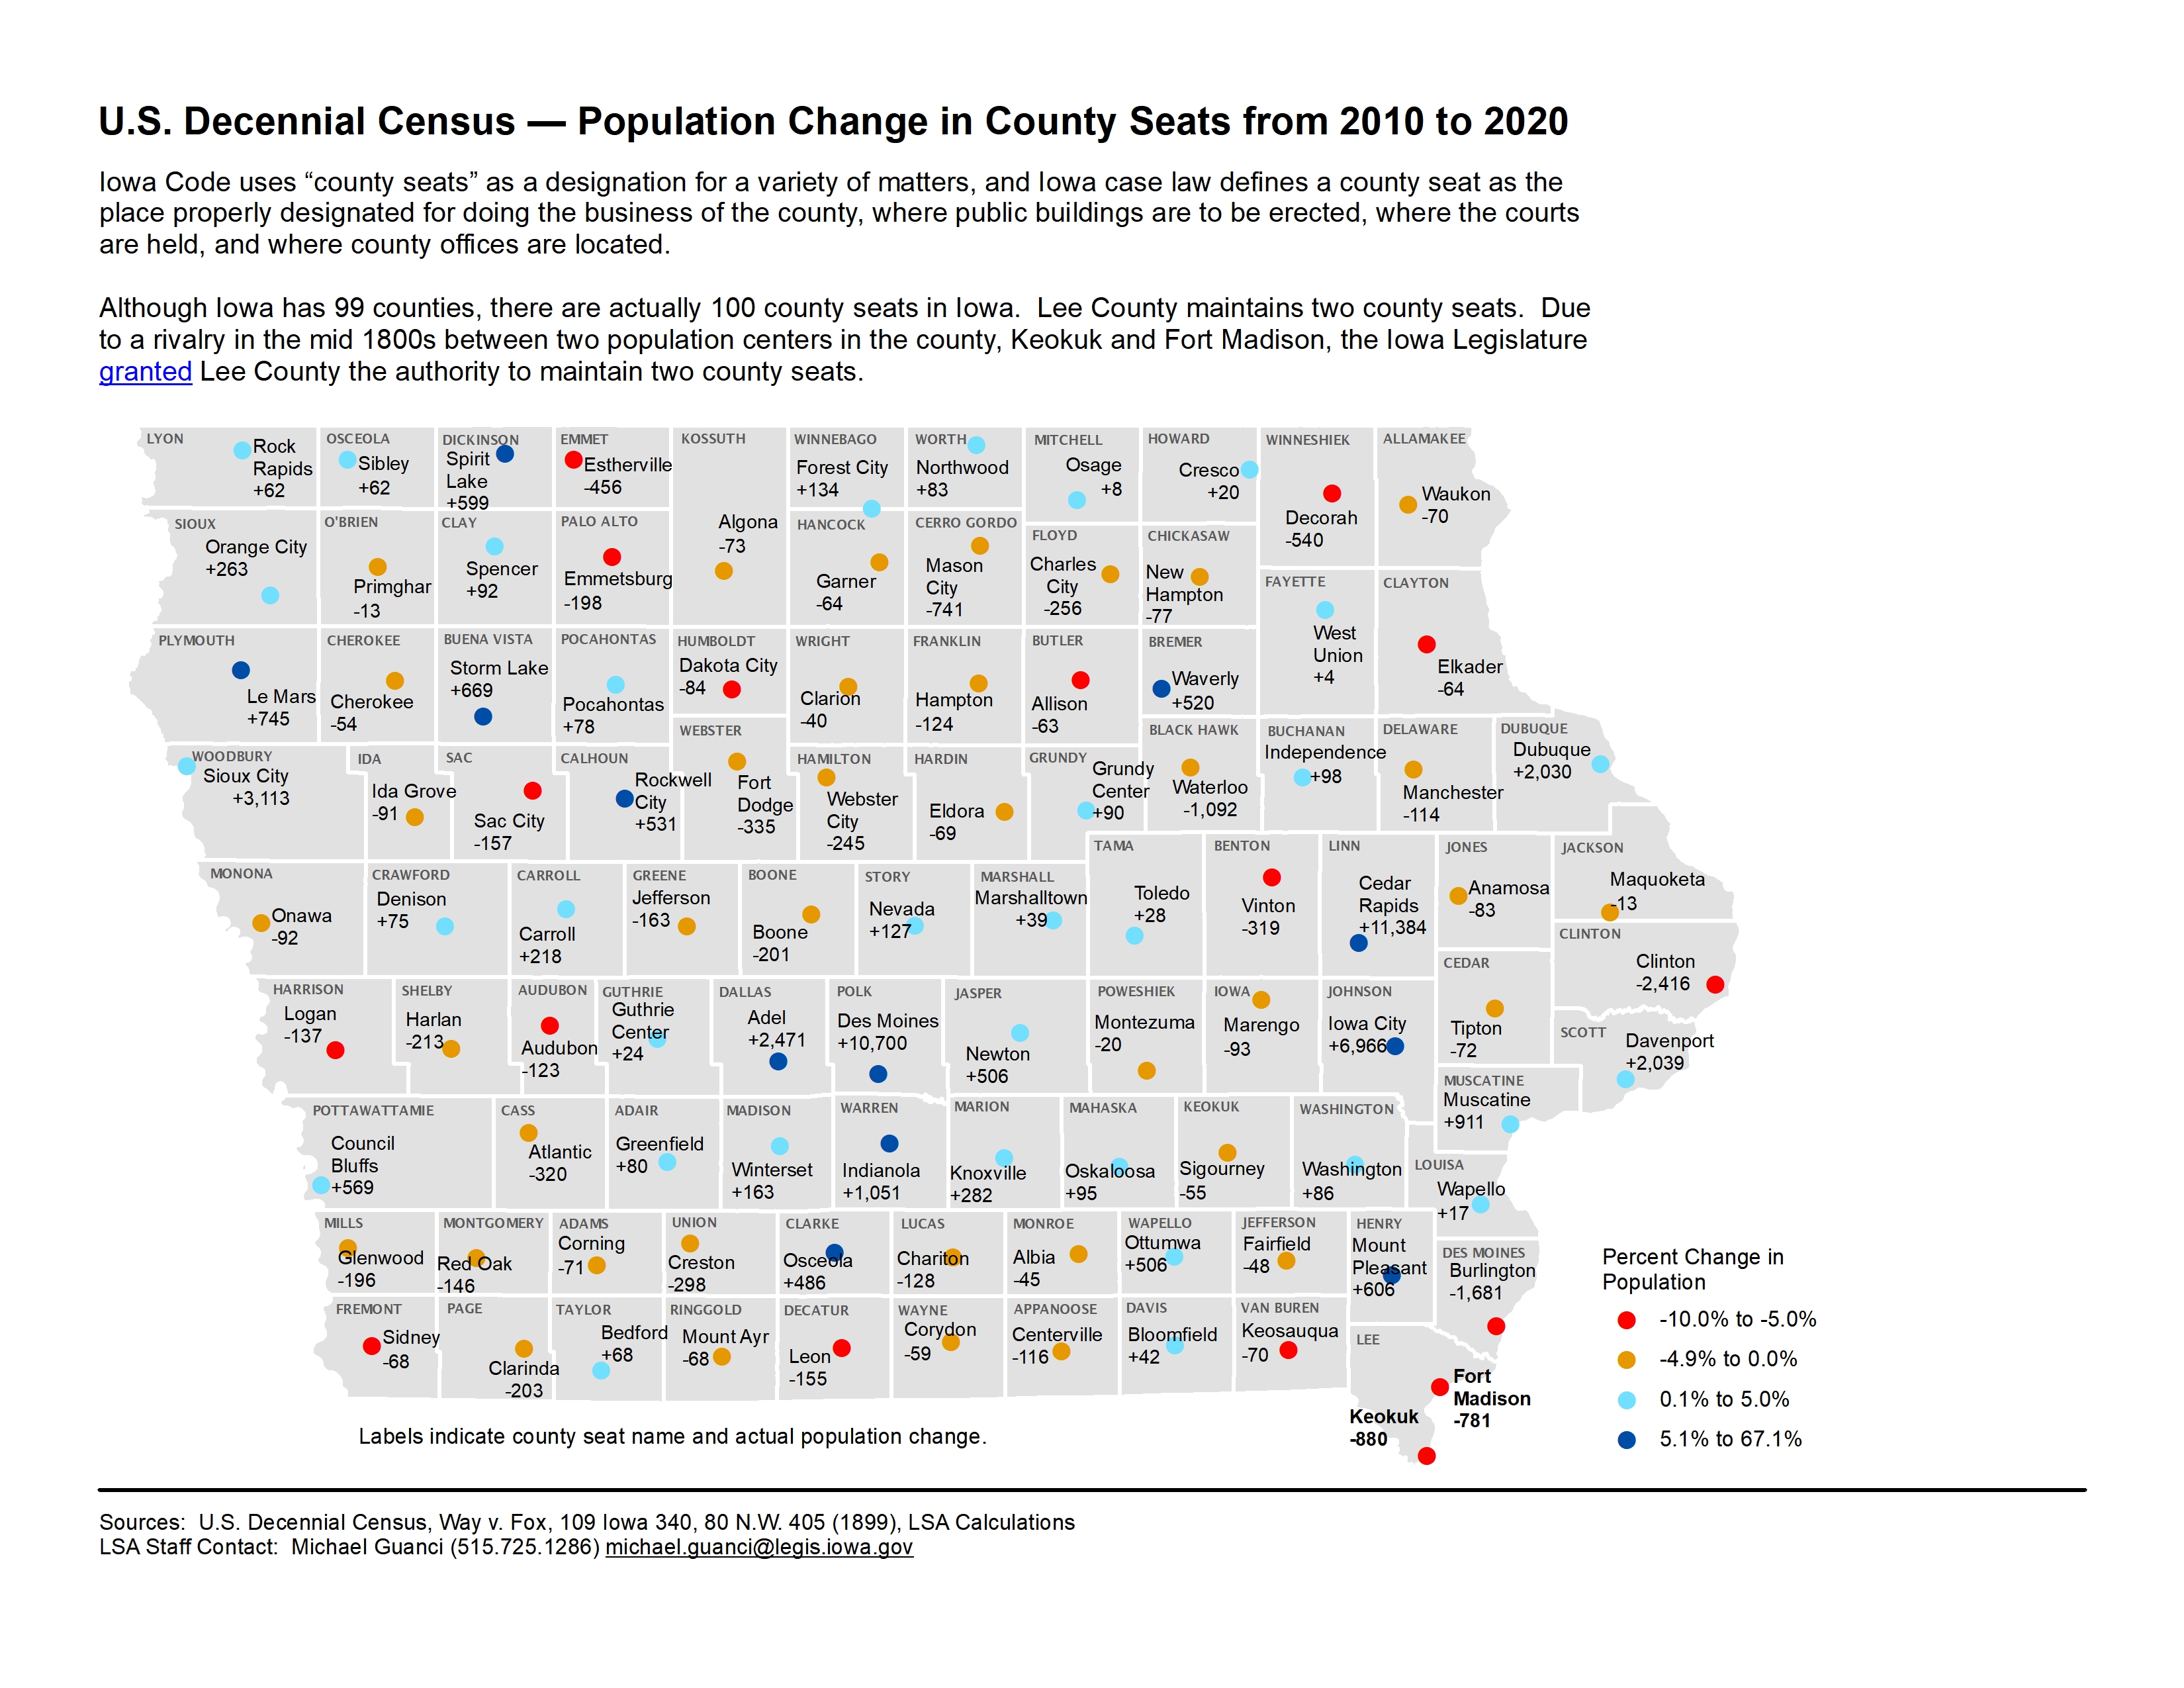
U.S. Decennial Census — Population Change in County Seats from 2010 to 2020
|
|
|
|
|
| 09/07/2021 |
Iowa Insights |
2020 U.S. Decennial Census by Township
|
|
|
|
|
| 08/30/2021 |
Iowa Insights |
Population Percent Change by U.S. Census Regions

|
|
|
|
|
| 08/23/2021 |
Iowa Insights |
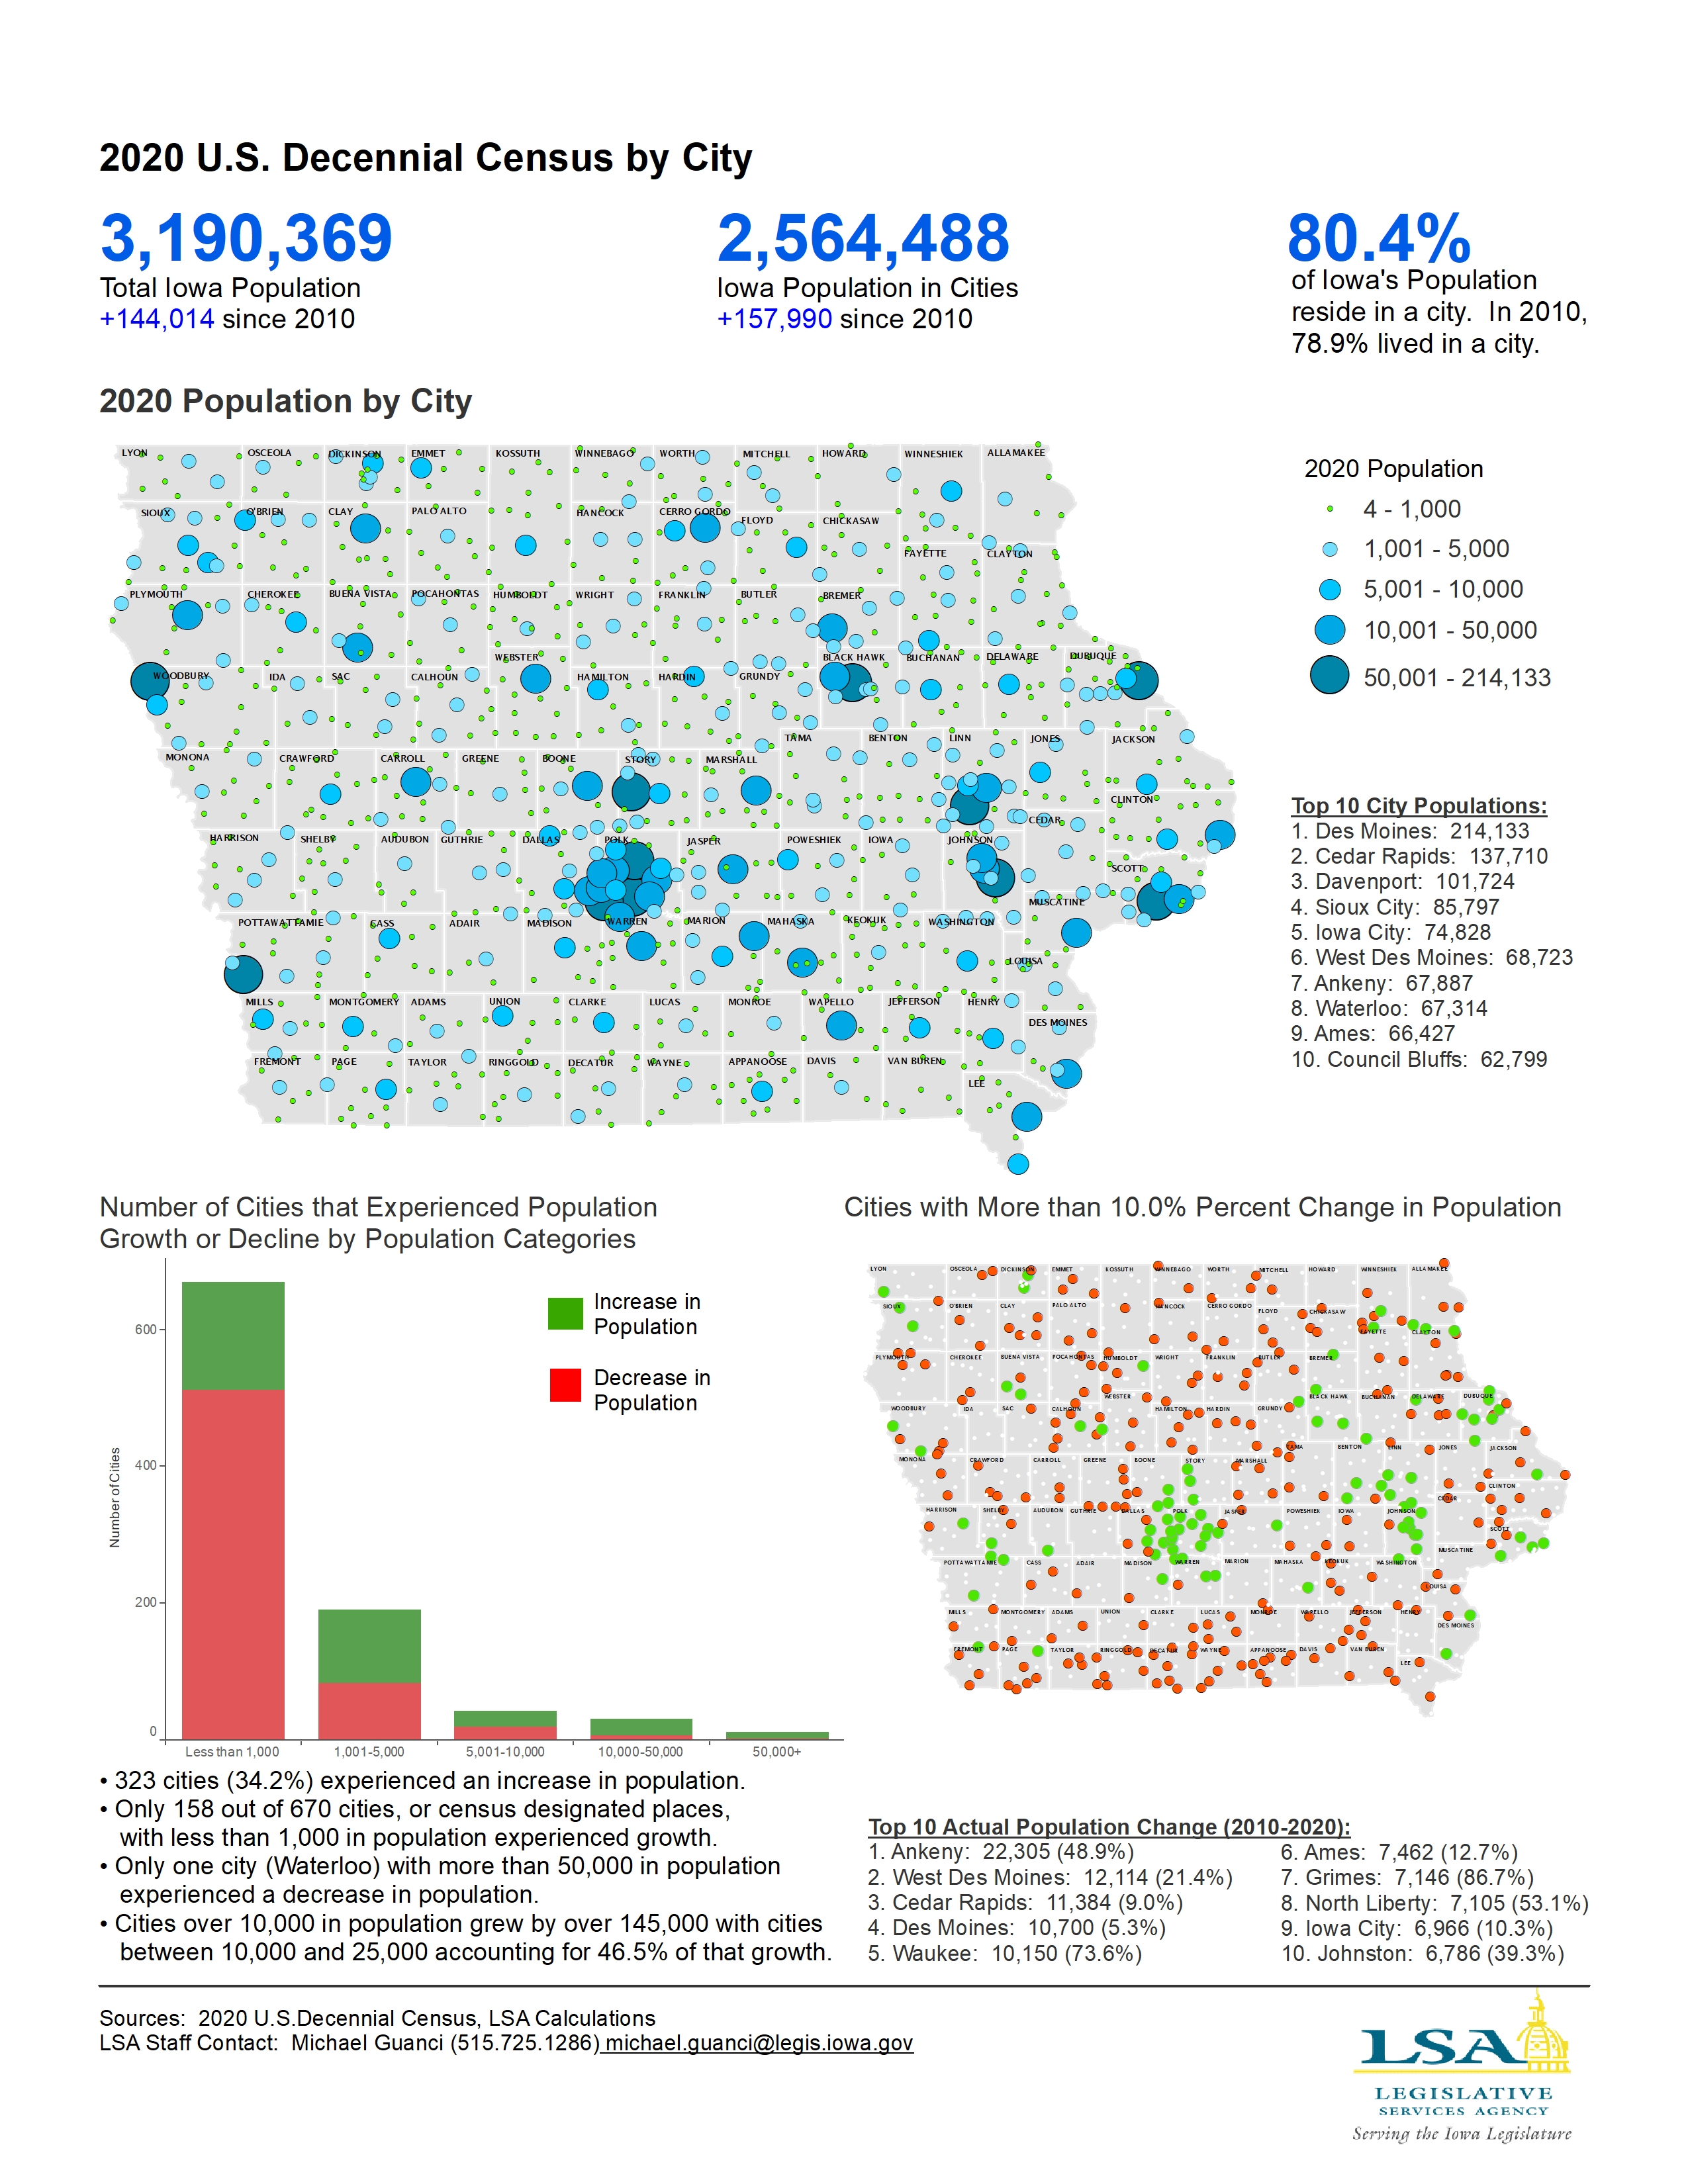
2020 U.S. Decennial Census by City
|
|
|
|
|
| 08/16/2021 |
Iowa Insights |
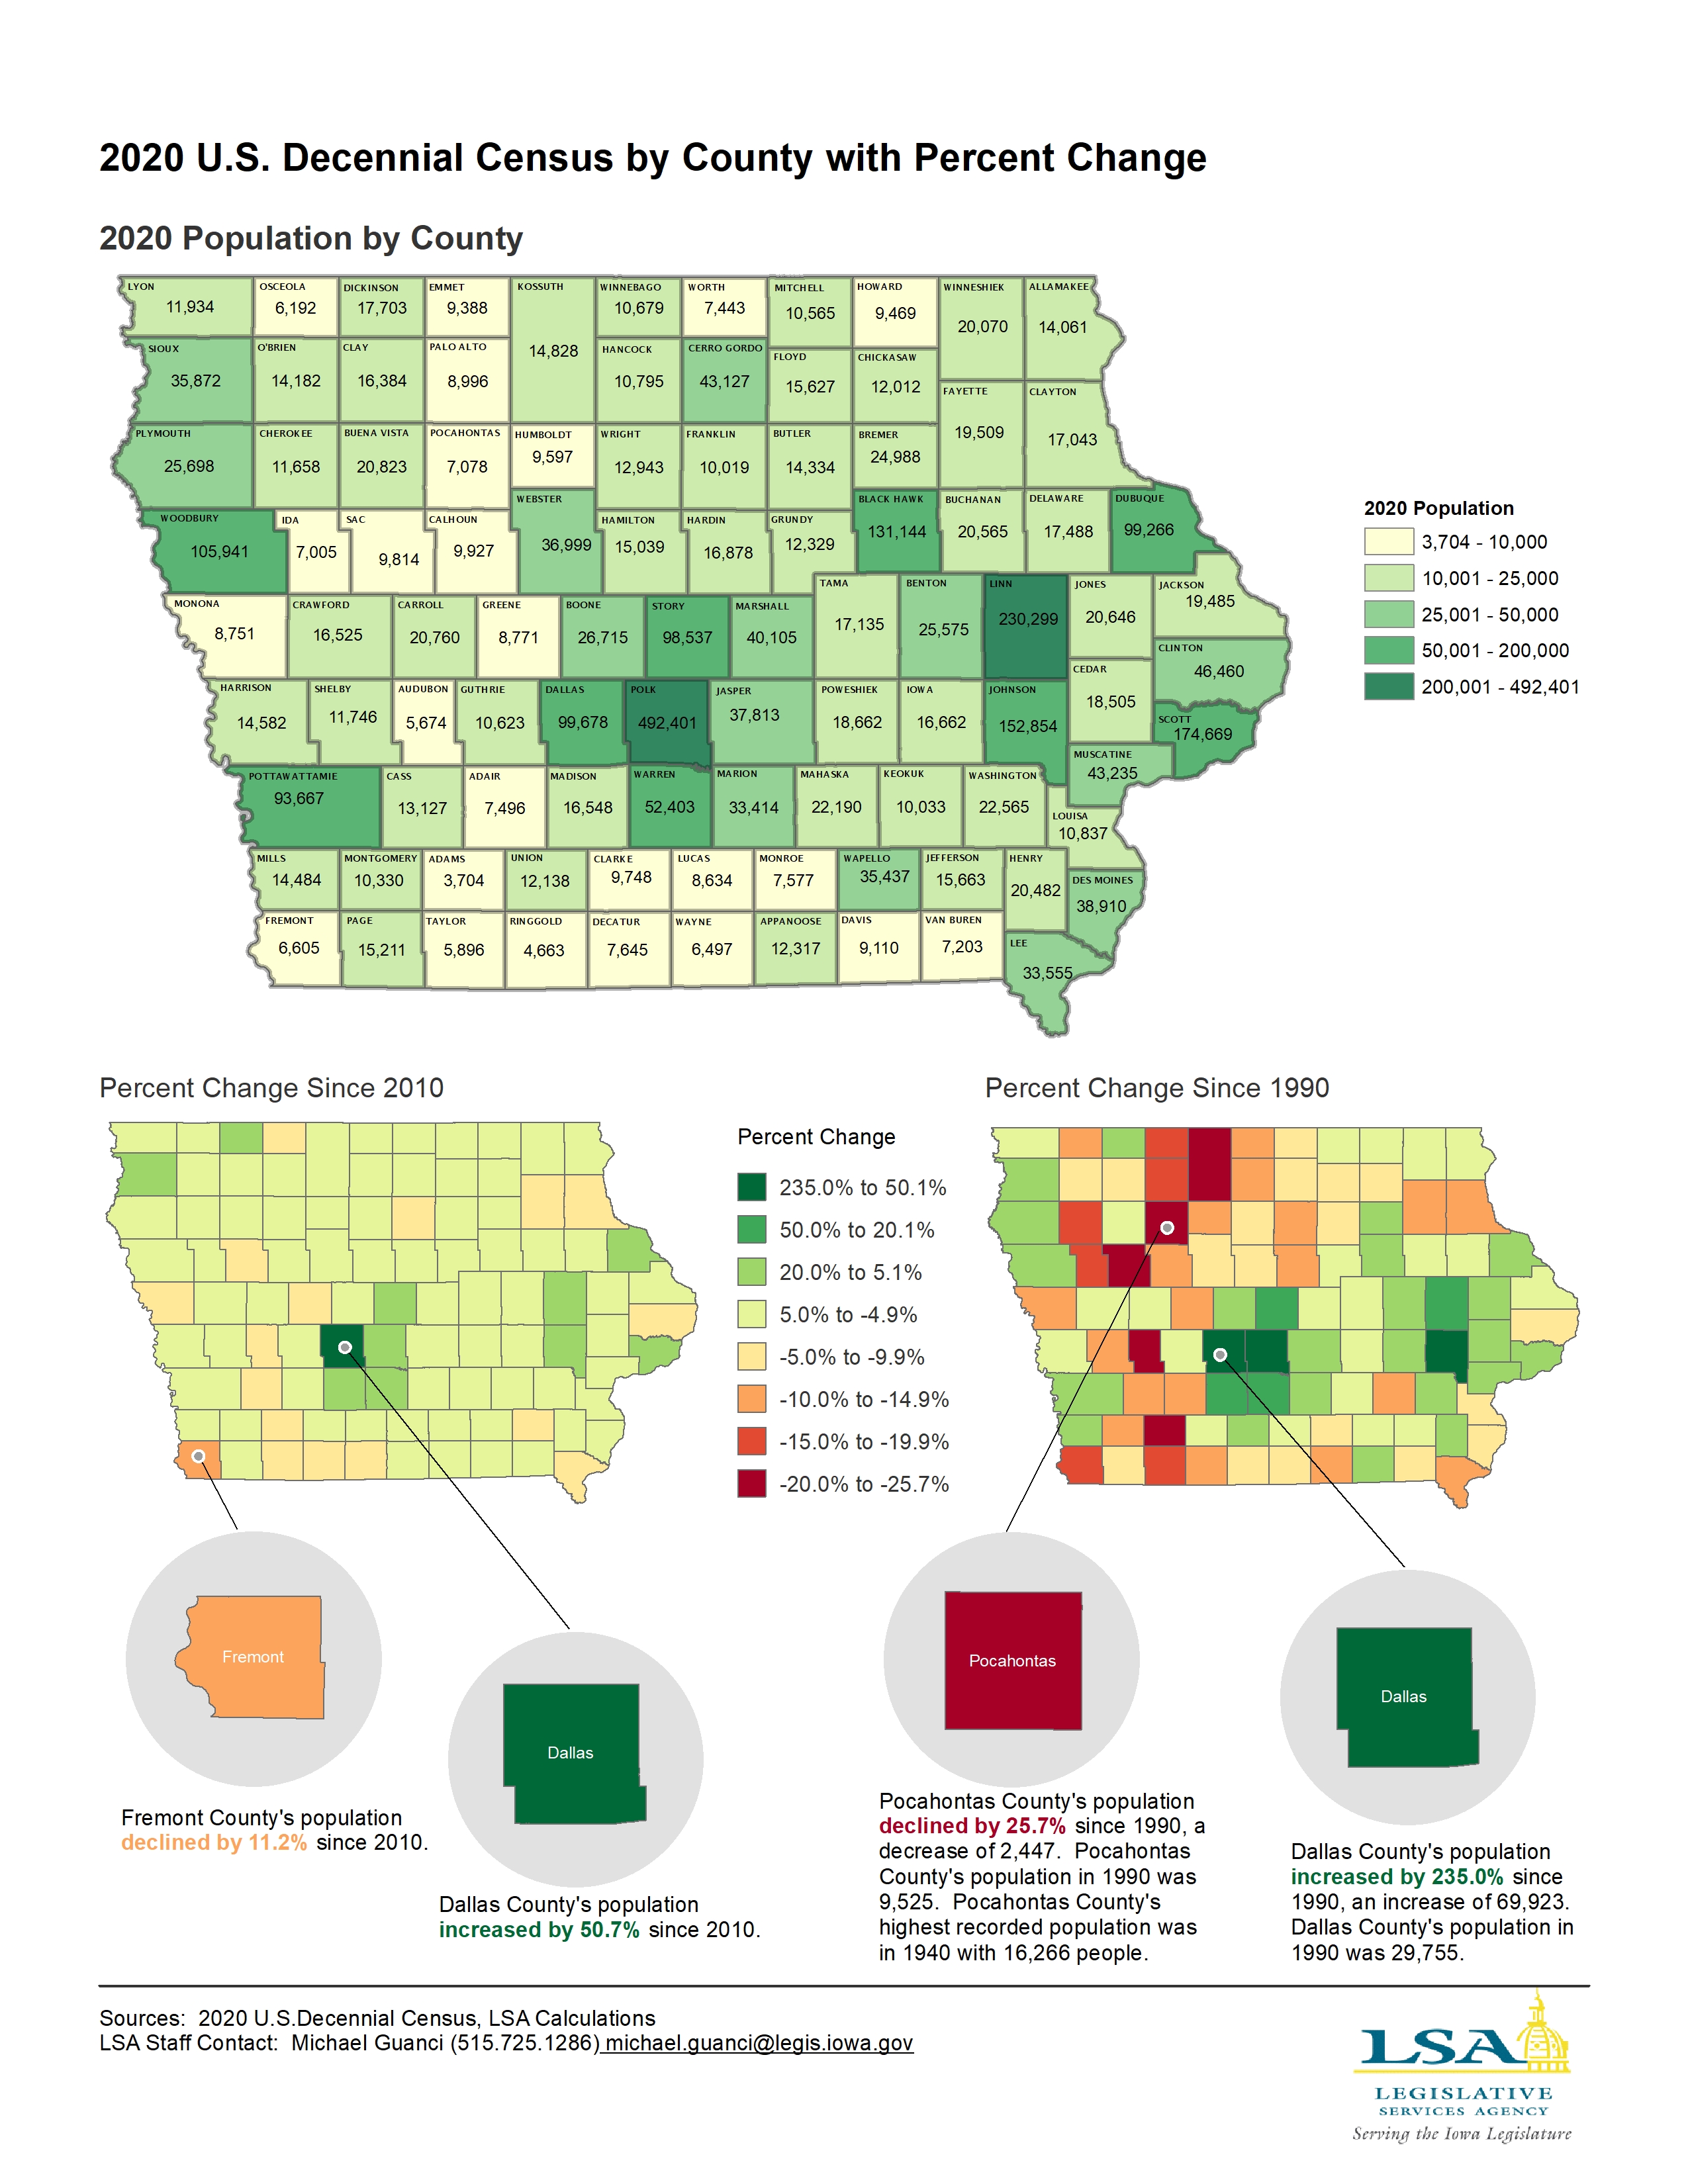
2020 U.S. Decennial Census by County with Percent Change
|
|
|
|
|
| 08/09/2021 |
Iowa Insights |
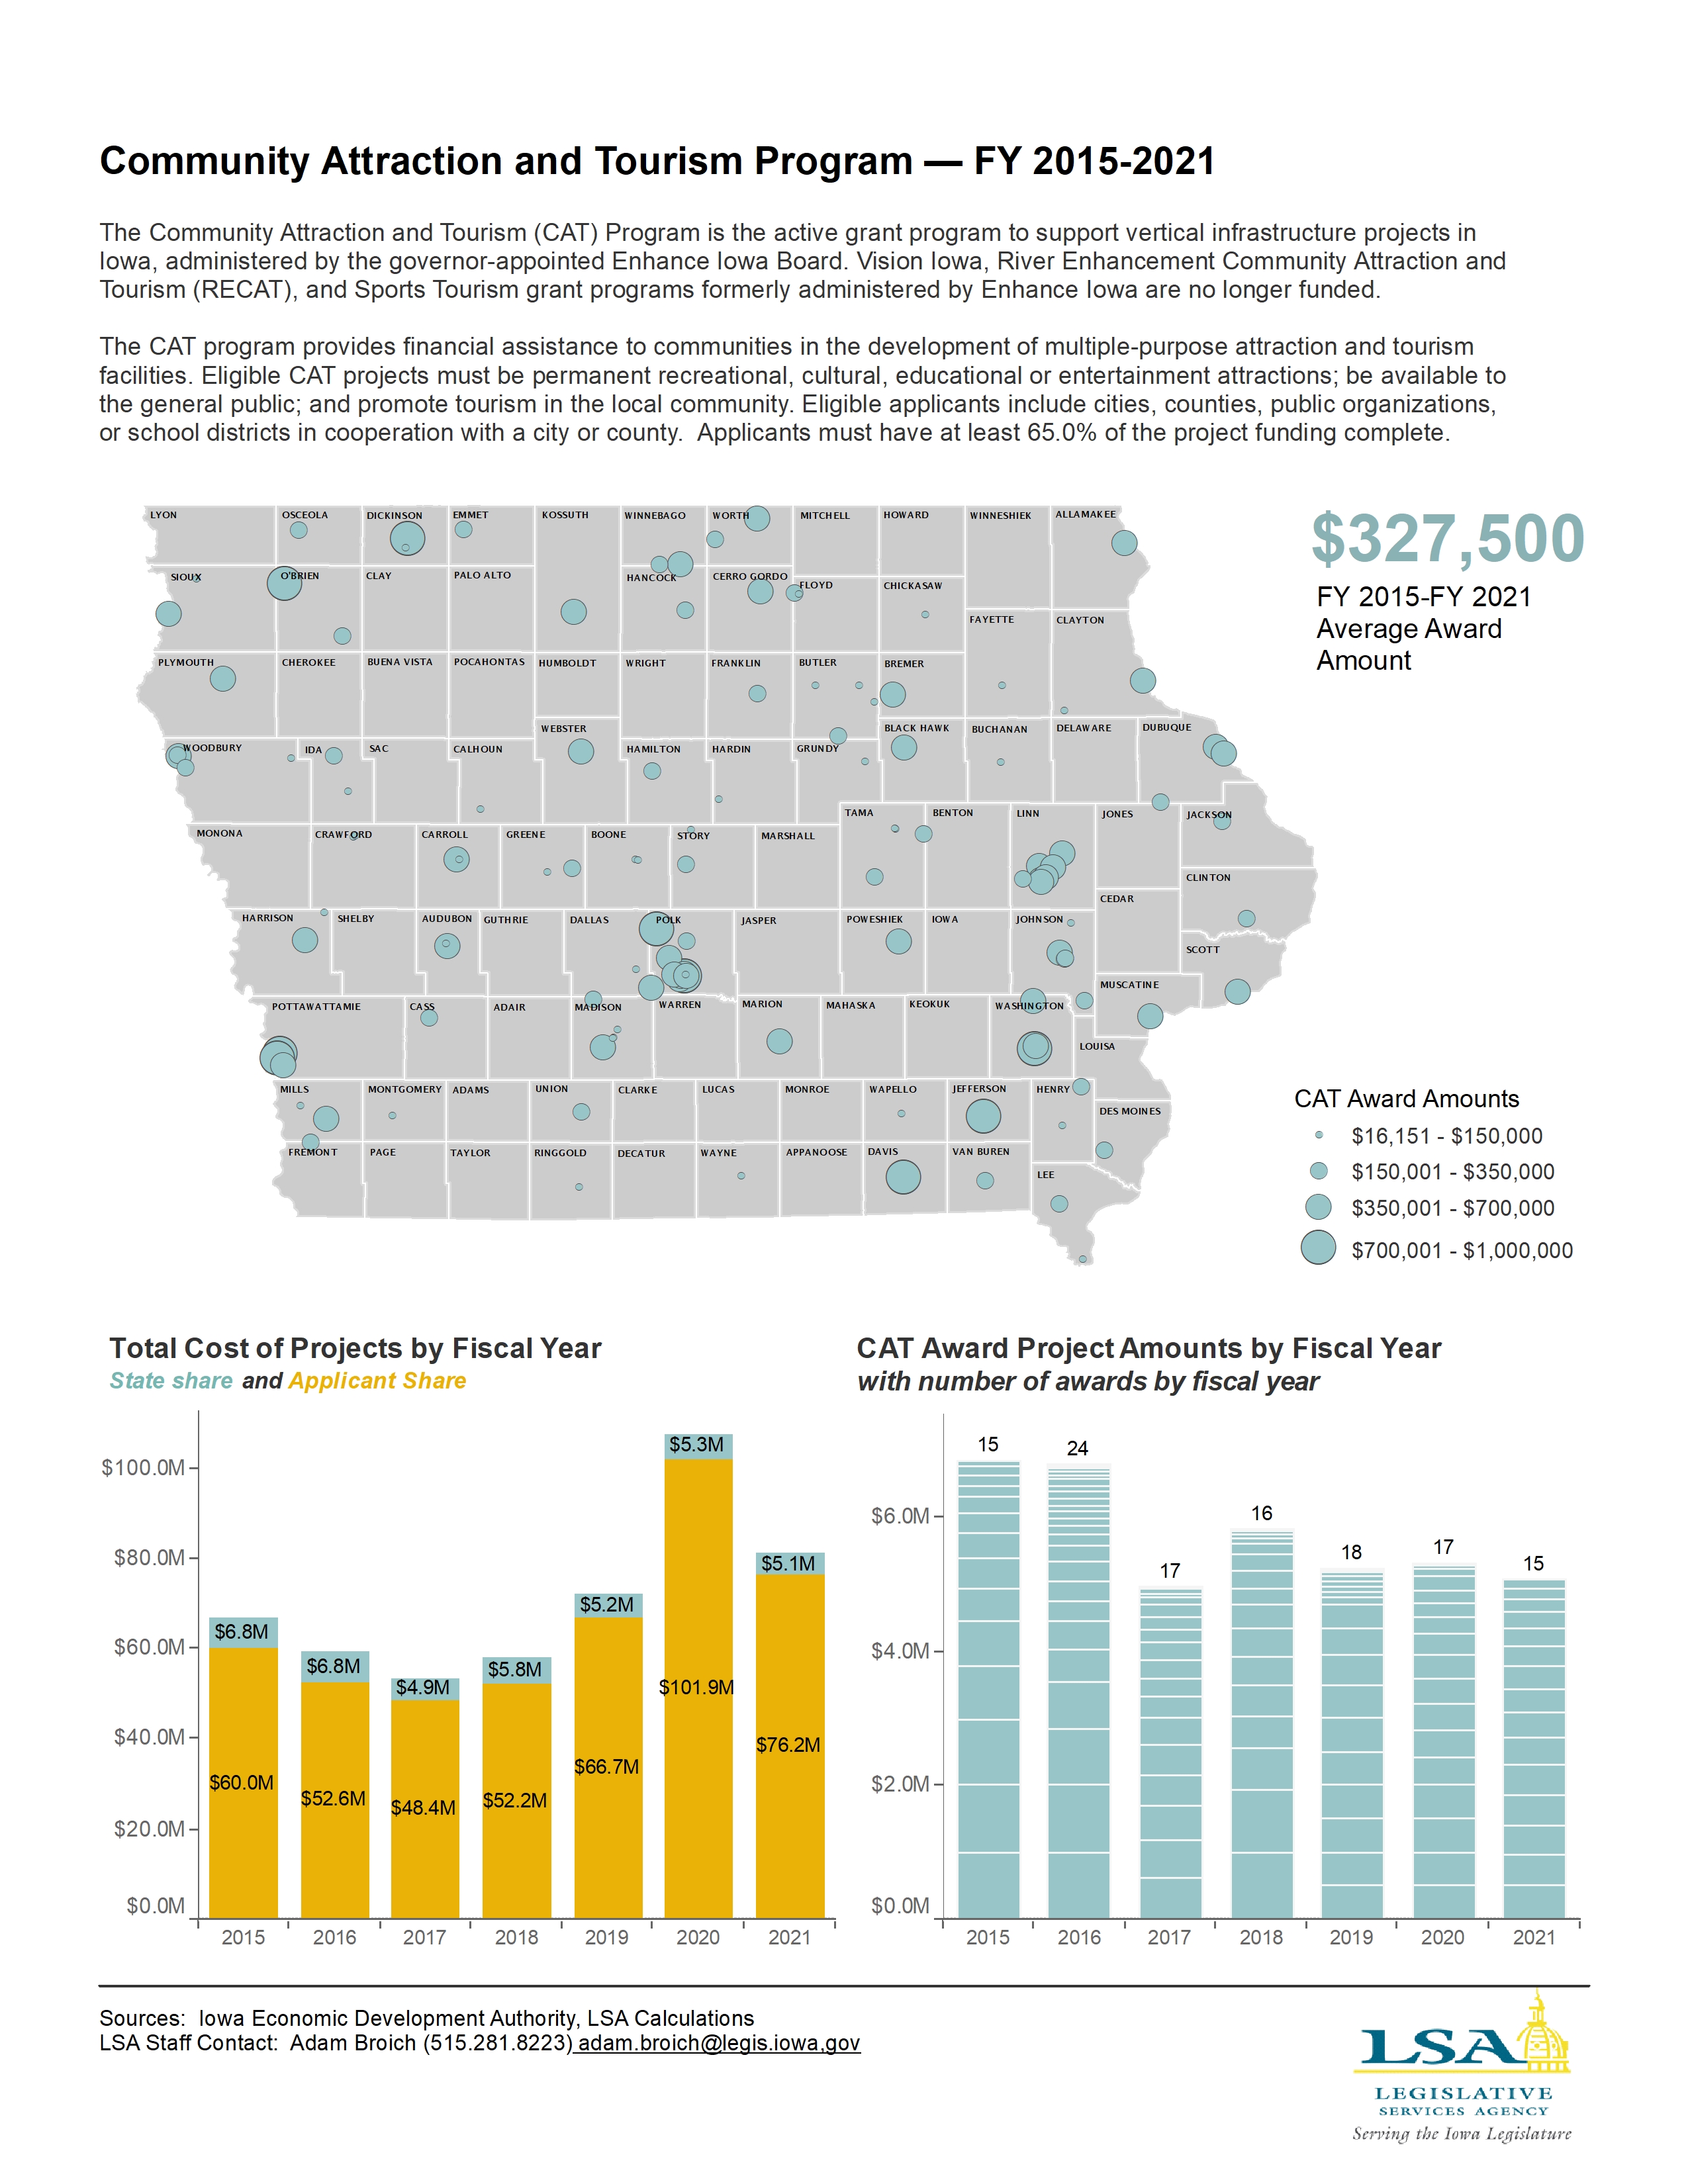
Community Action and Tourism Program
|
|
|
|
|
| 08/03/2021 |
Iowa Insights |
FY2022 Flow of General Fund Surplus
|
|
|
|
|
| 07/26/2021 |
Iowa Insights |
FY2022 Estimated General Fund Appropriations
|
|
|
|
|
| 07/20/2021 |
Iowa Insights |
FY2022 Estimated Total Net General Fund Receipts
|
|
|
|
|
| 07/05/2021 |
Iowa Insights |
Iowa Prison Admissions and Releases — FY 2021

|
|
|
|
|
| 06/22/2021 |
Iowa Insights |
"Core" Iowa Mental Health and Disability Services (MHDS) — FY 2020
|
|
|
|
|
| 06/14/2021 |
Iowa Insights |
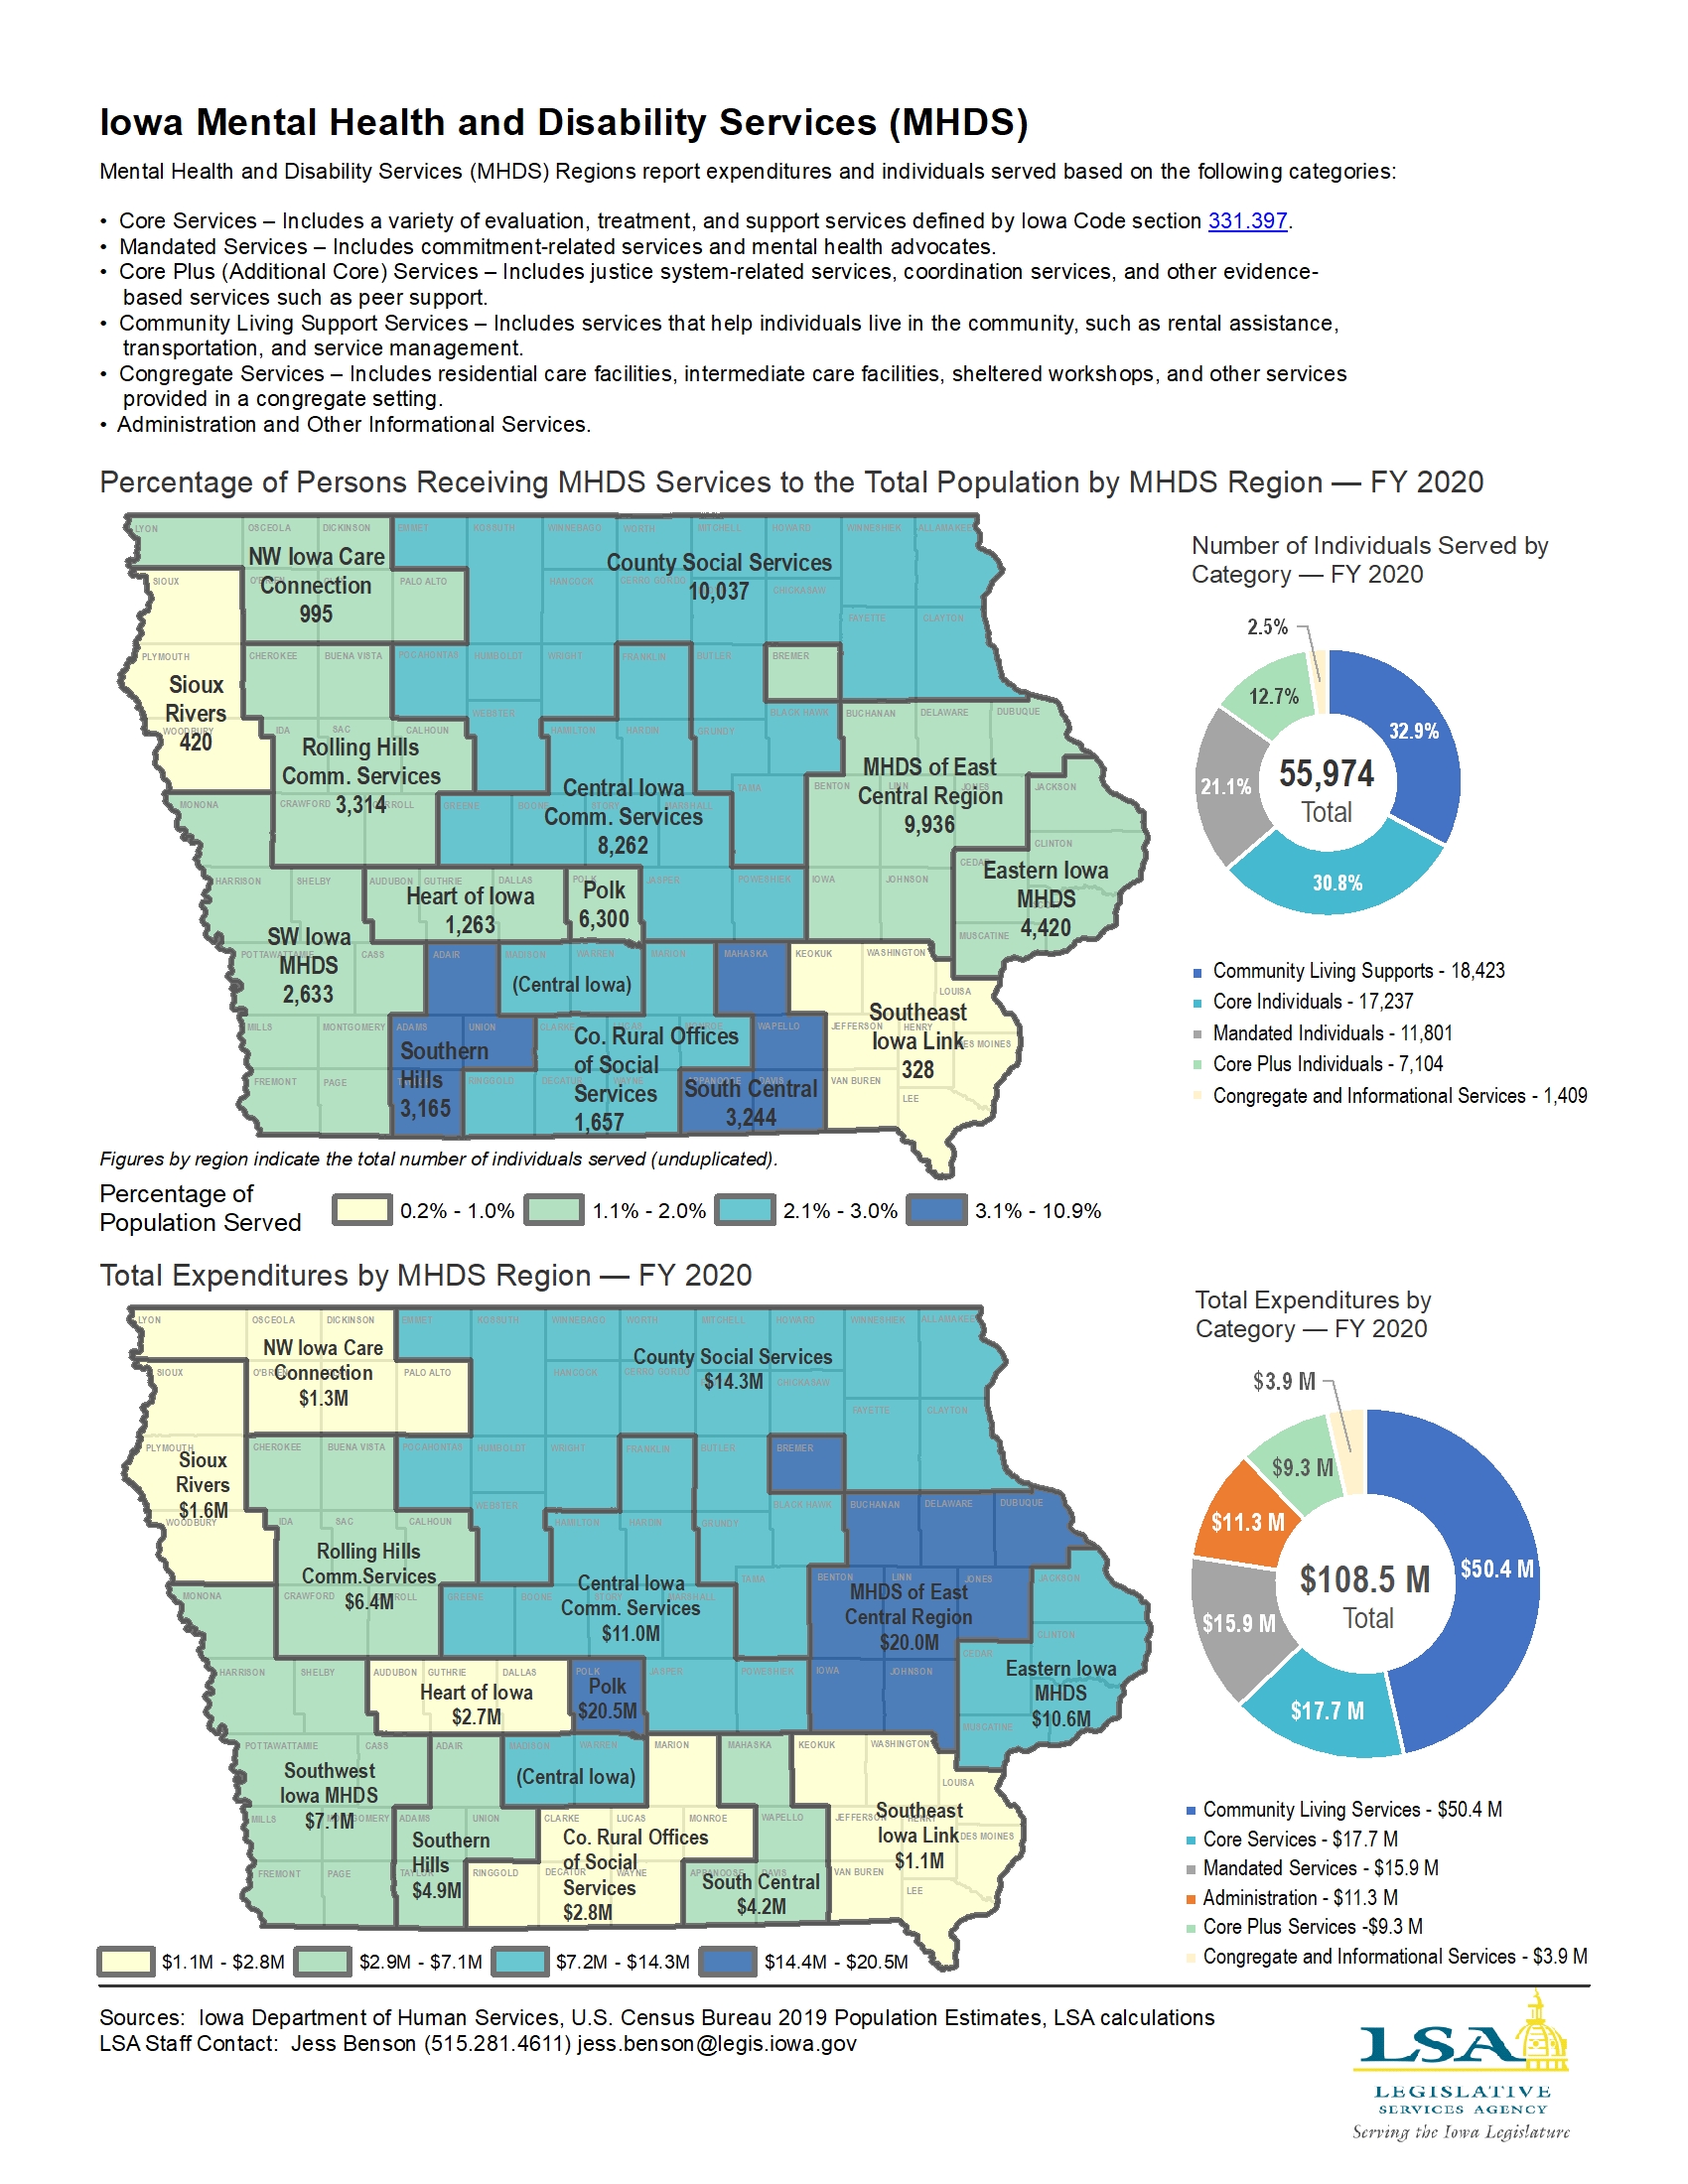
Iowa Mental Health and Disabilty Services (MHDS) — FY 2020
|
|
|
|
|
| 06/07/2021 |
Iowa Insights |
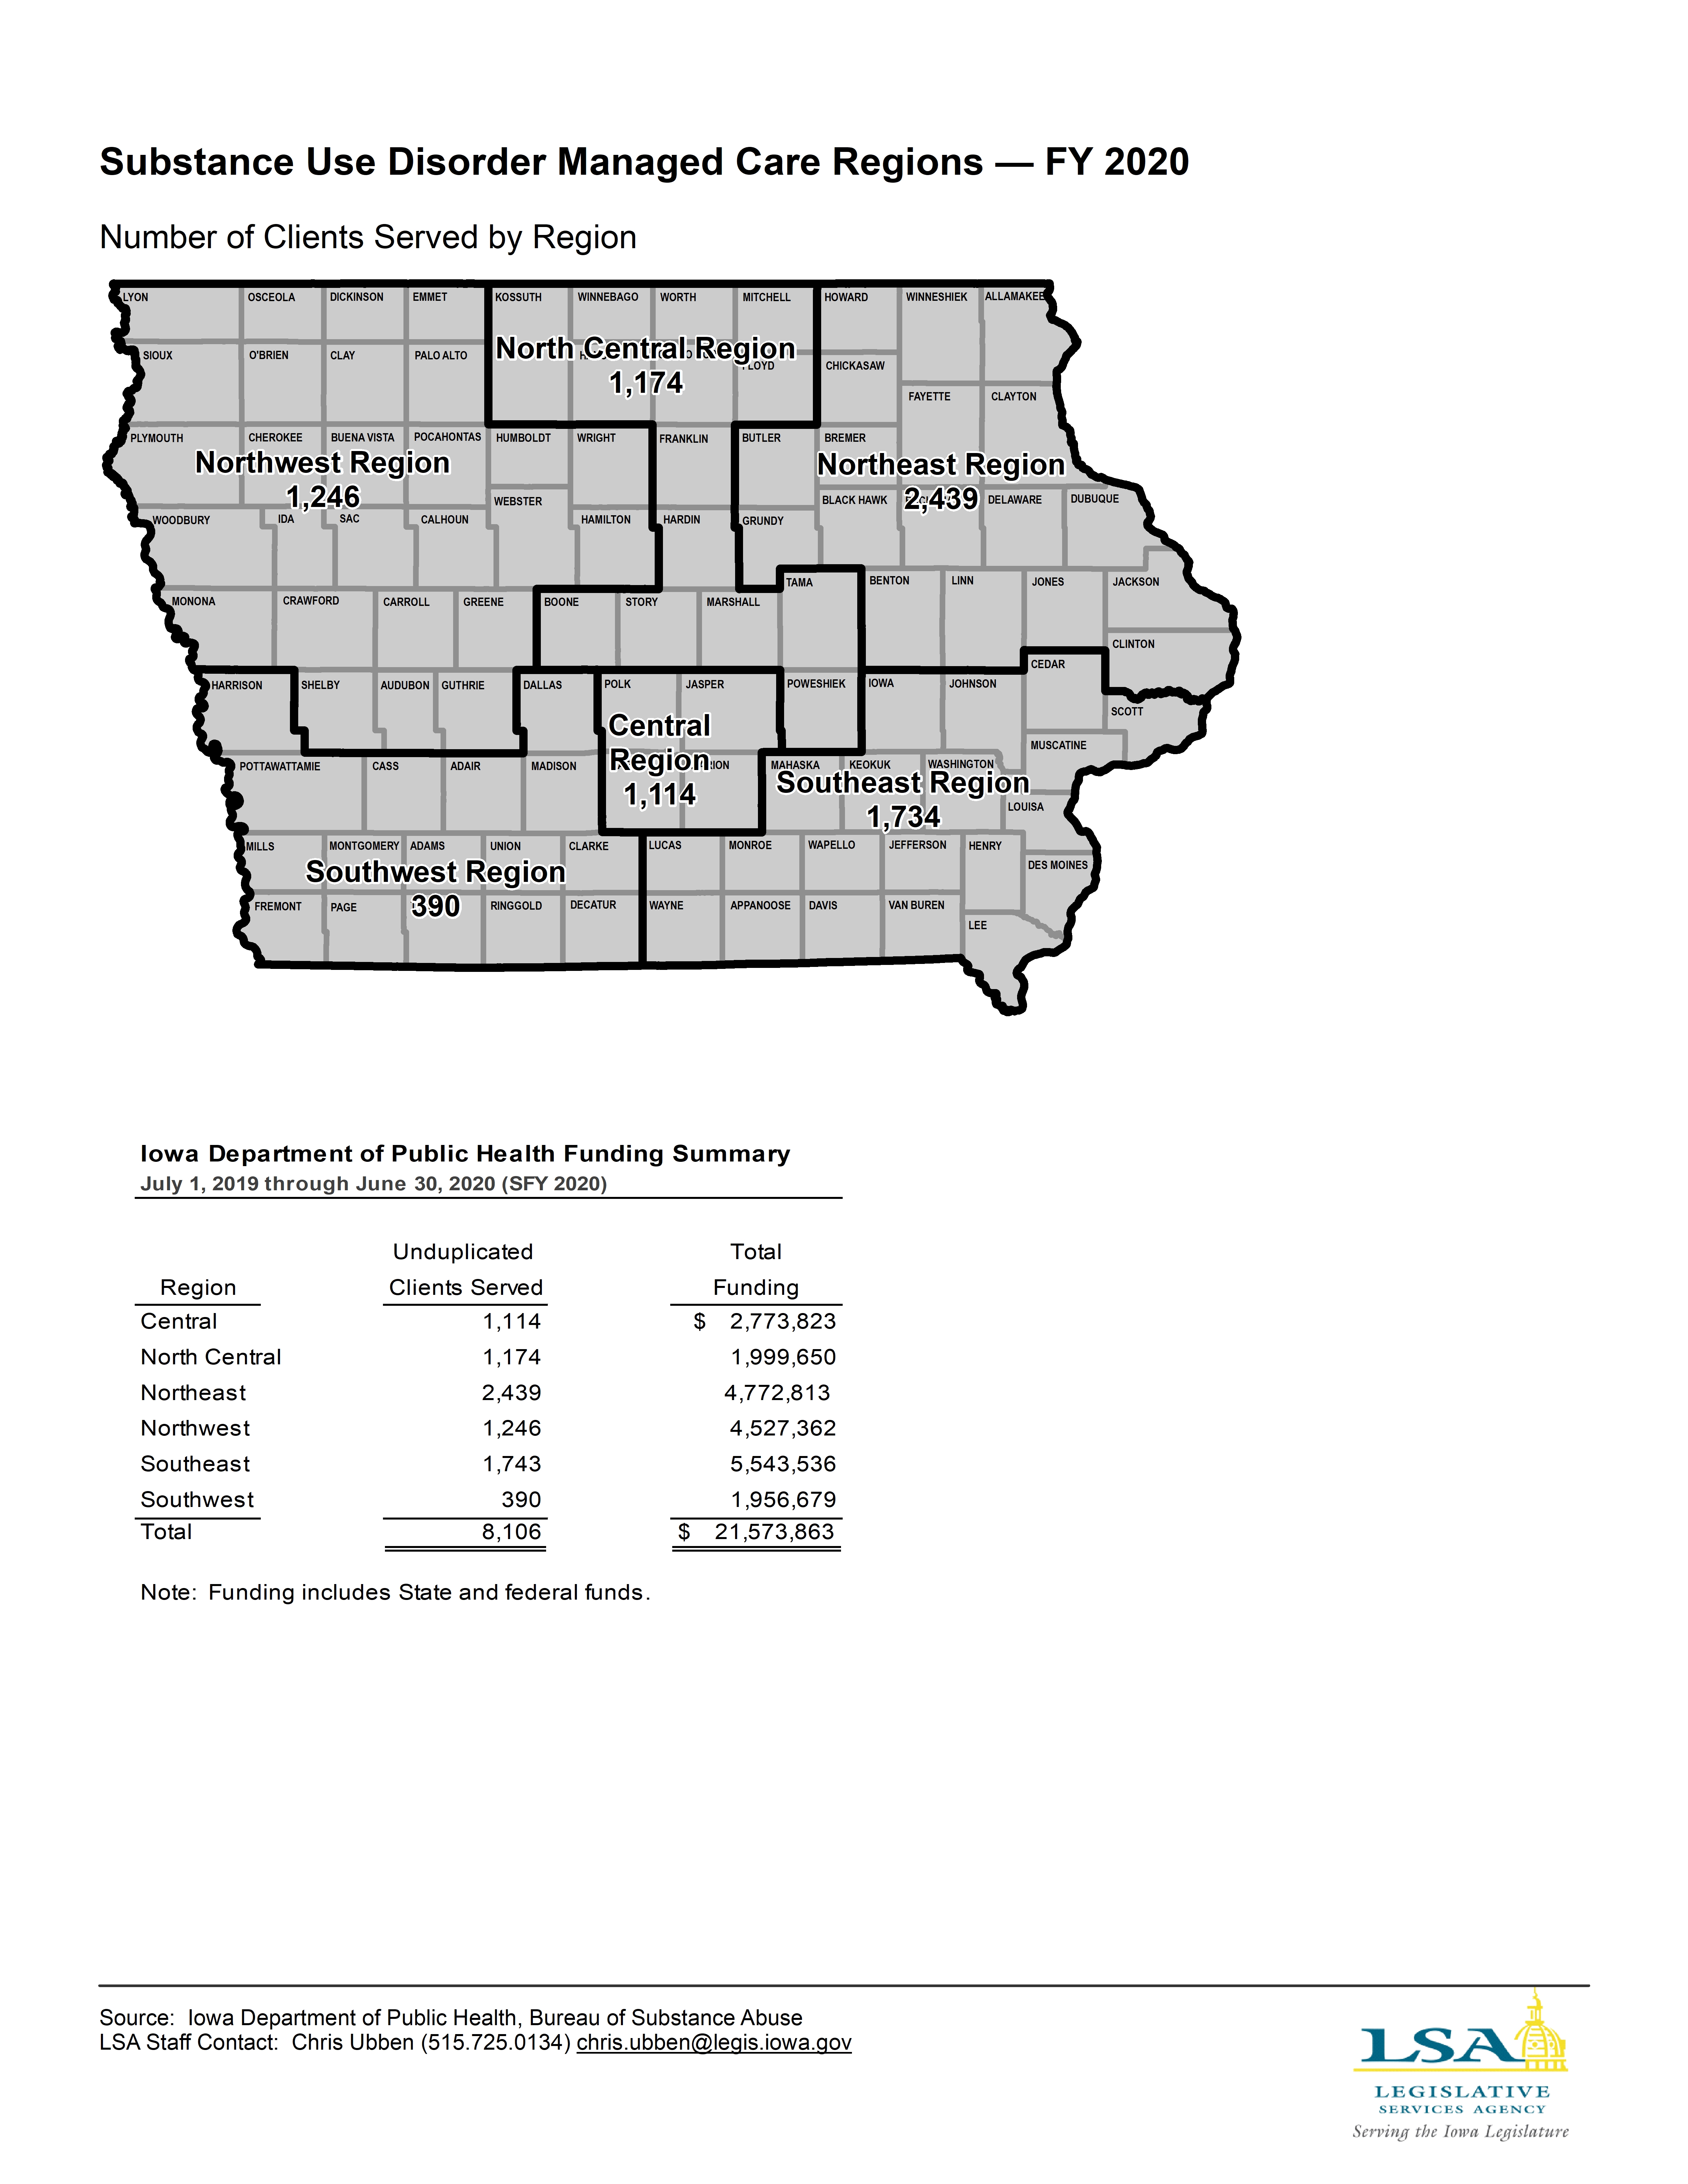
Substance Abuse Treatment and Managed Care Regions
|
|
|
|
|
| 05/24/2021 |
Iowa Insights |
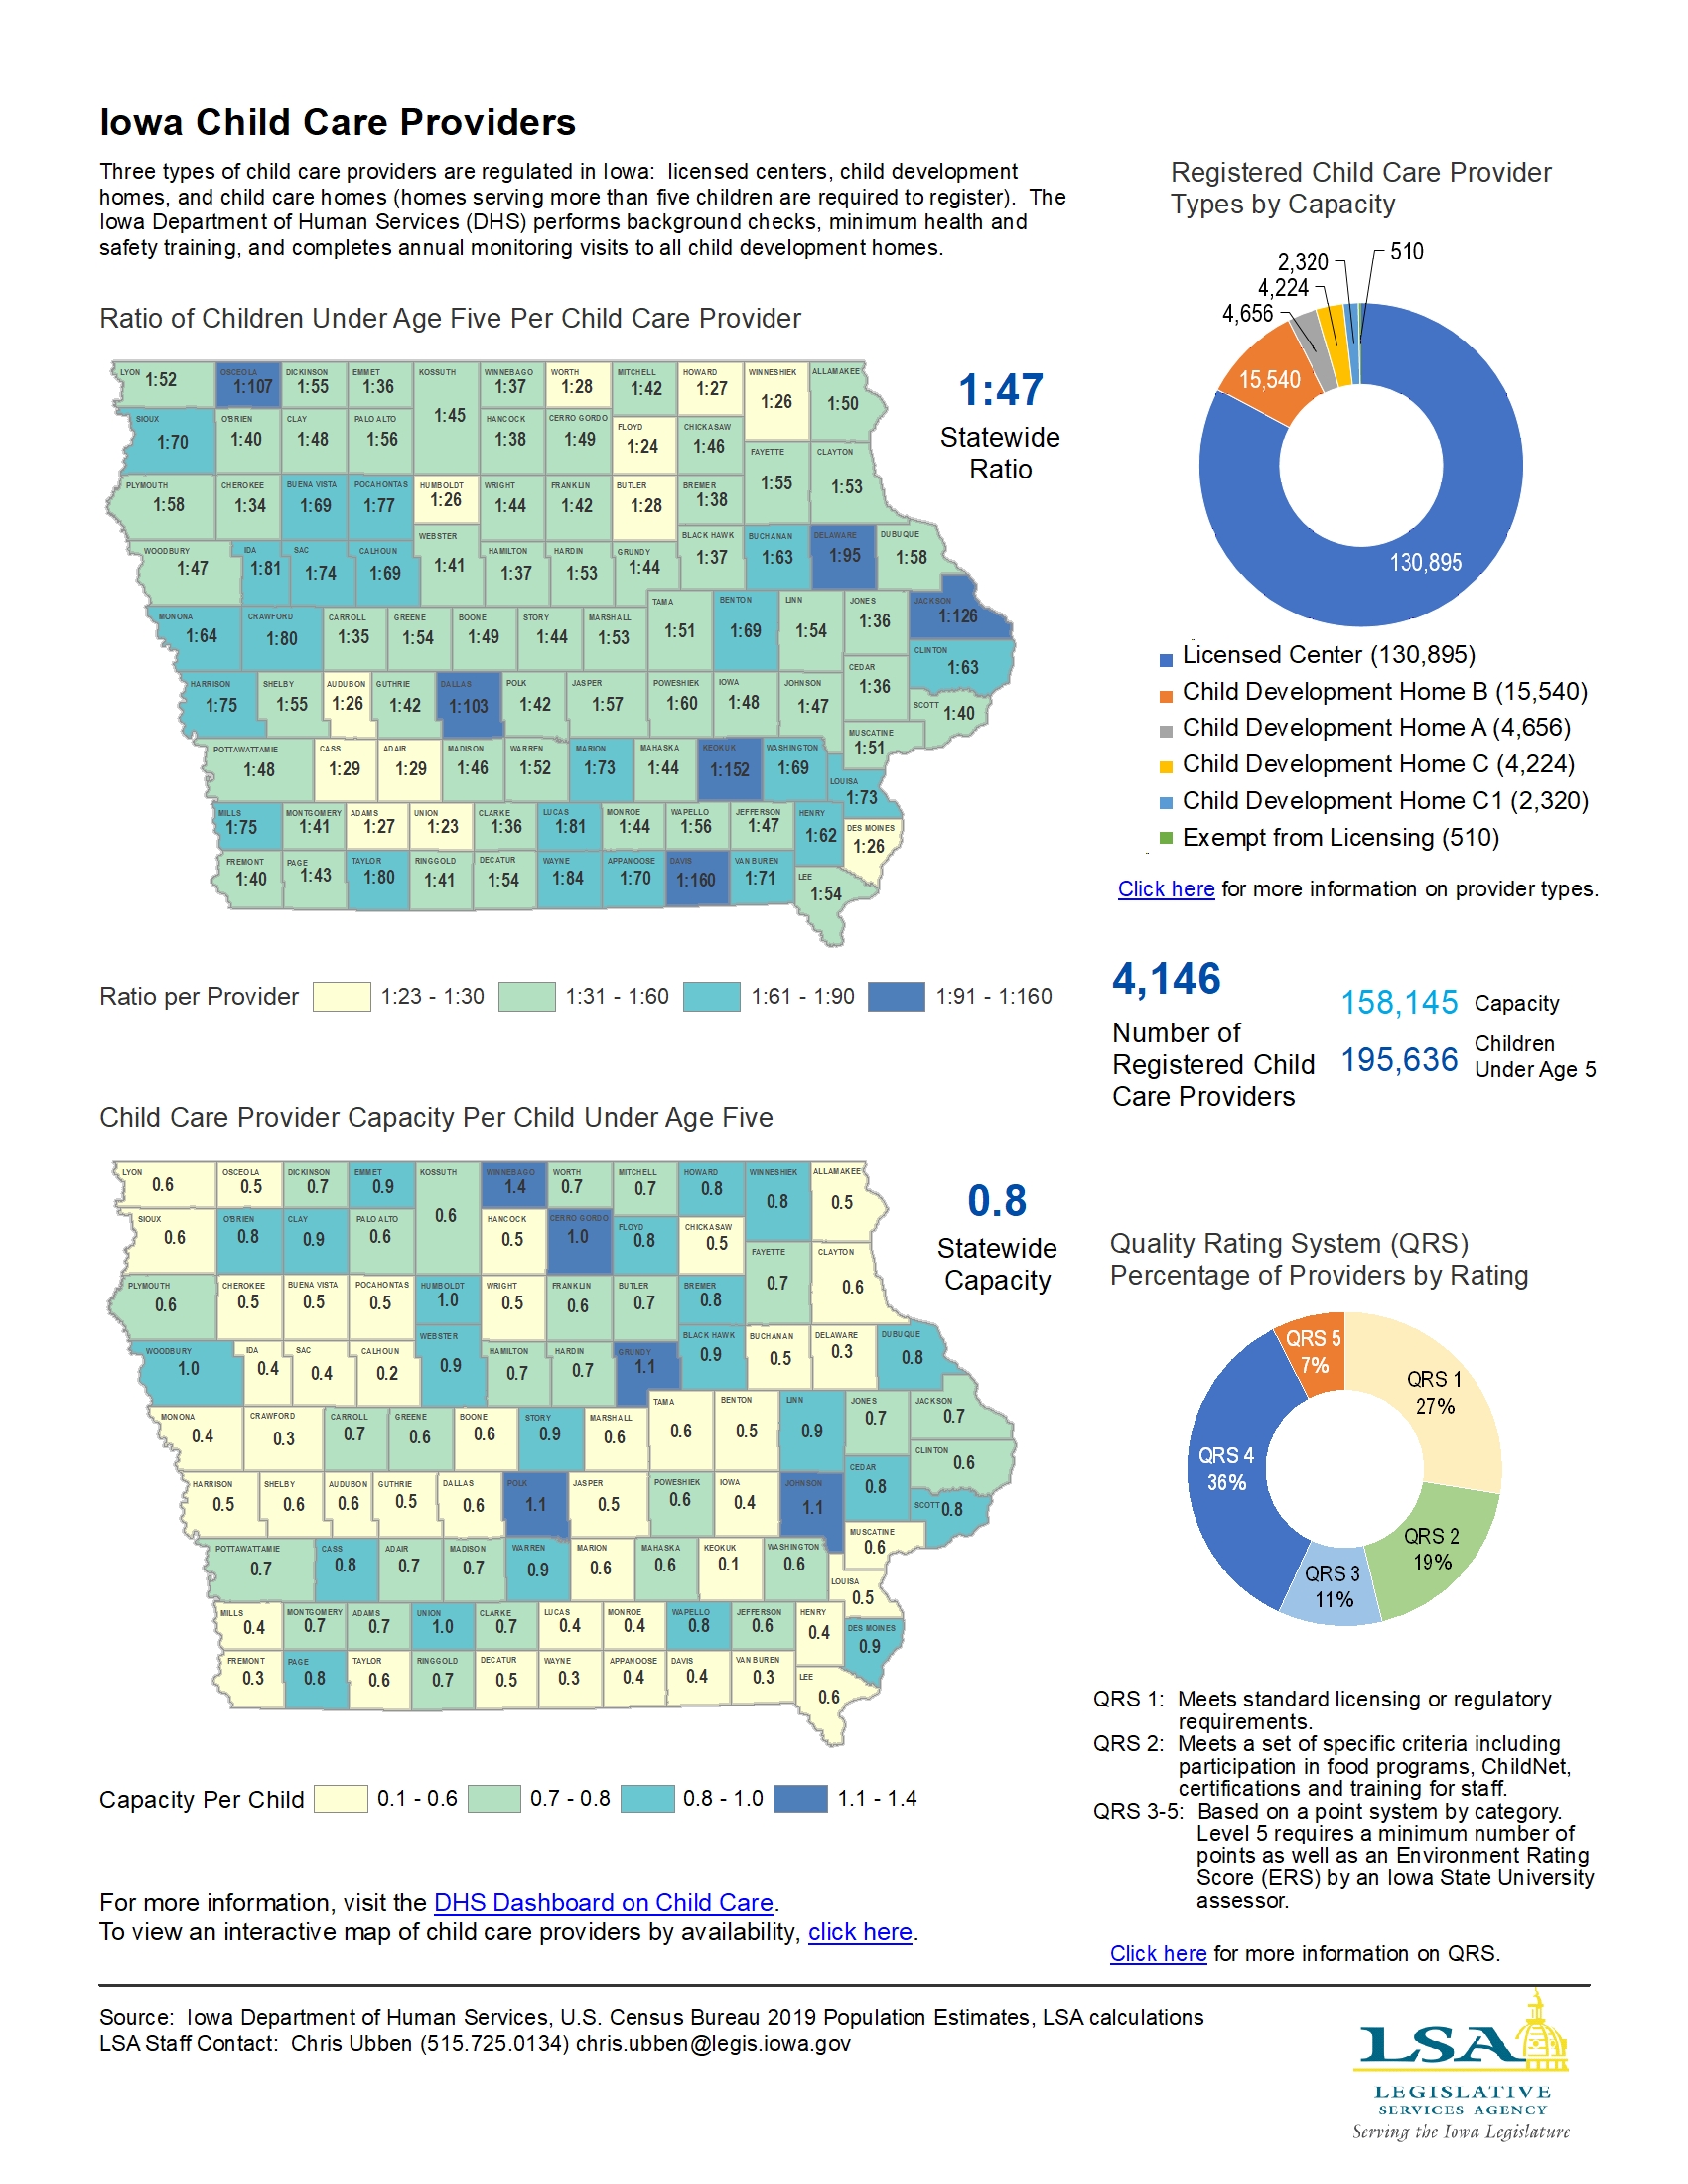
Iowa Child Care Providers — 2021
|
|
|
|
|
| 05/17/2021 |
Iowa Insights |
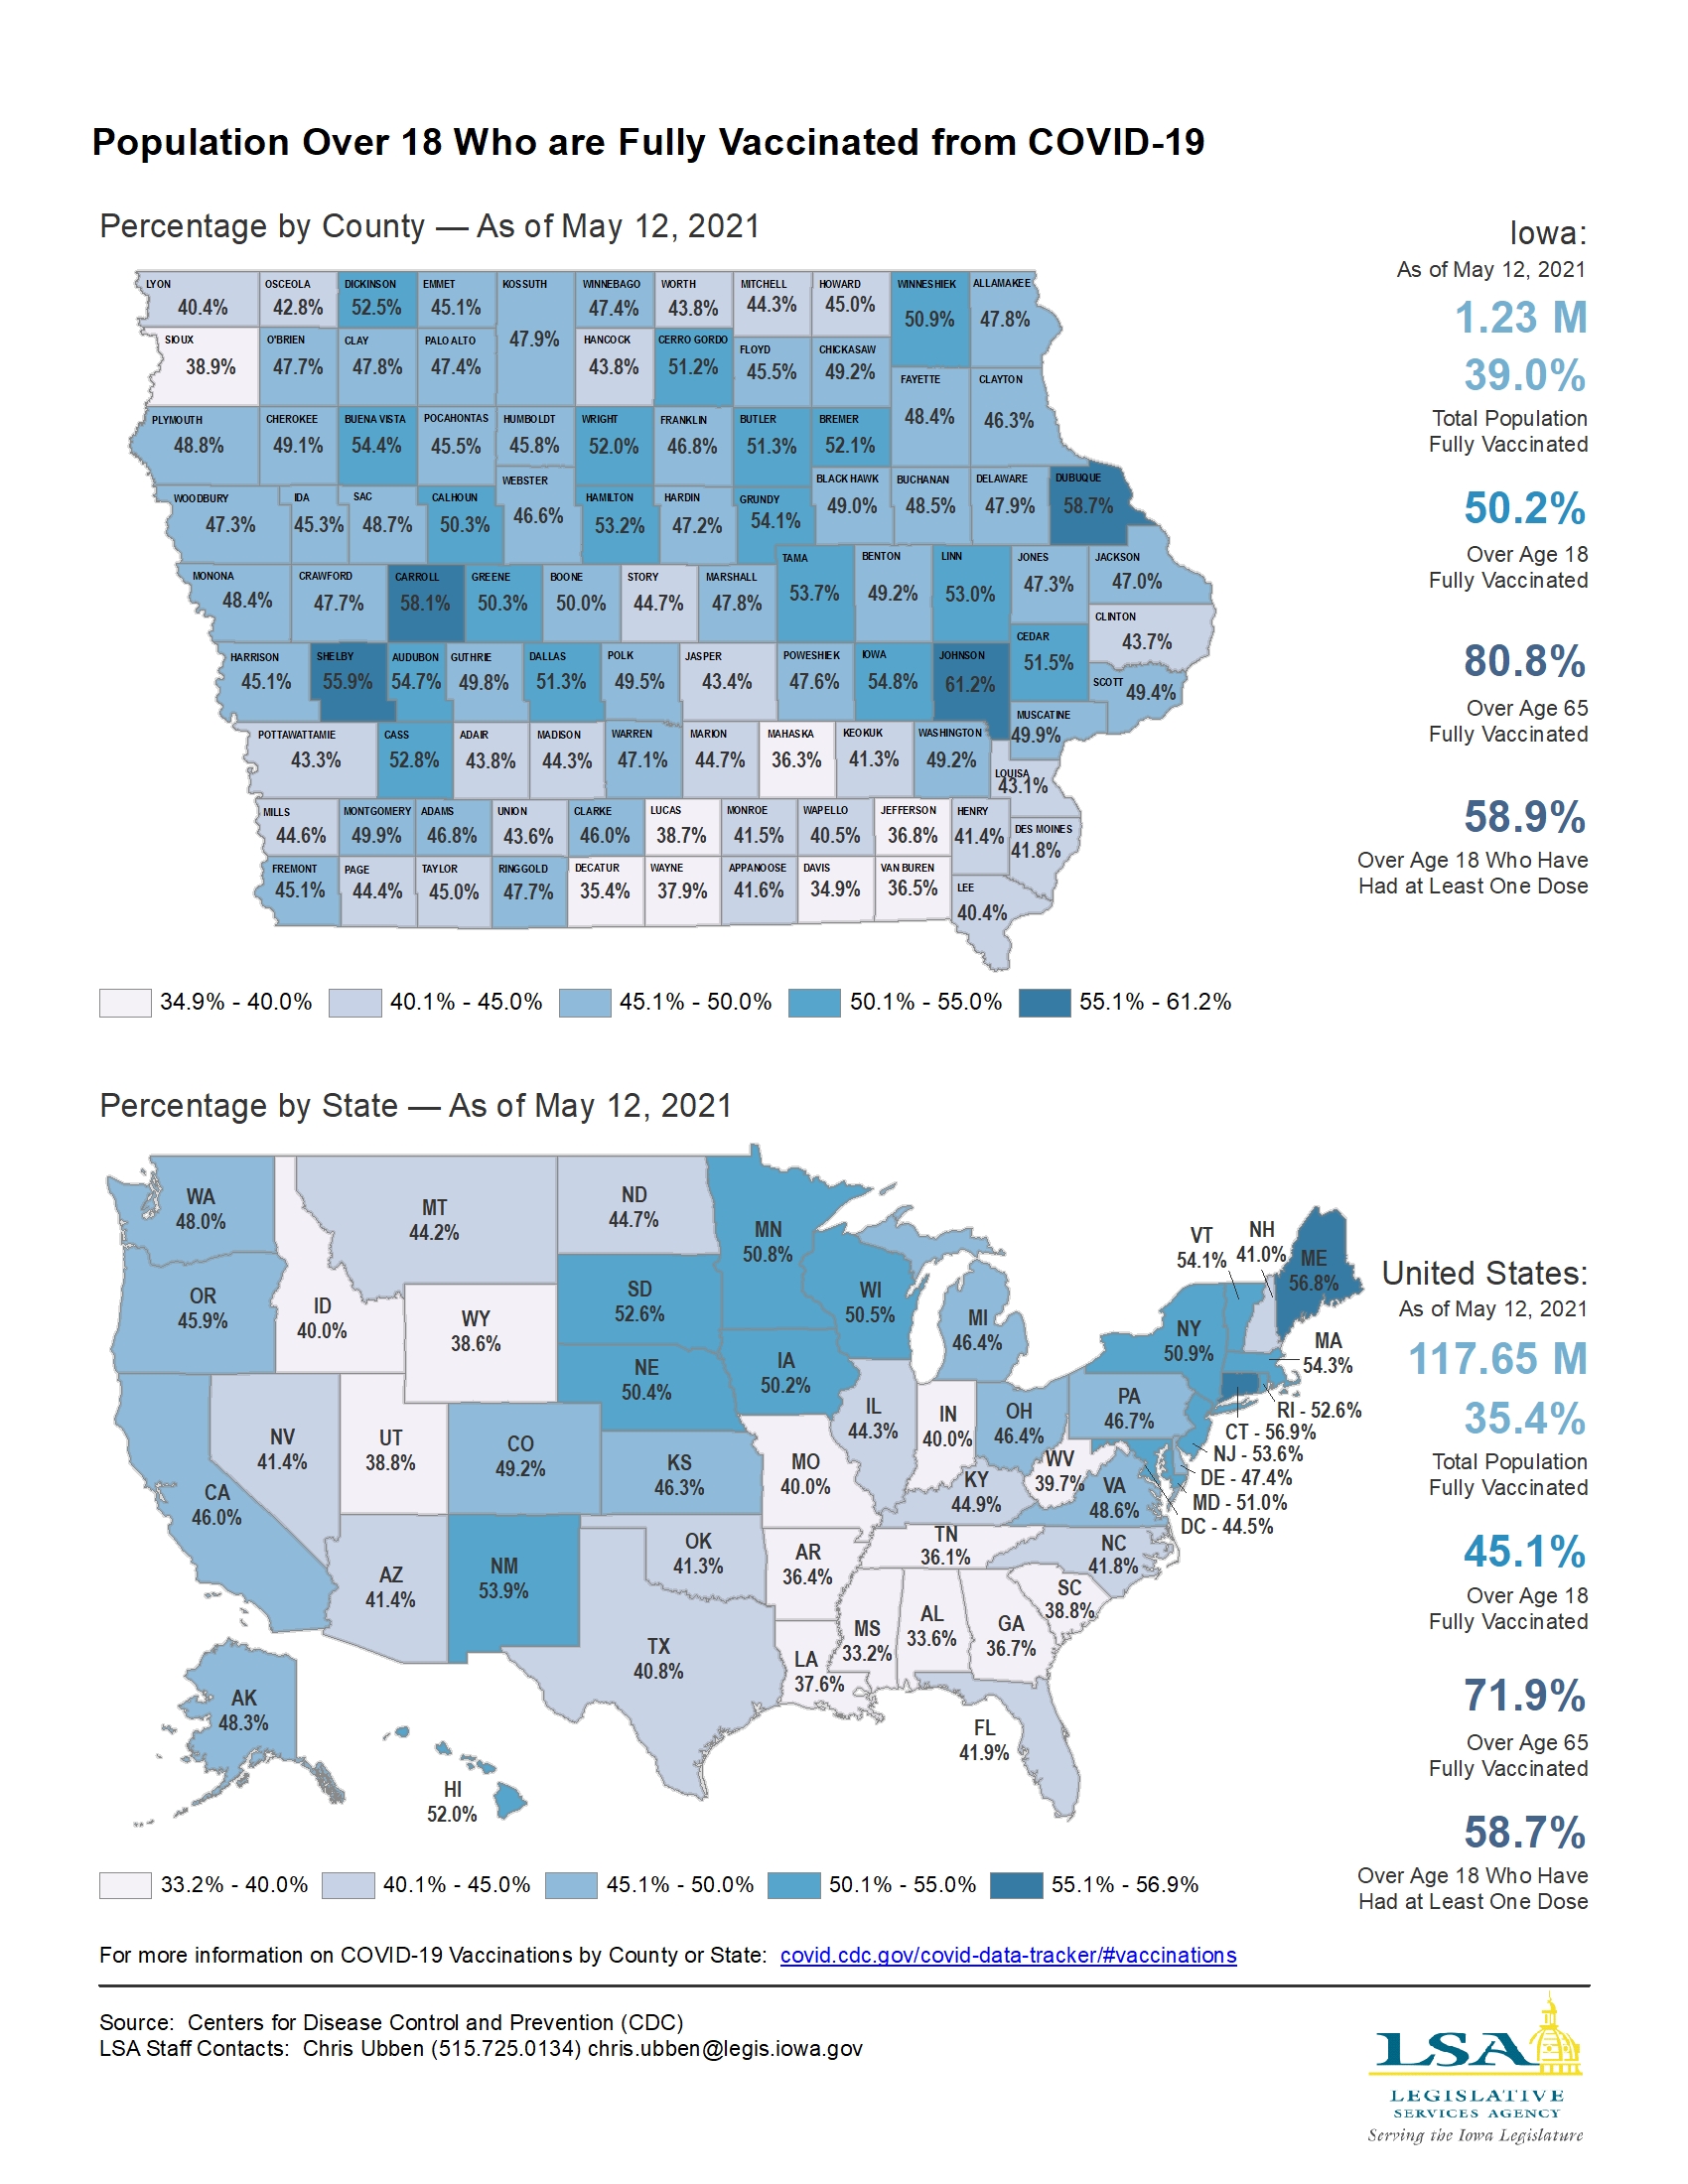
Population Over 18 Who are Fully Vaccinated from COVID-19 — As of May 12, 2021
|
|
|
|
|
| 05/10/2021 |
Iowa Insights |
Renewable Fuels-Related CARES Act Funding — 2020

|
|
|
|
|
| 05/03/2021 |
Iowa Insights |
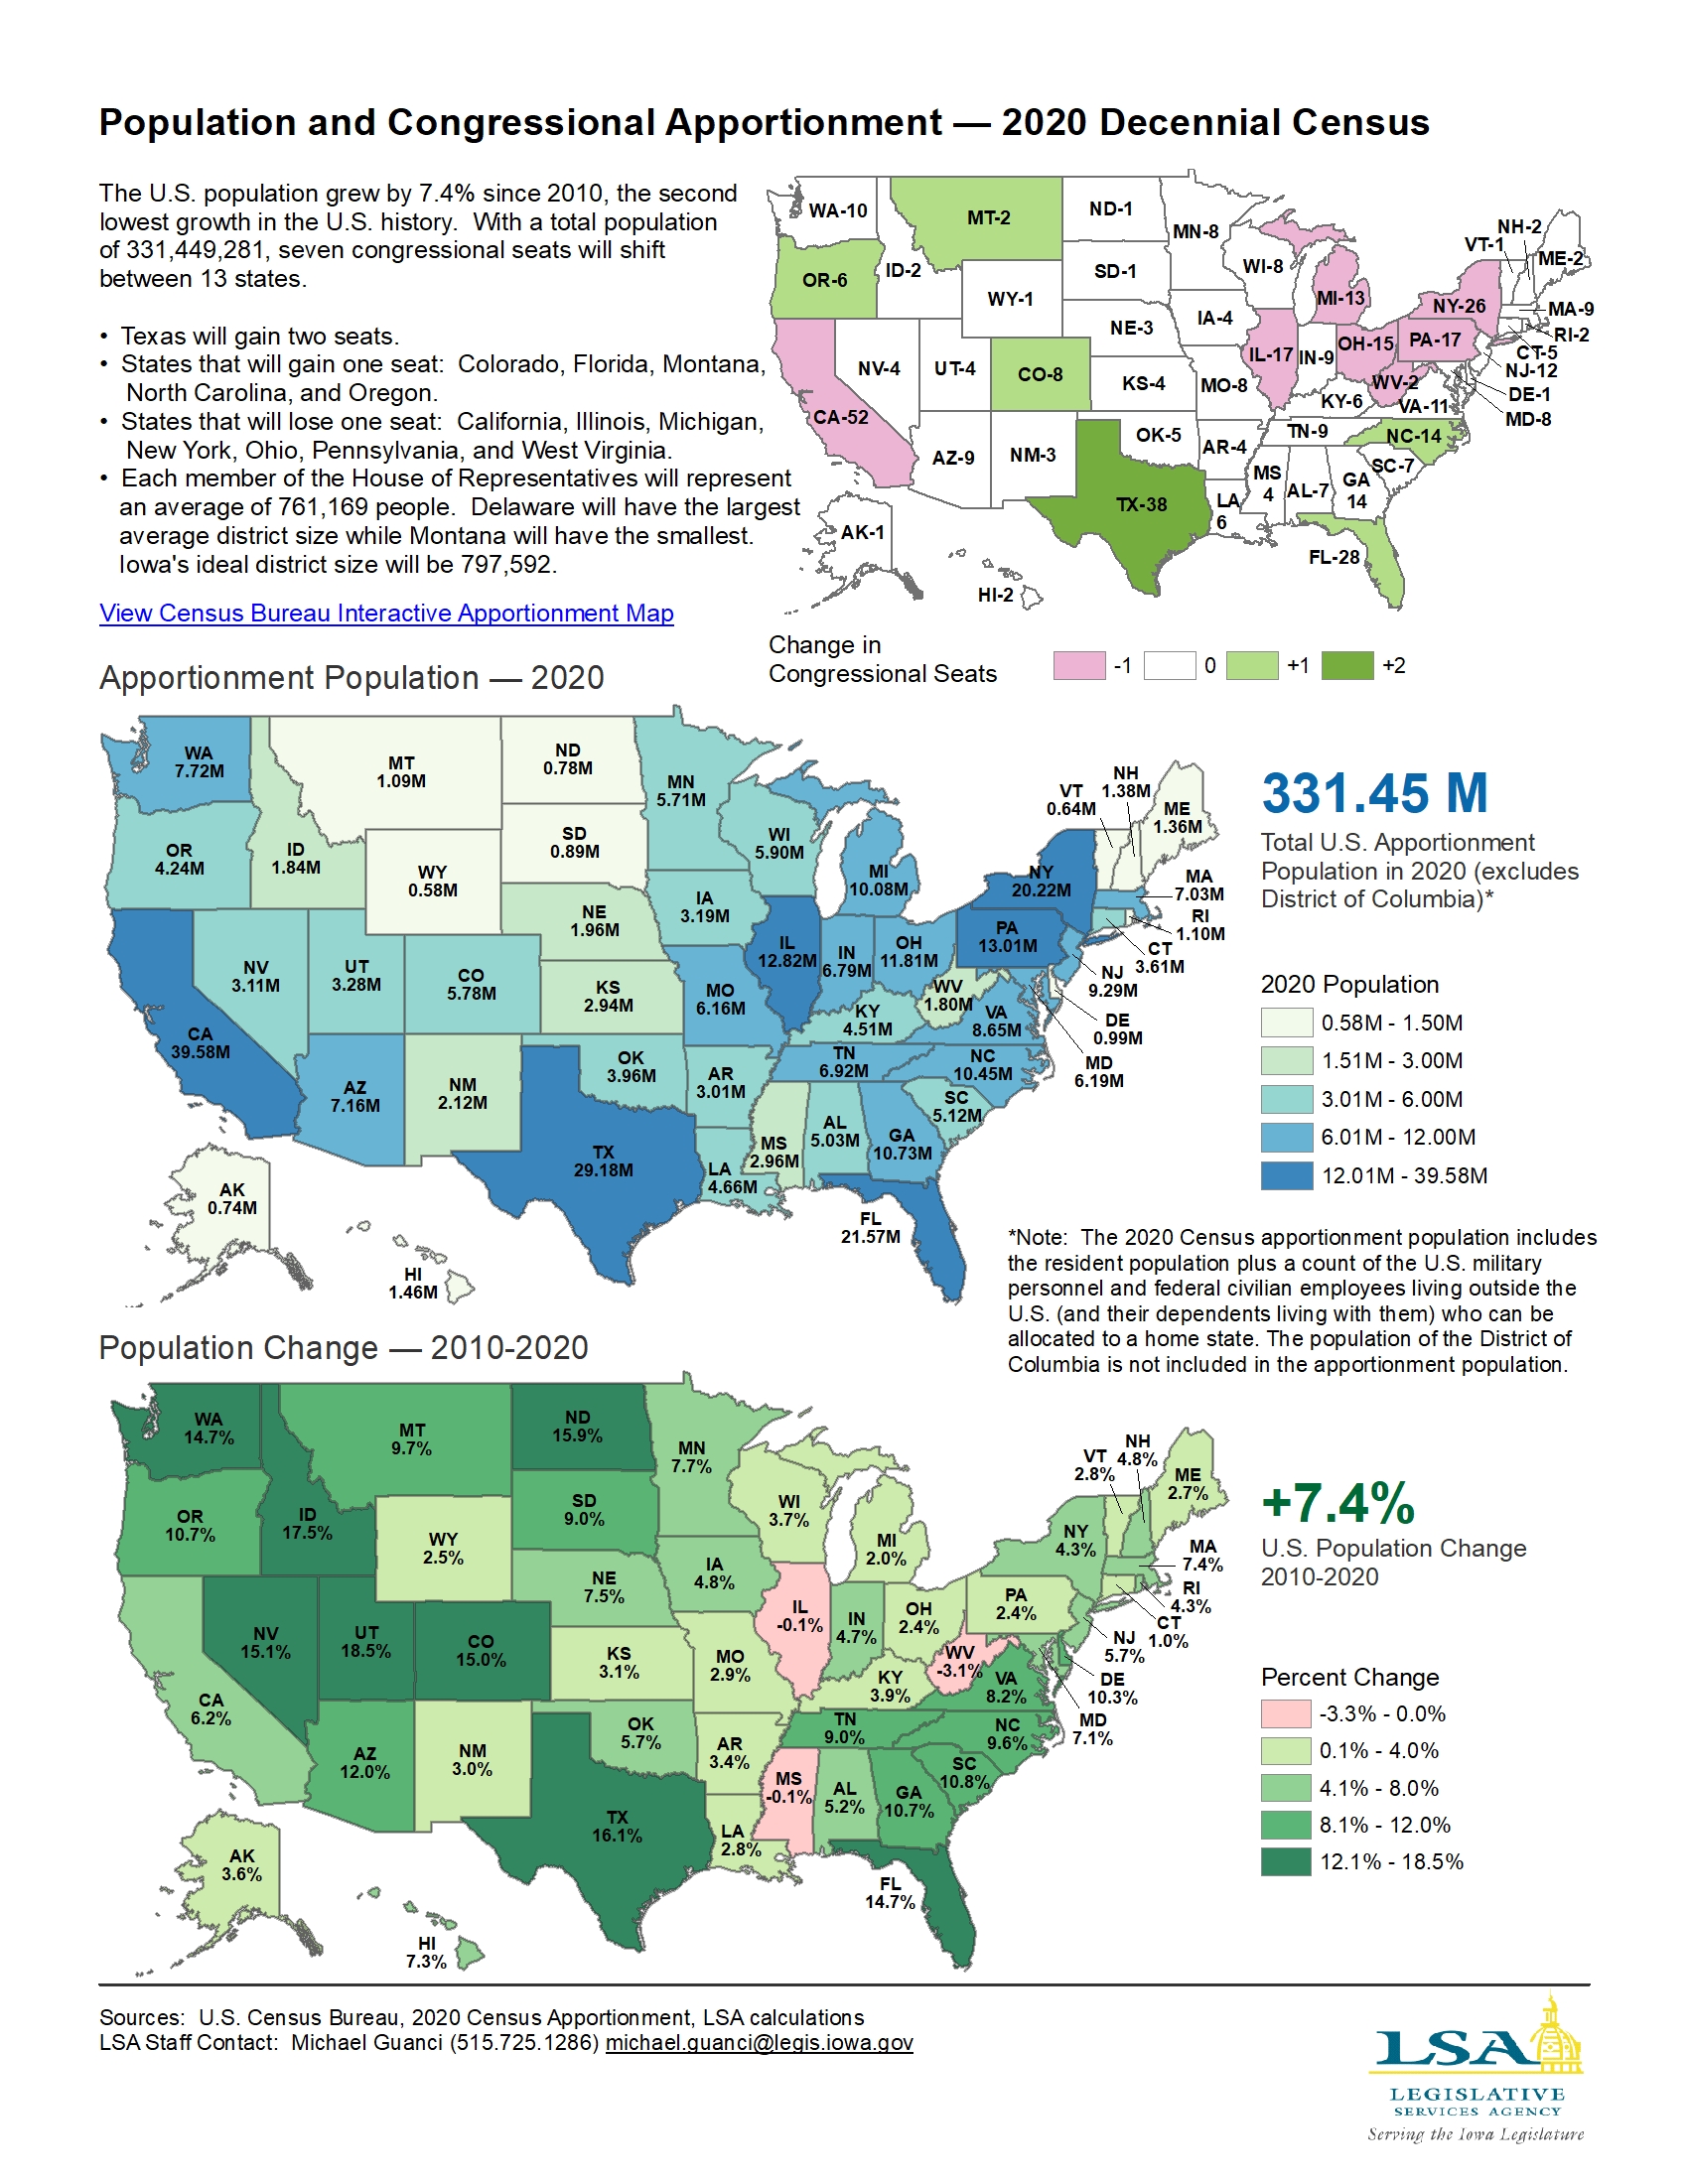
Population and Congressional Apportionment — 2020
|
|
|
|
|
| 04/19/2021 |
Iowa Insights |
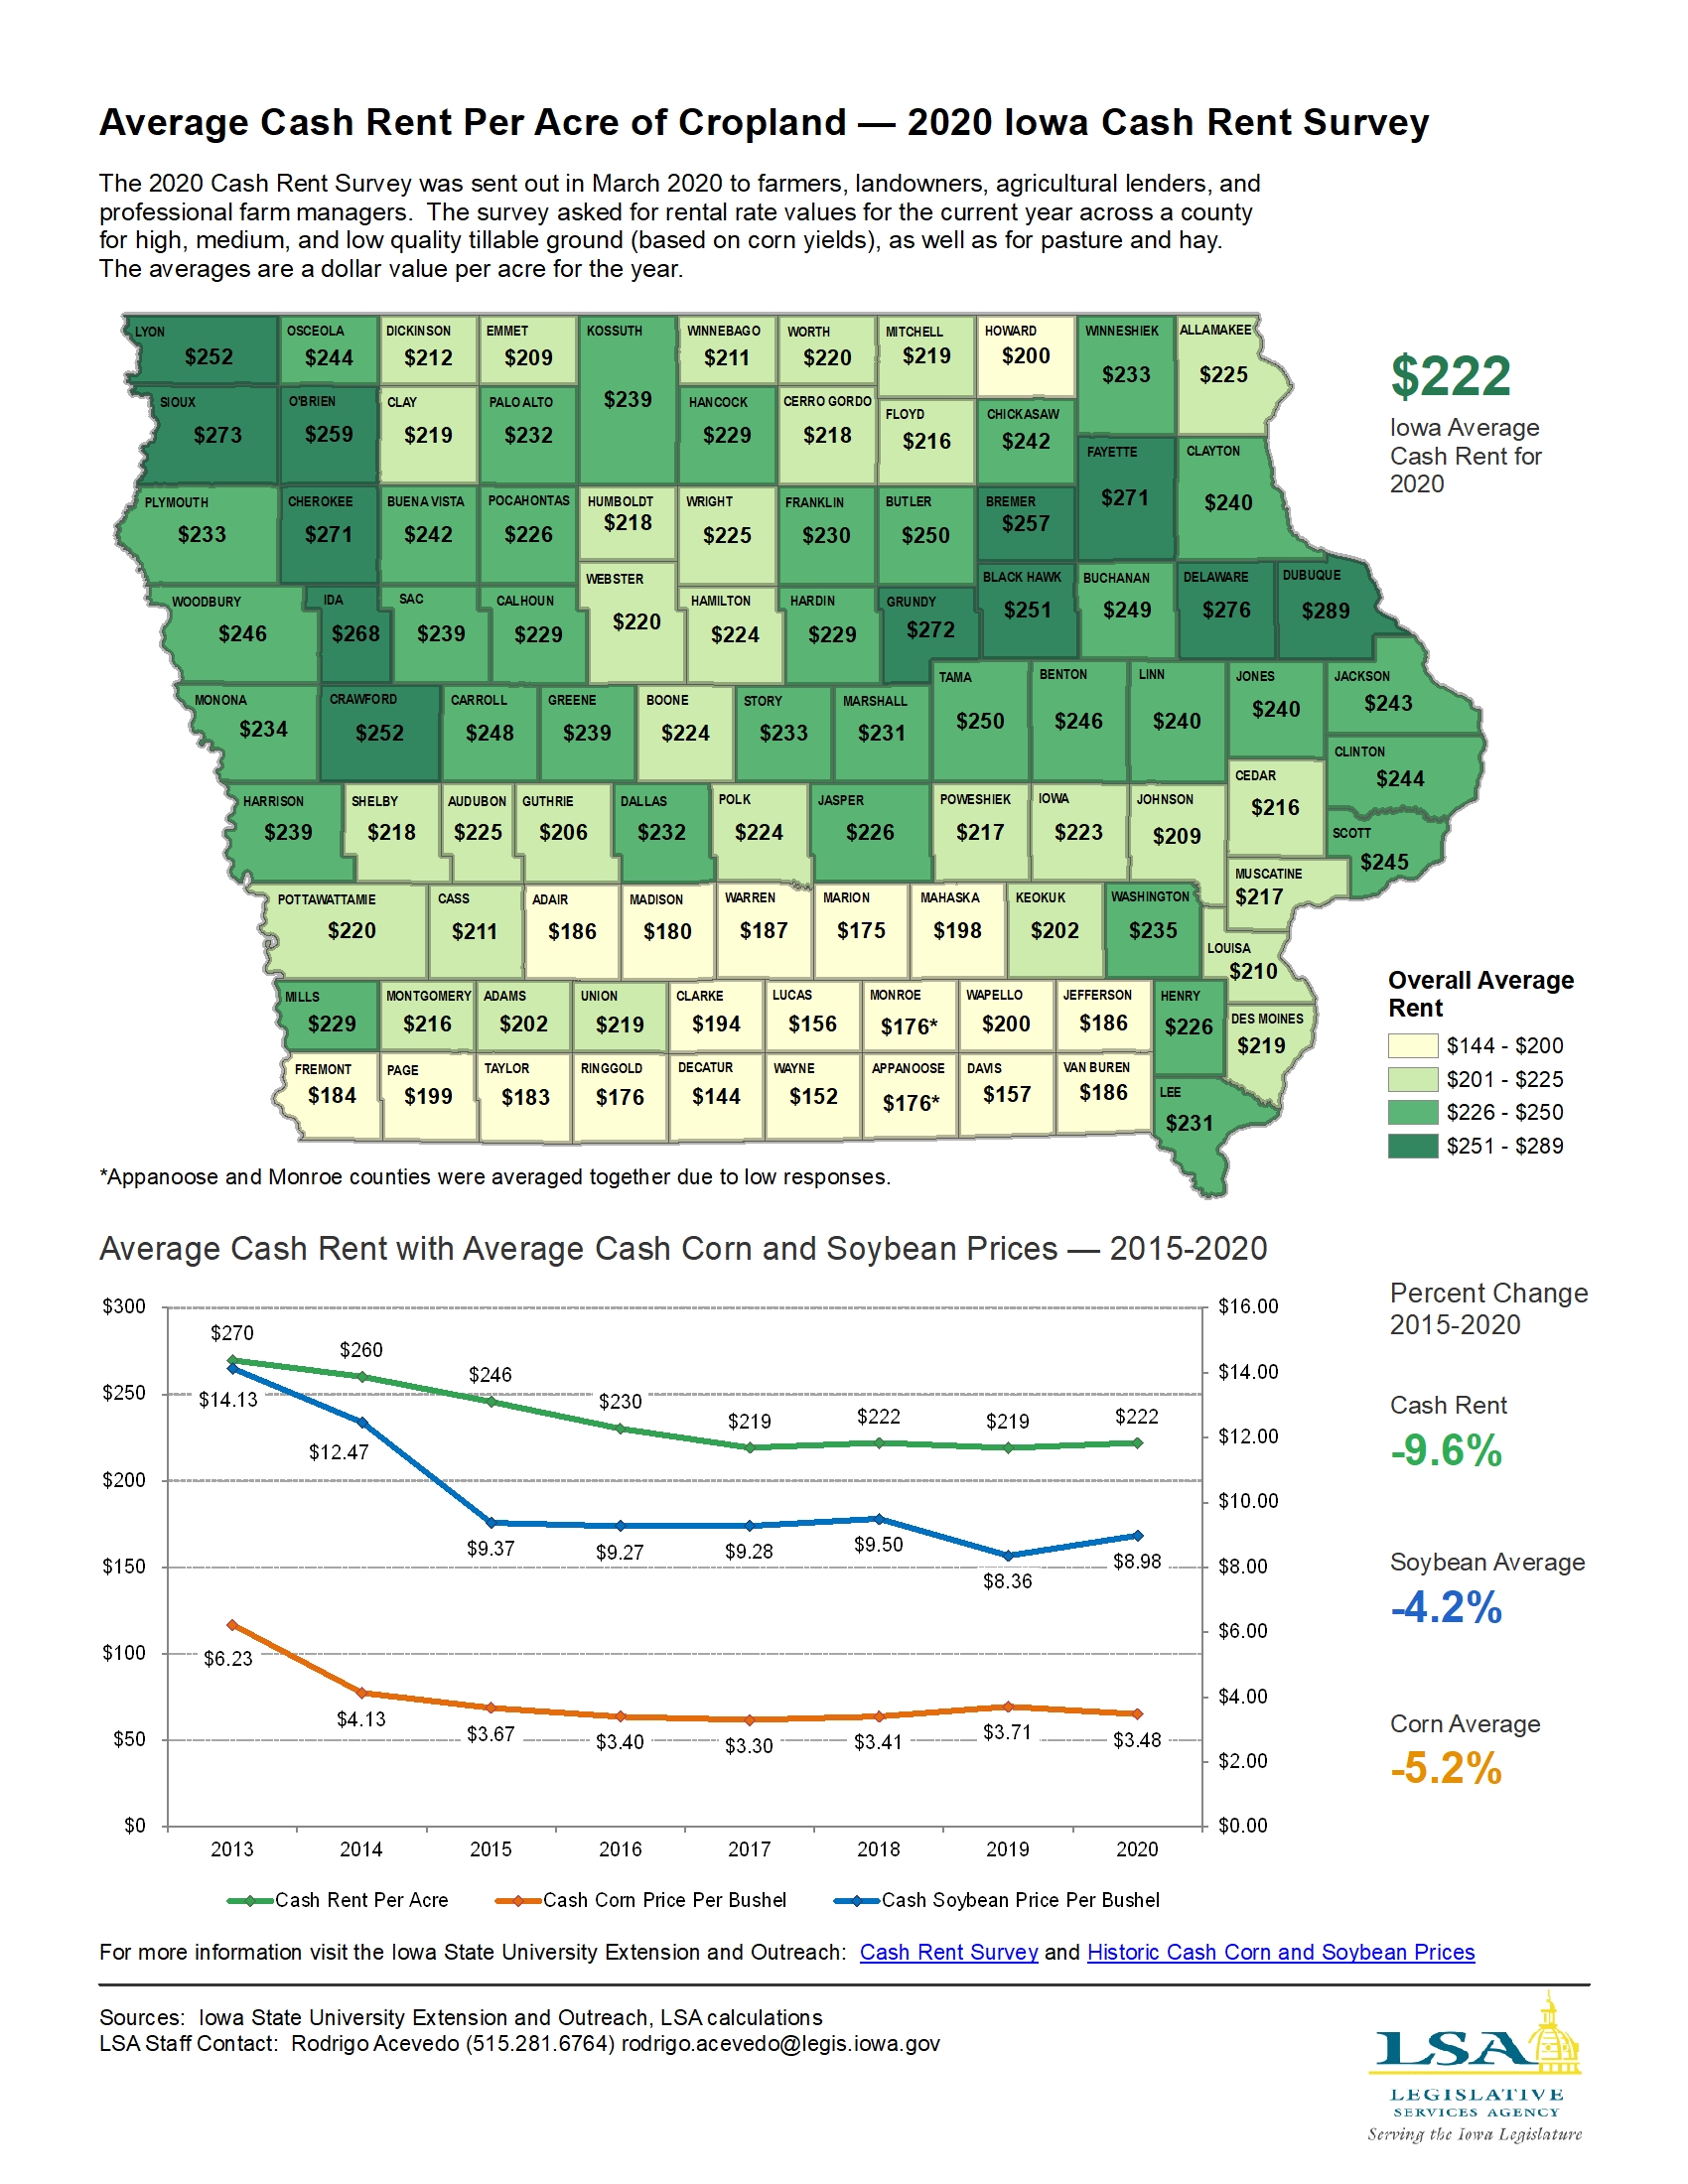
Average Cash Rent Per Acre of Cropland — 2020 Iowa Cash Rent Survey
|
|
|
|
|
| 04/05/2021 |
Iowa Insights |
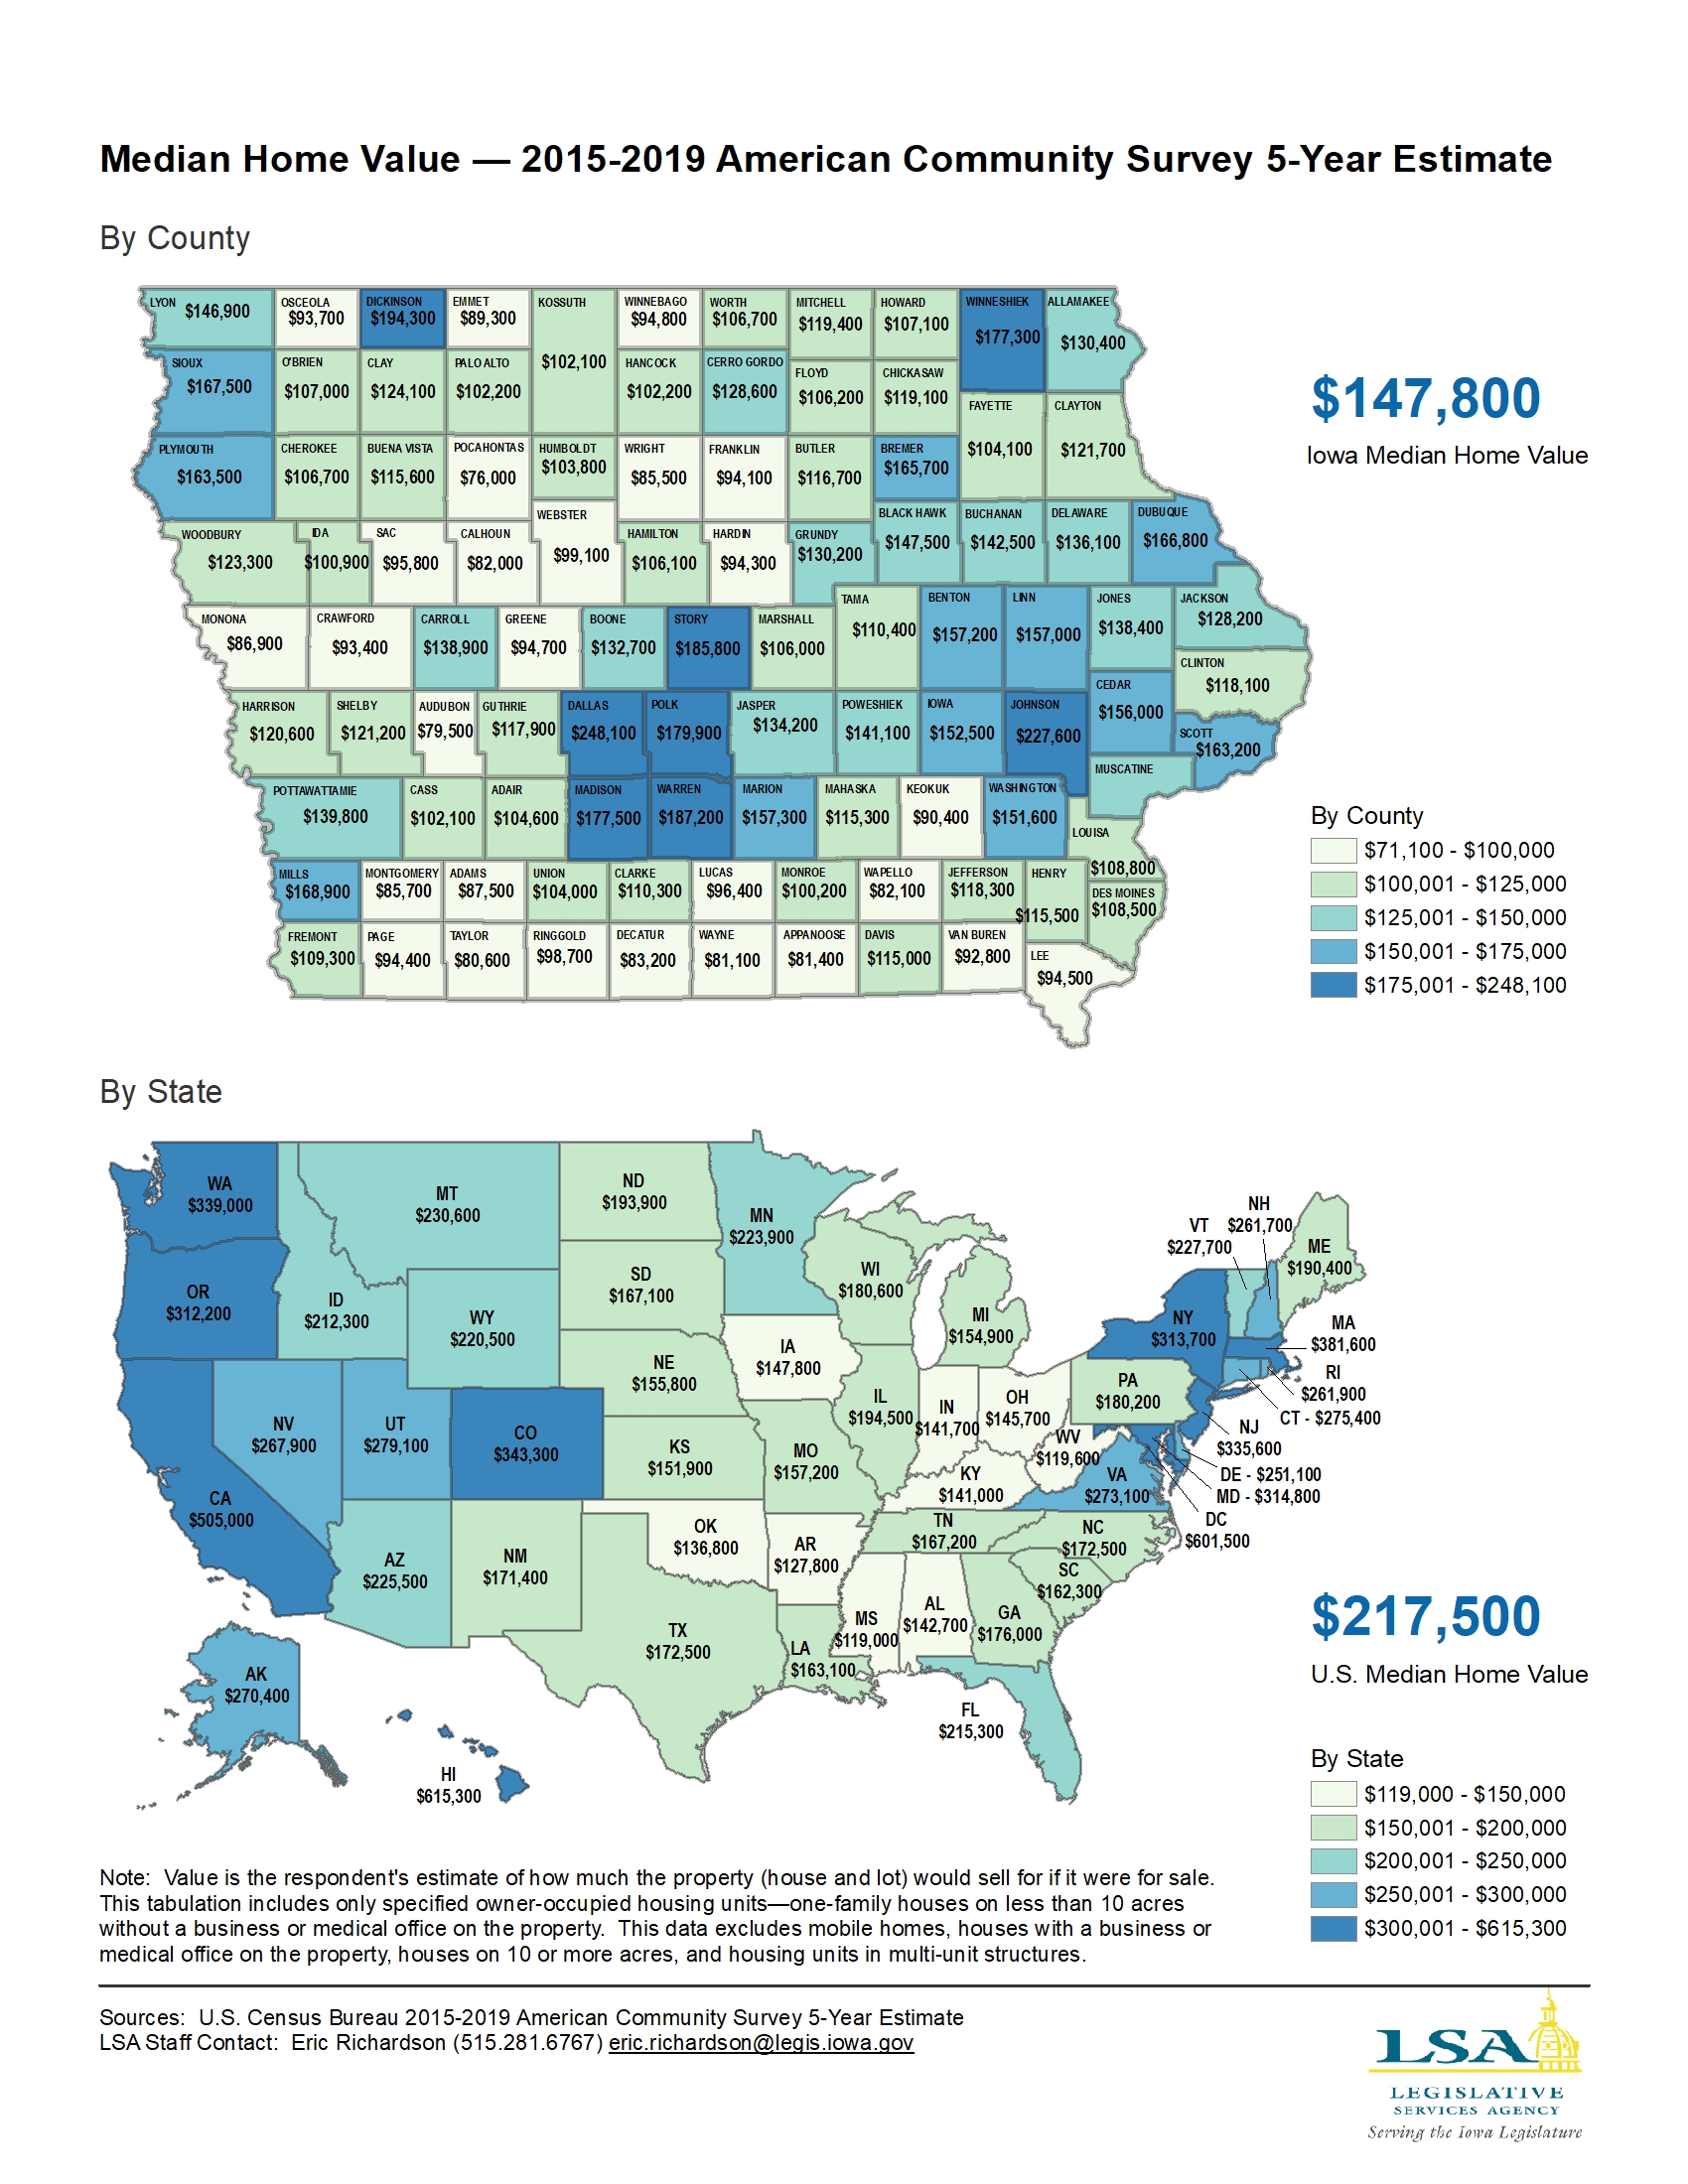
Median Home Value — American Community Survey 2015-2019
|
|
|
|
|
| 03/29/2021 |
Iowa Insights |
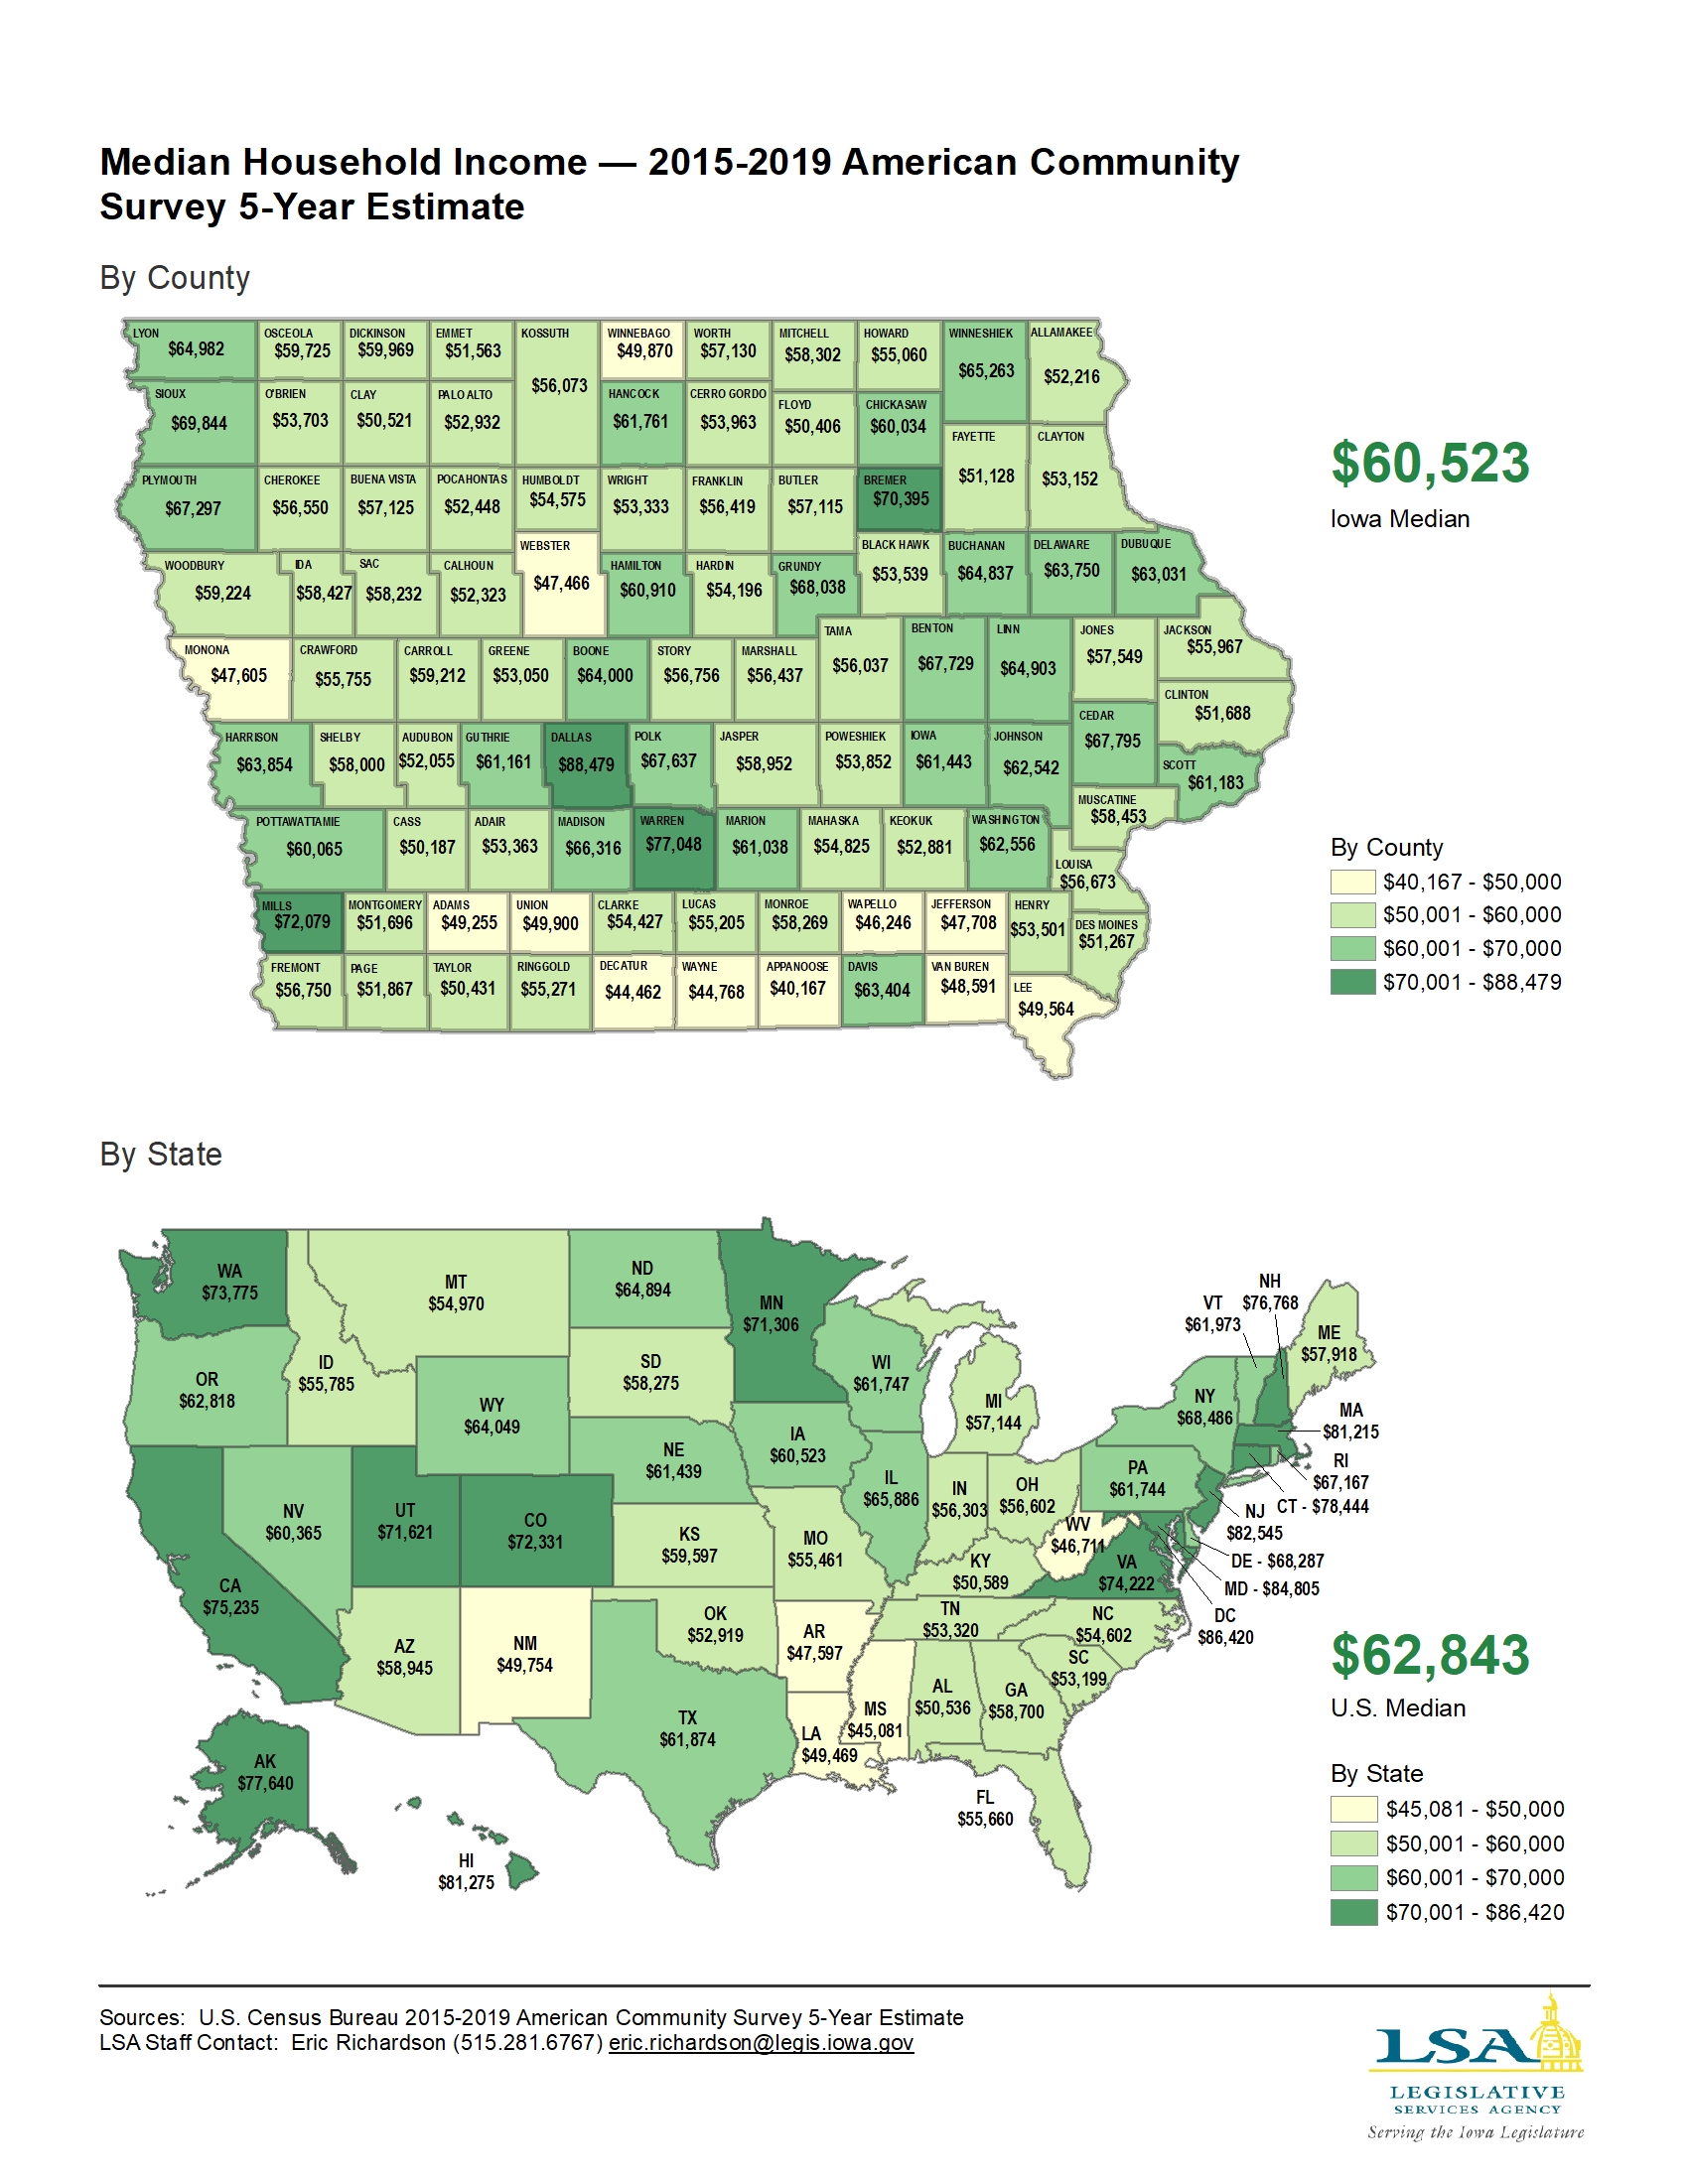
Median Household Income — American Community Survey 2015-2019
|
|
|
|
|
| 03/22/2021 |
Iowa Insights |
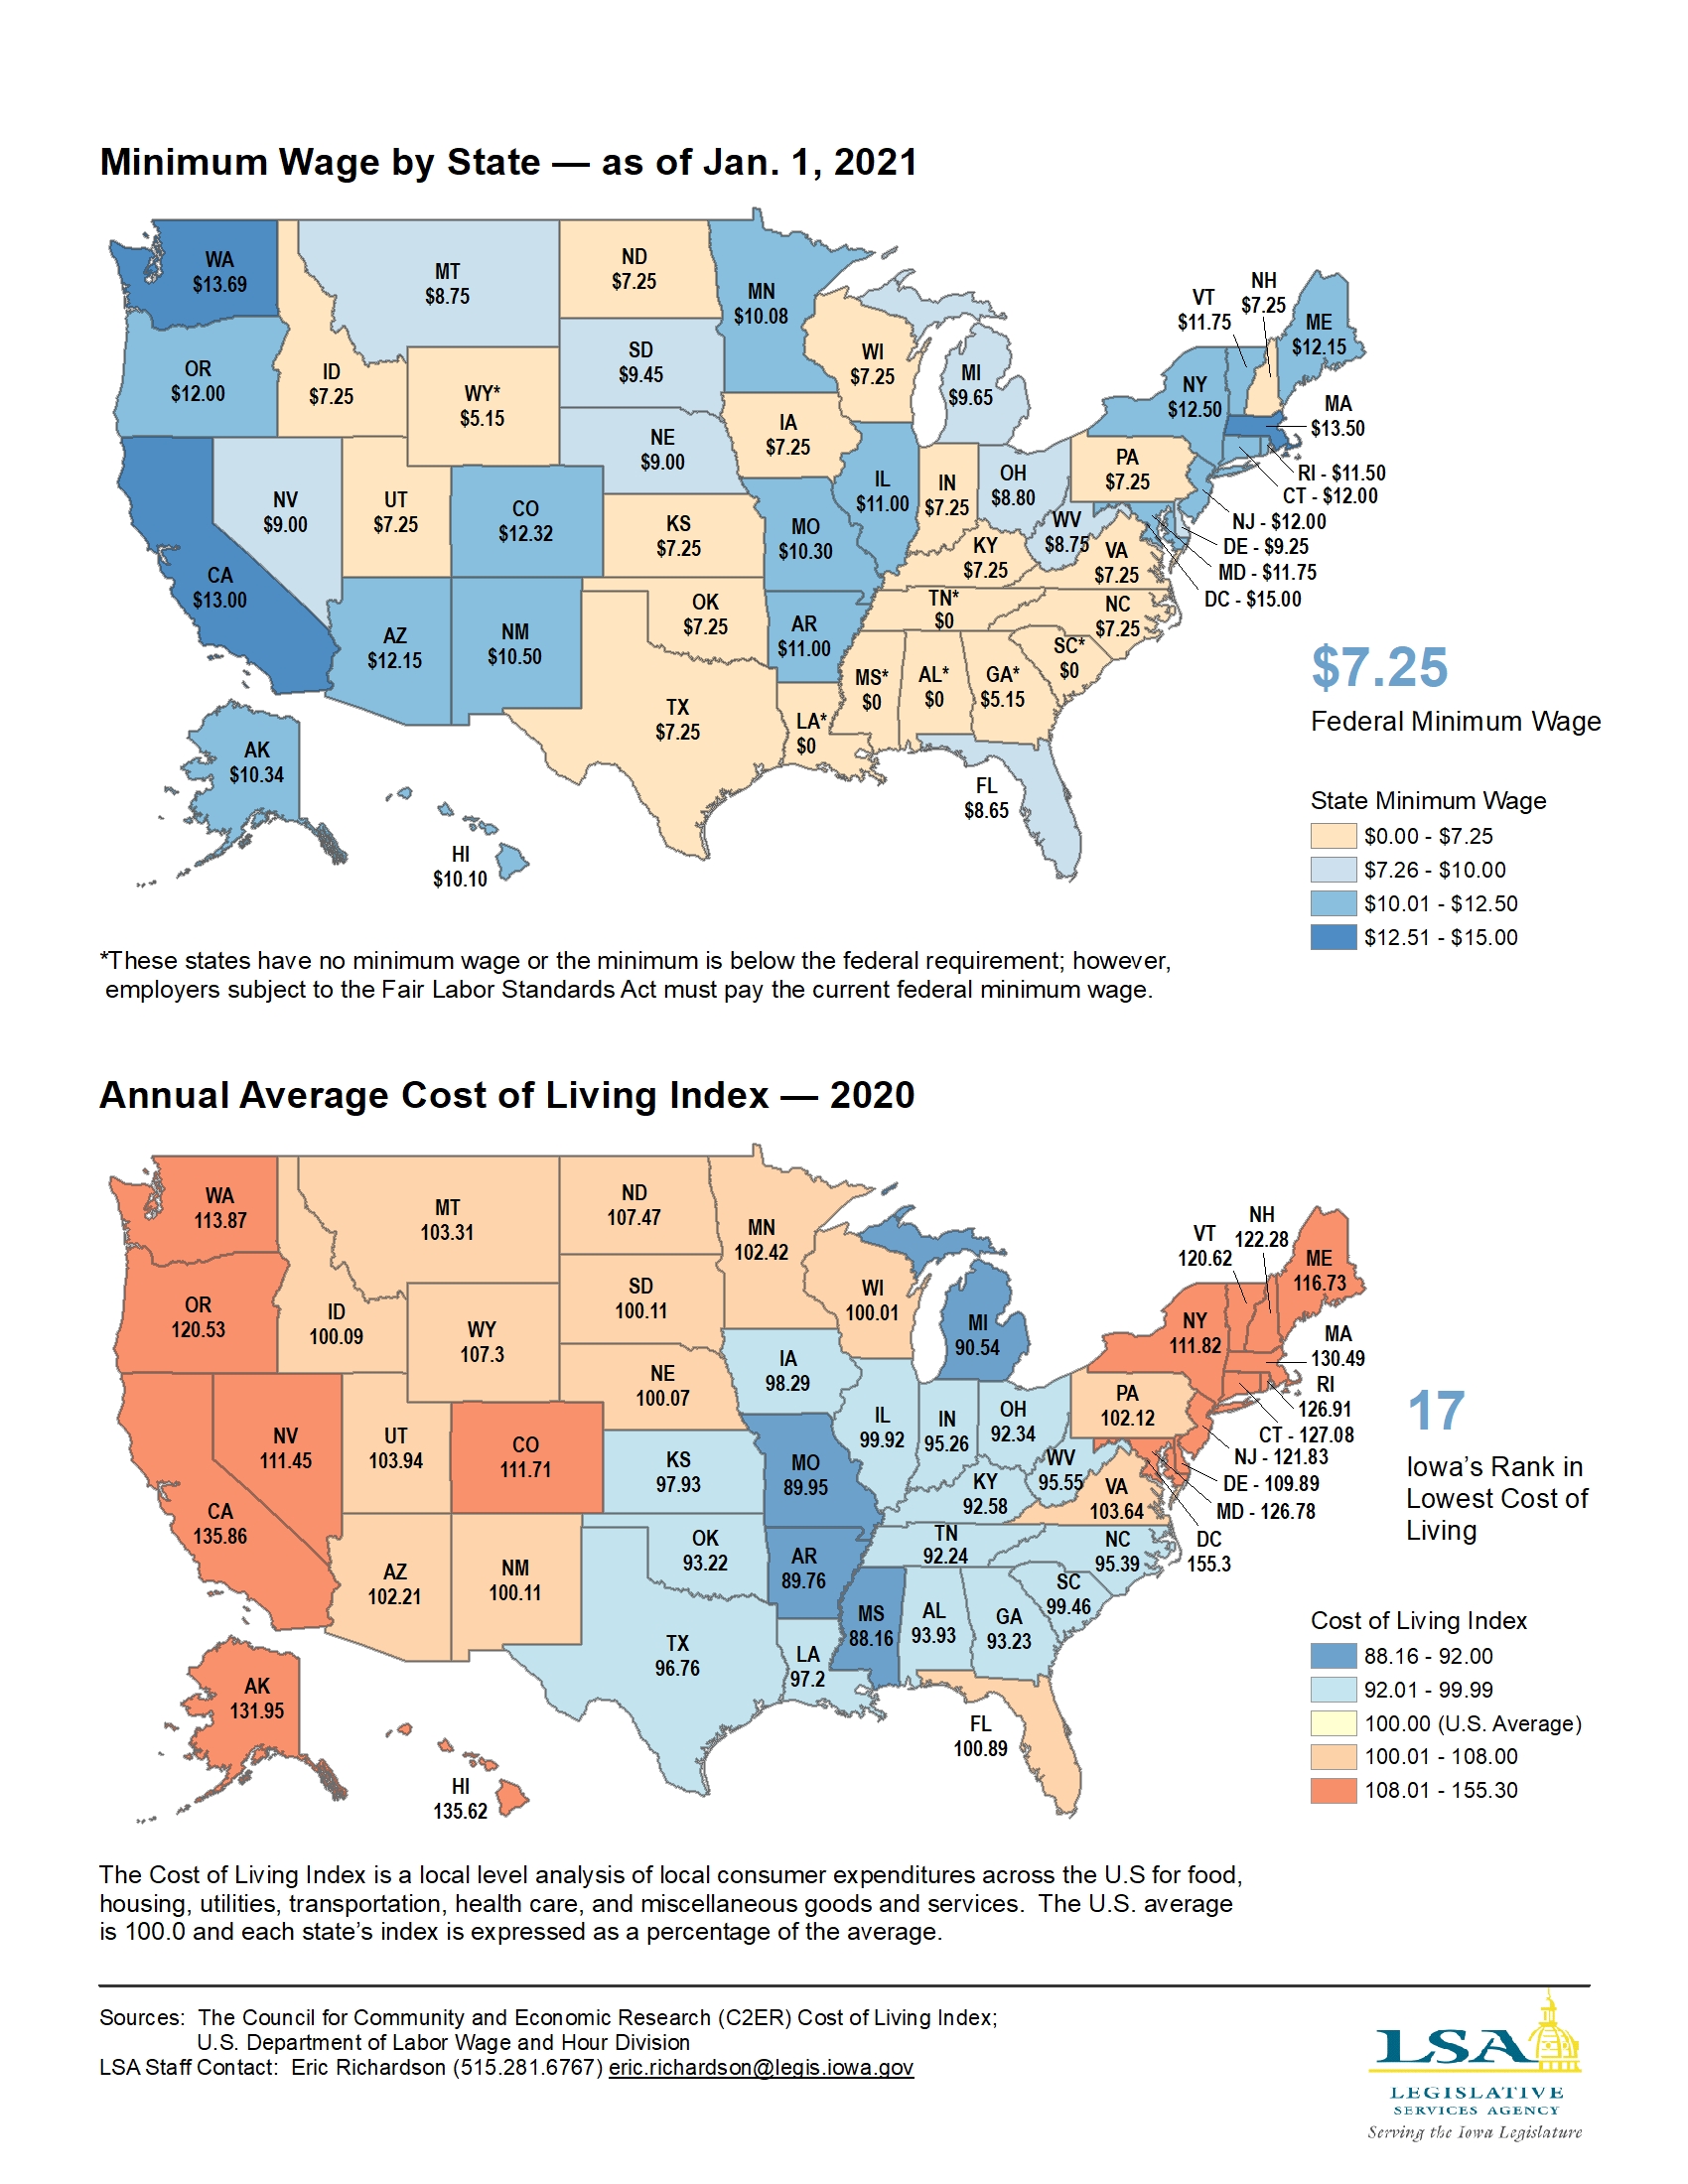
Minimum Wage and Cost of Living Index by State — 2020
|
|
|
|
|
| 03/16/2021 |
Iowa Insights |
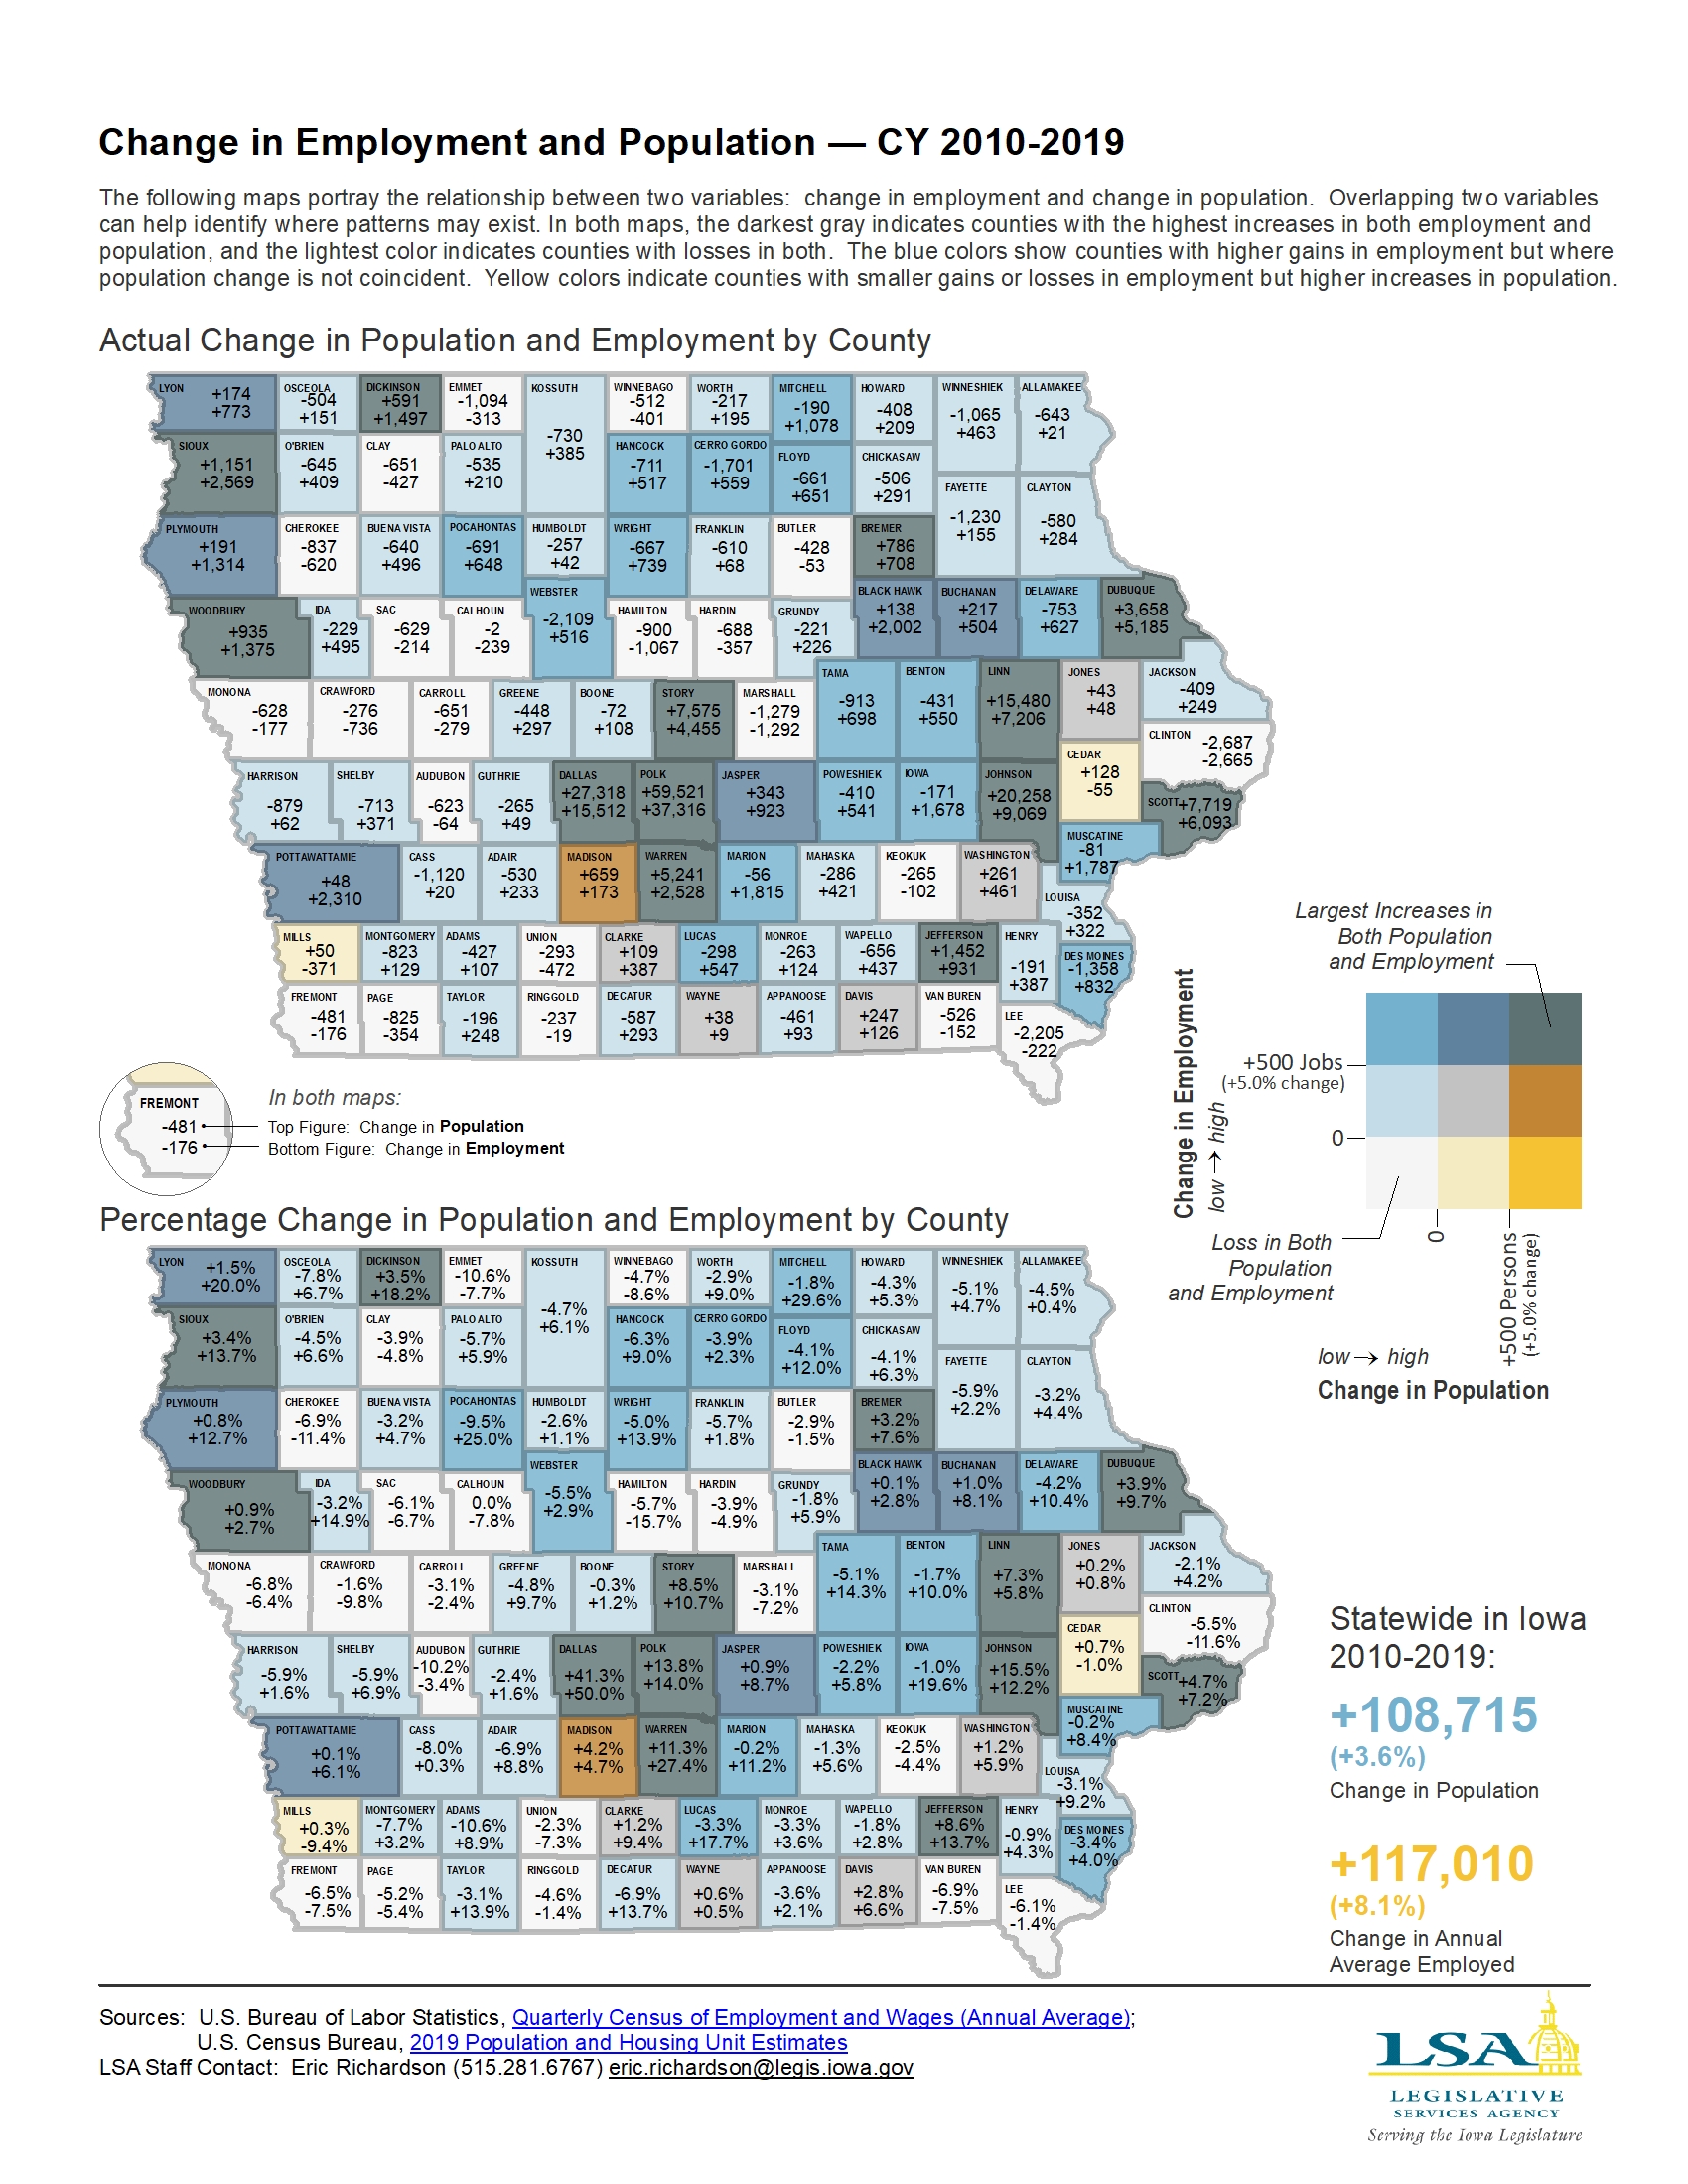
Change in Employment and Population — CY 2010-2019
|
|
|
|
|
| 03/08/2021 |
Iowa Insights |
Population Migration by County — 2019
|
|
|
|
|
| 03/01/2021 |
Iowa Insights |
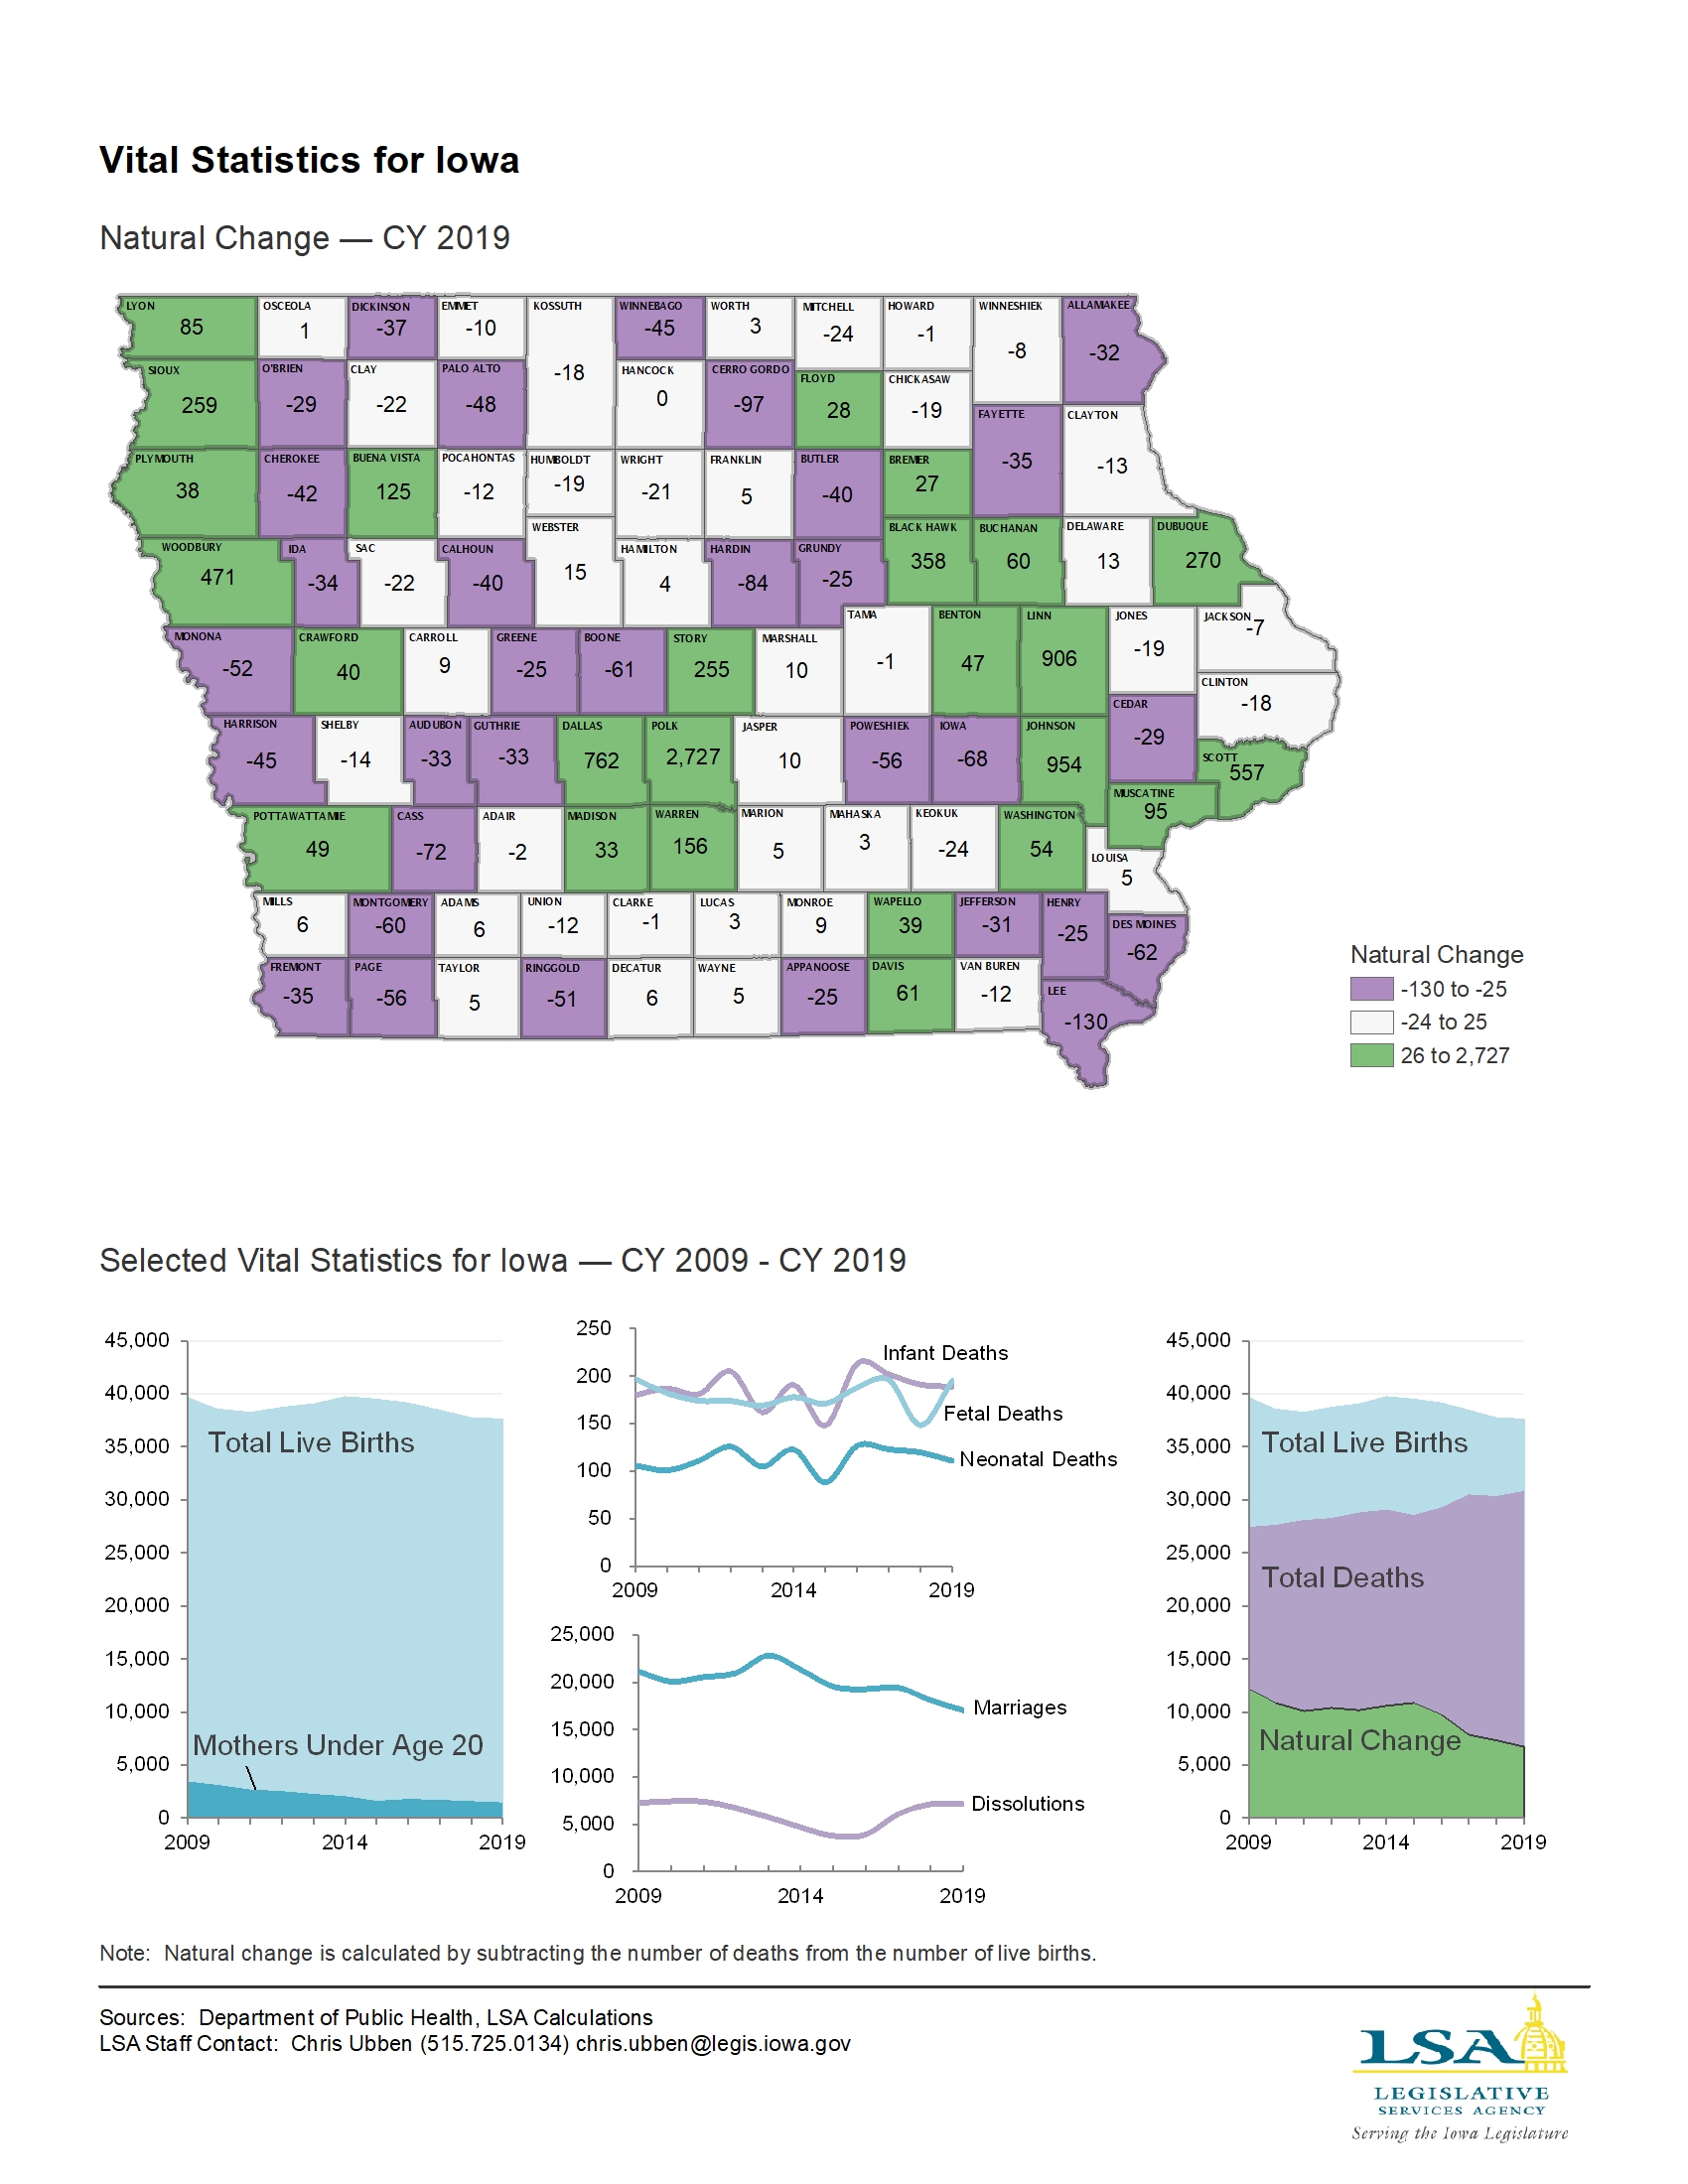
Vital Statistics for Iowa — CY 2019
|
|
|
|
|
| 02/22/2021 |
Iowa Insights |
State Cigarette and E-Cigarette/Vaping Product Tax Rates — 2020

|
|
|
|
|
| 02/16/2021 |
Iowa Insights |
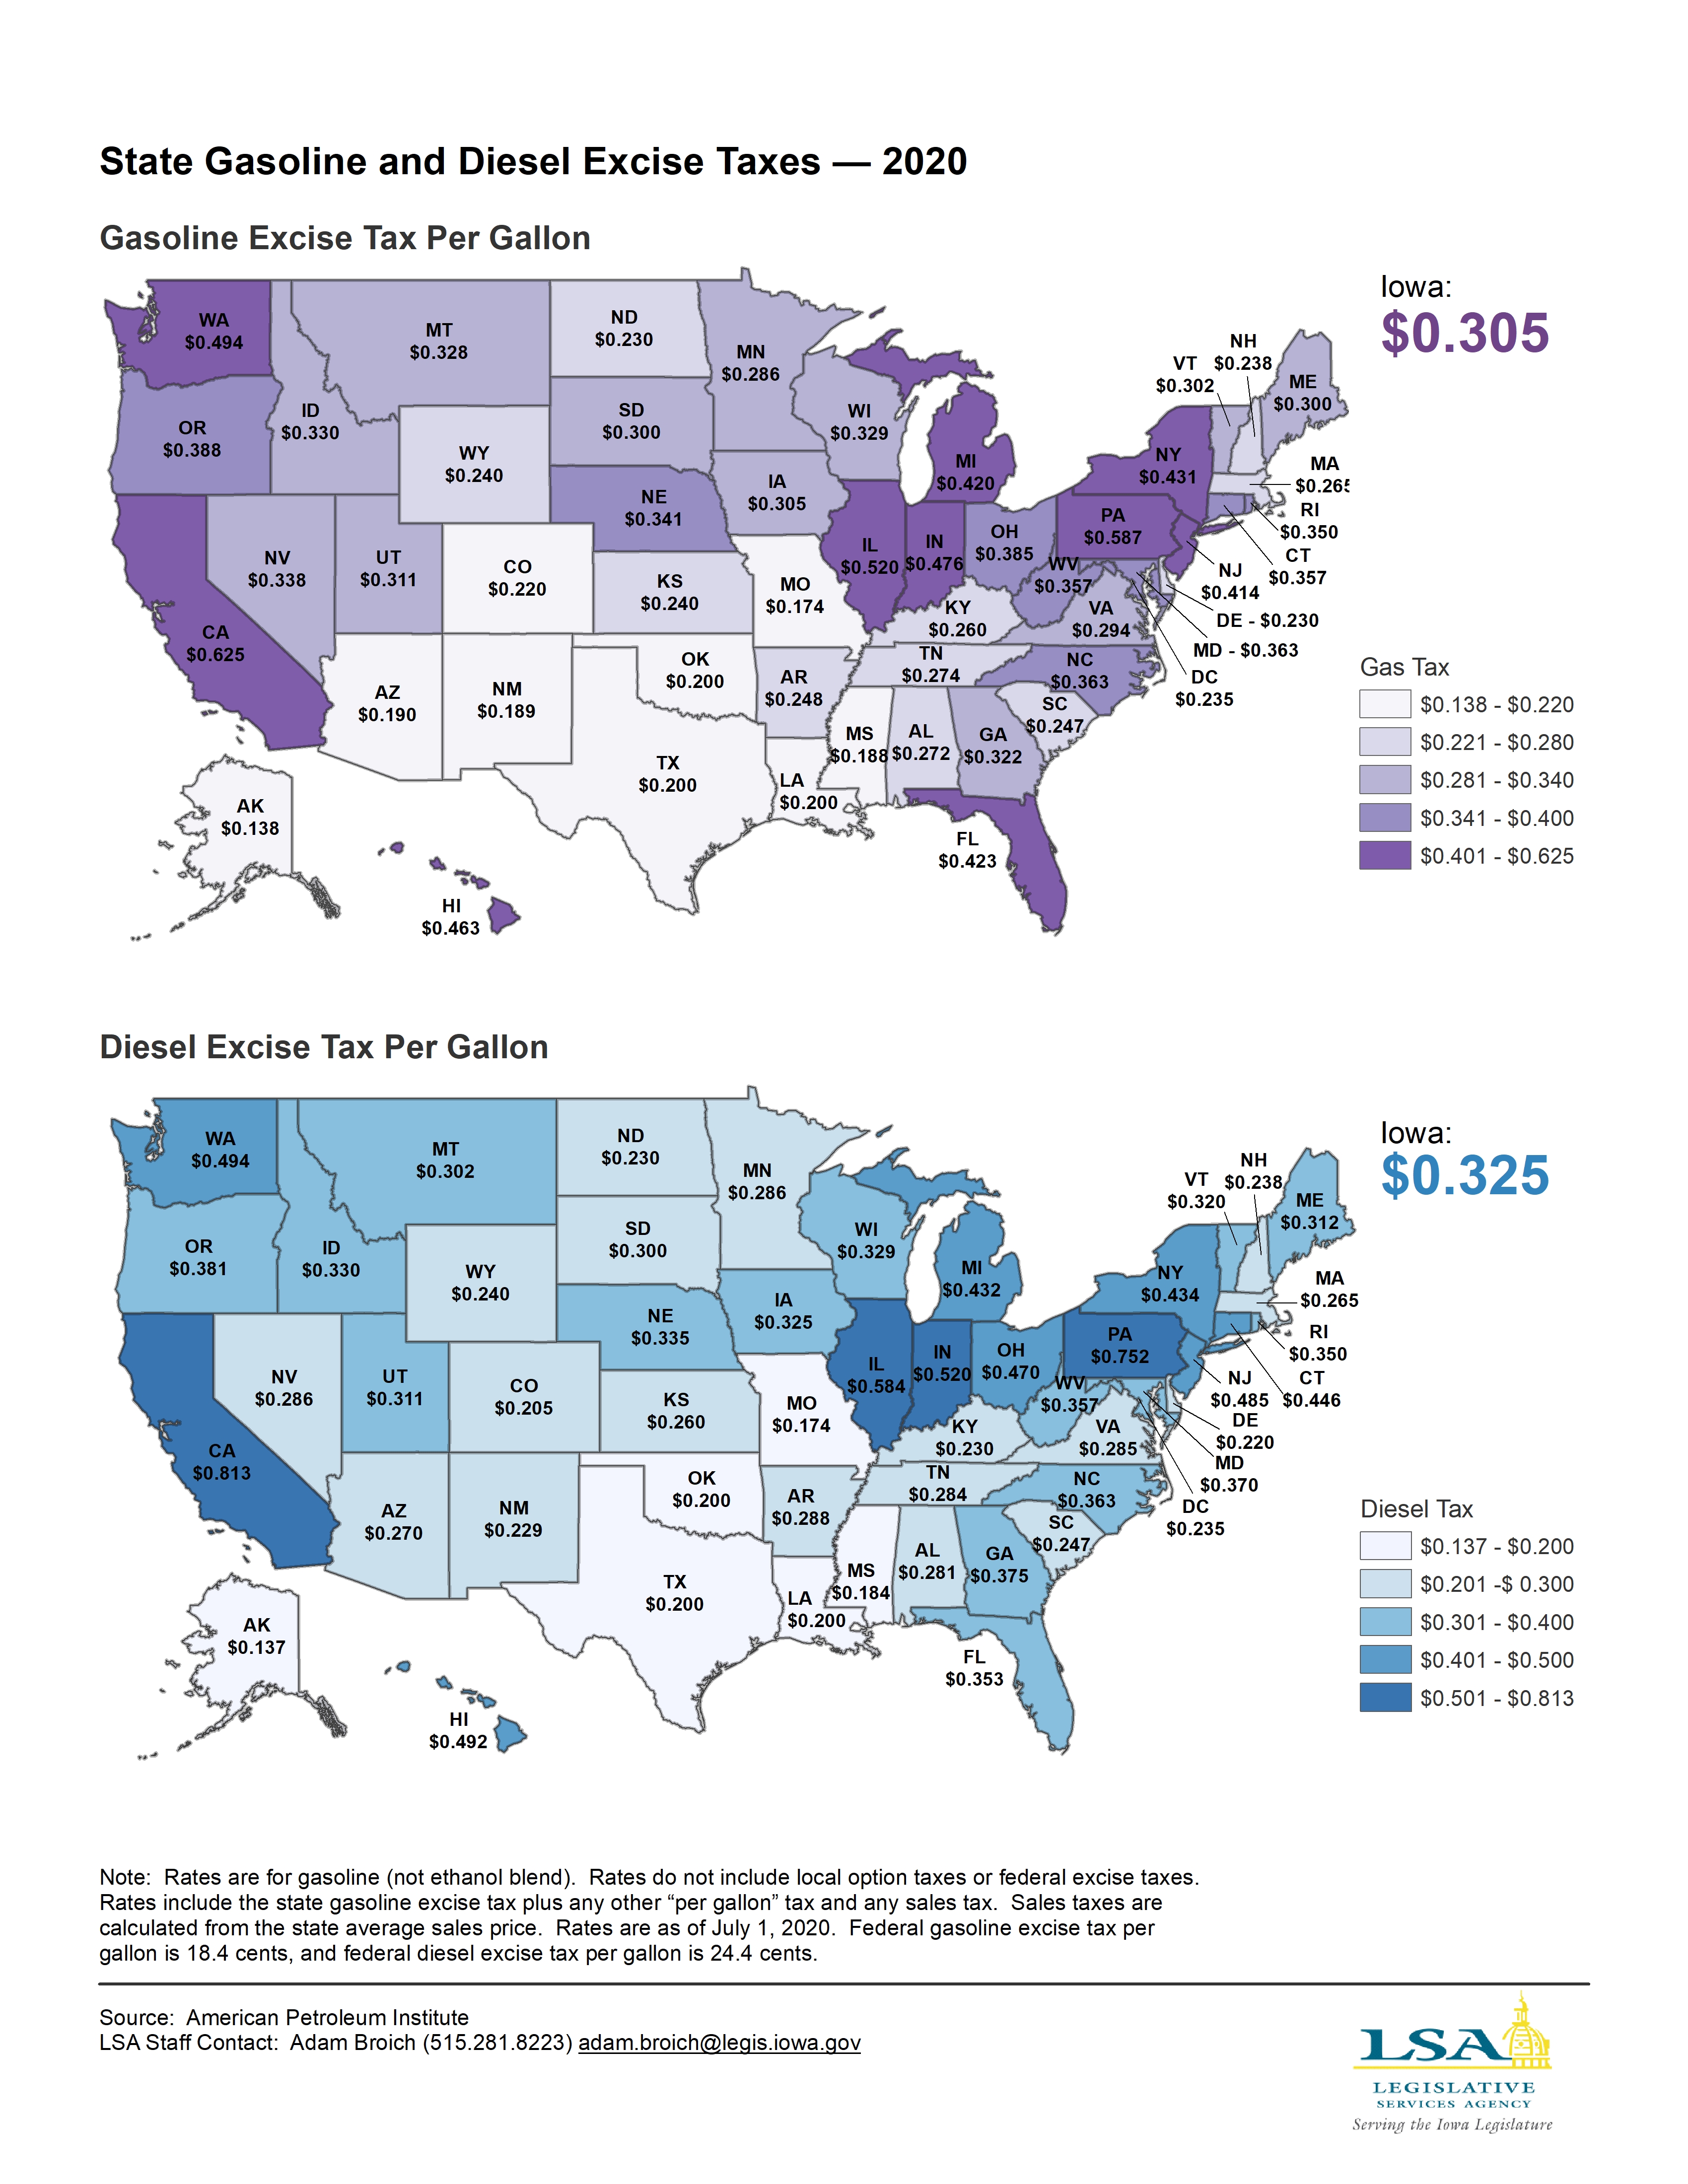
State Gasoline and Diesel Tax Rates Per Gallon — 2020
|
|
|
|
|
| 02/08/2021 |
Iowa Insights |
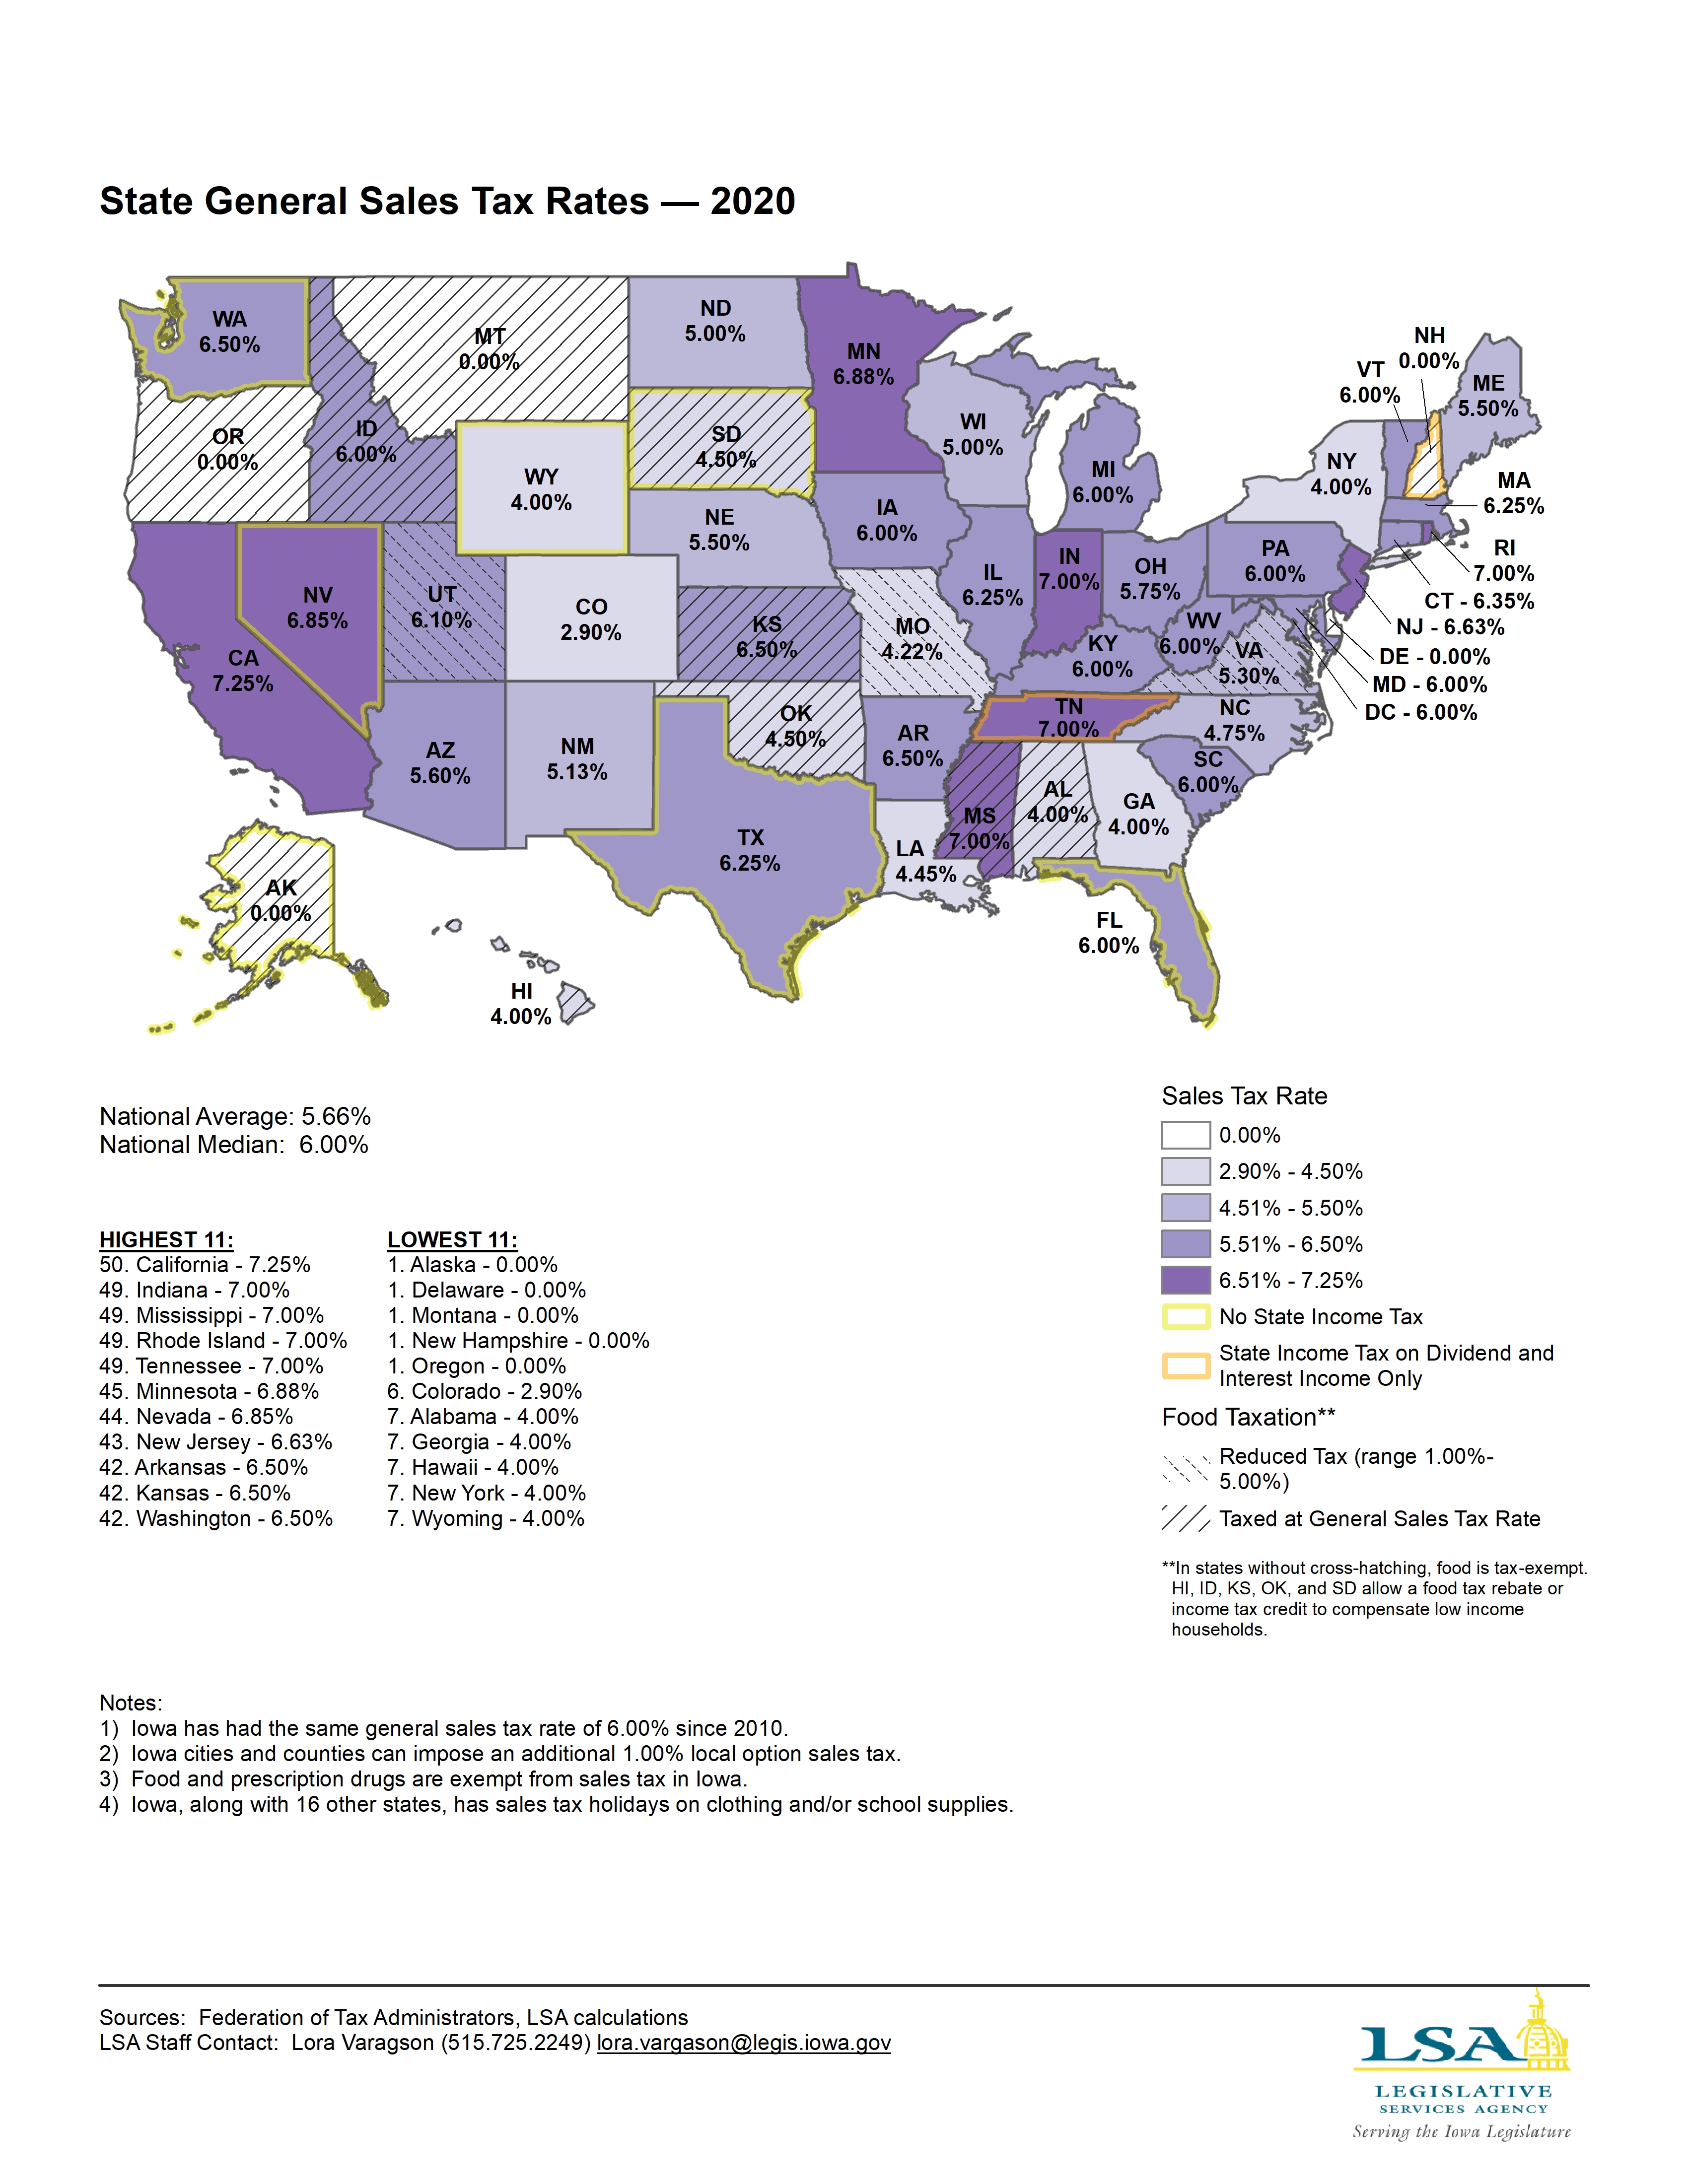
State General Sales Tax Rates — 2020
|
|
|
|
|
| 02/01/2021 |
Iowa Insights |
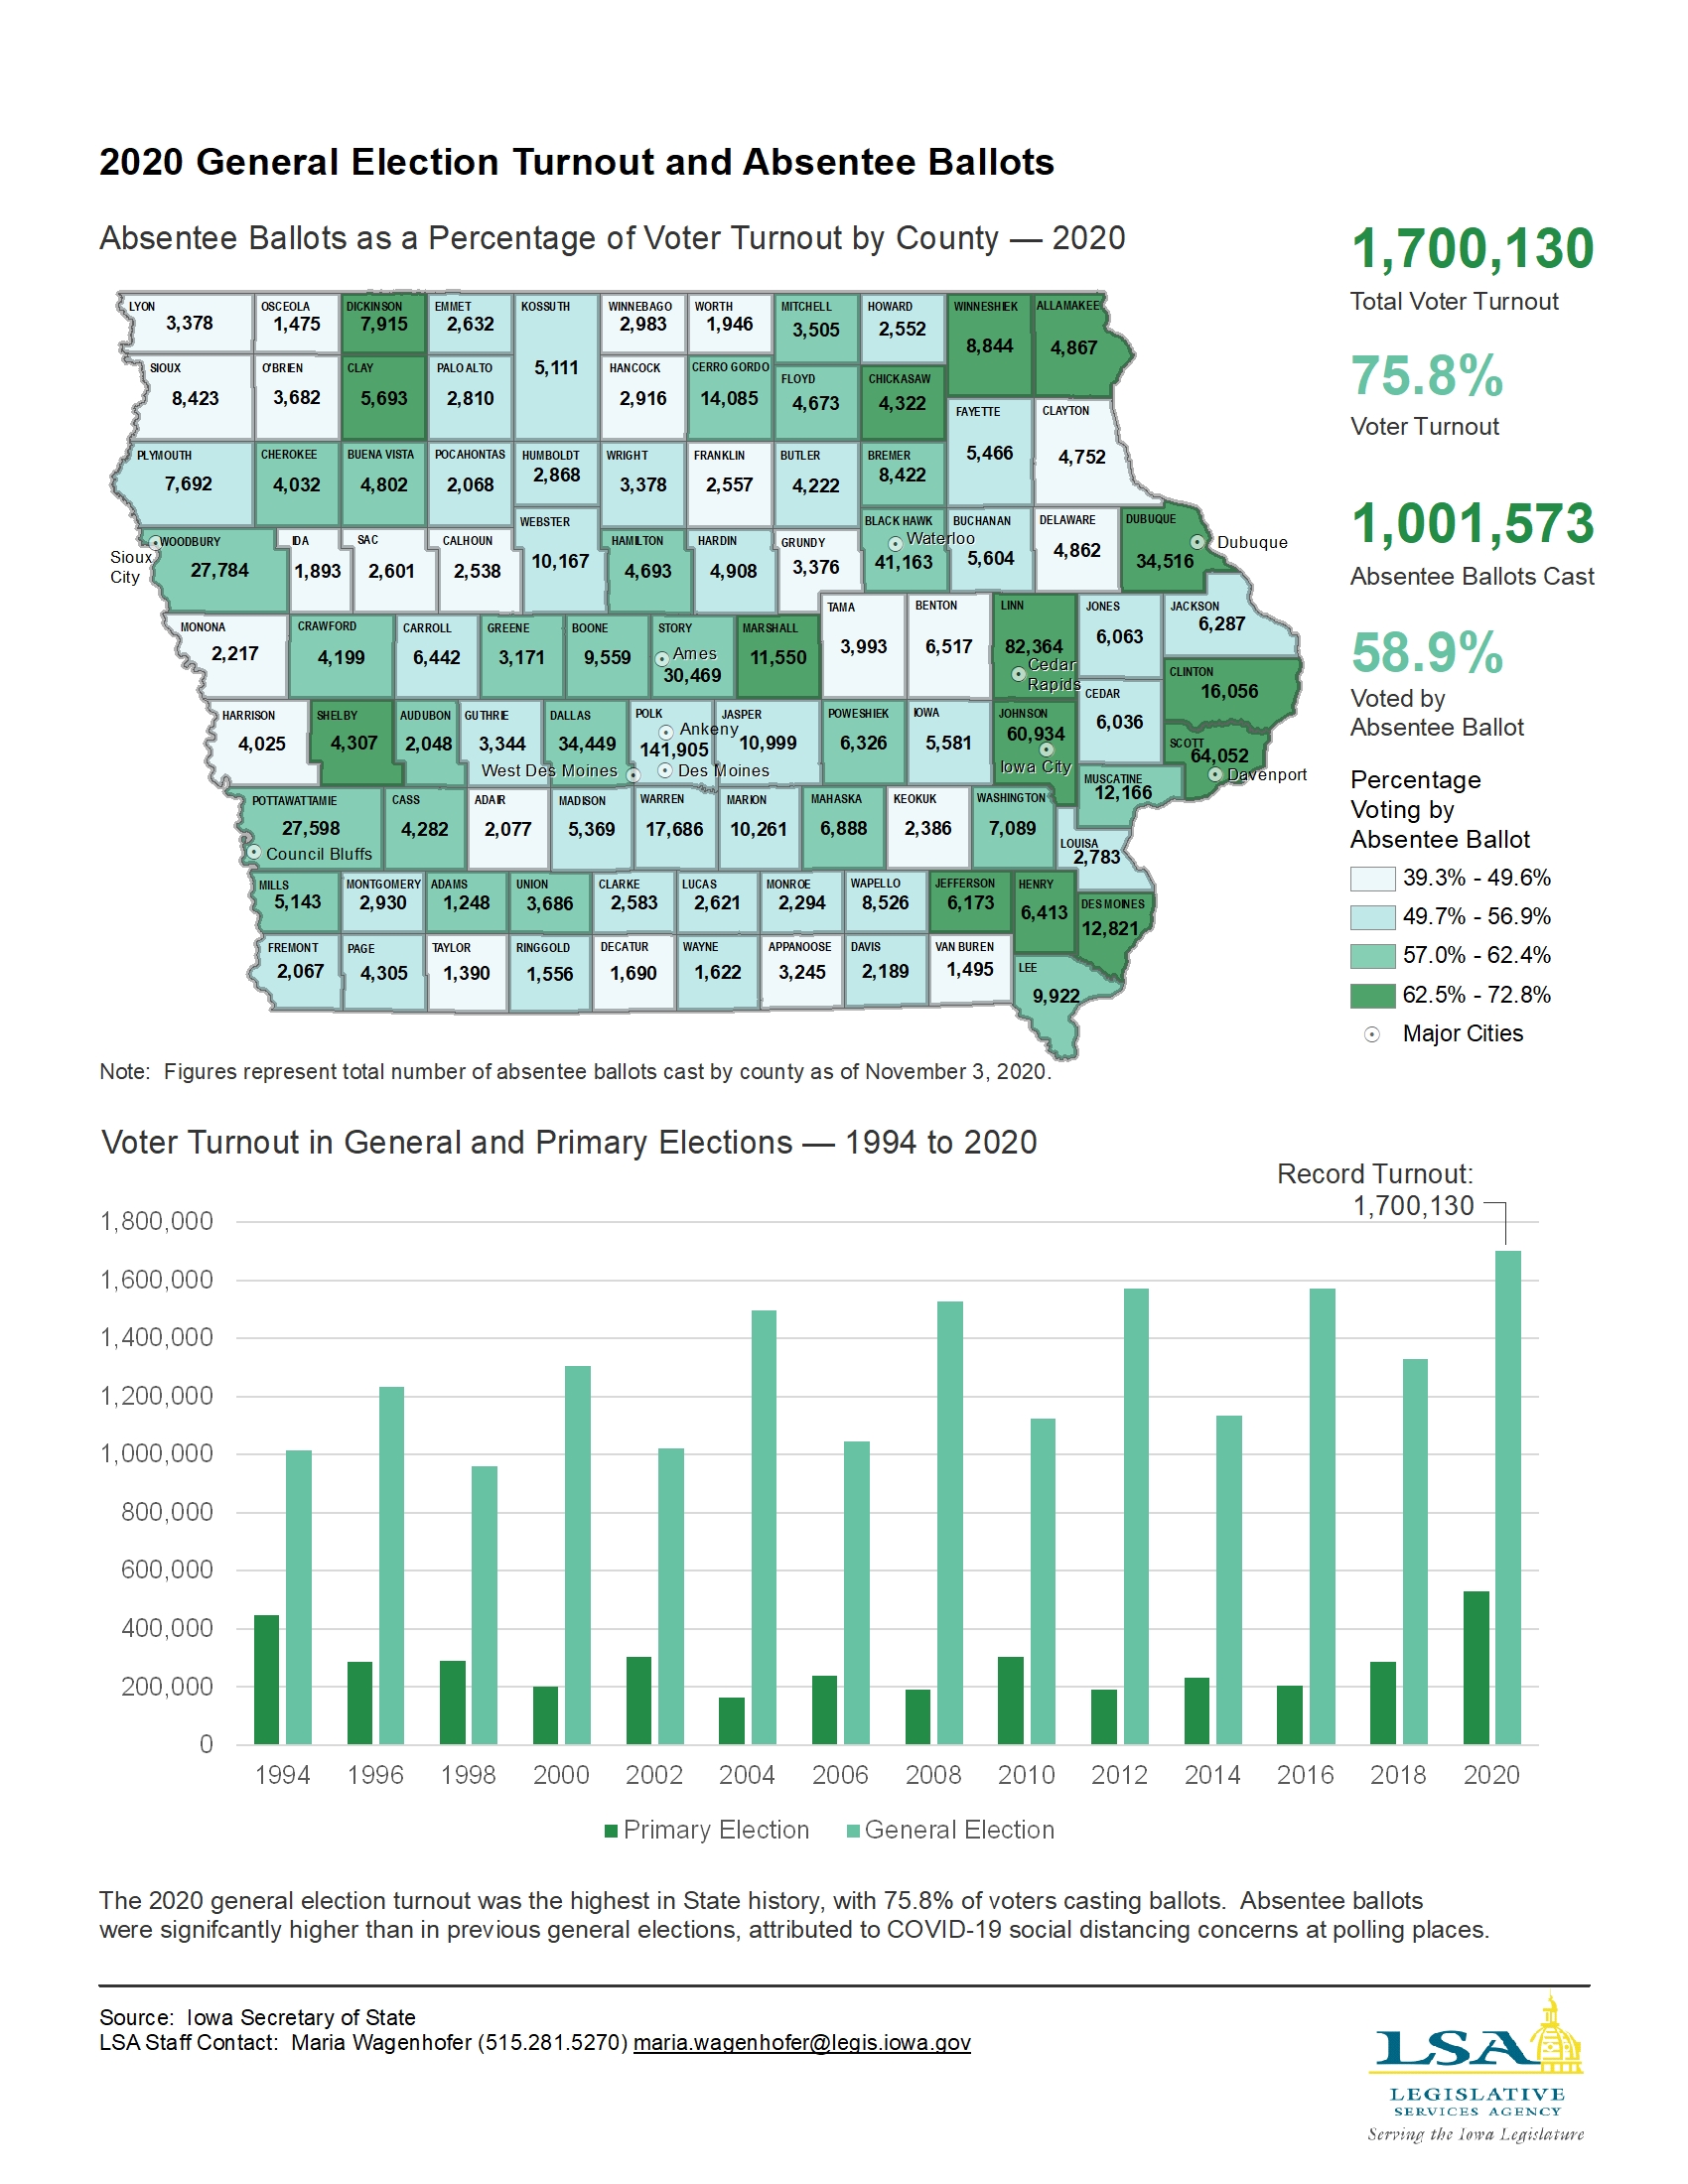
2020 General Election Turnout and Voting by Absentee Ballot
|
|
|
|
|
| 01/25/2021 |
Iowa Insights |
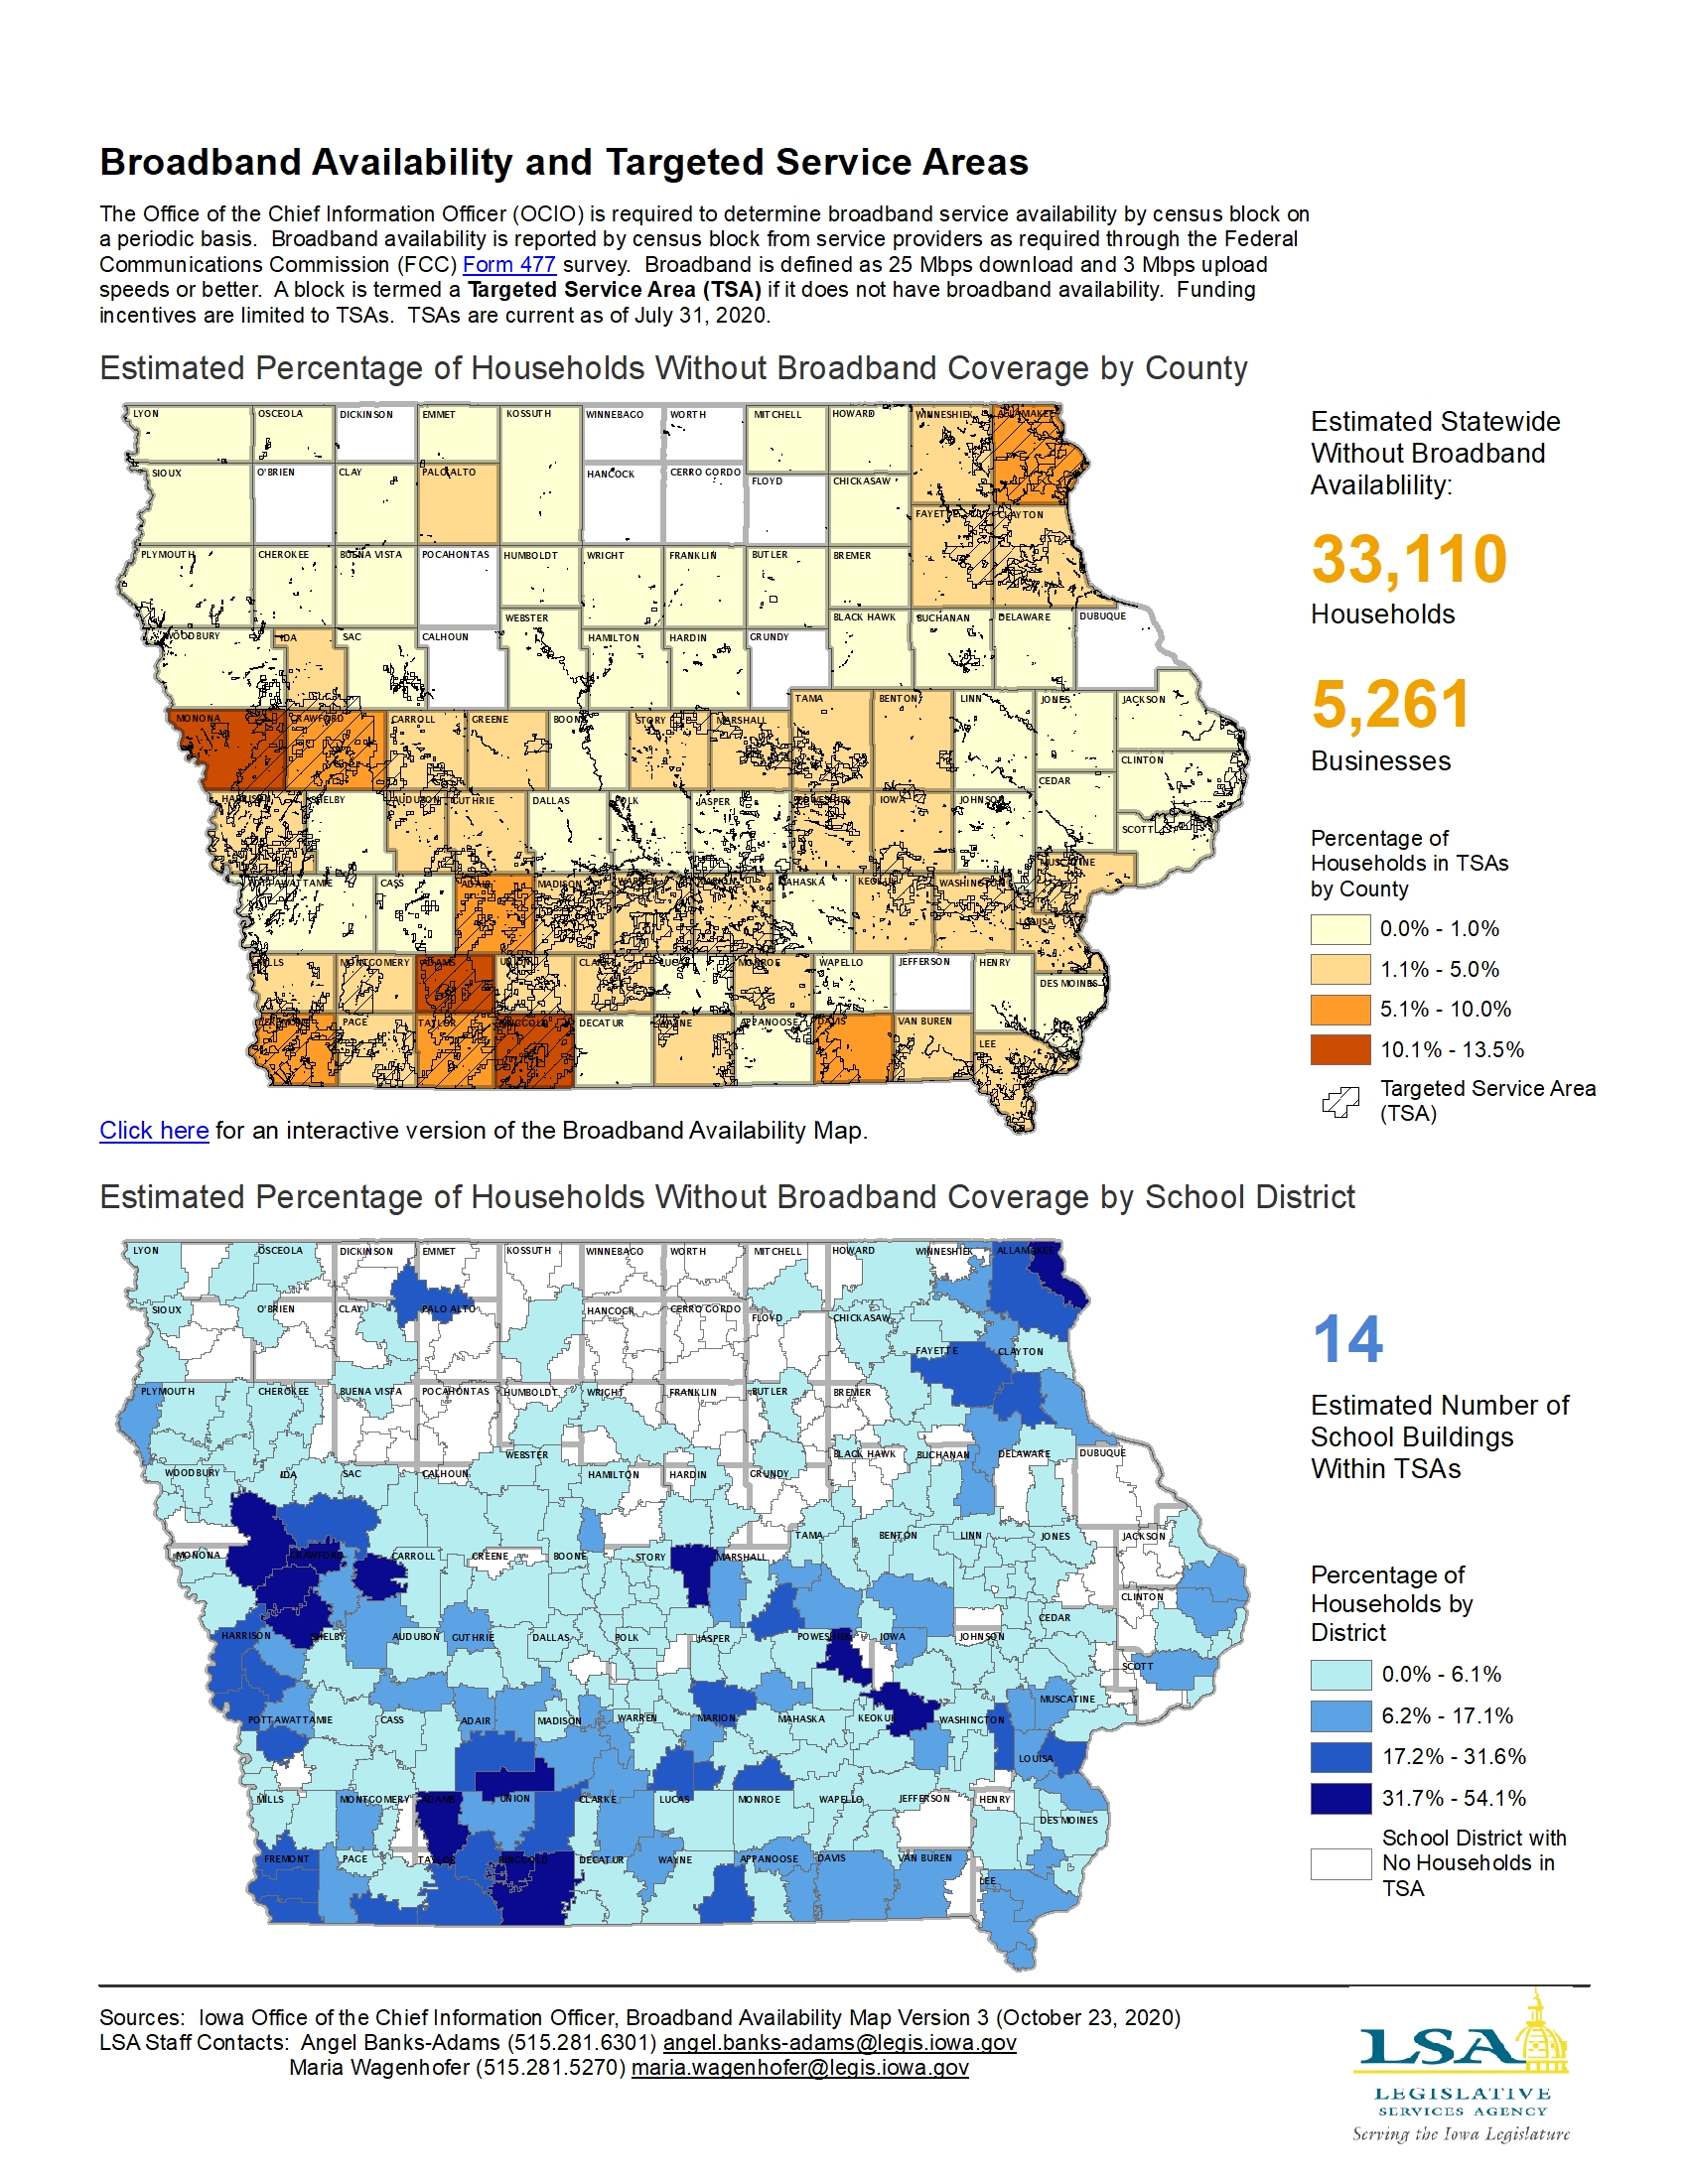
Broadband Availability and Targeted Service Areas
|
|
|
|
|
| 01/18/2021 |
Iowa Insights |
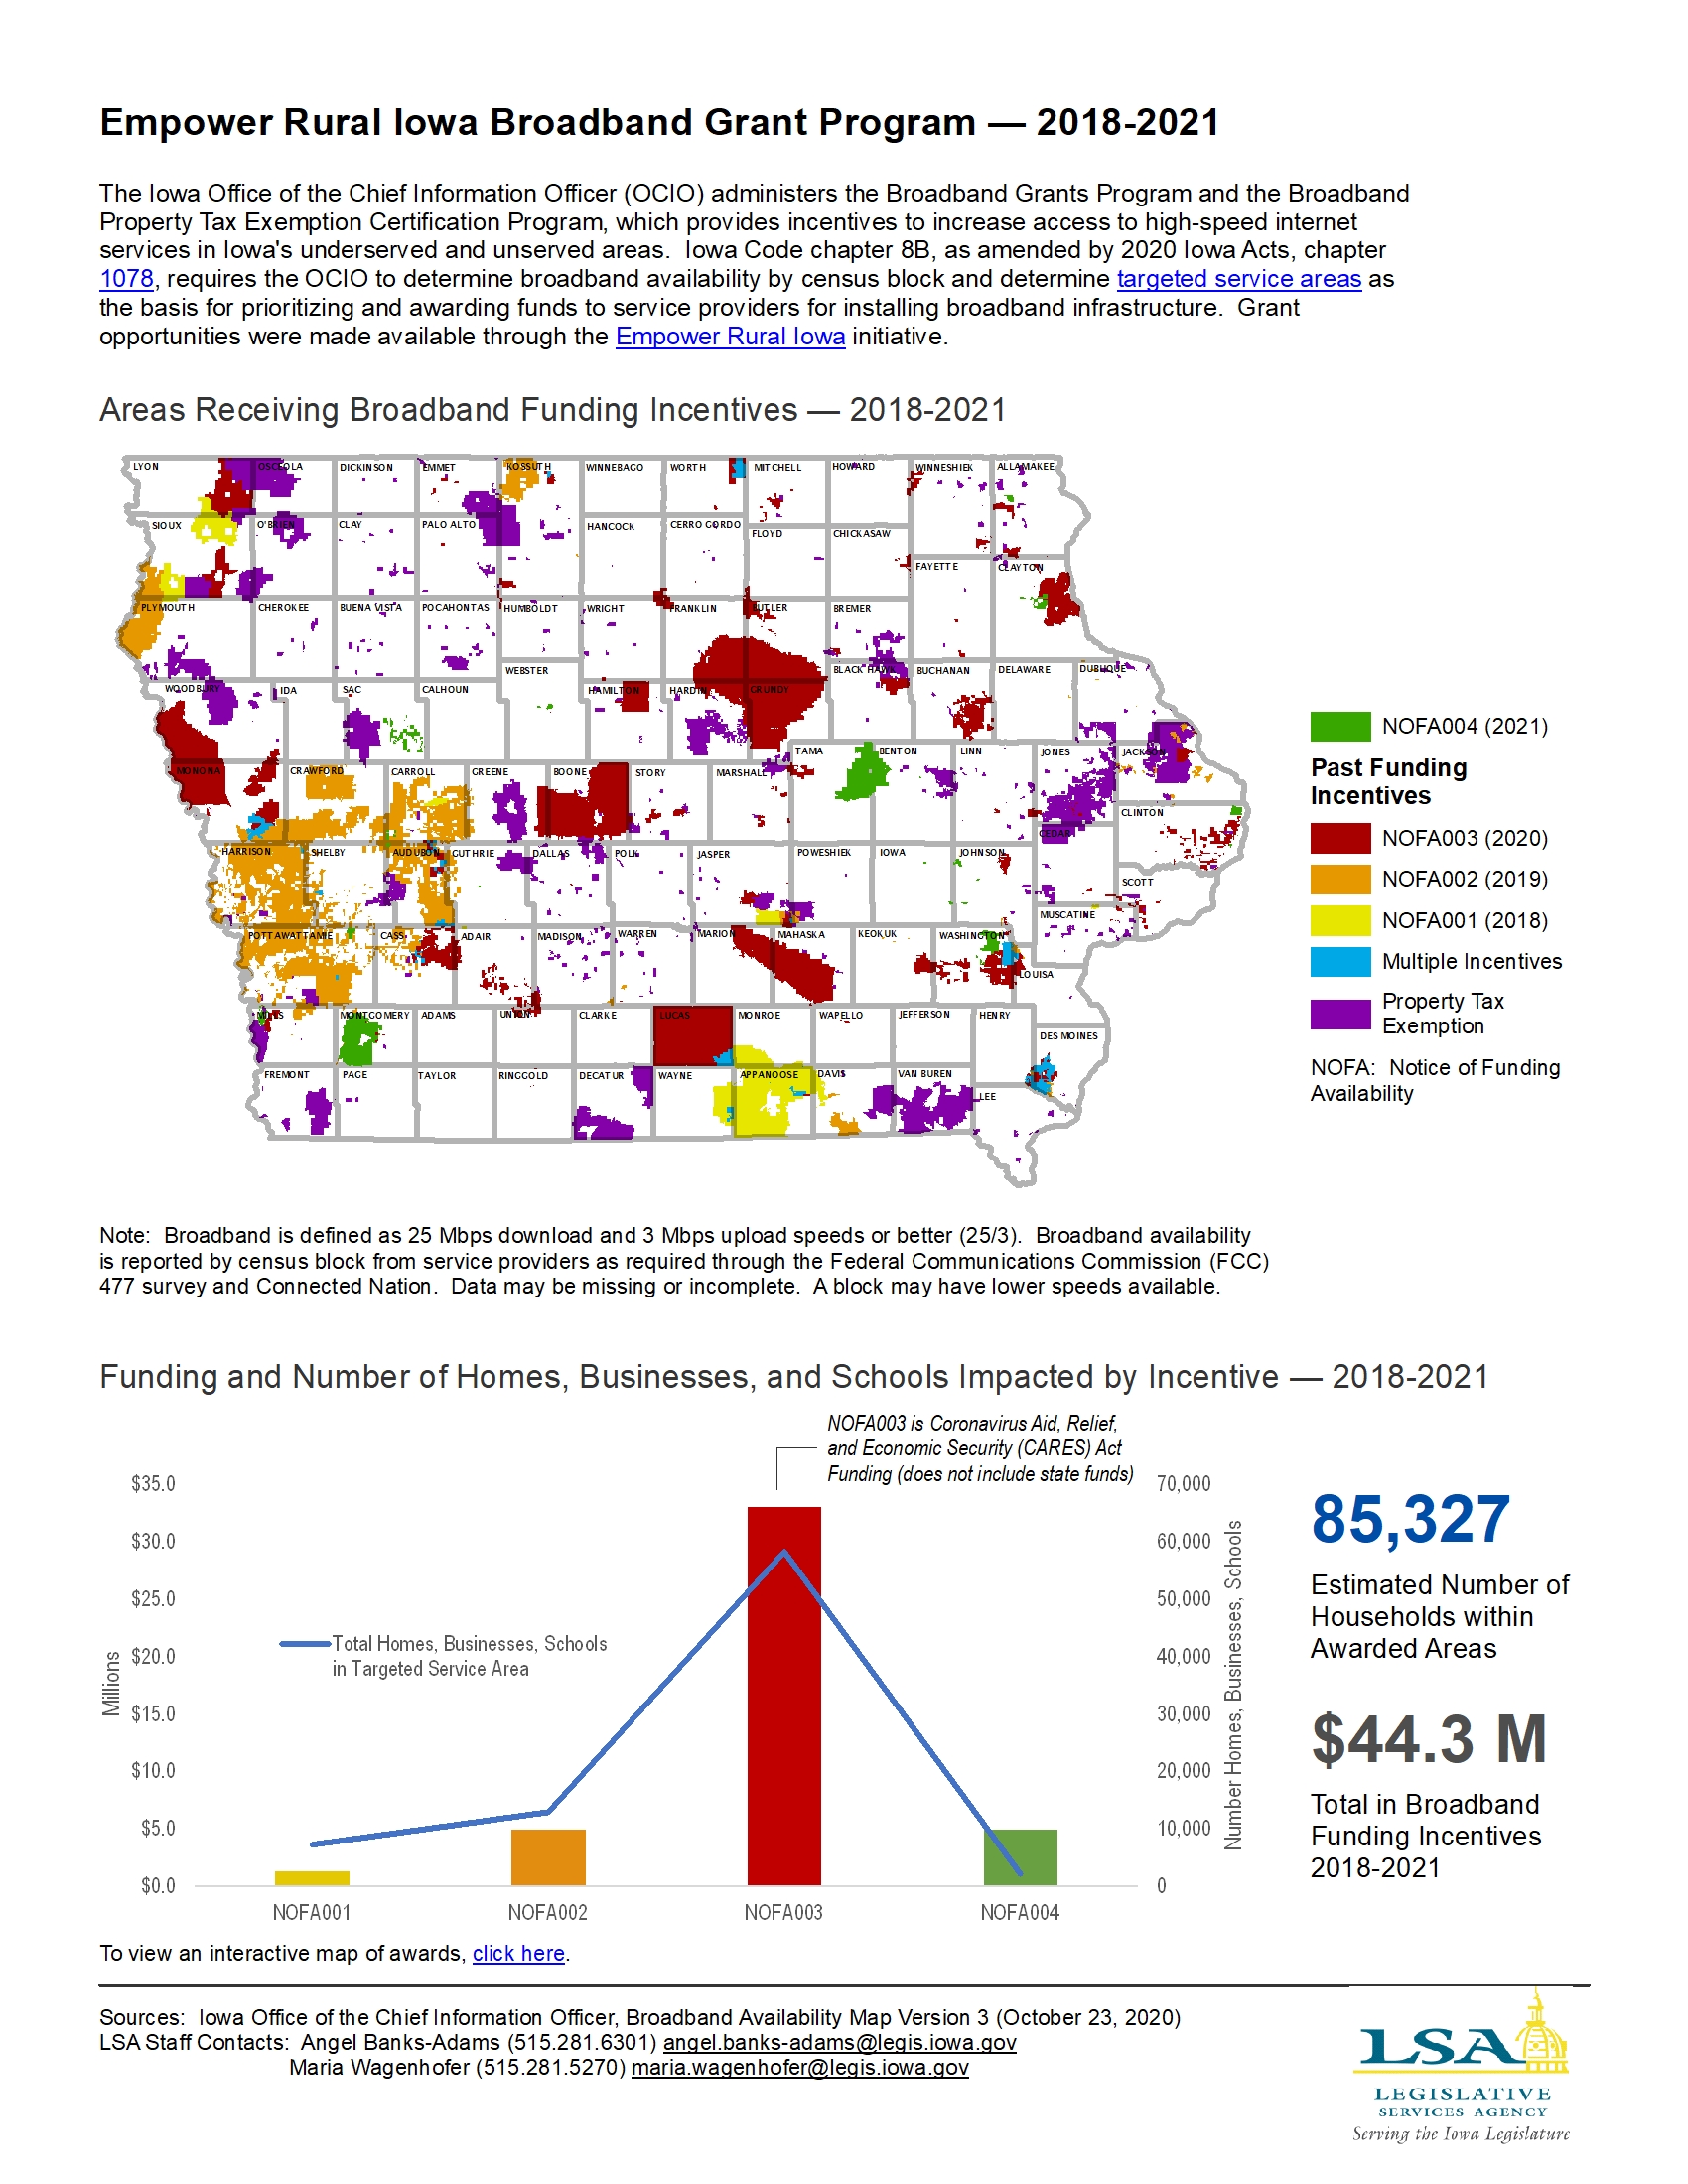
Empower Rural Iowa Broadband Grant Program — 2018-2021
|
|
|
|
|
| 01/11/2021 |
Iowa Insights |
Governor's Emergency Education Relief (GEER) Funds

|
|
|
|
|
| 01/04/2021 |
Iowa Insights |
Change in Certified Enrollment and Statewide Voluntary Preschool Program Weightings — Oct. 2019 - Oct. 2020

|
|
|
|
|
| 12/21/2020 |
Iowa Insights |
Computer Science Professional Development Incentive Fund

|
|
|
|
|
| 12/07/2020 |
Iowa Insights |
Community College Enrollment — Fall 2020

|
|
|
|
|
| 11/30/2020 |
Iowa Insights |
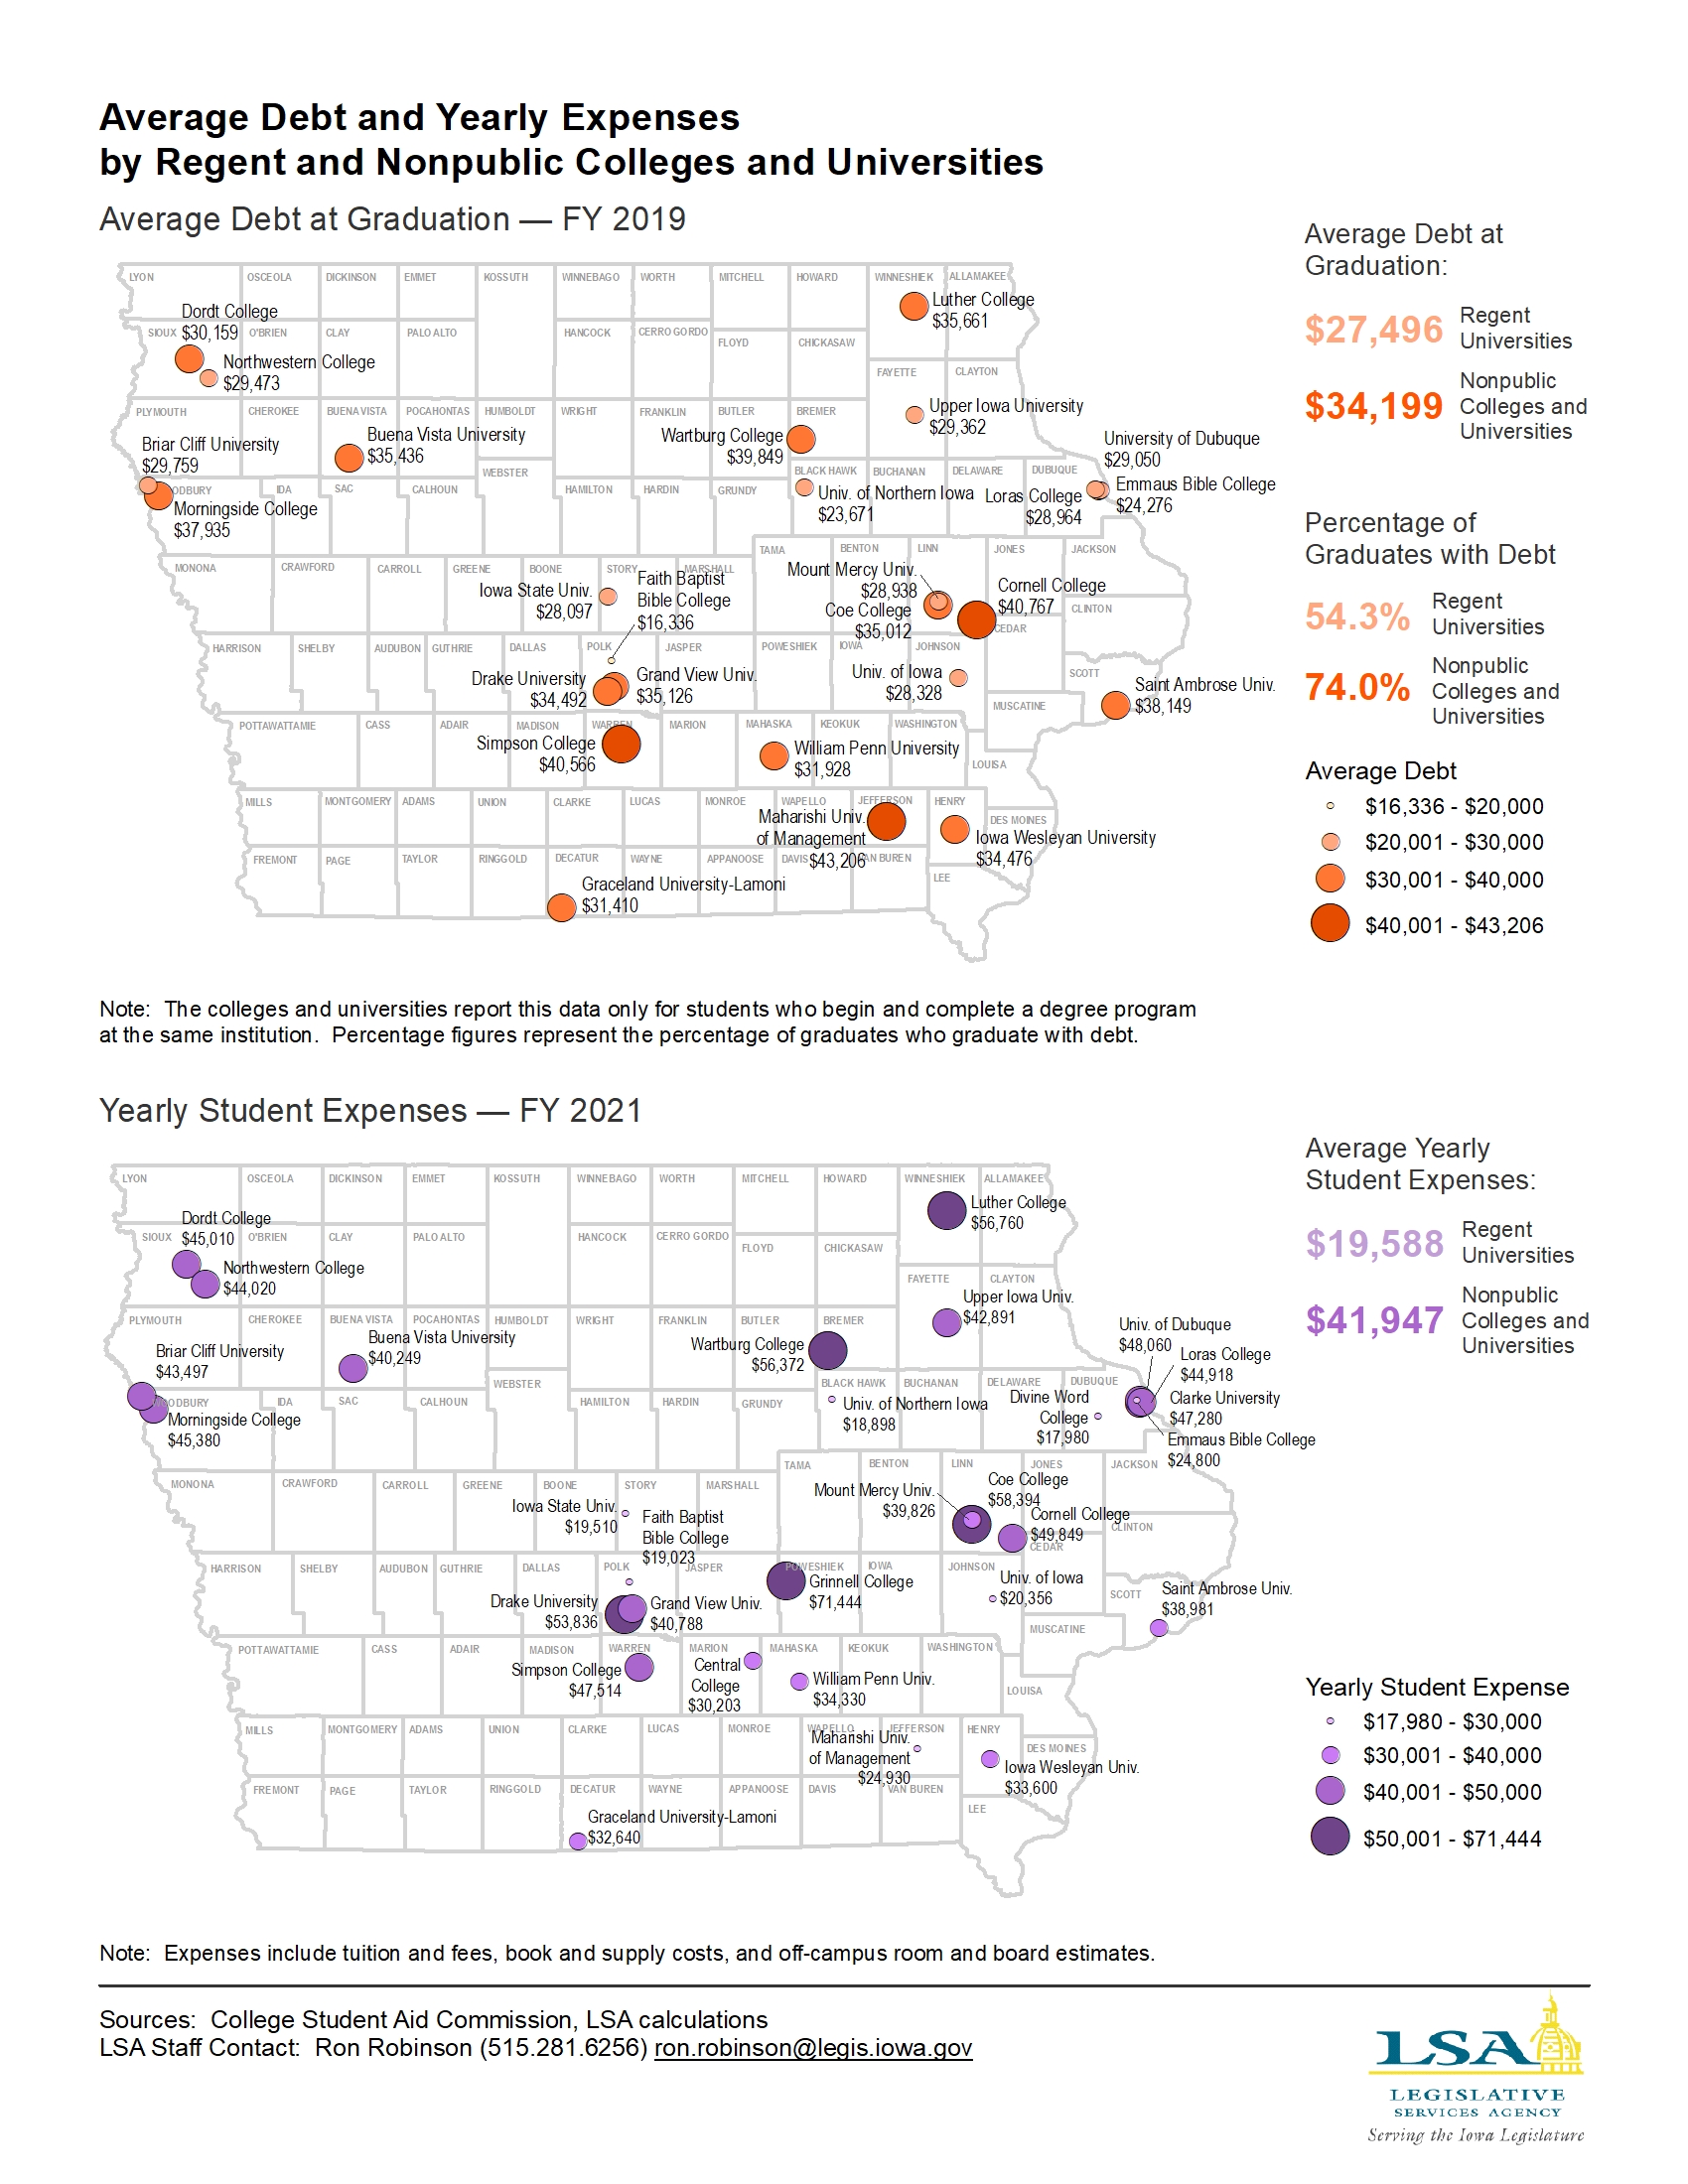
Average Debt at Graduation and Yearly Expenses by Regent and Nonpublic Colleges and Universities
|
|
|
|
|
| 11/23/2020 |
Iowa Insights |
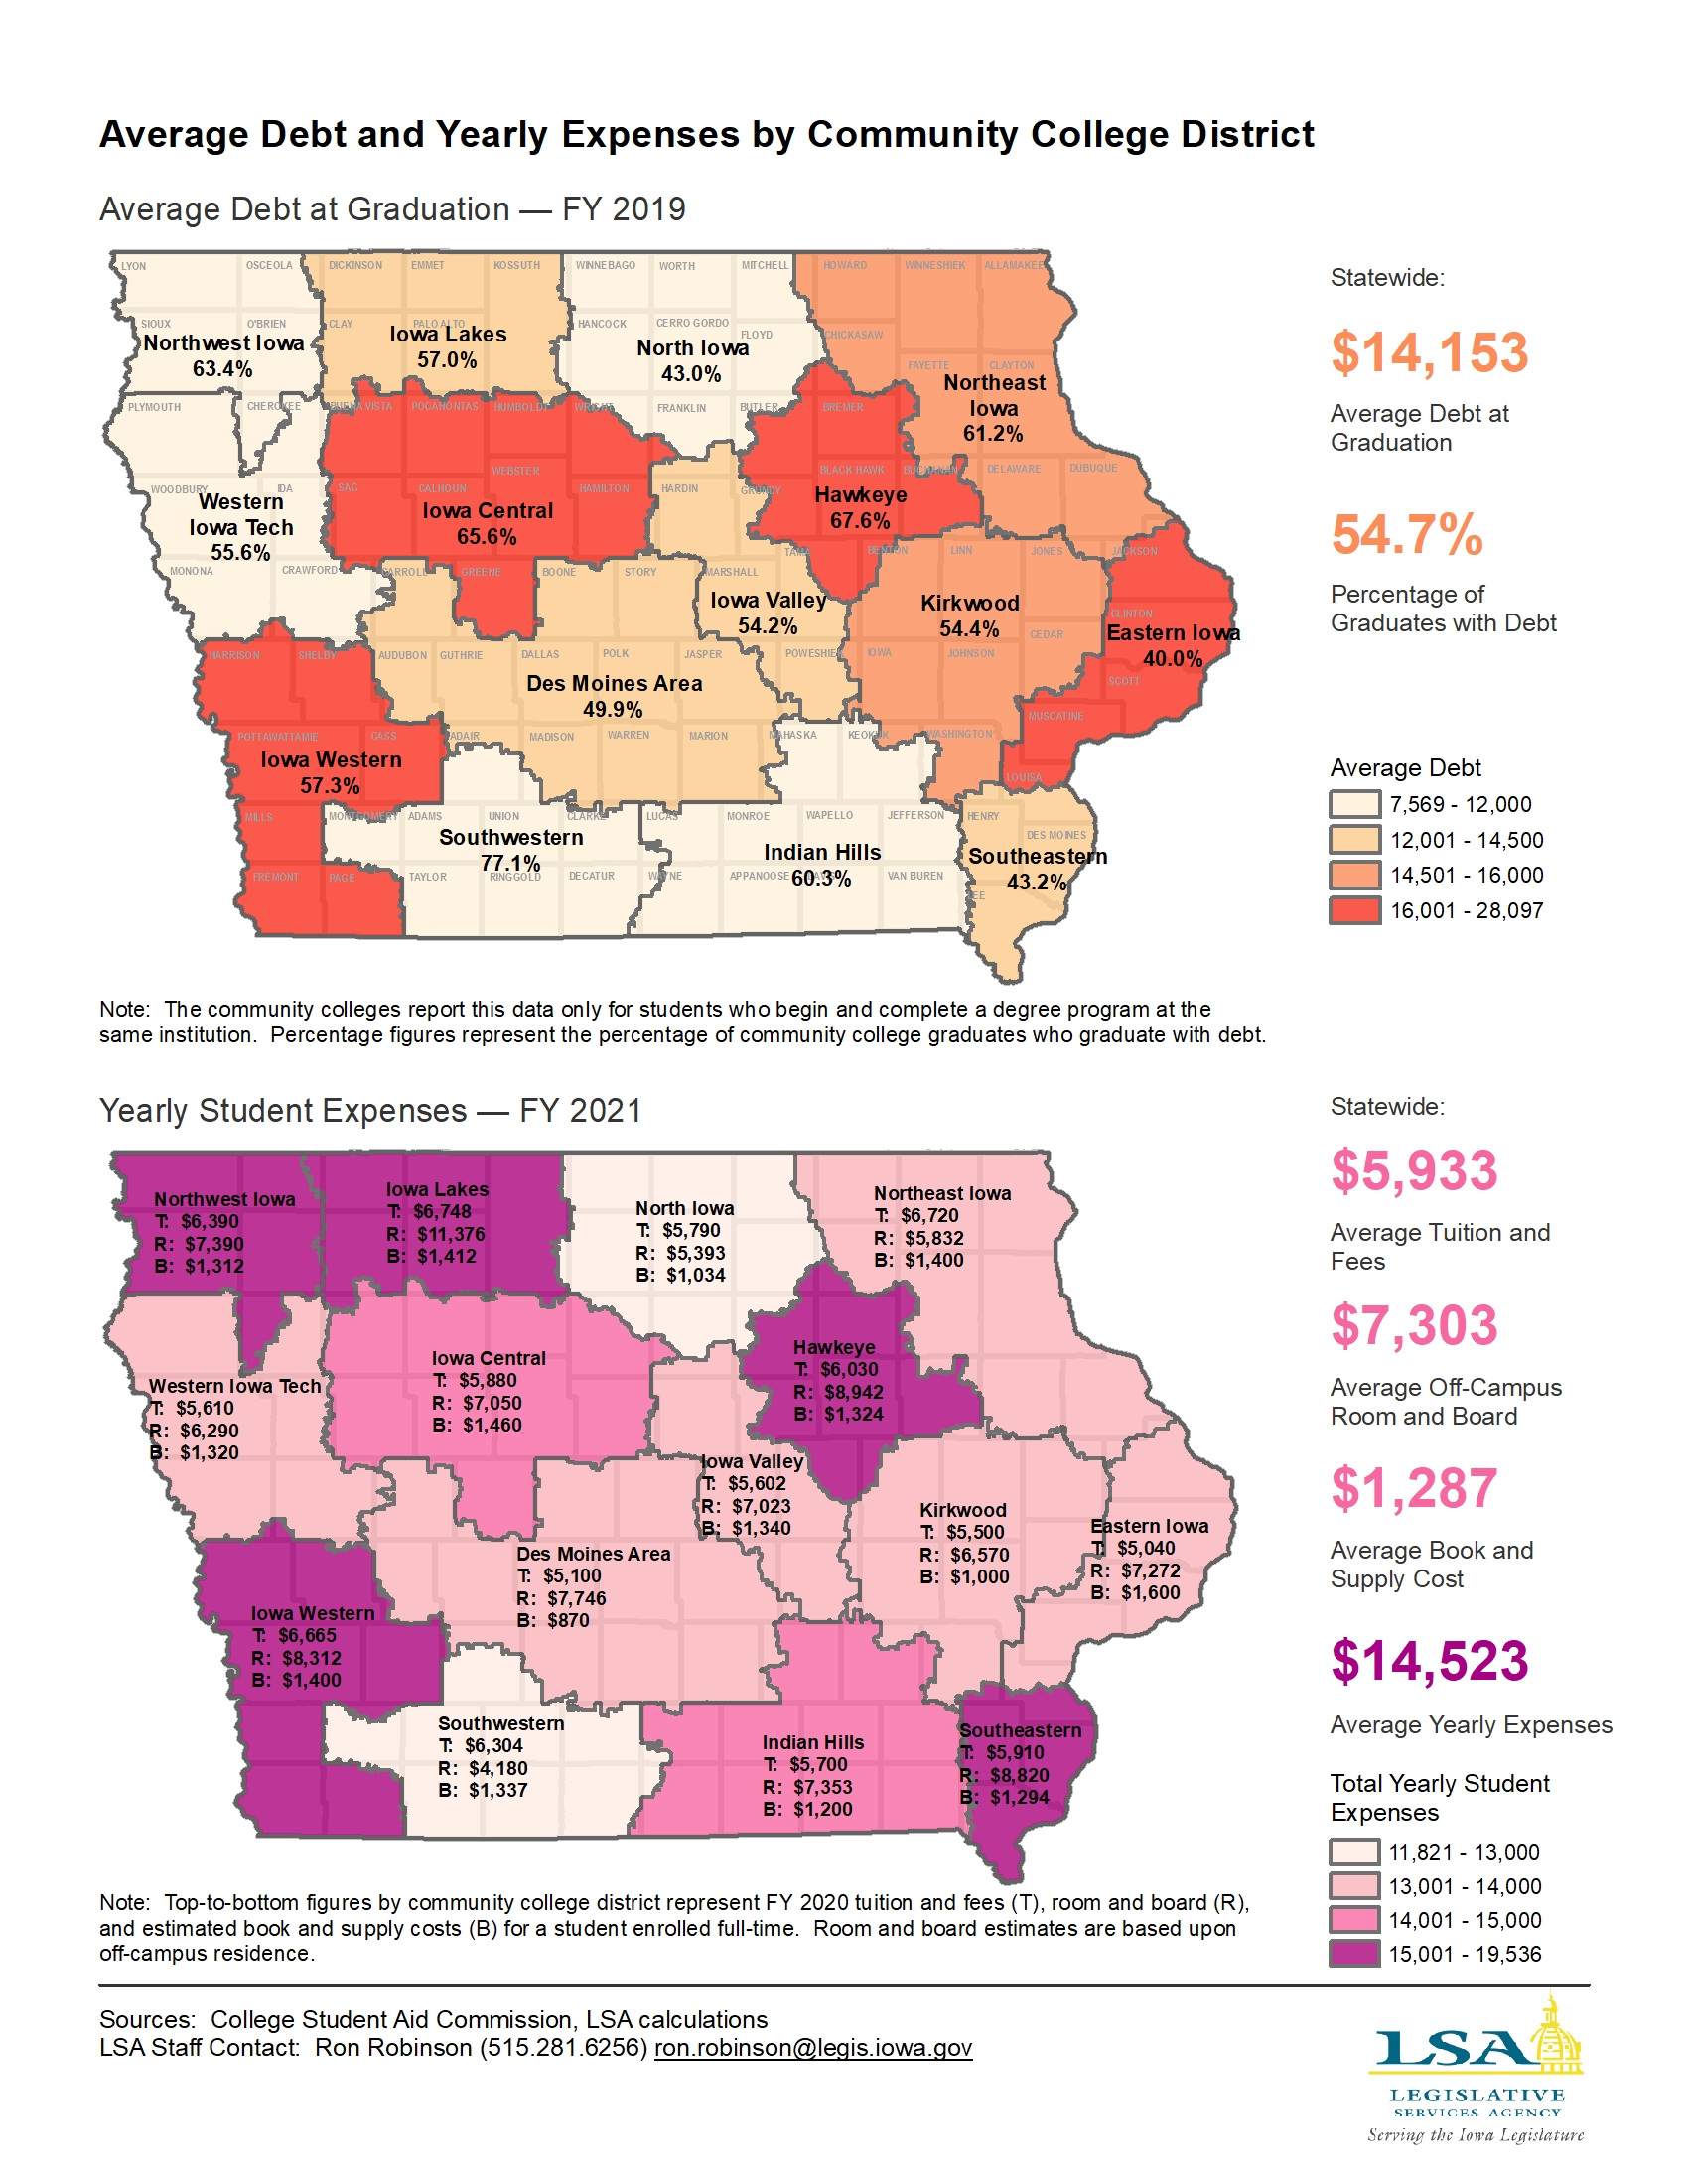
Average Debt at Graduation and Yearly Expenses by Community College District
|
|
|
|
|
| 11/16/2020 |
Iowa Insights |
Community College Enrollment — Fall 2019

|
|
|
|
|
| 11/09/2020 |
Iowa Insights |
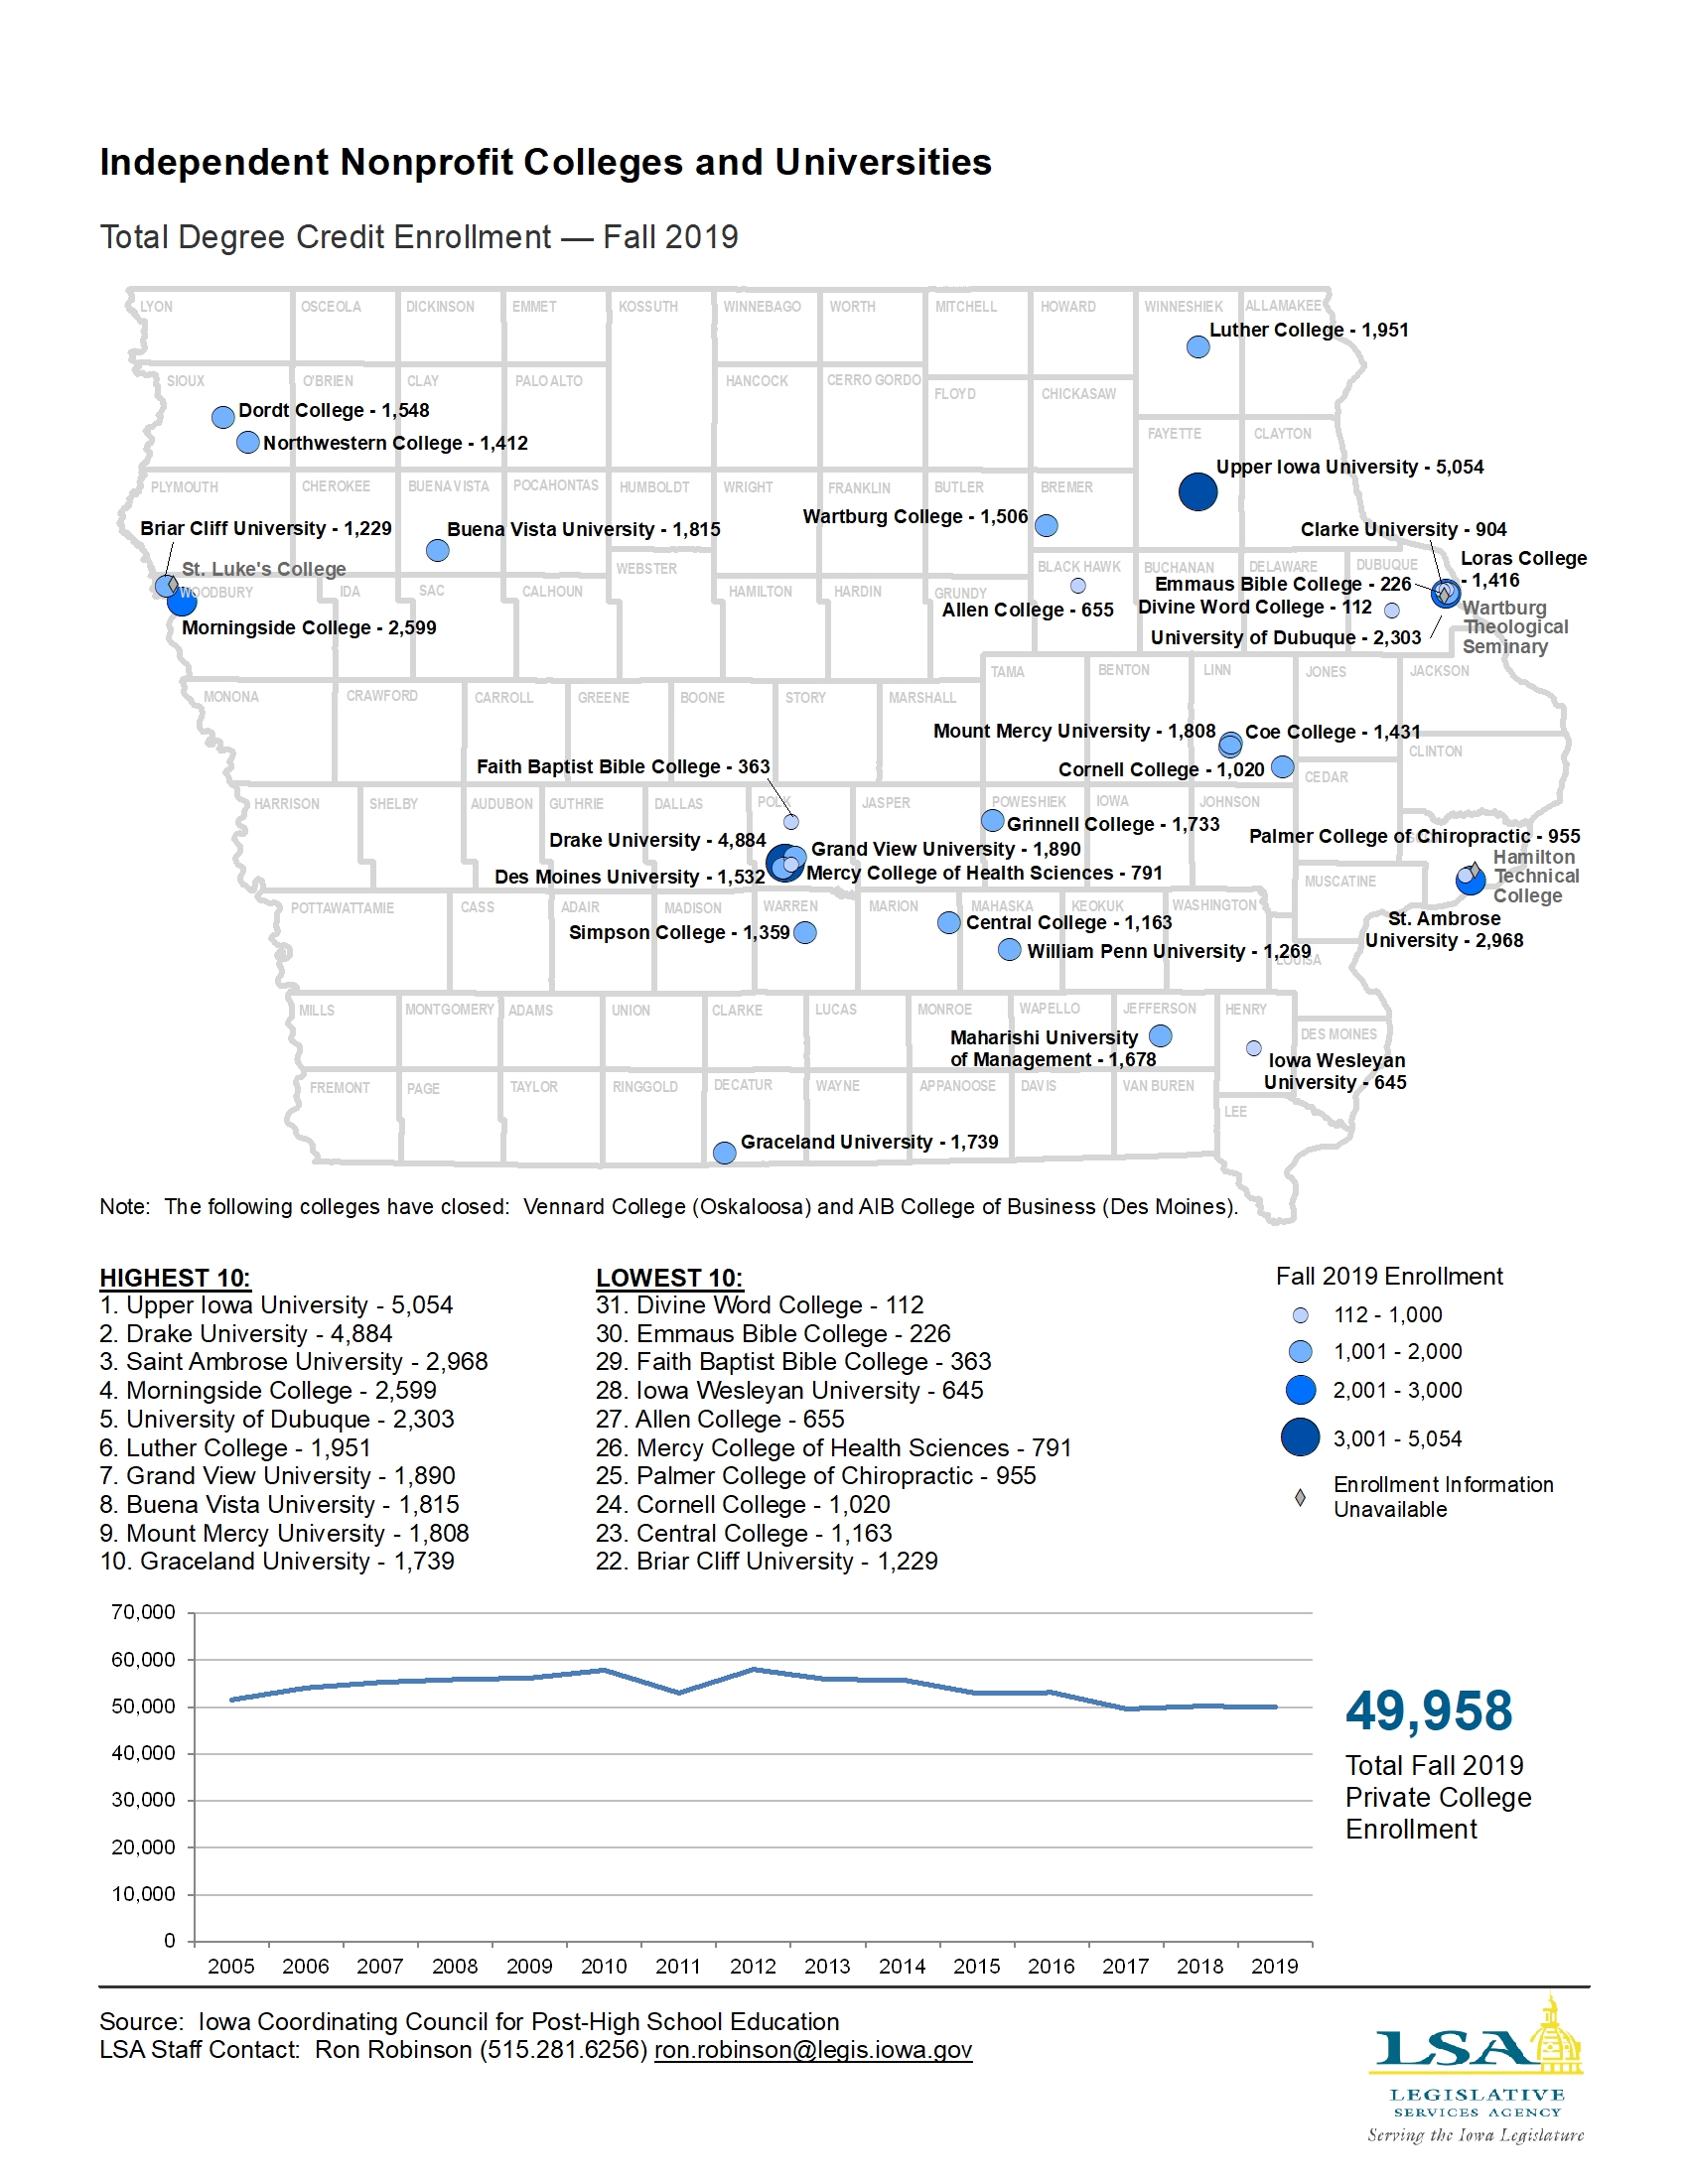
Independent Nonprofit Colleges and Universities Enrollment — Fall 2019
|
|
|
|
|
| 11/02/2020 |
Iowa Insights |
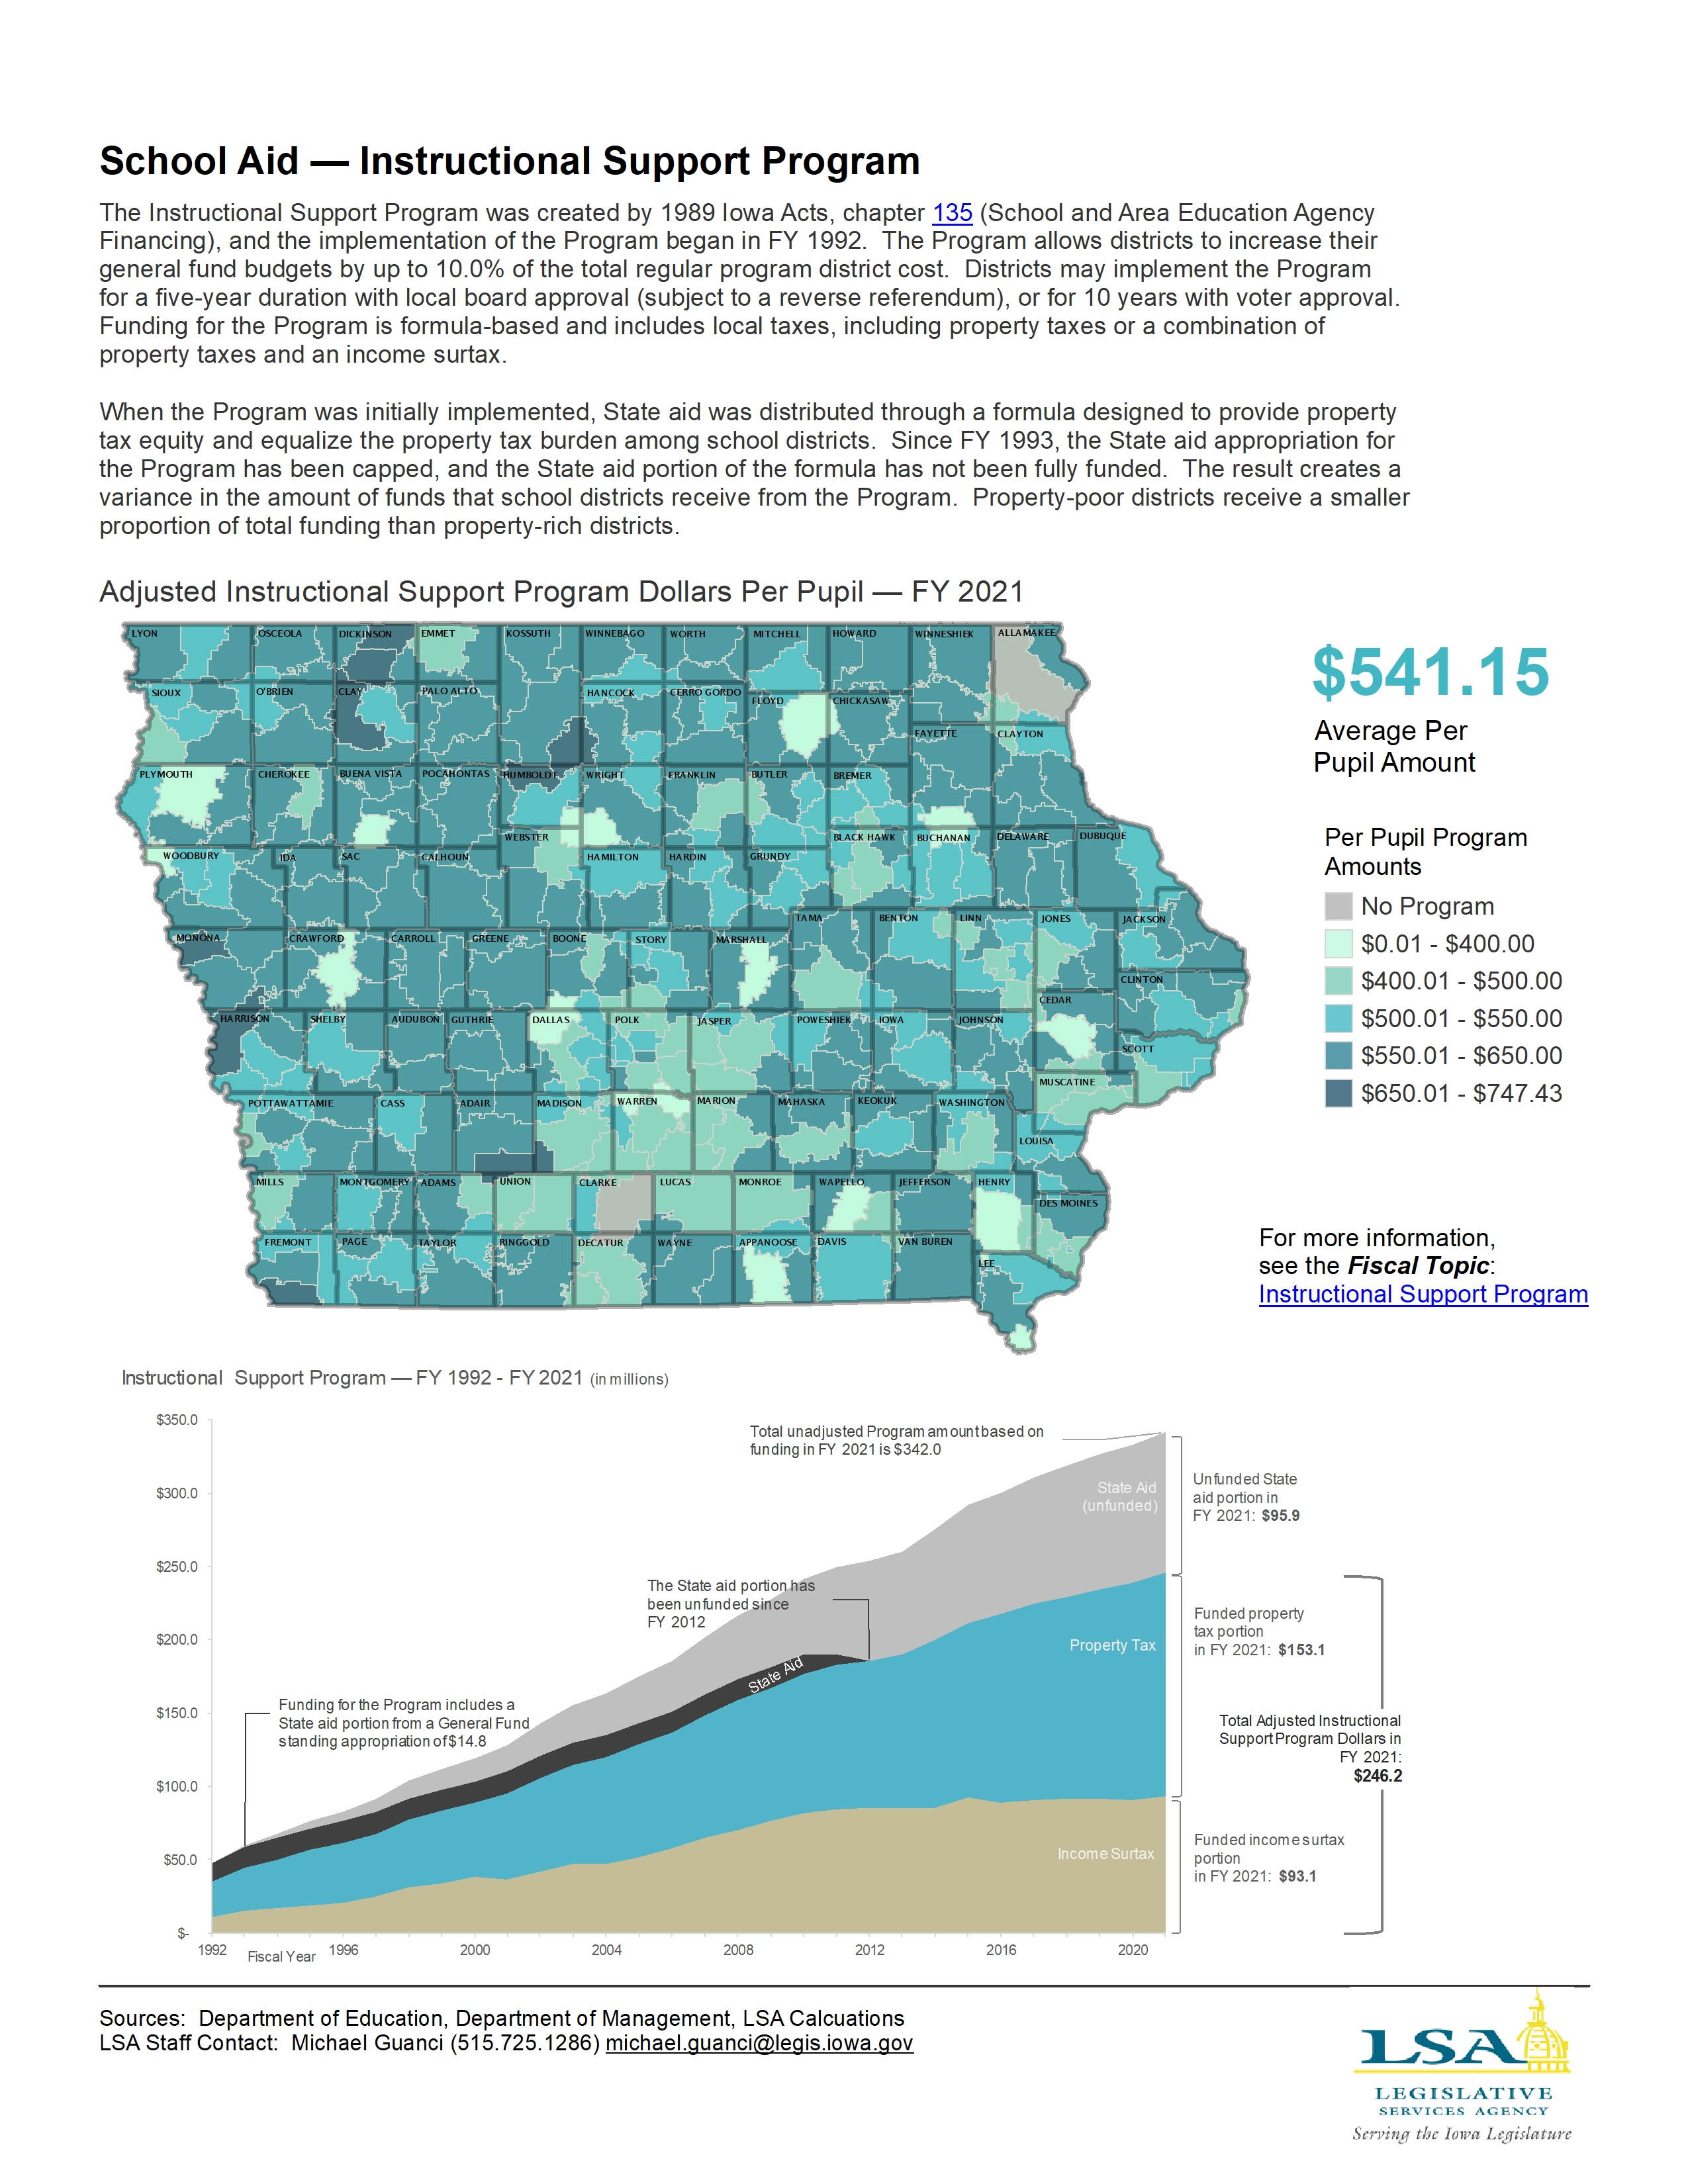
School Aid — Instructional Support Program
|
|
|
|
|
| 10/26/2020 |
Iowa Insights |
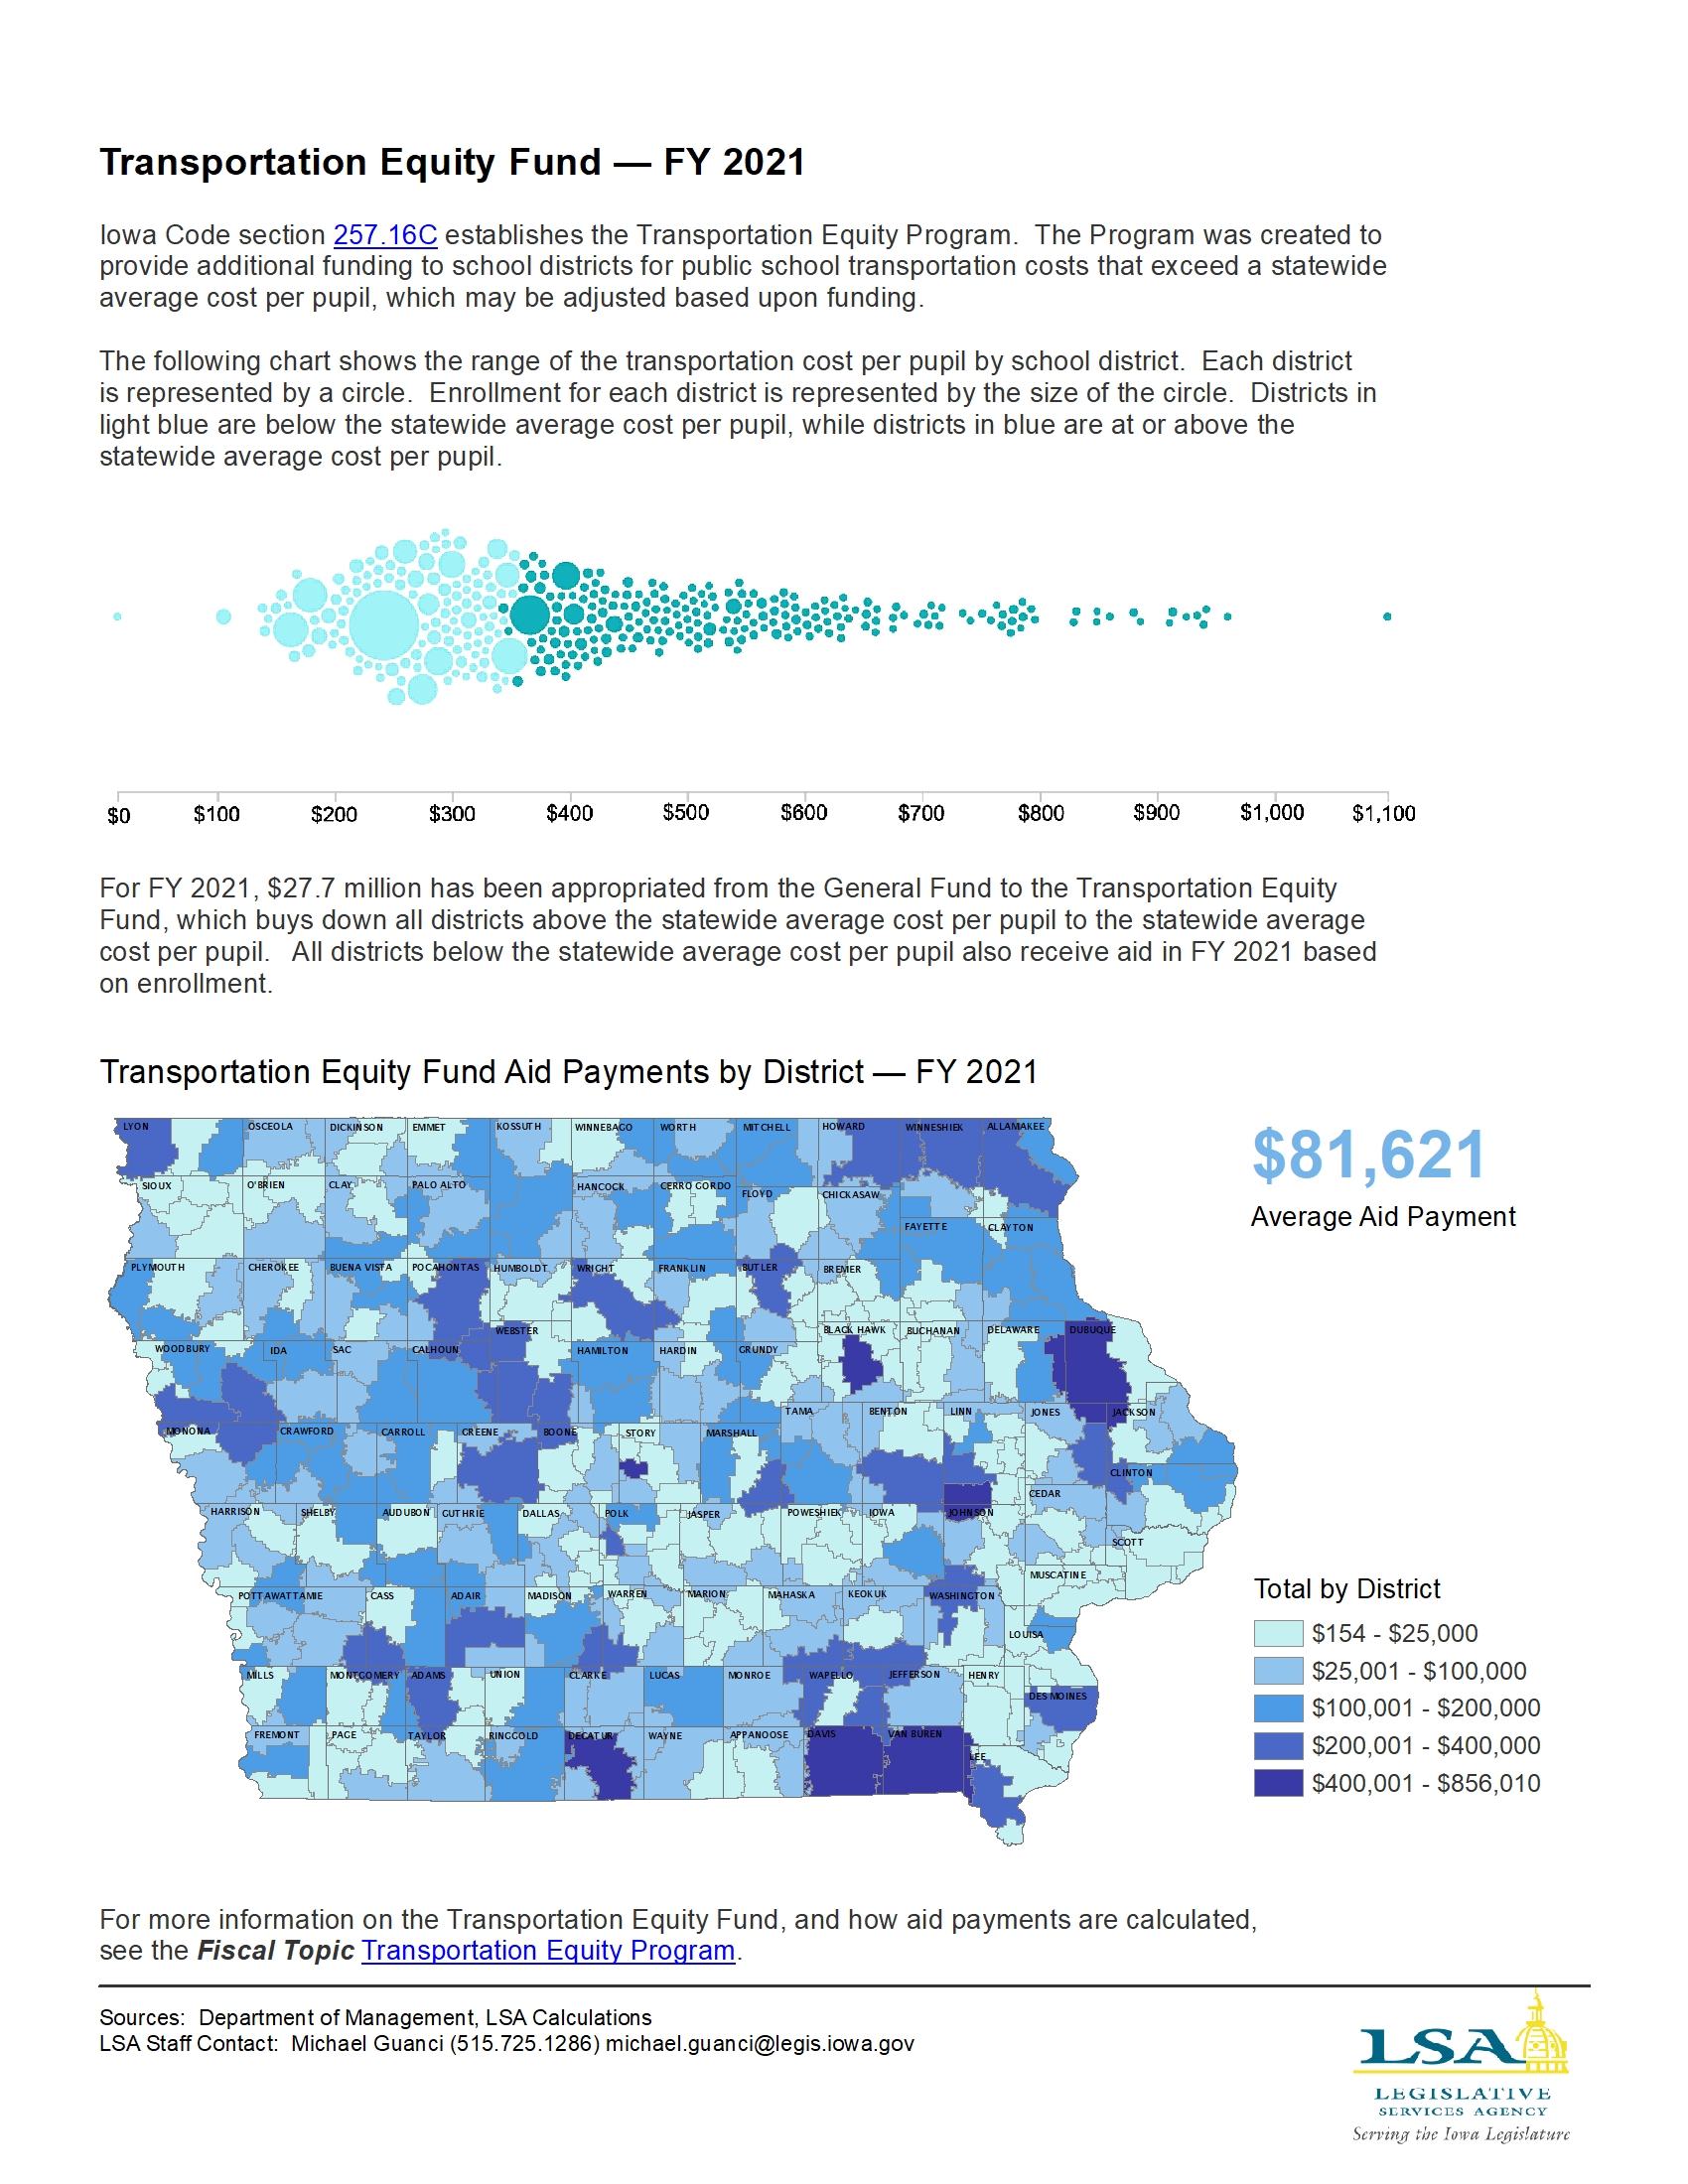
Transportation Equity Fund — FY 2021
|
|
|
|
|
| 10/19/2020 |
Iowa Insights |
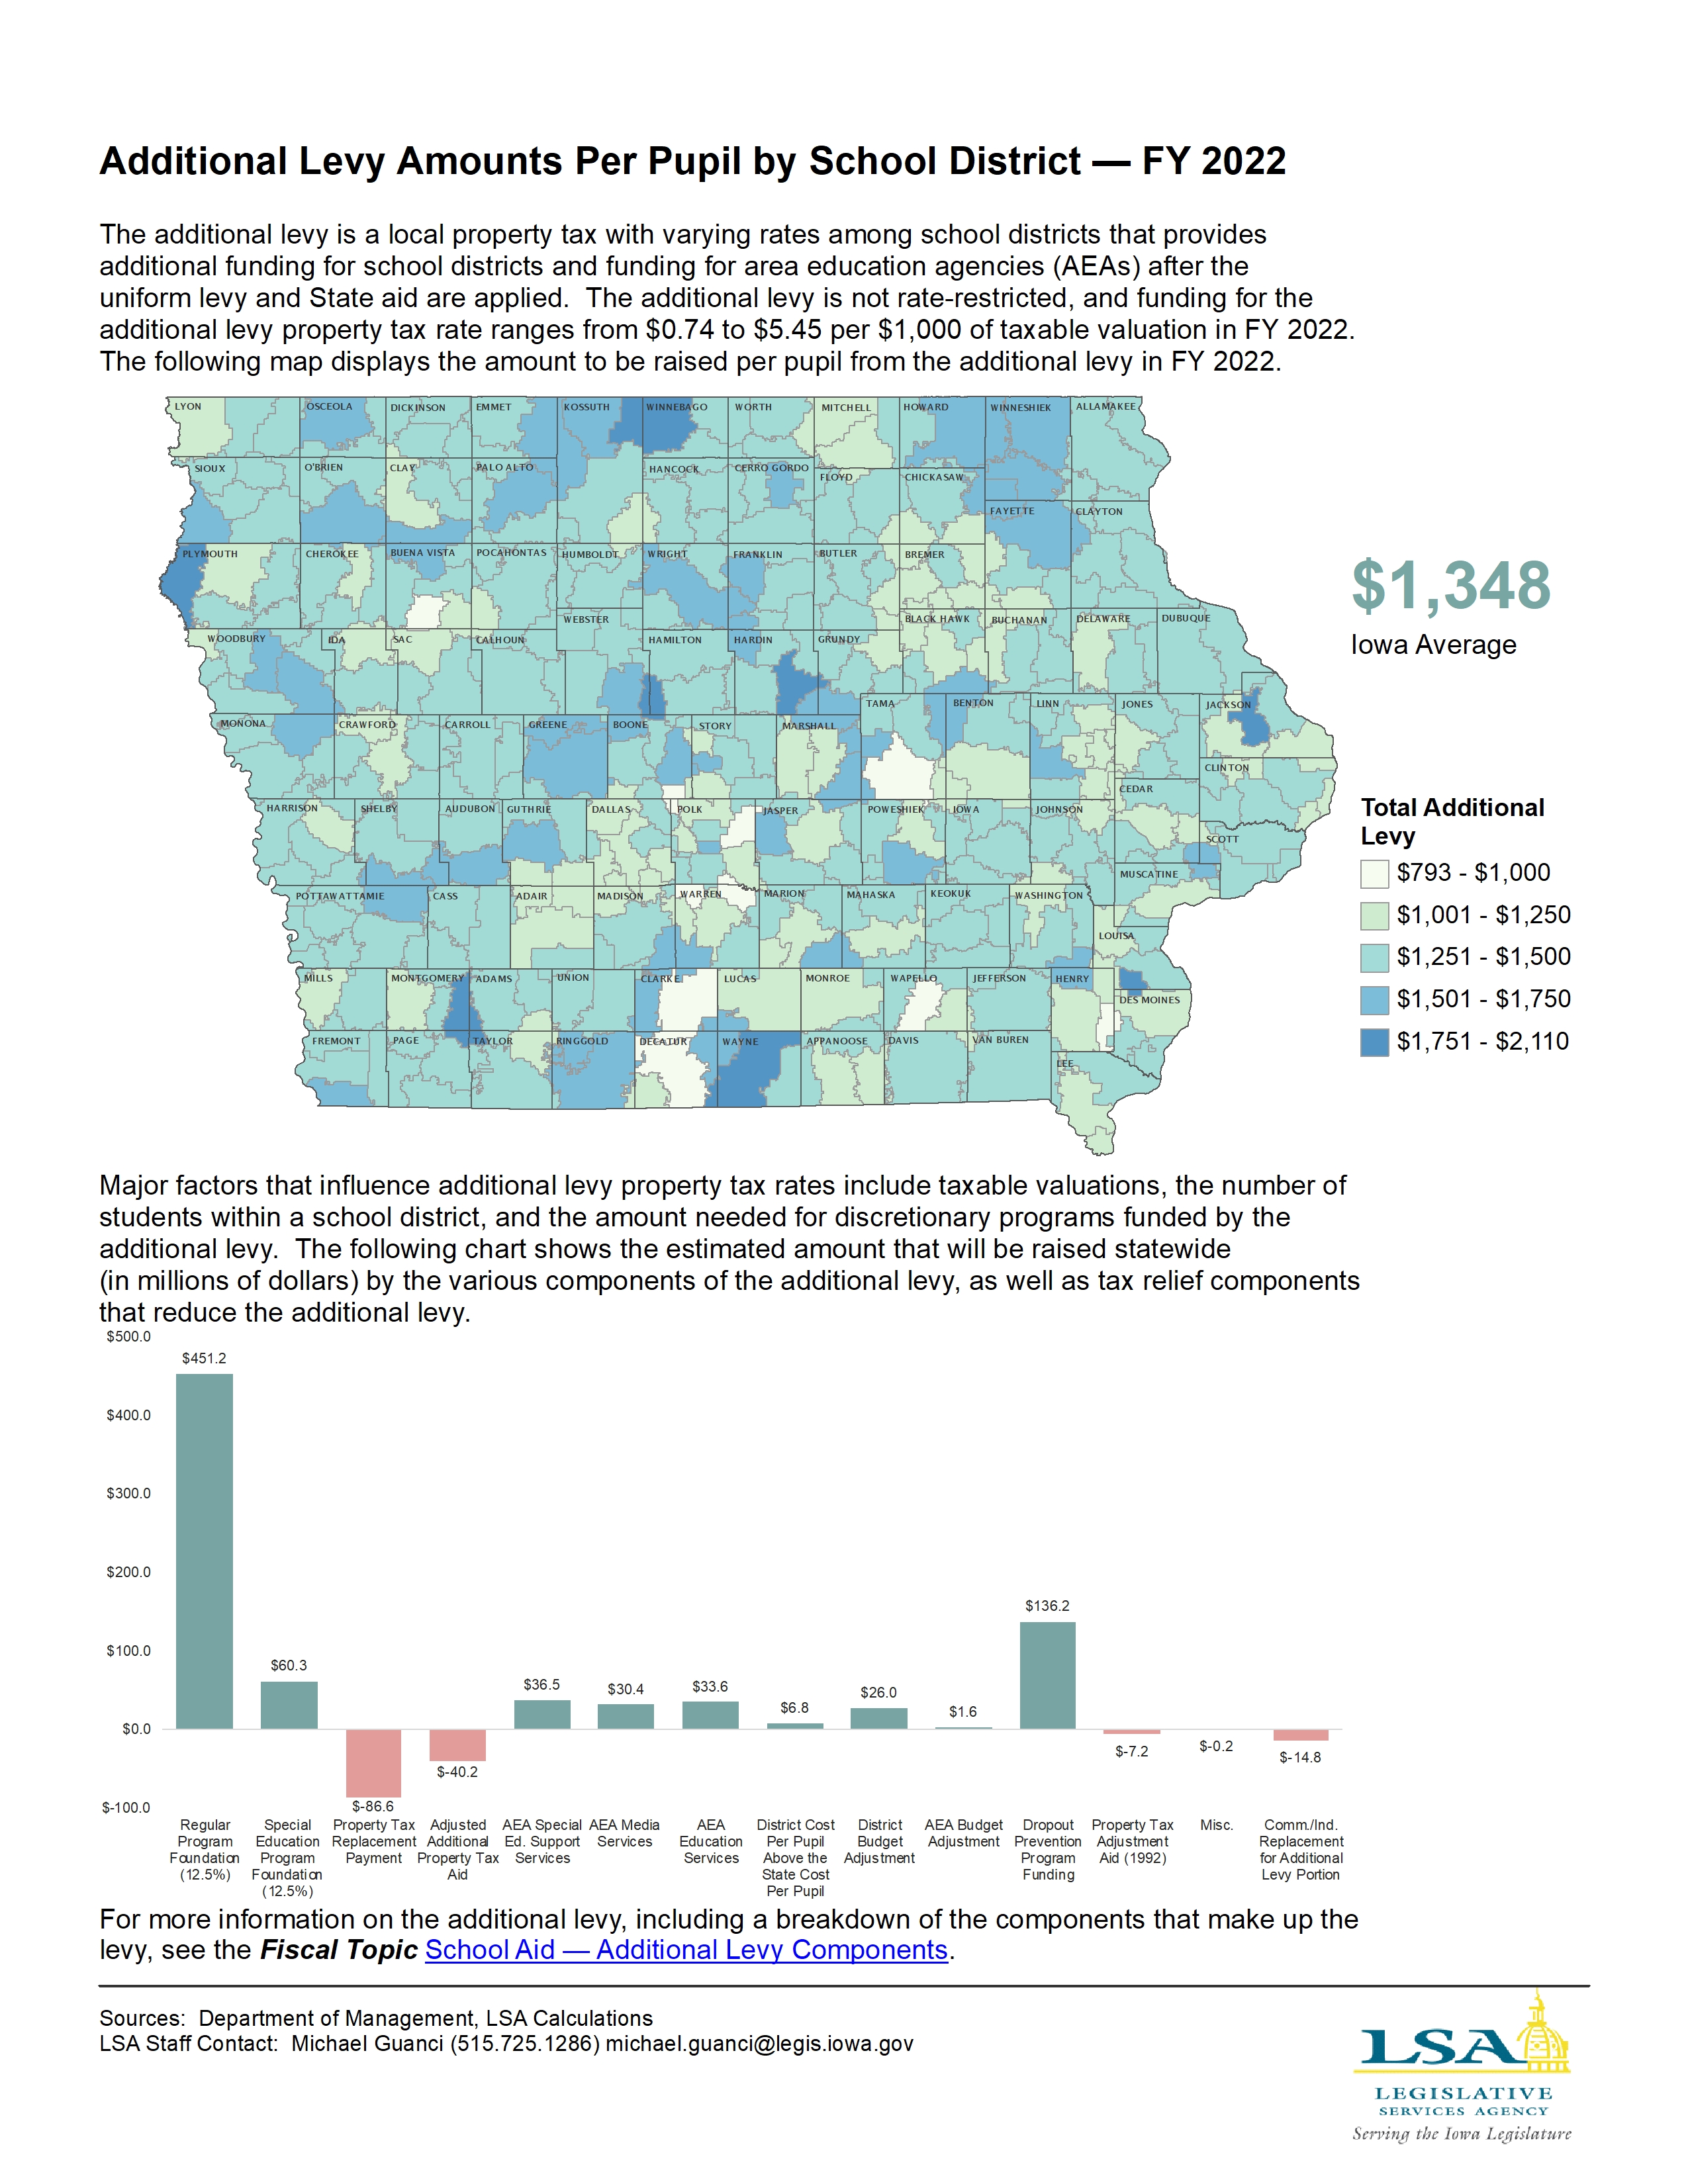
Additional Levy Amounts Per Pupil by School District — FY 2021

|
|
|
|
|
| 10/12/2020 |
Iowa Insights |
Statewide Voluntary Preschool Enrollment — 2019-2020 School Year with Average Weekly Hours of Instruction — 2018-2019 School Year

|
|
|
|
|
| 09/28/2020 |
Iowa Insights |
Certified Enrollment by School District and Percent Change in Enrollment — Fall 2019
|
|
|
|
|
| 09/21/2020 |
Iowa Insights |
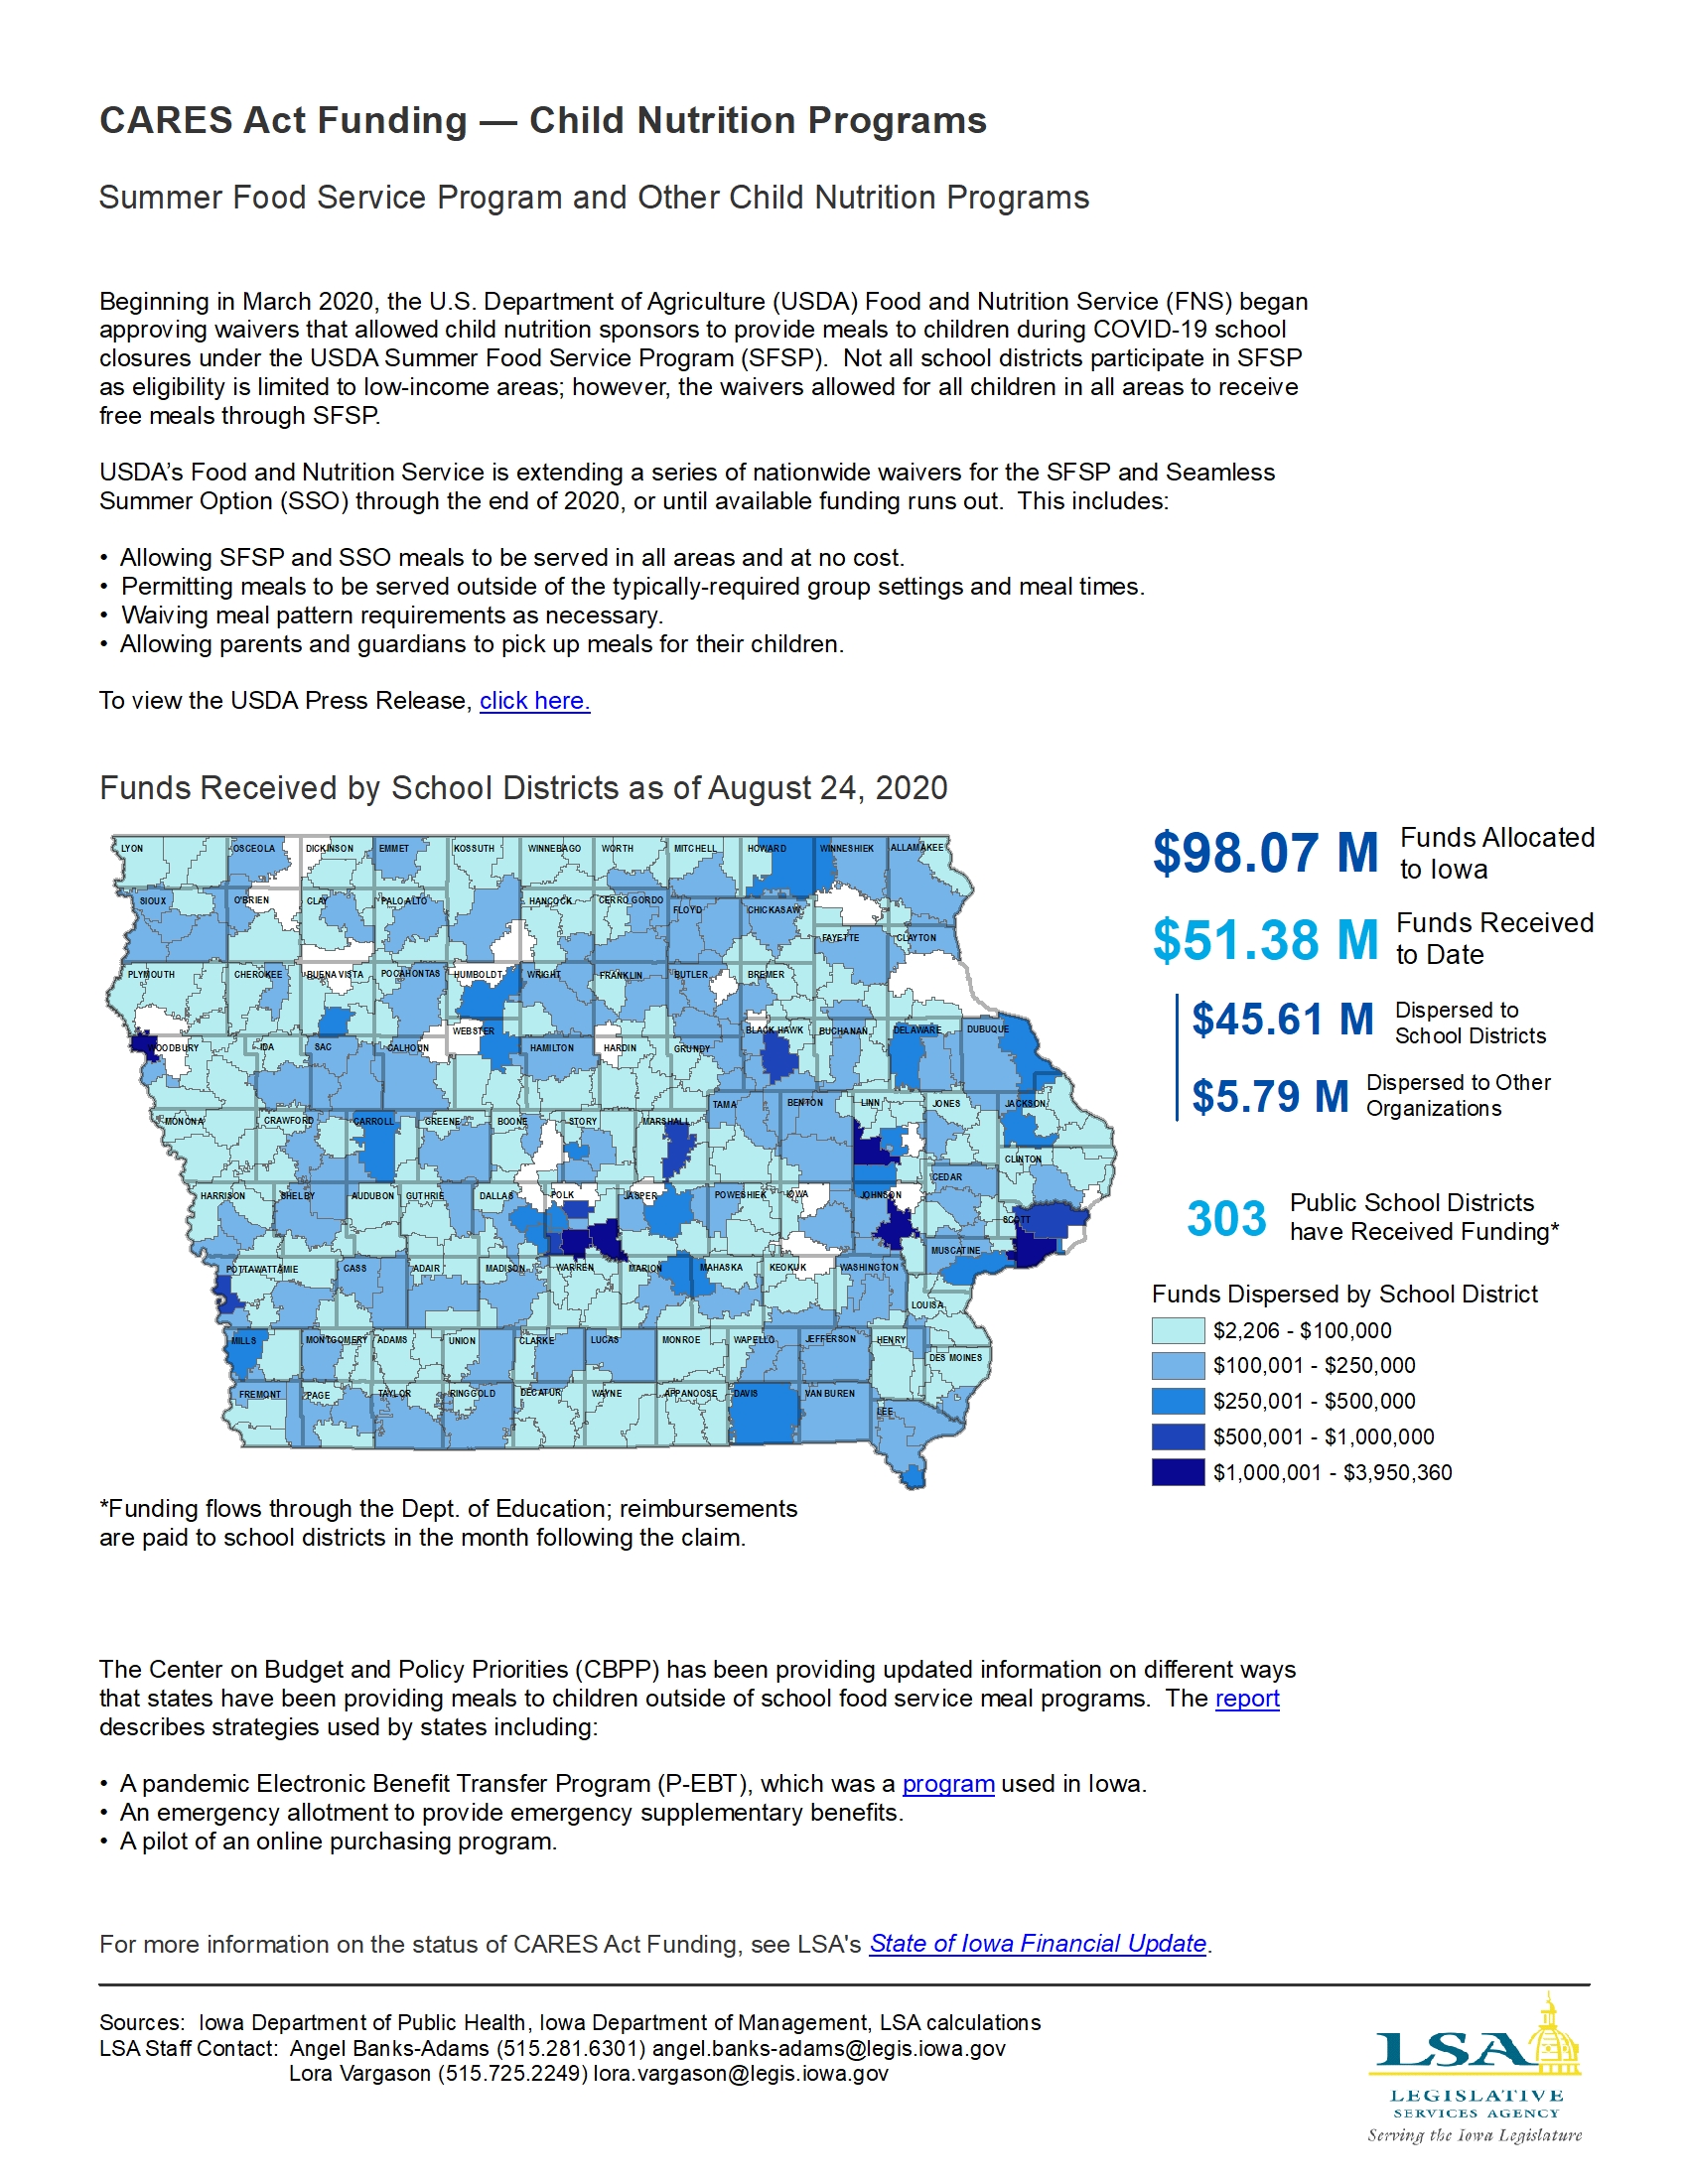
CARES Act Funding — Child Nutrition Programs
|
|
|
|
|
| 09/14/2020 |
Iowa Insights |
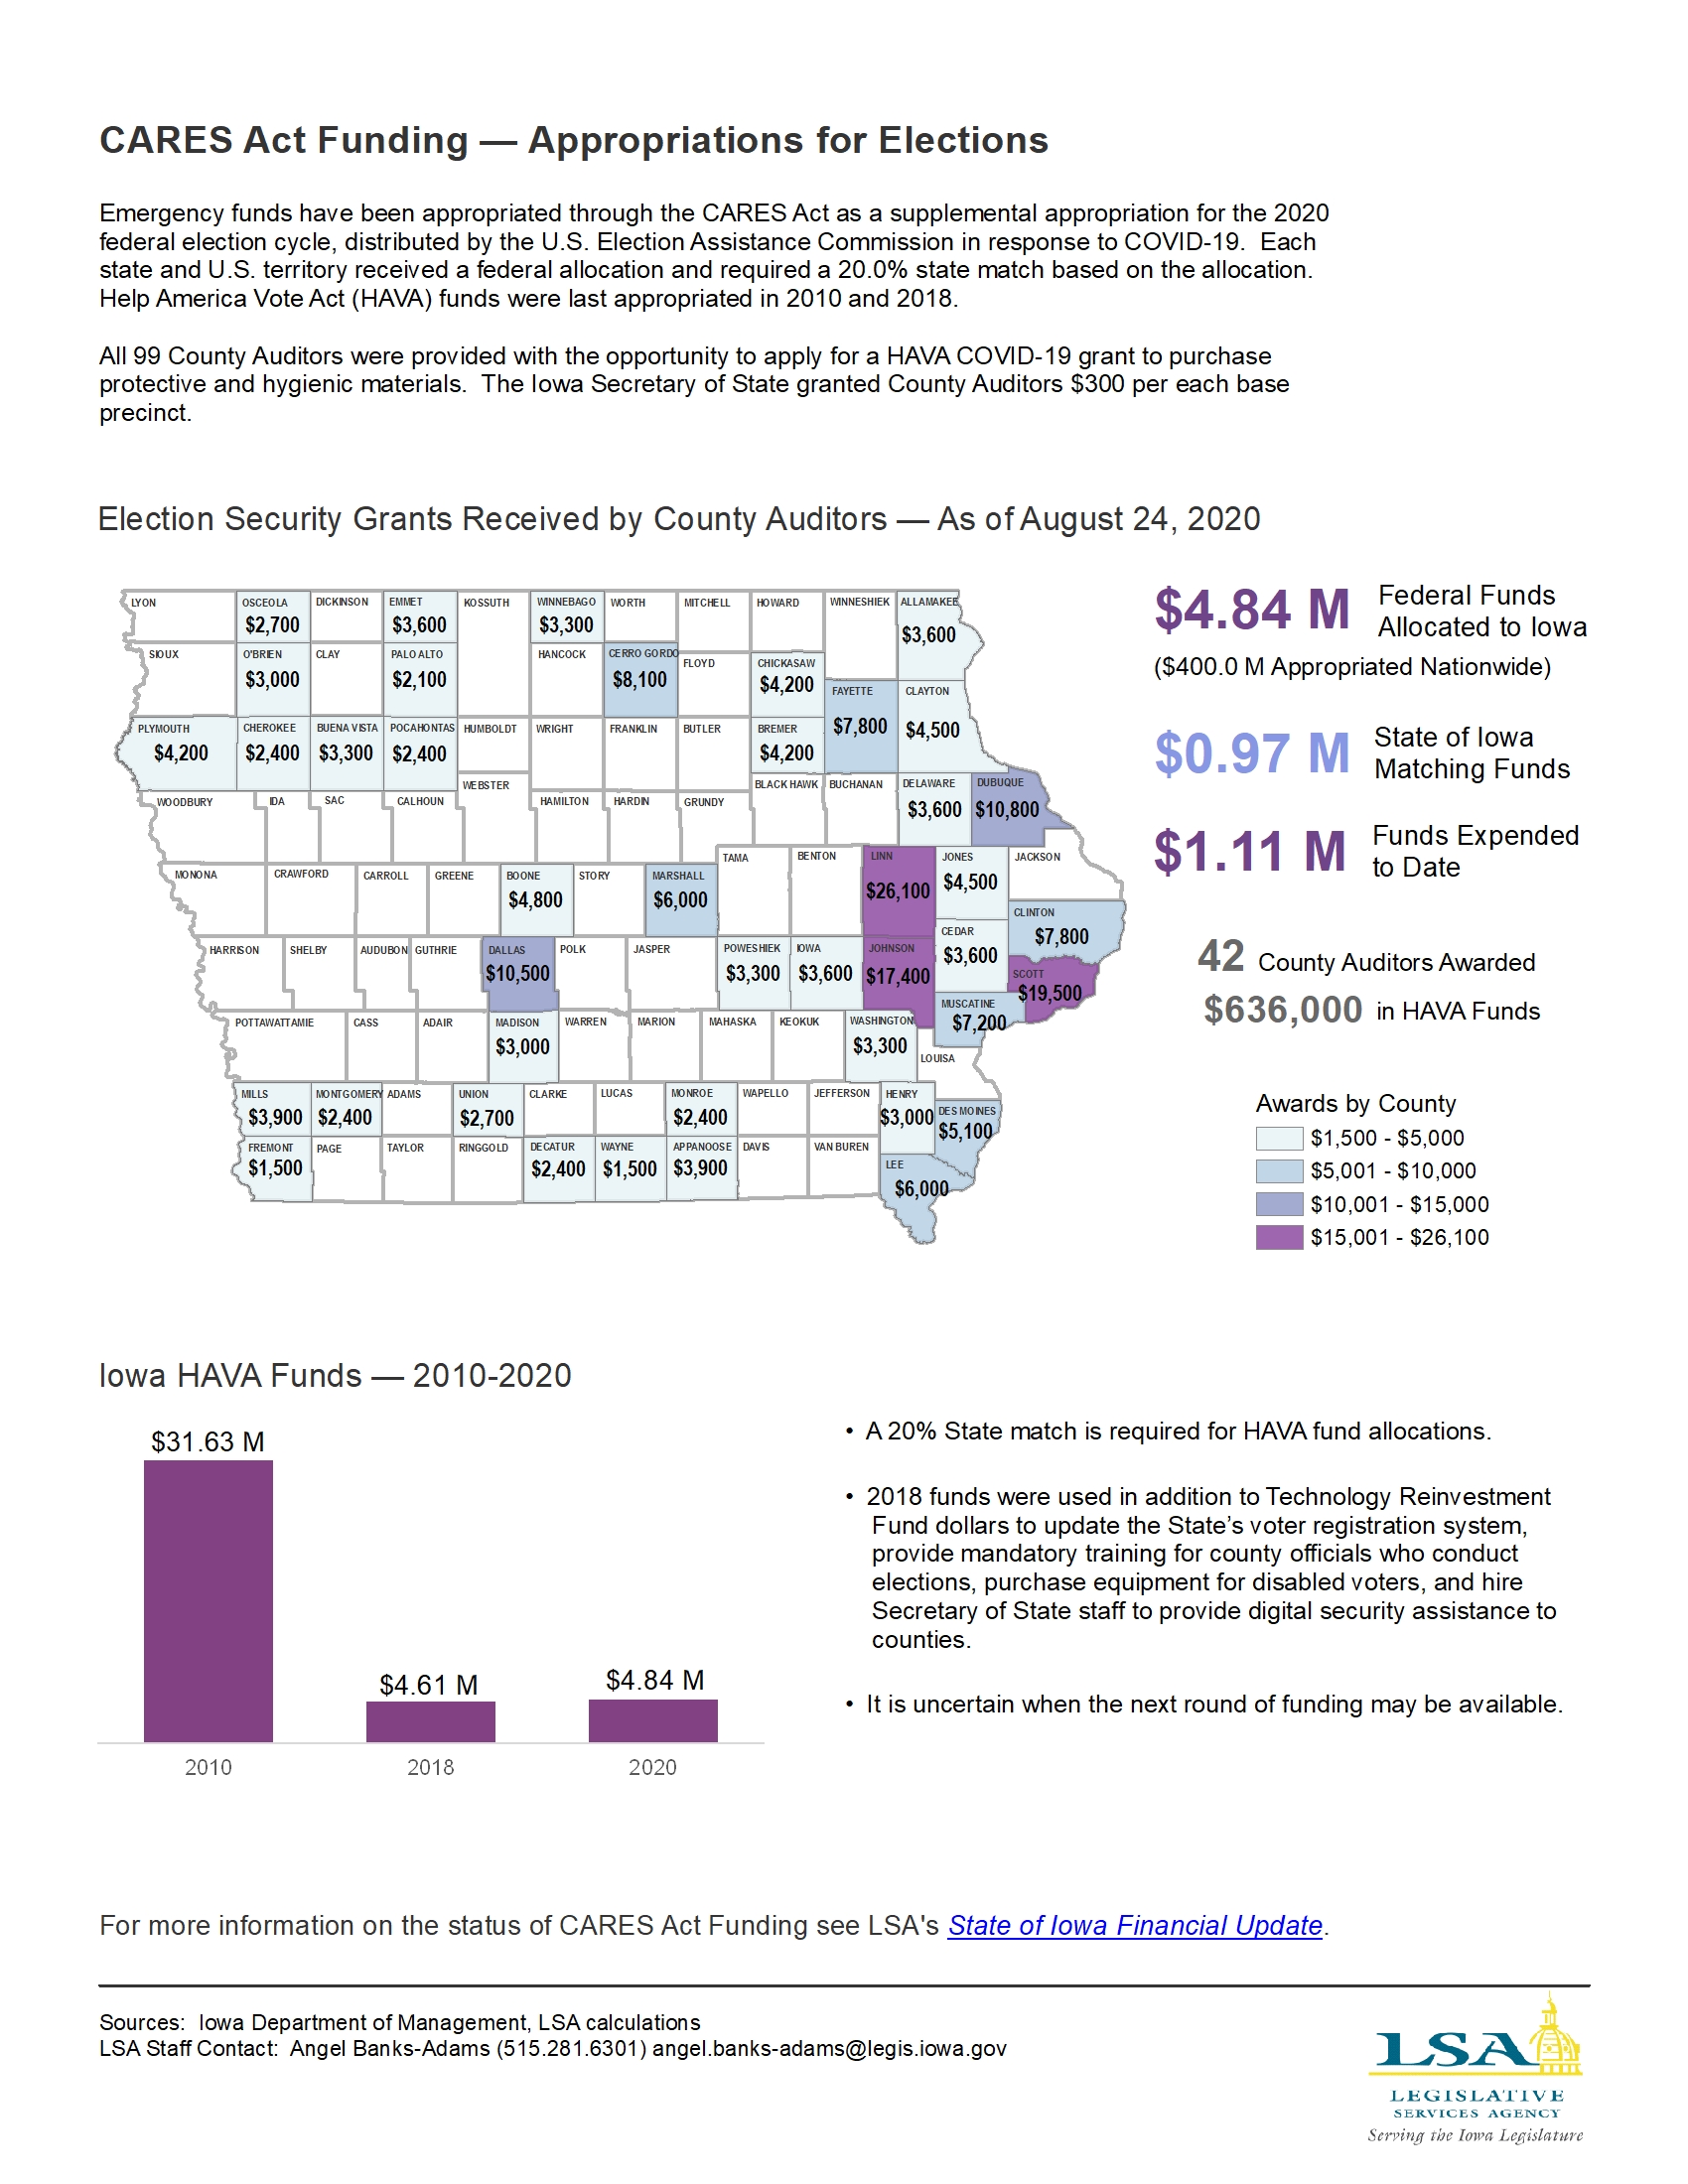
CARES Act Funding — Appropriations for Elections
|
|
|
|
|
| 09/08/2020 |
Iowa Insights |
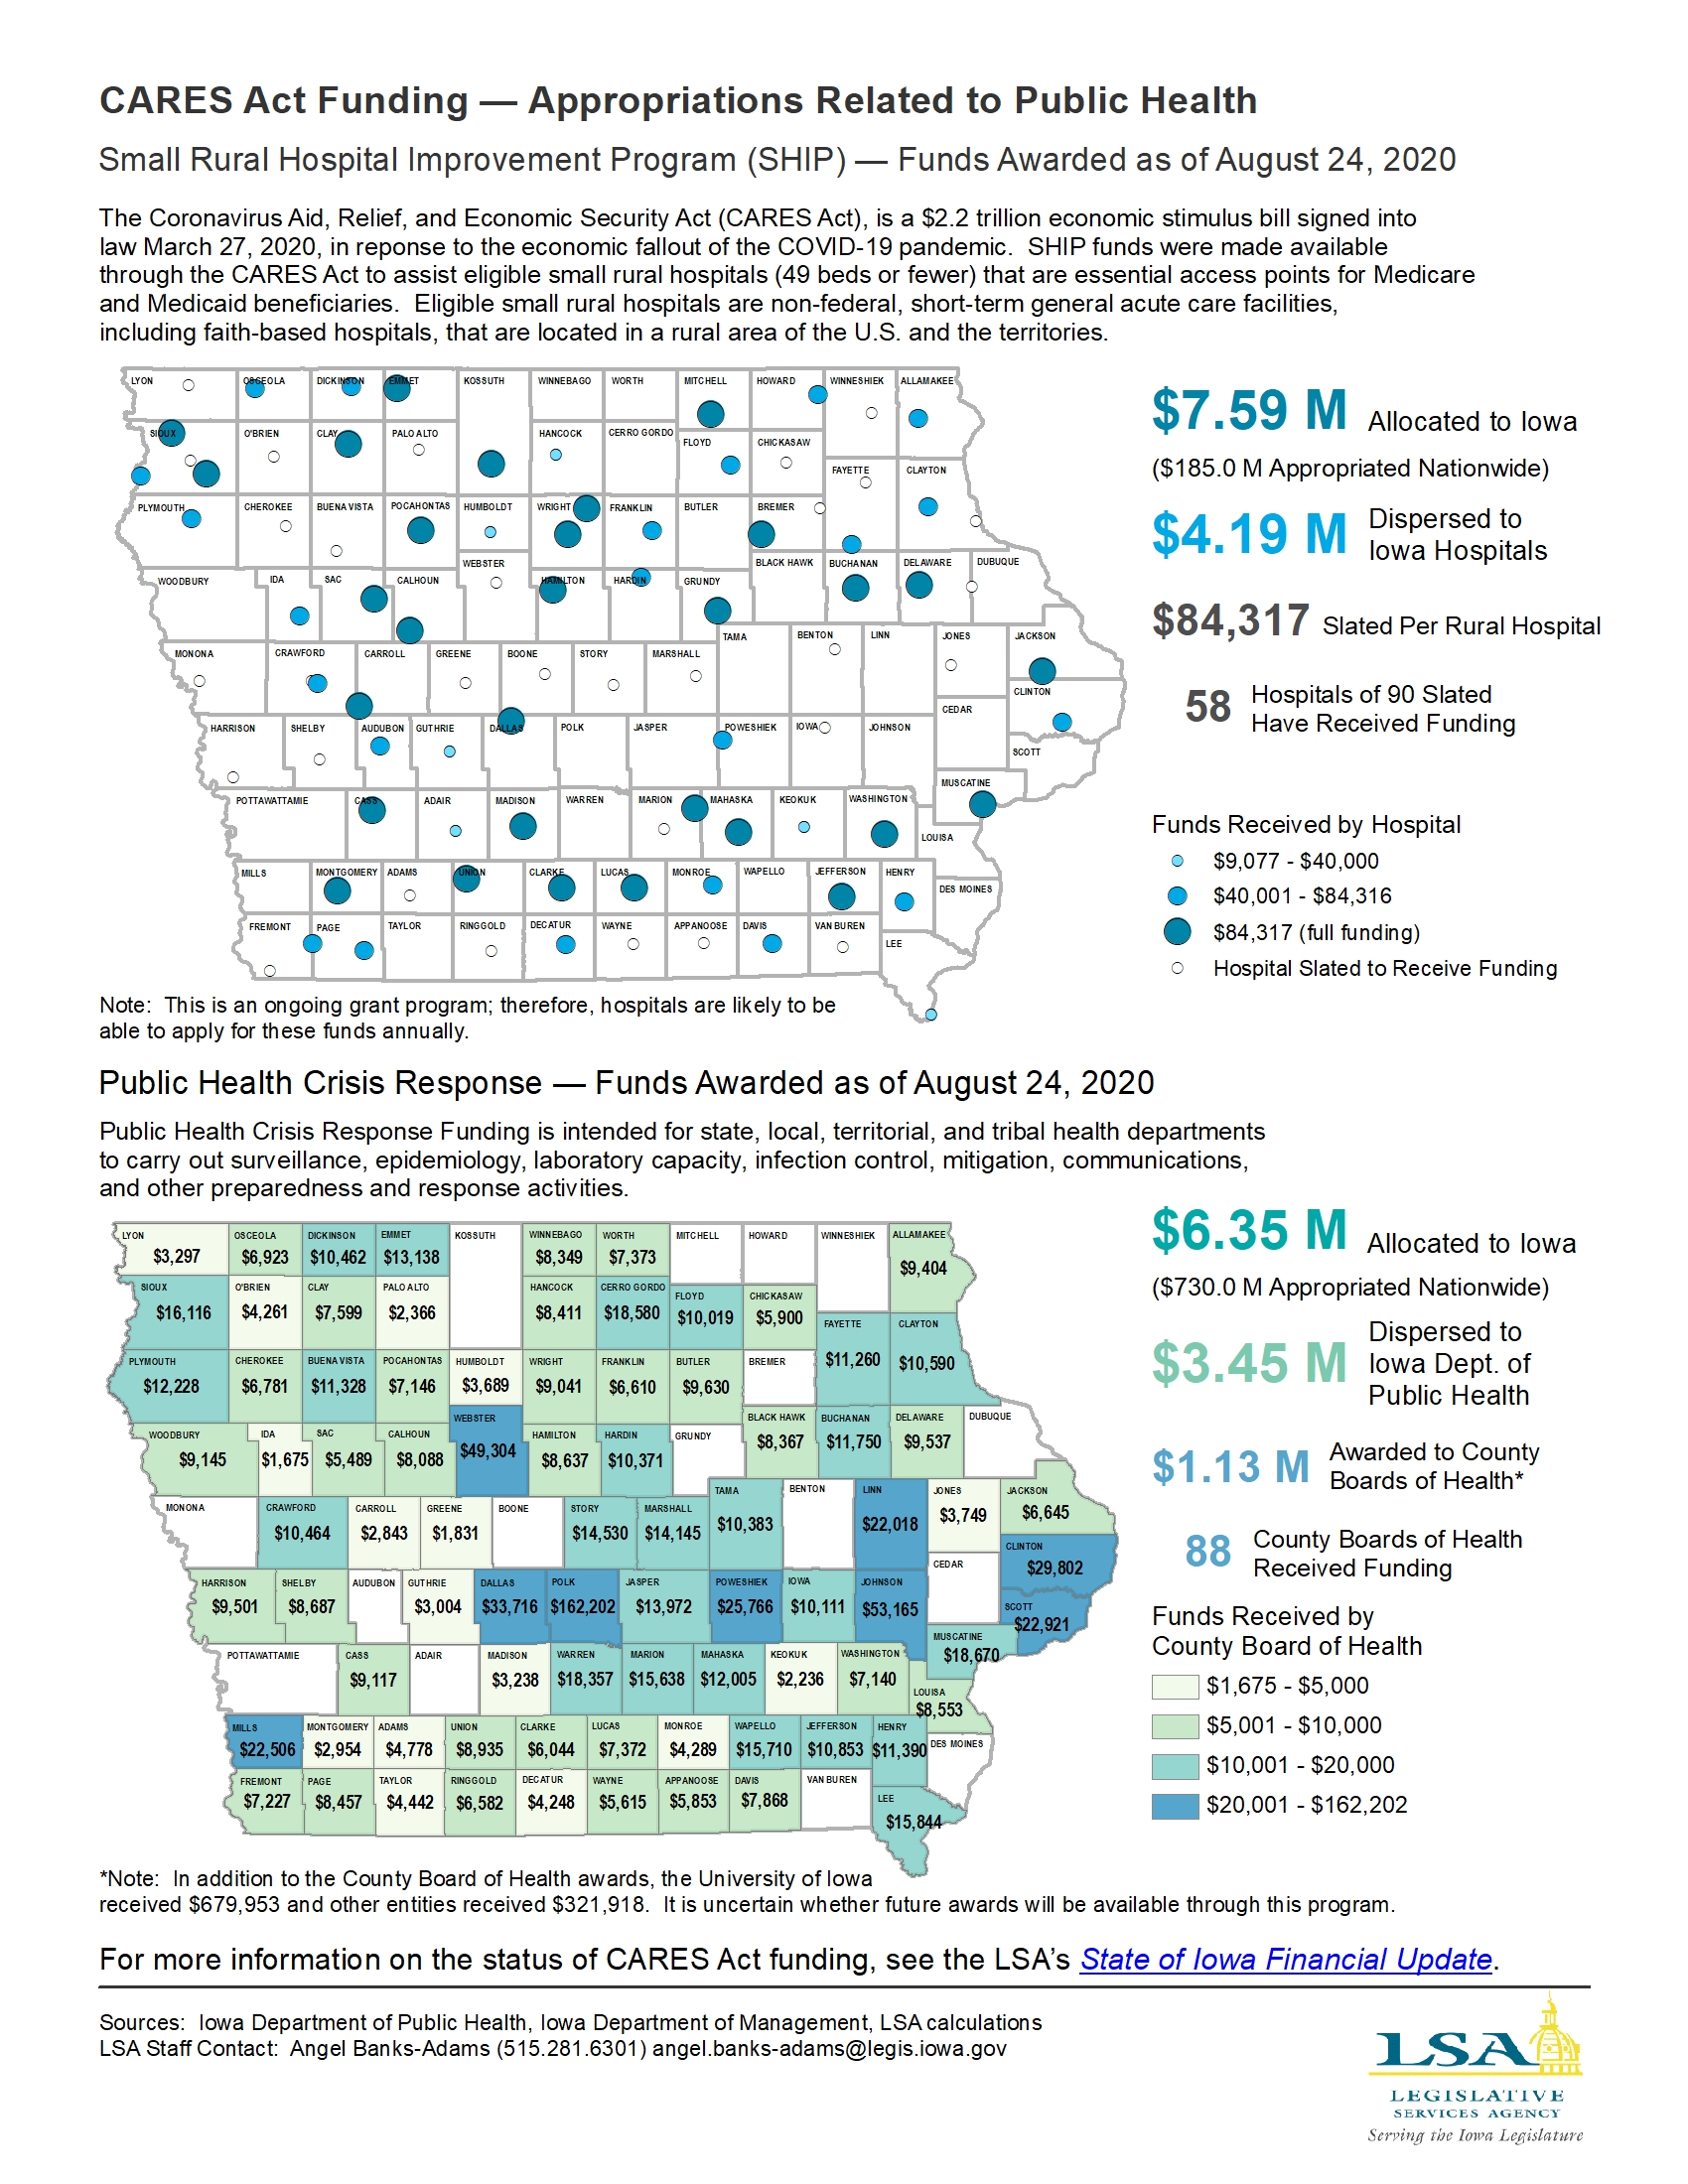
CARES Act Funding — Appropriations Related to Public Health
|
|
|
|
|
| 08/31/2020 |
Iowa Insights |
FY 2021 Estimated General Fund Appropriations
|
|
|
|
|
| 08/24/2020 |
Iowa Insights |
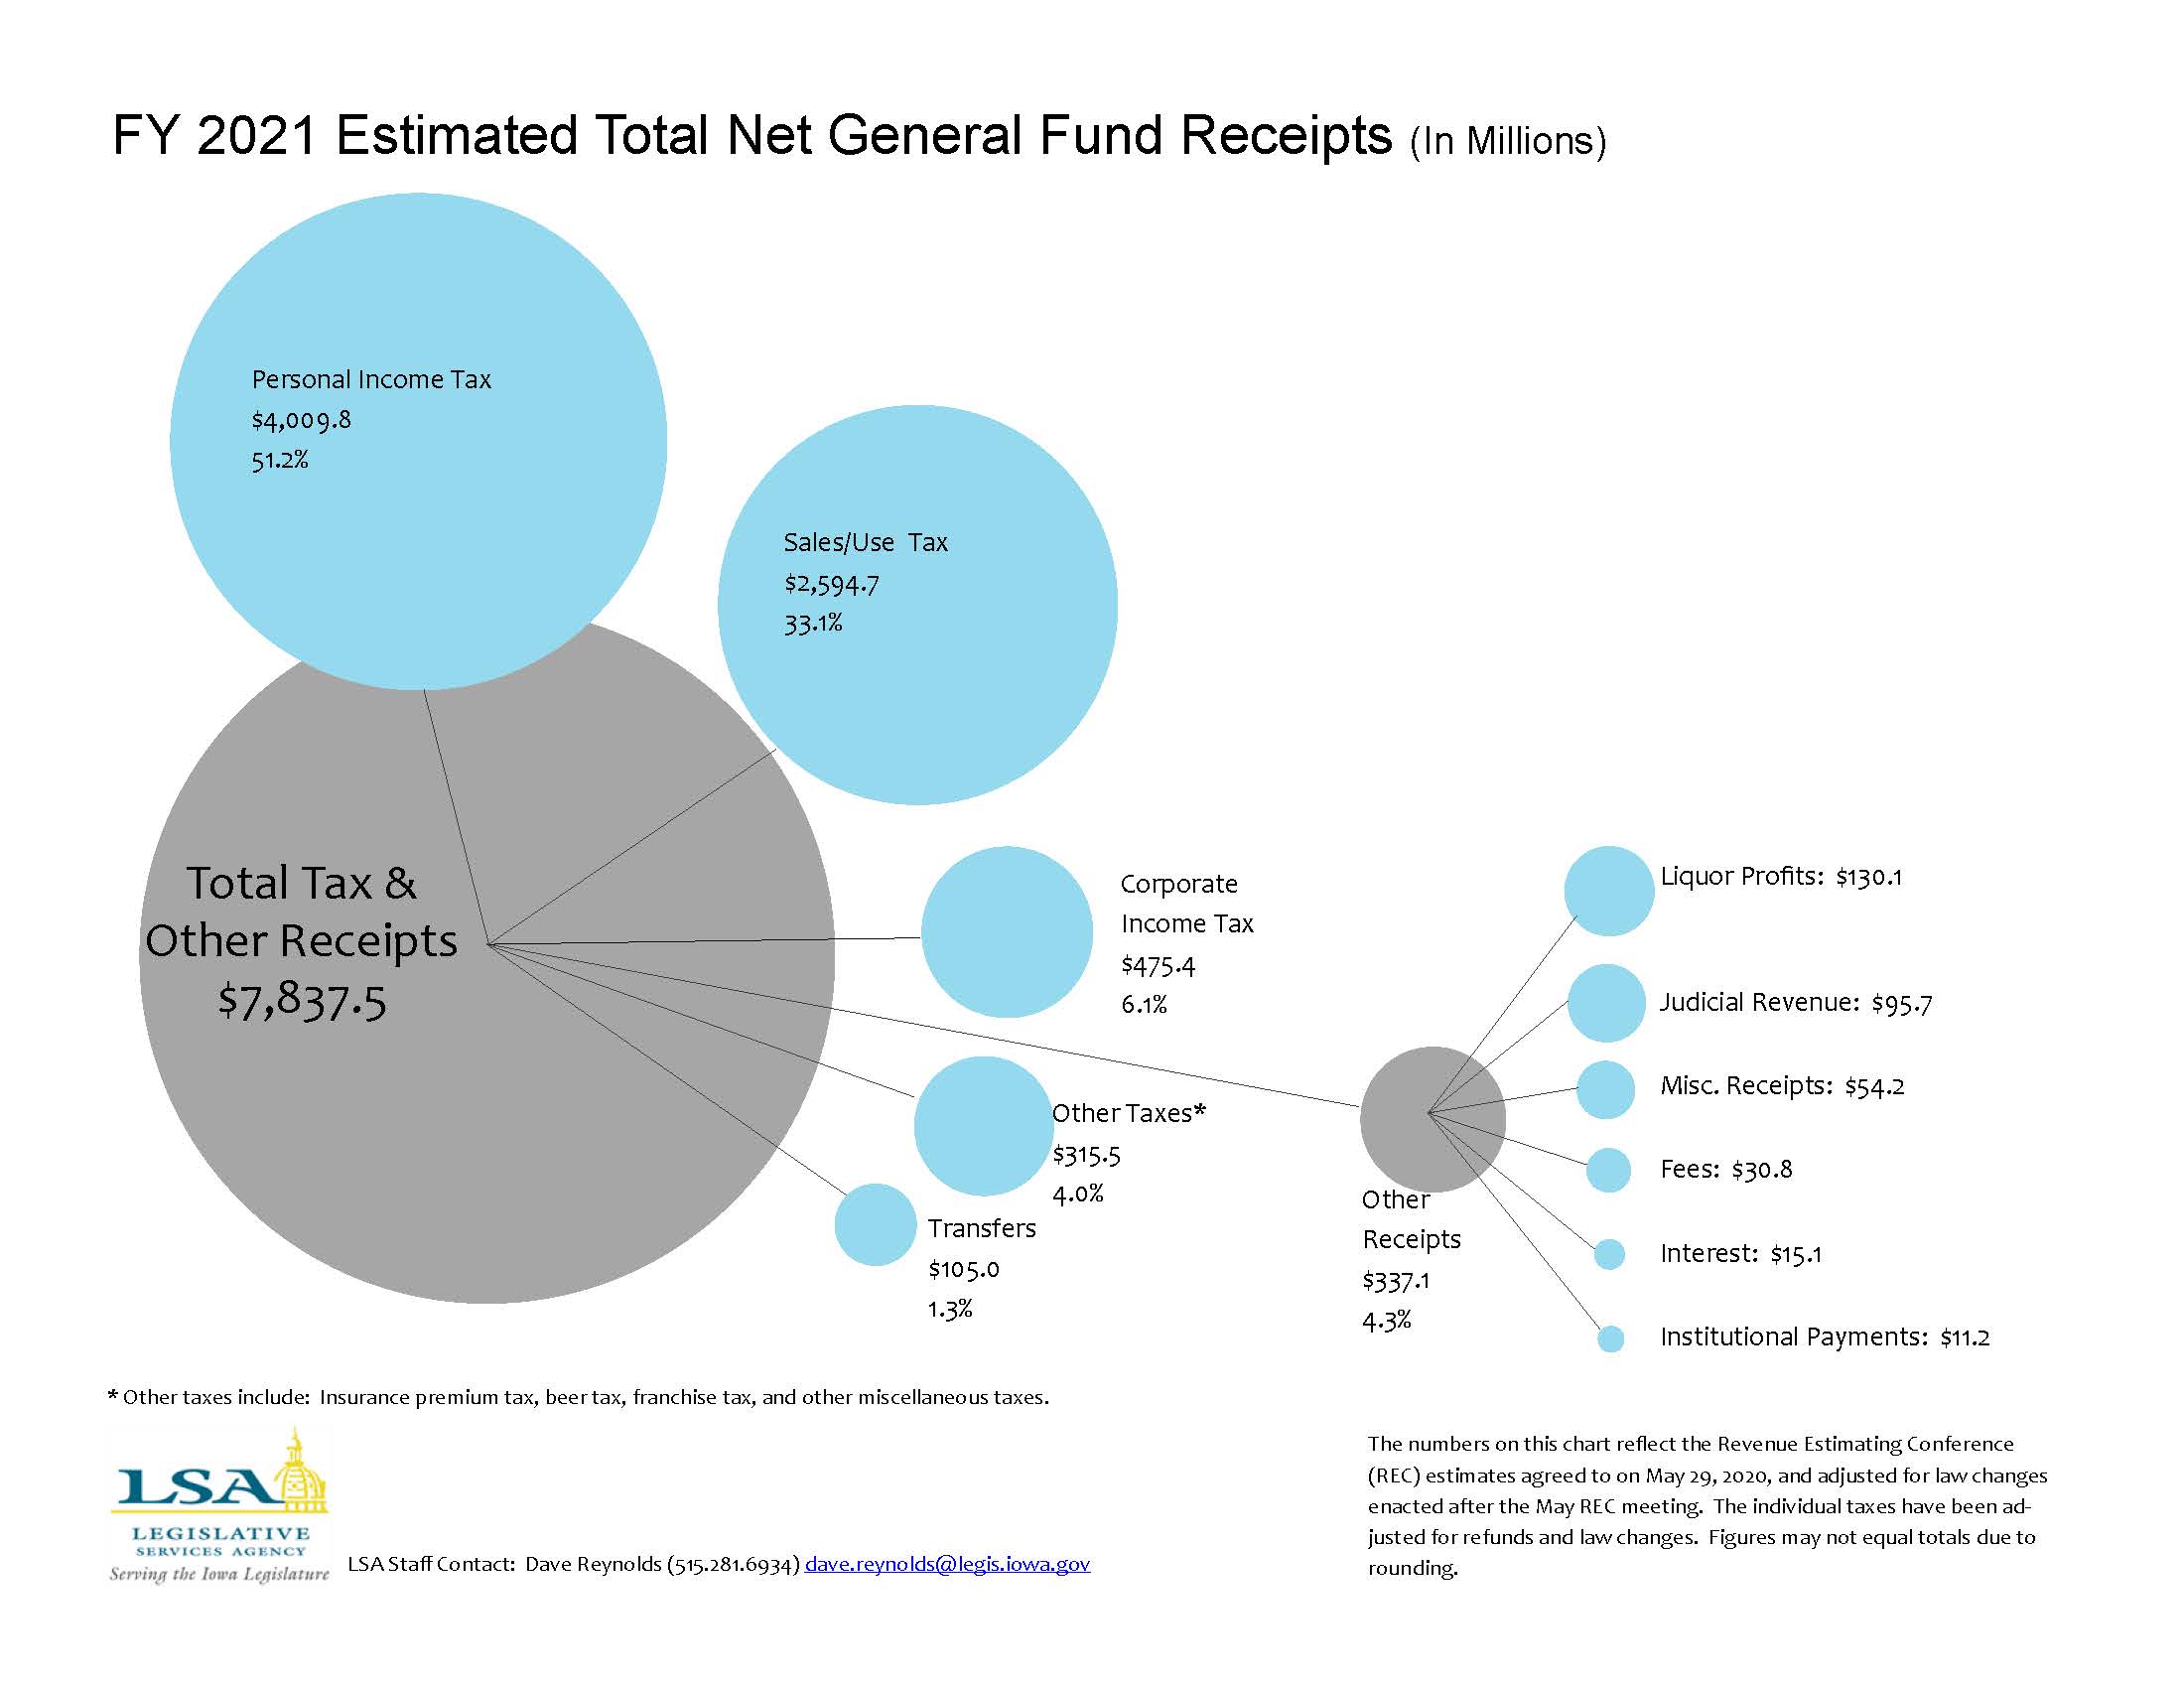
FY 2021 Estimated Total Net General Fund Receipts
|
|
|
|
|
| 08/17/2020 |
Iowa Insights |
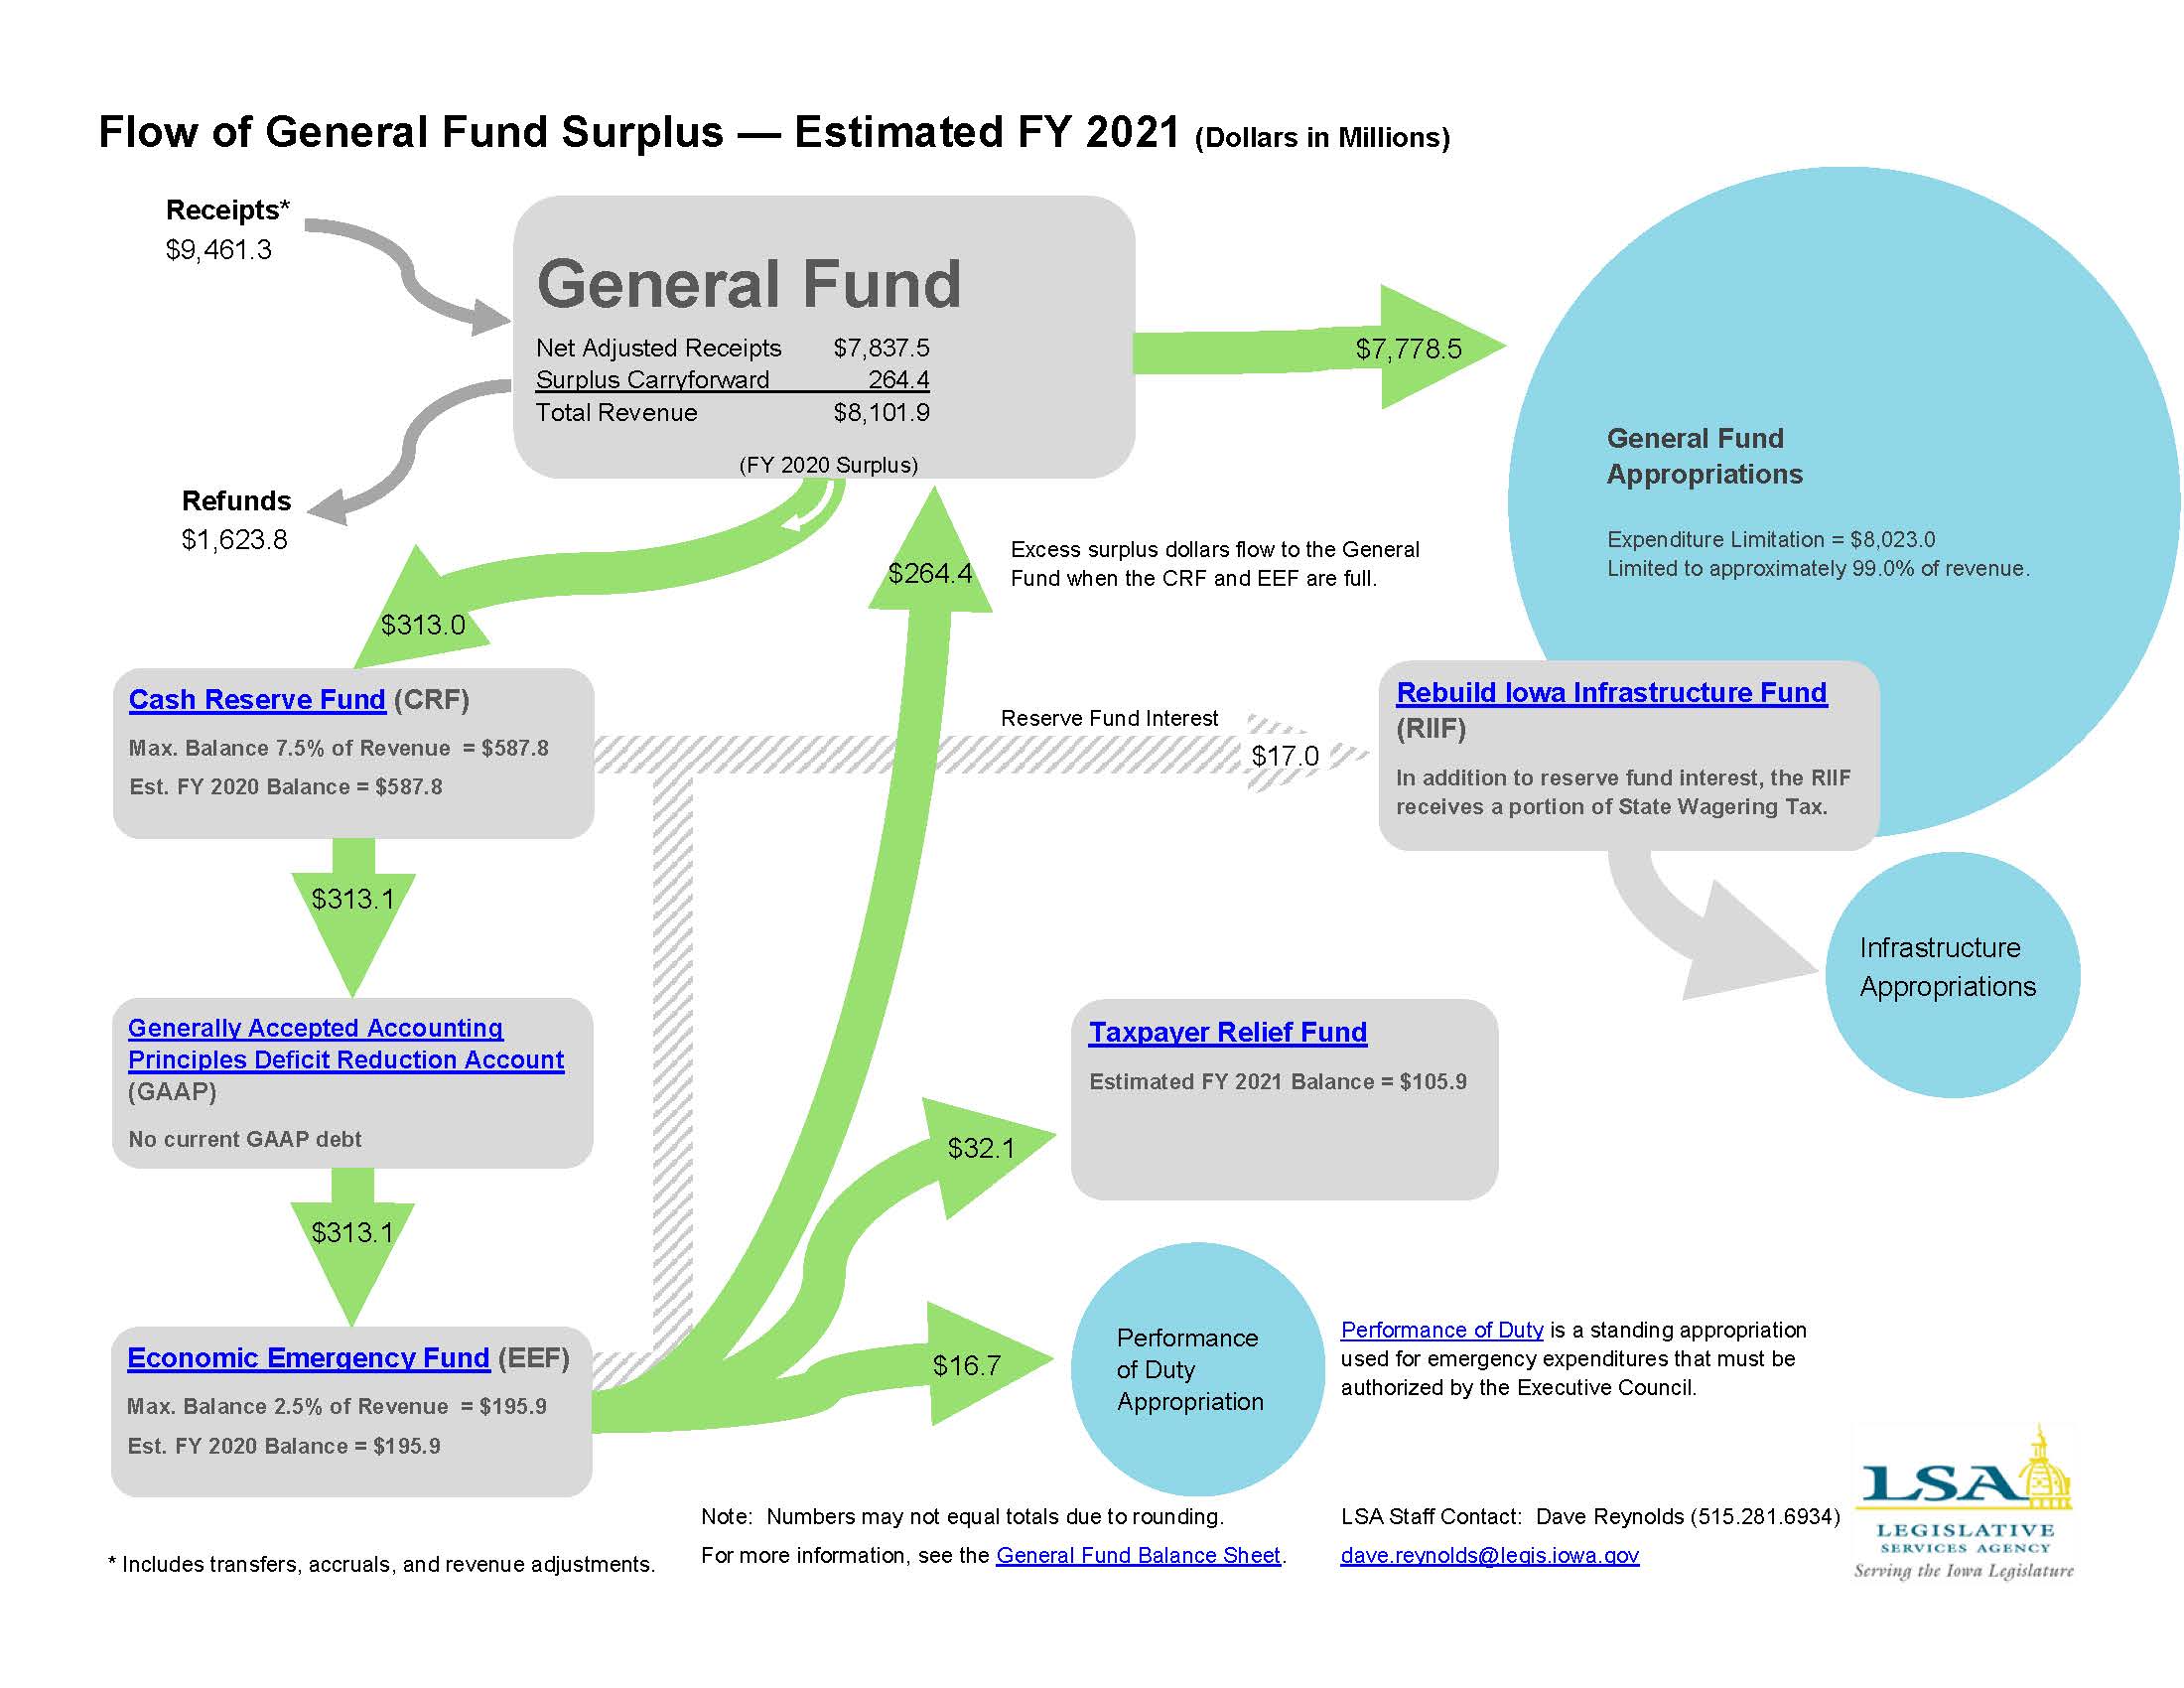
Flow of General Fund Surplus — Estimated FY 2021
|
|
|
|
|
| 08/10/2020 |
Iowa Insights |
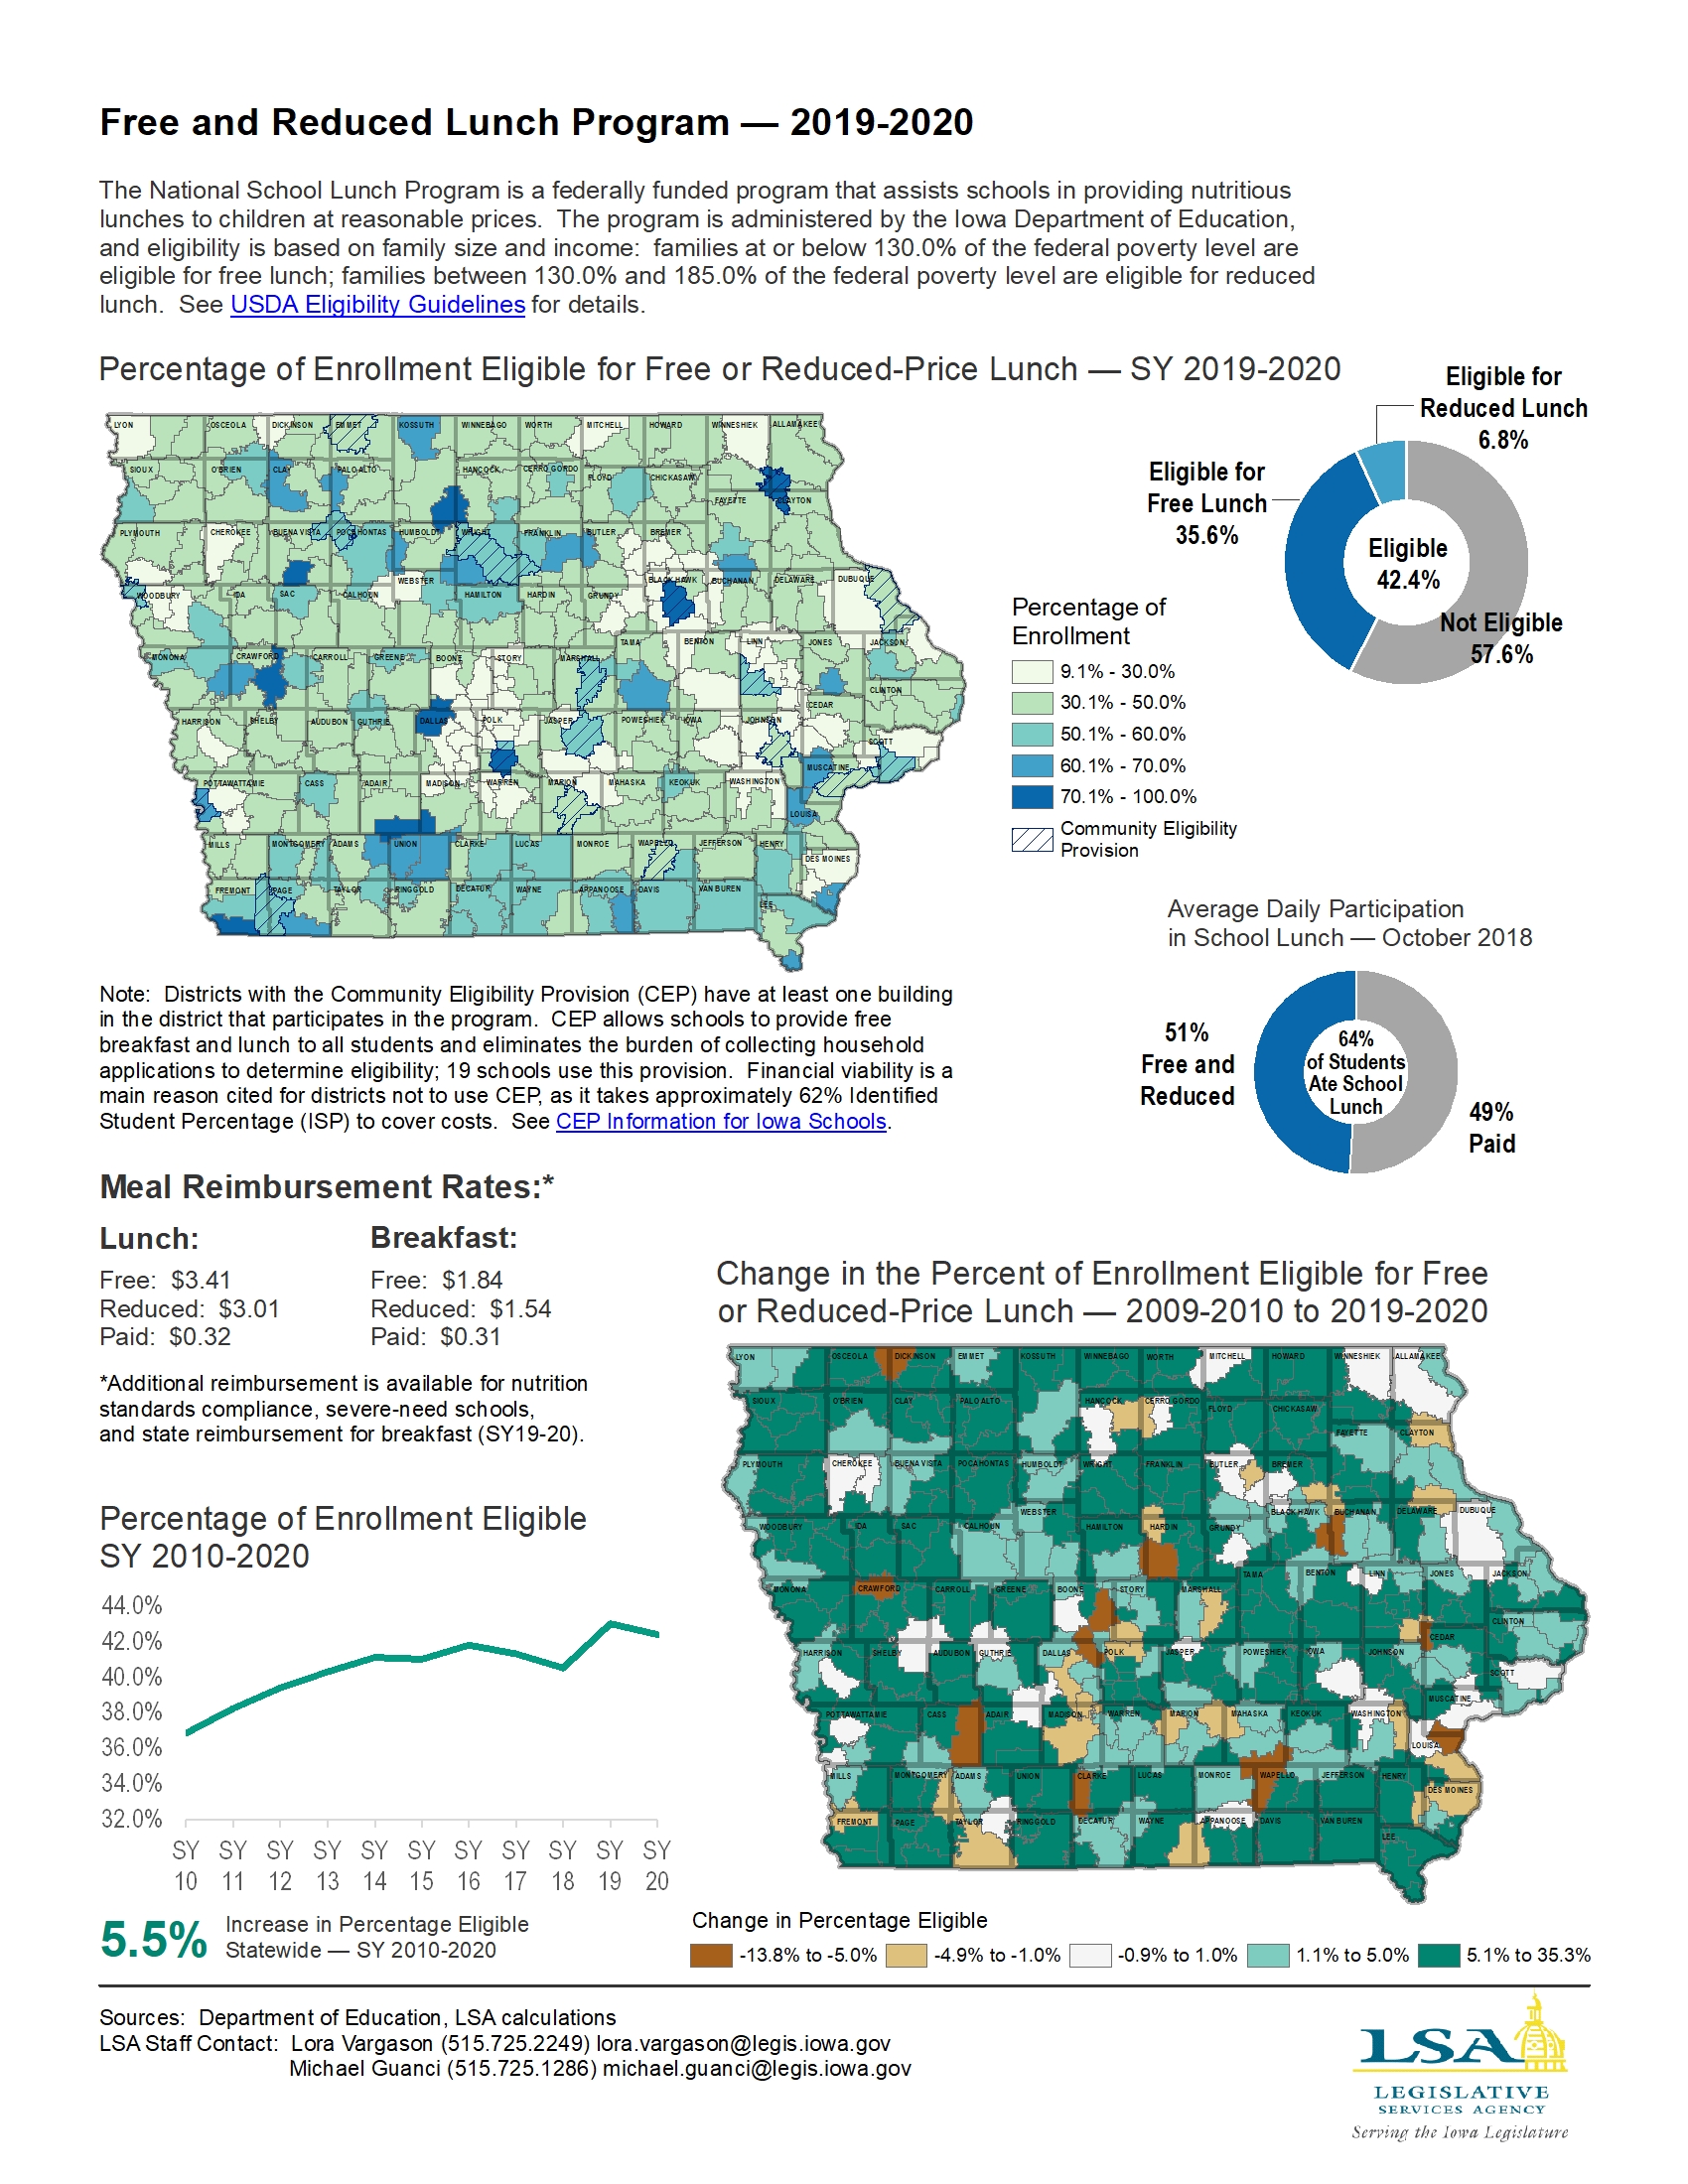
Free and Reduced Lunch Program — 2019-2020
|
|
|
|
|
| 08/03/2020 |
Iowa Insights |
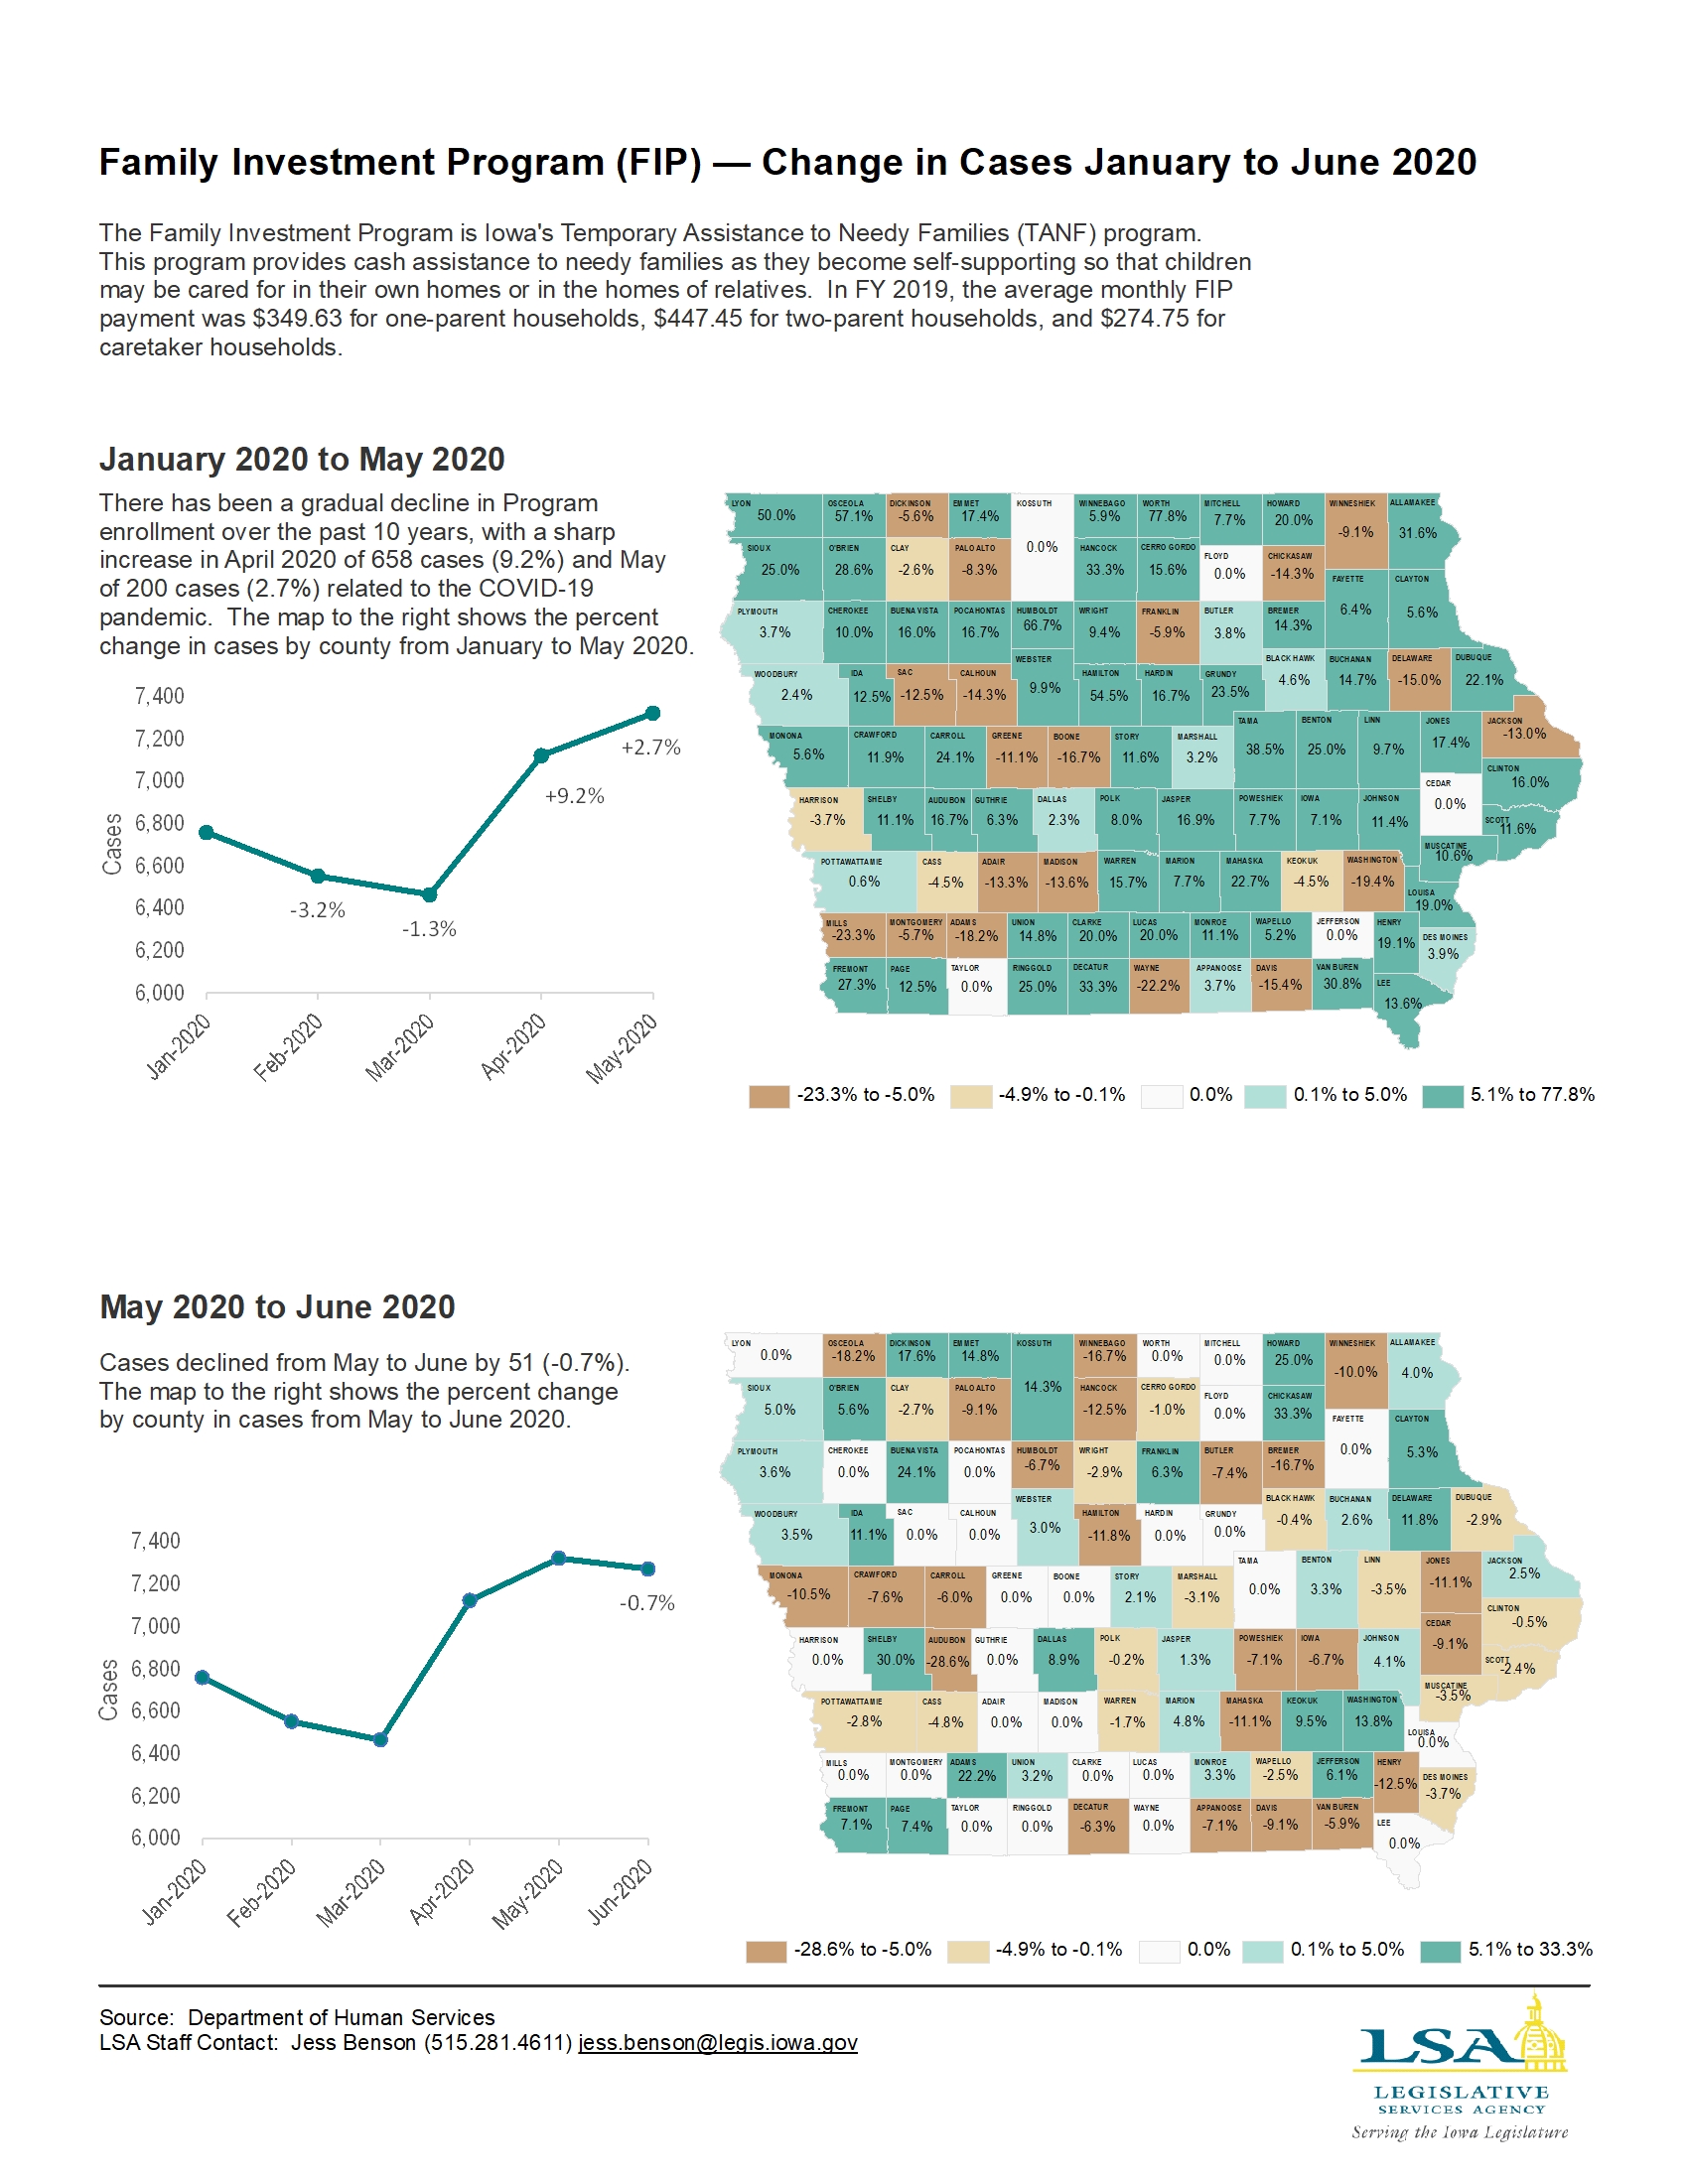
Family Investment Program (FIP) — Change in Cases January to June 2020
|
|
|
|
|
| 07/27/2020 |
Iowa Insights |
Recipients in Food Assistance Program — January - June 2020 - COVID-19

|
|
|
|
|
| 07/20/2020 |
Iowa Insights |
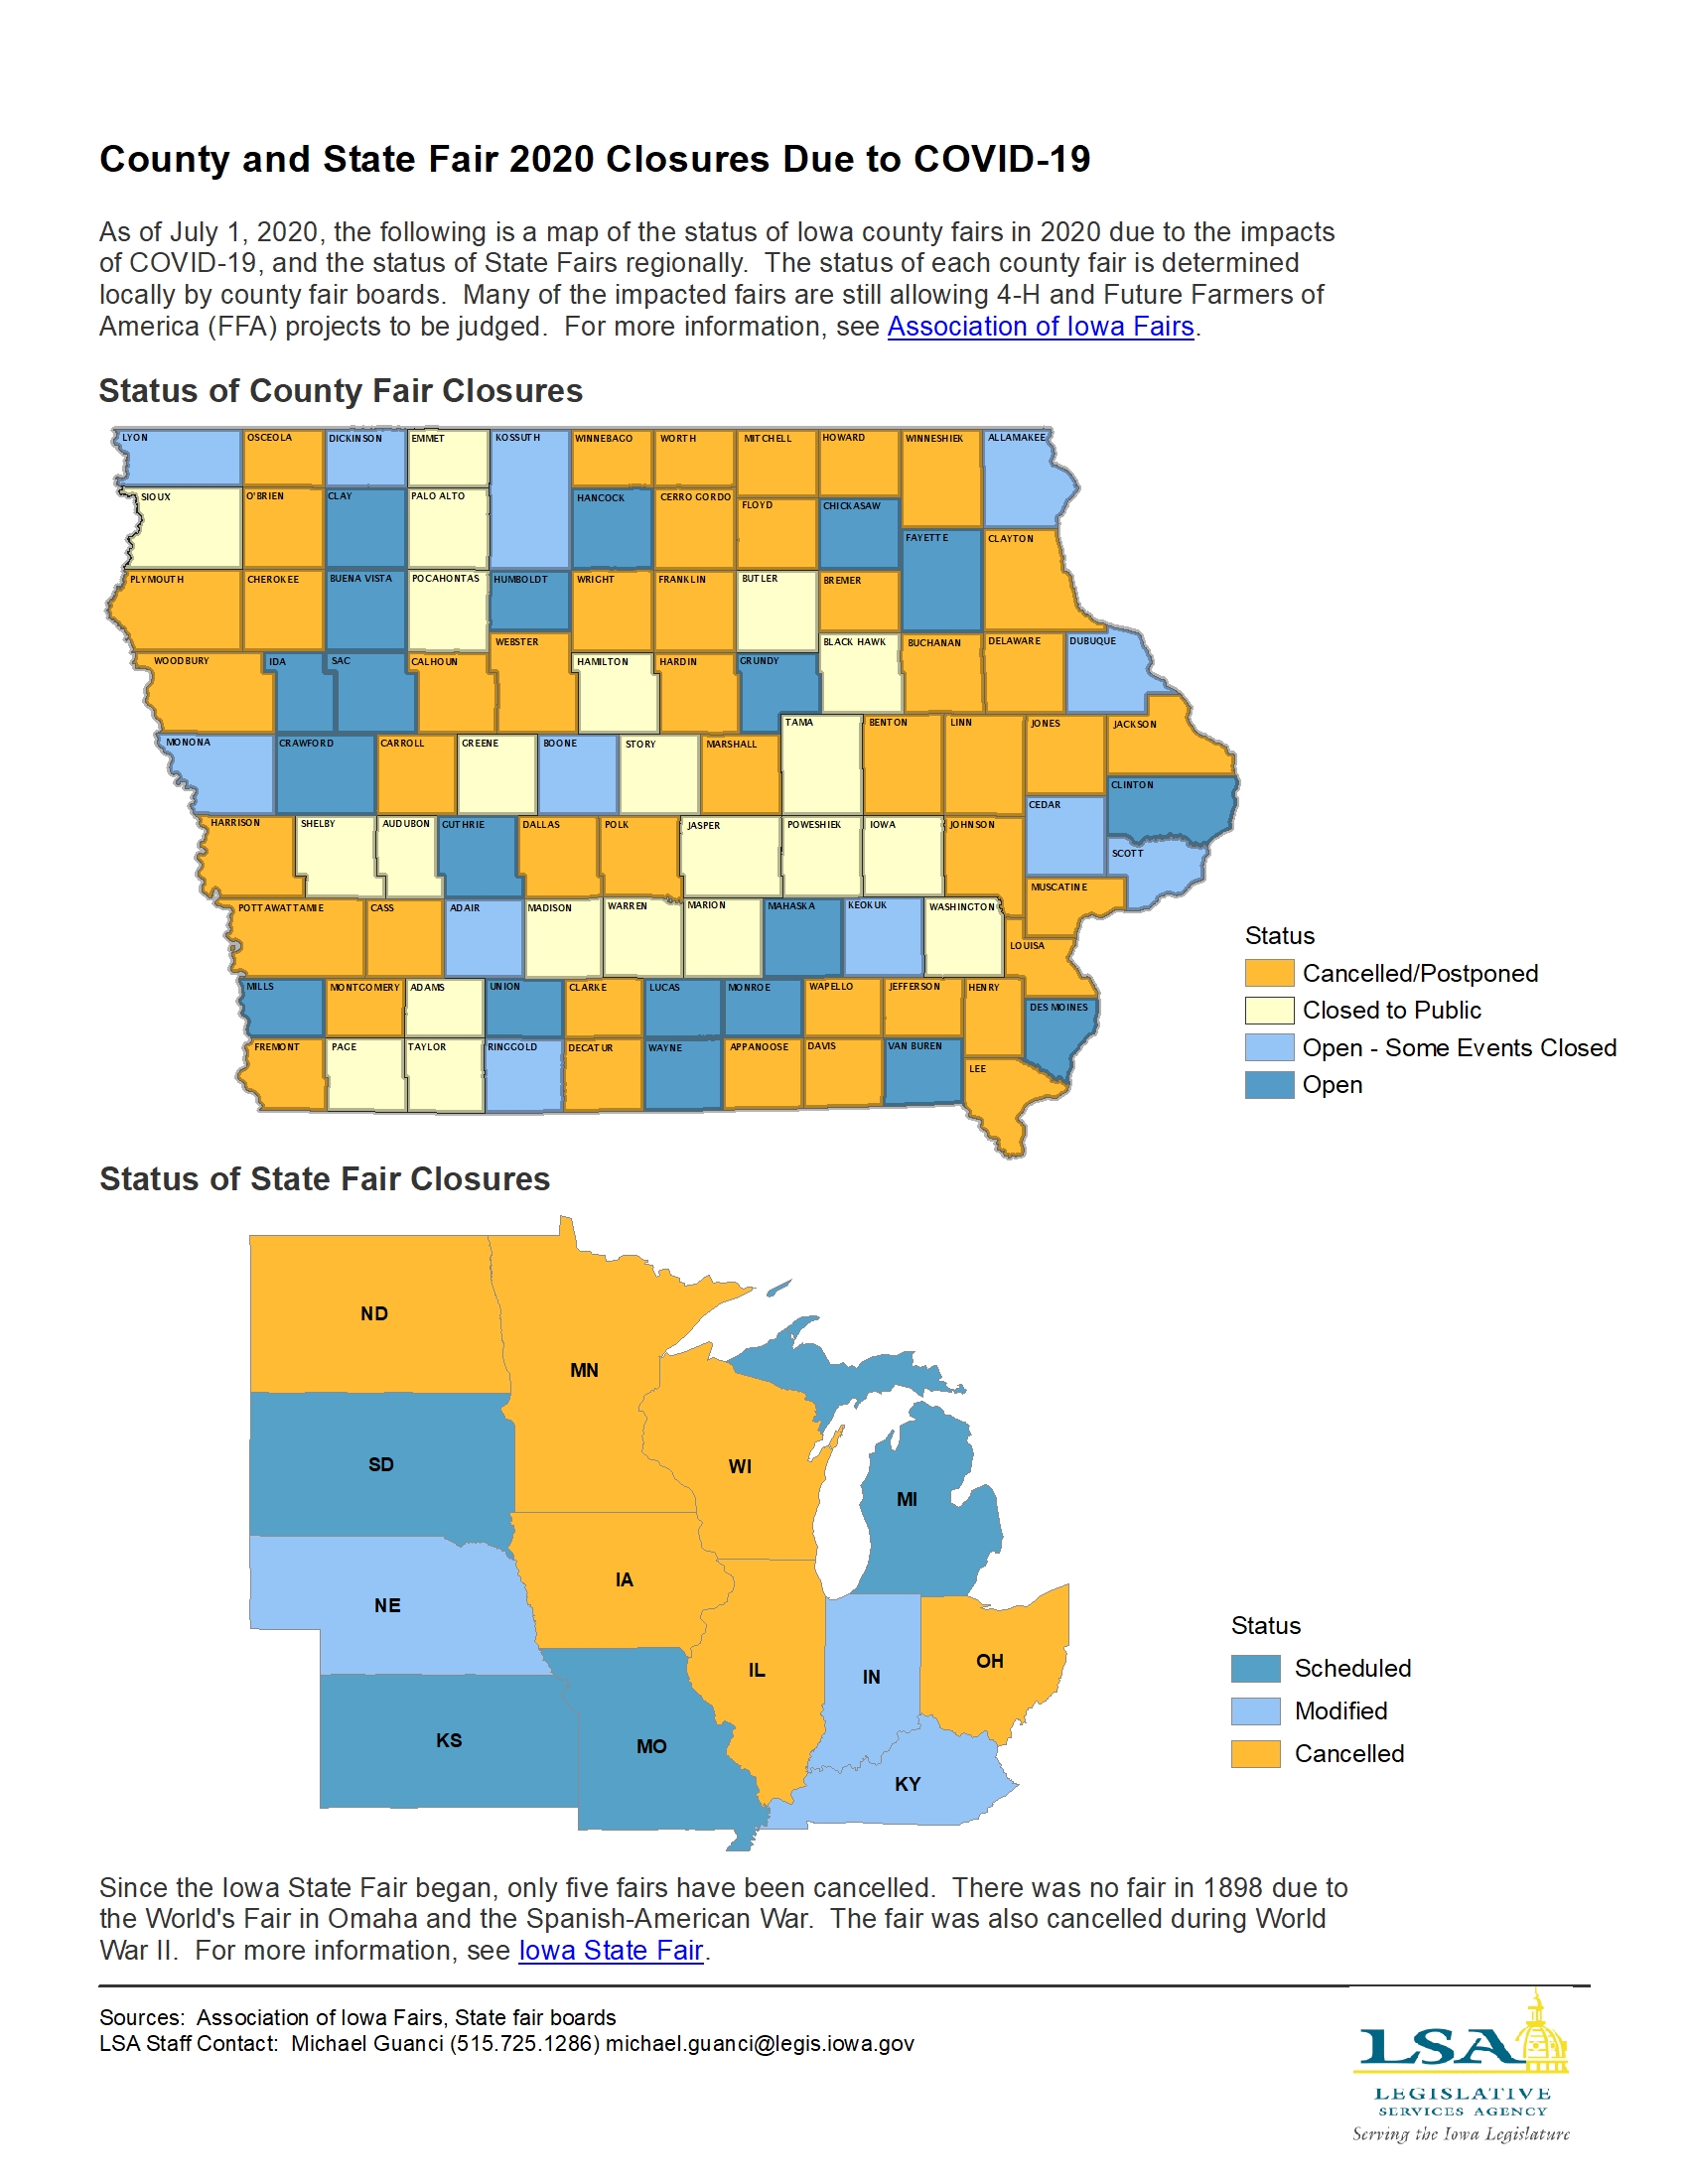
County and State Fair 2020 Closures Due to COVID-19
|
|
|
|
|
| 07/06/2020 |
Iowa Insights |
Iowa Water Trails and Low-Head Dam Mitigation Program

|
|
|
|
|
| 06/22/2020 |
Iowa Insights |
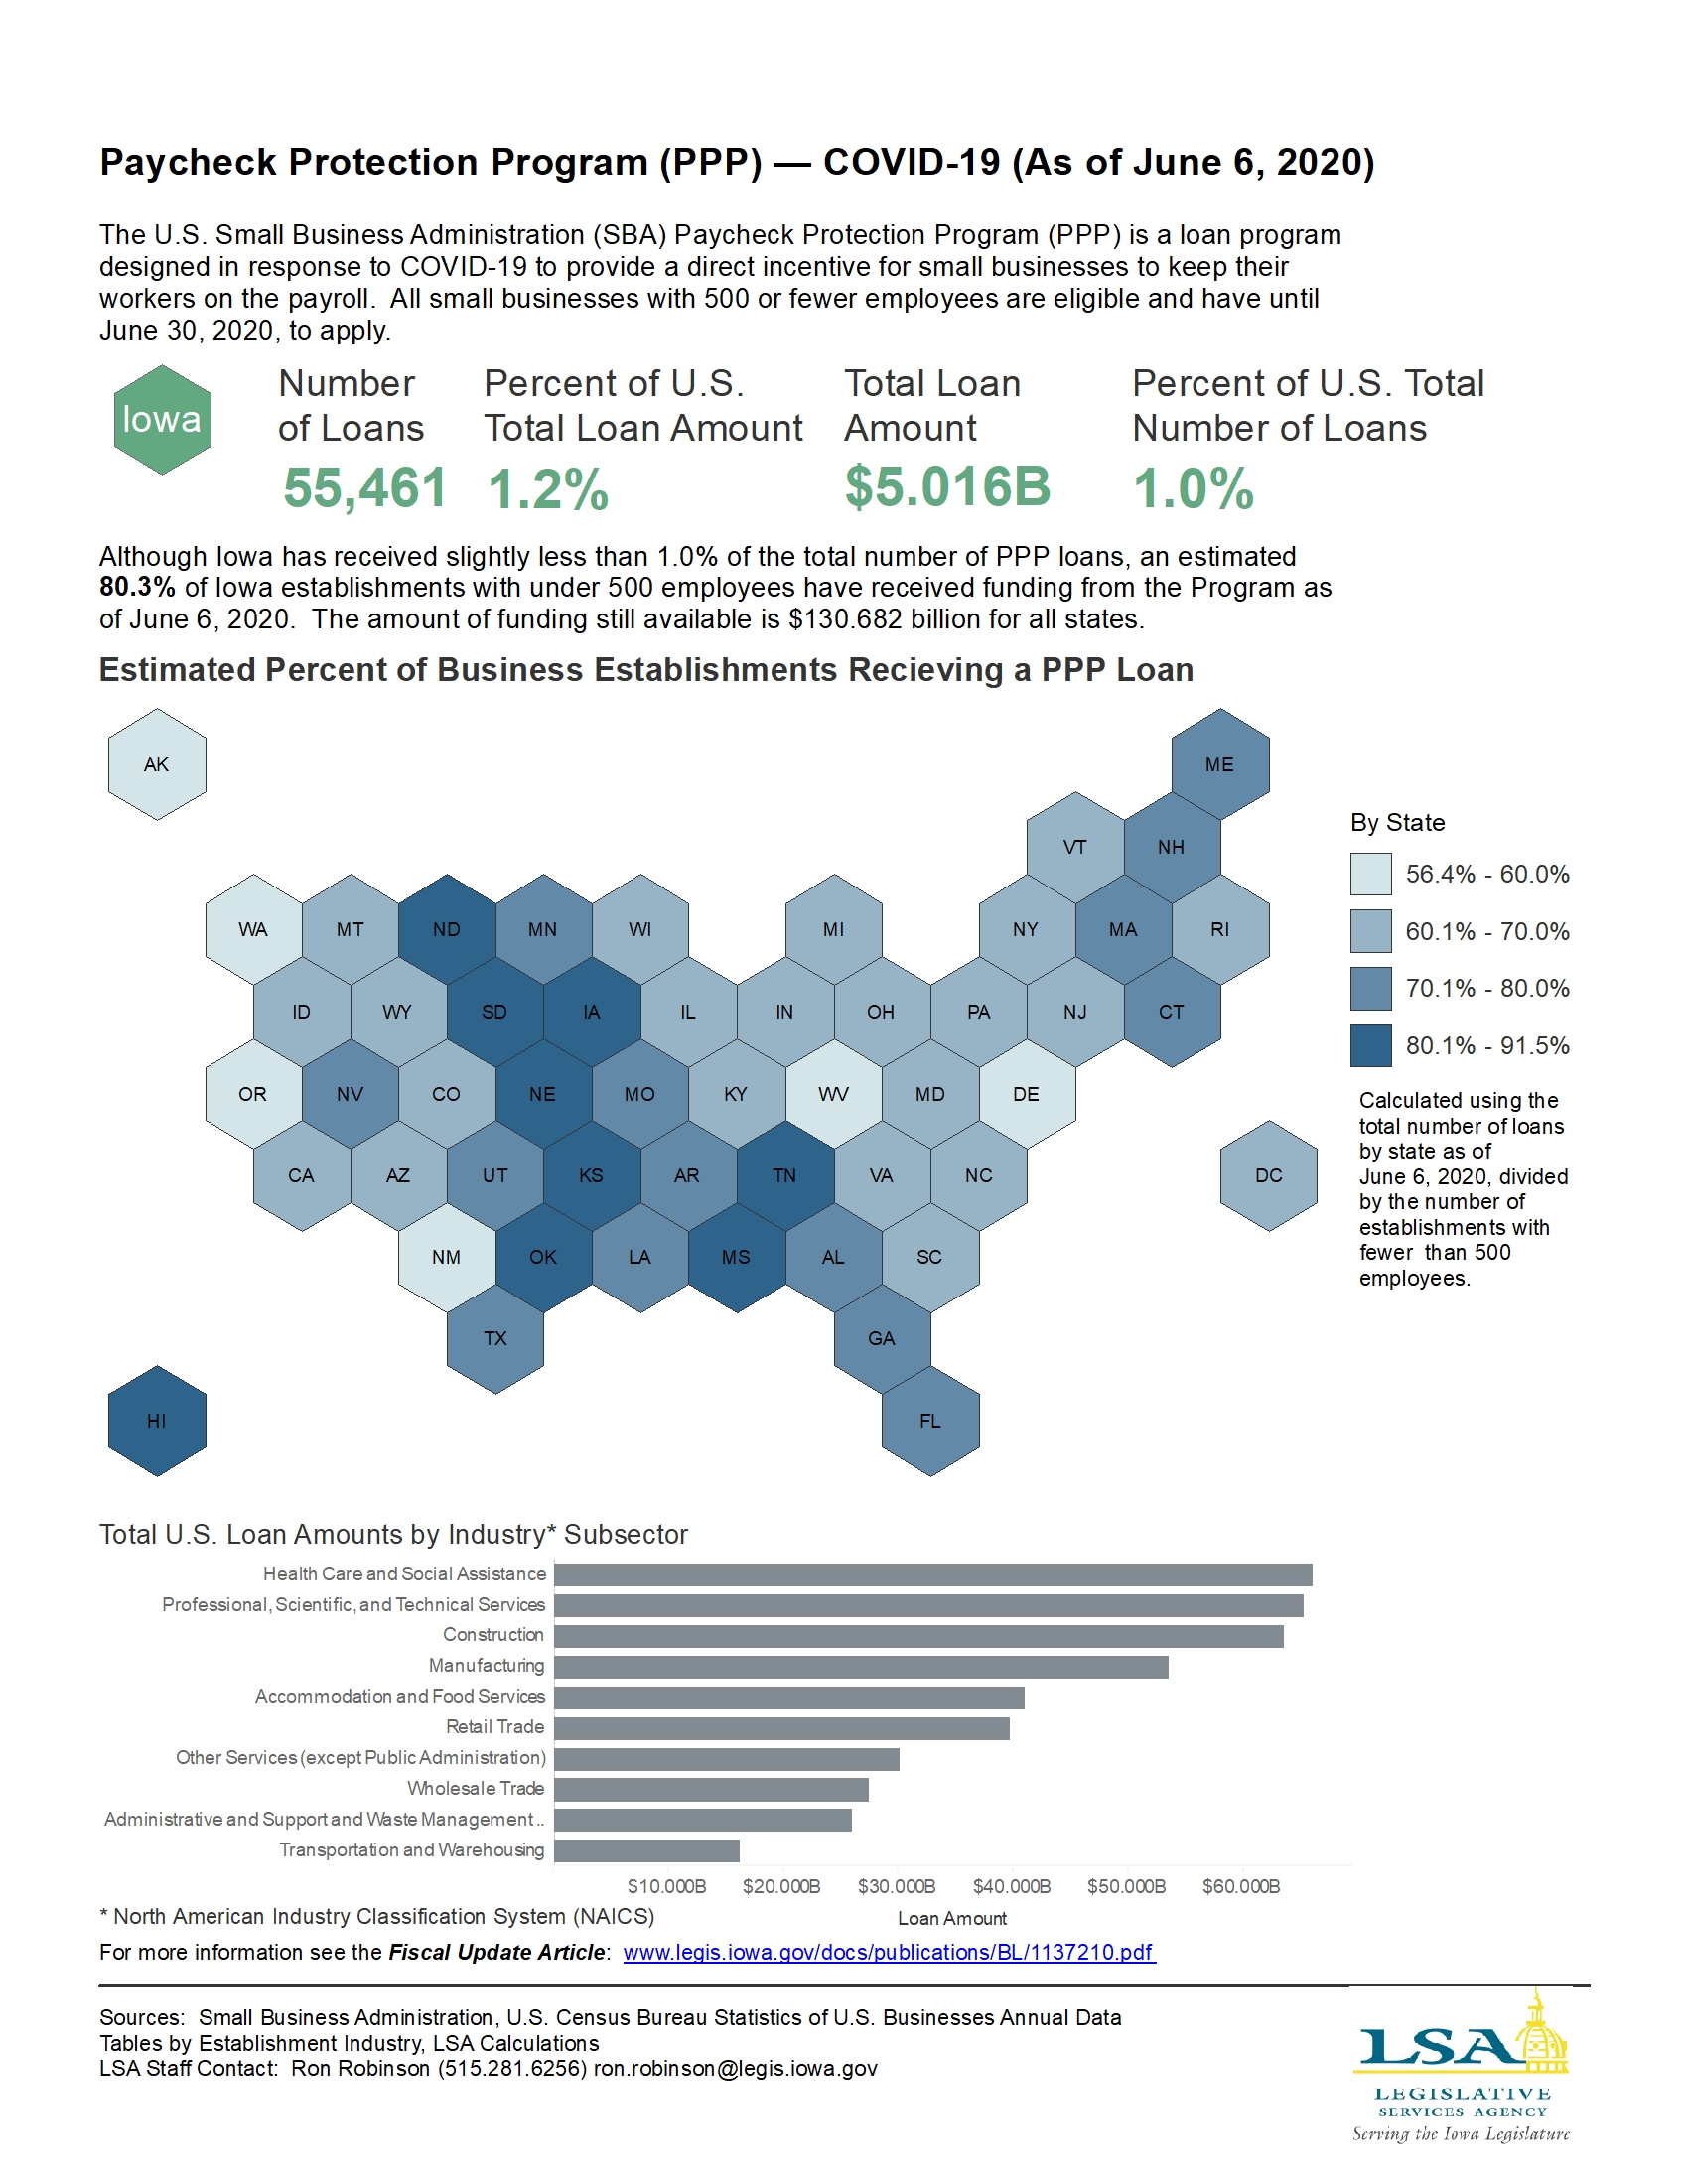
Paycheck Protection Program — COVID-19
|
|
|
|
|
| 06/15/2020 |
Iowa Insights |
2020 Primary Election Turnout and Absentee Ballots

|
|
|
|
|
| 06/08/2020 |
Iowa Insights |
Elementary and Secondary School Emergency Relief Funds — COVID 19

|
|
|
|
|
| 06/01/2020 |
Iowa Insights |
COVID-19 Impact — 2020 Census

|
|
|
|
|
| 05/26/2020 |
Iowa Insights |
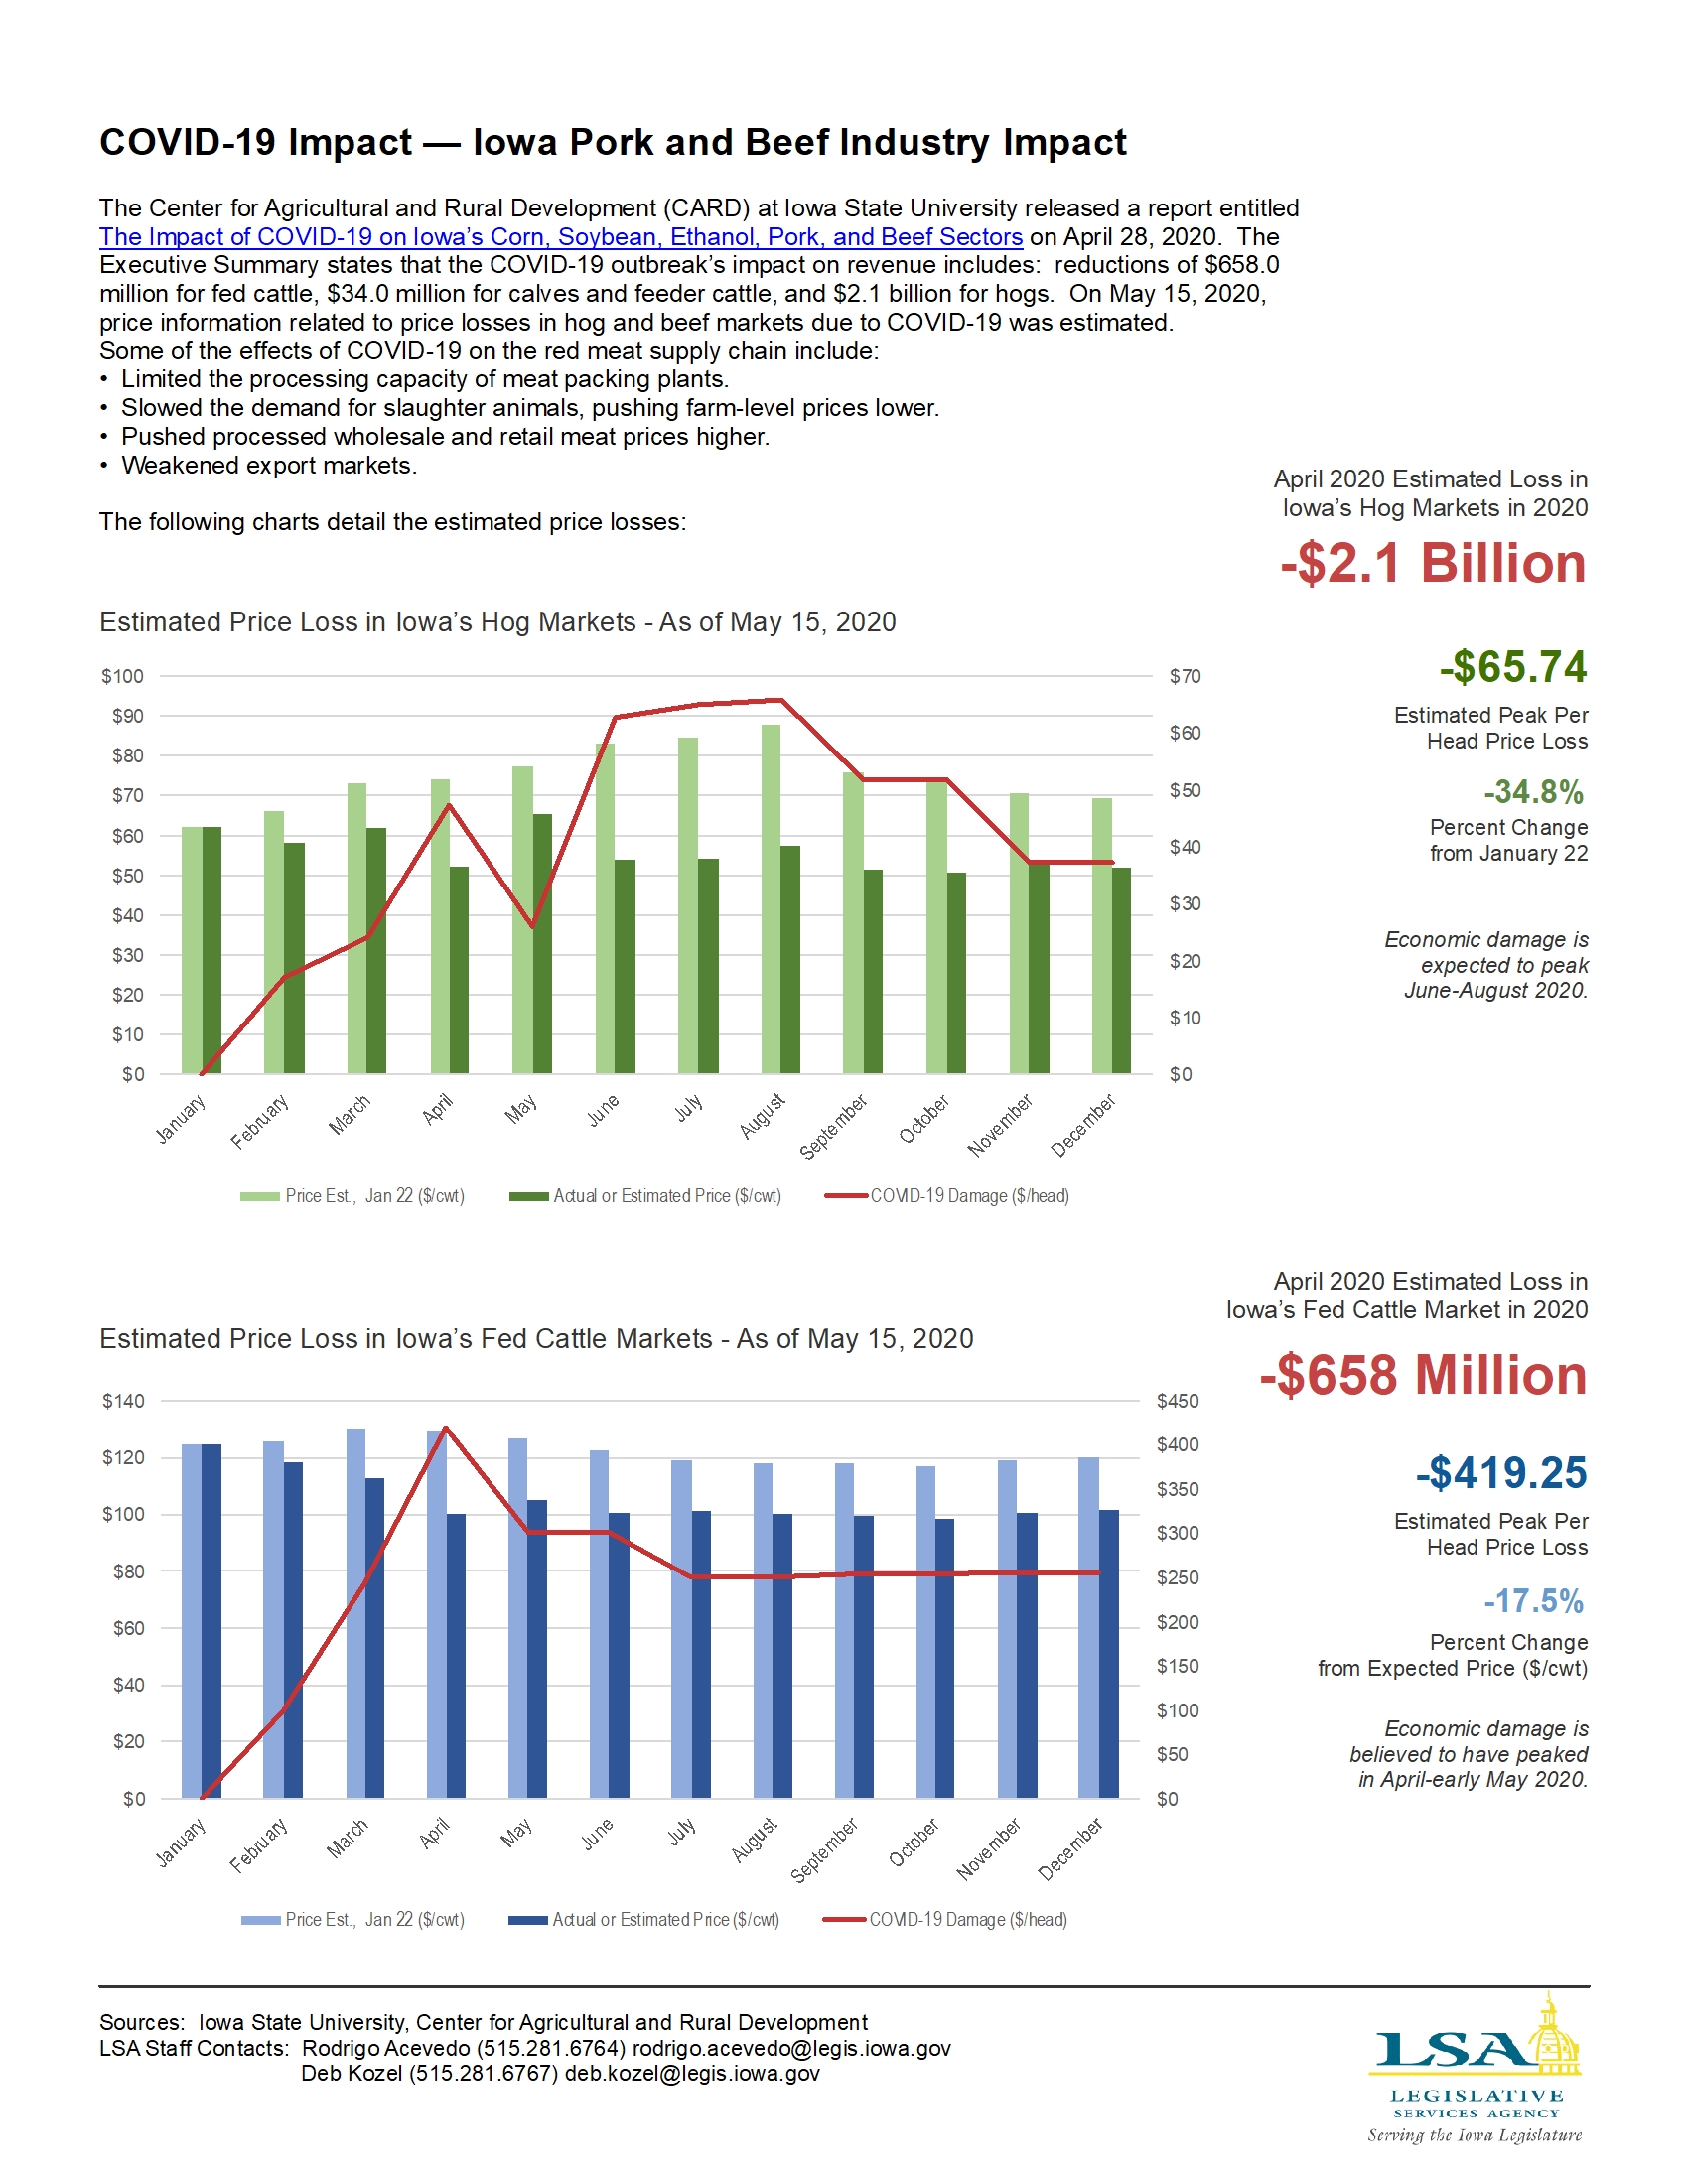
COVID-19 Impact — Iowa Pork and Beef Industry Impact
|
|
|
|
|
| 05/18/2020 |
Iowa Insights |
Average Corn and Soybean Prices and World Exports

|
|
|
|
|
| 05/11/2020 |
Iowa Insights |
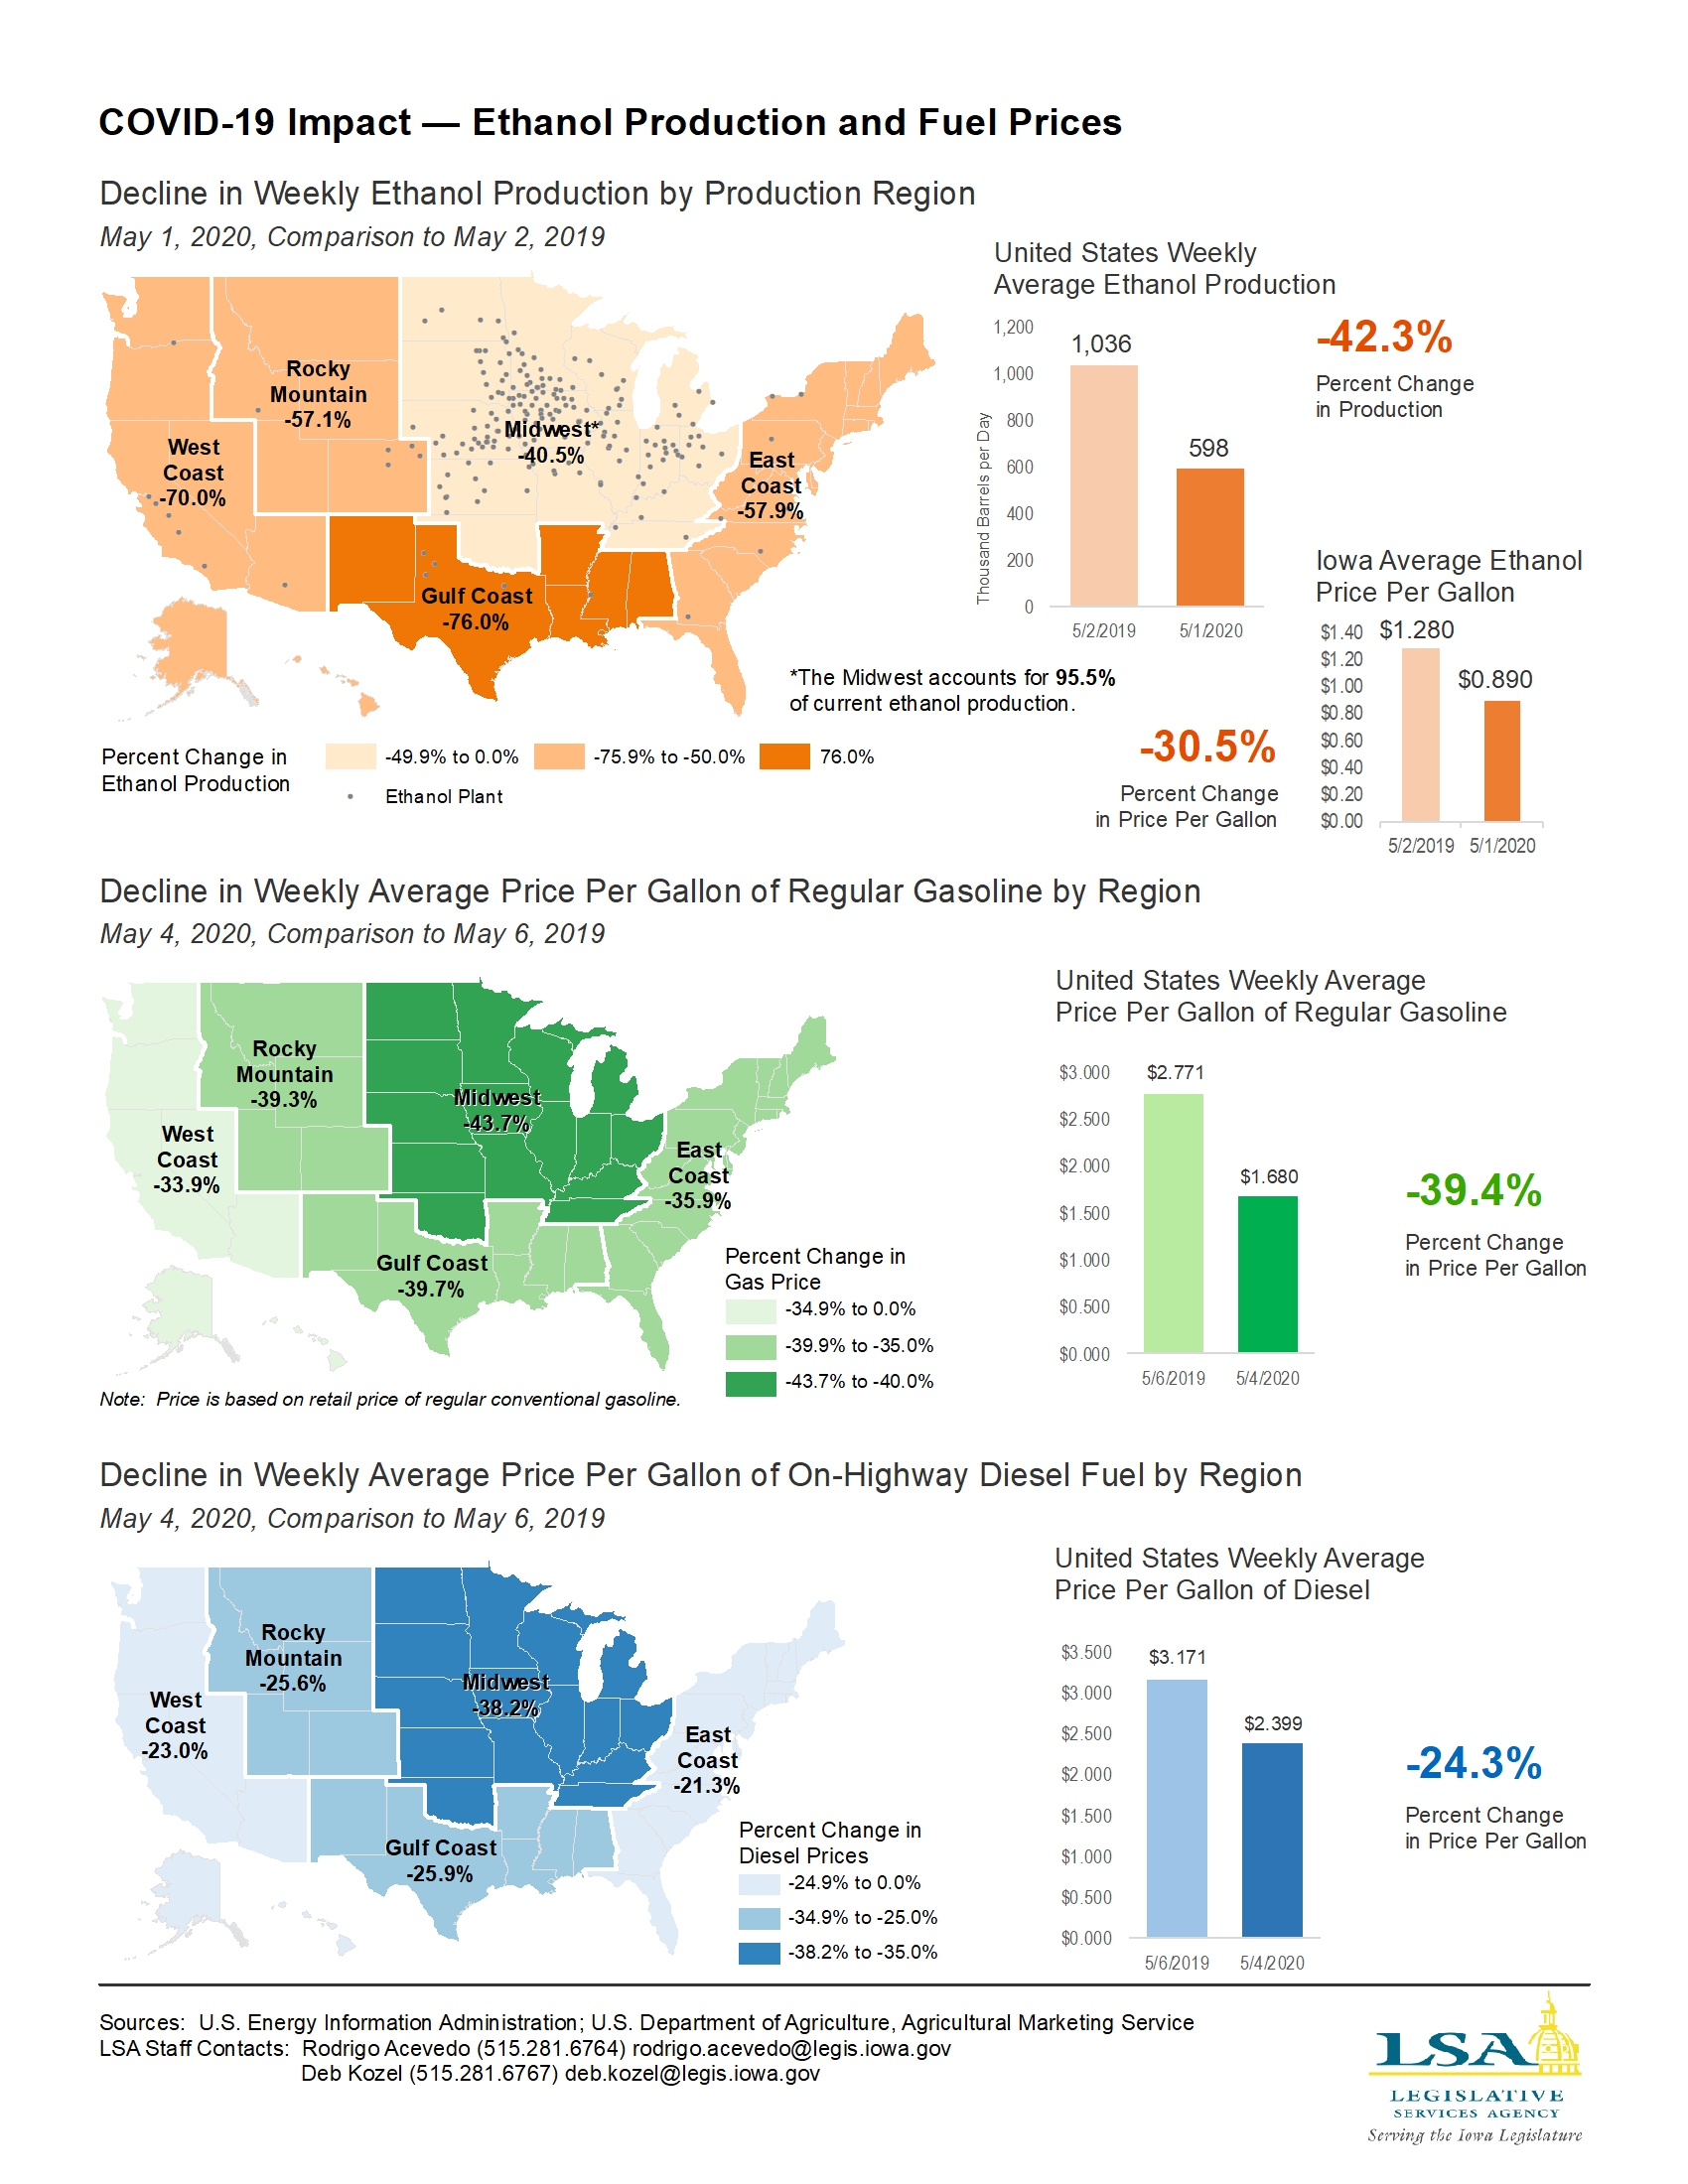
COVID-19 Impact — Ethanol Production and Fuel Prices
|
|
|
|
|
| 05/04/2020 |
Iowa Insights |
COVID-19 — Estimated Coronavirus Relief Fund Allocations Per Capita
|
|
|
|
|
| 04/27/2020 |
Iowa Insights |
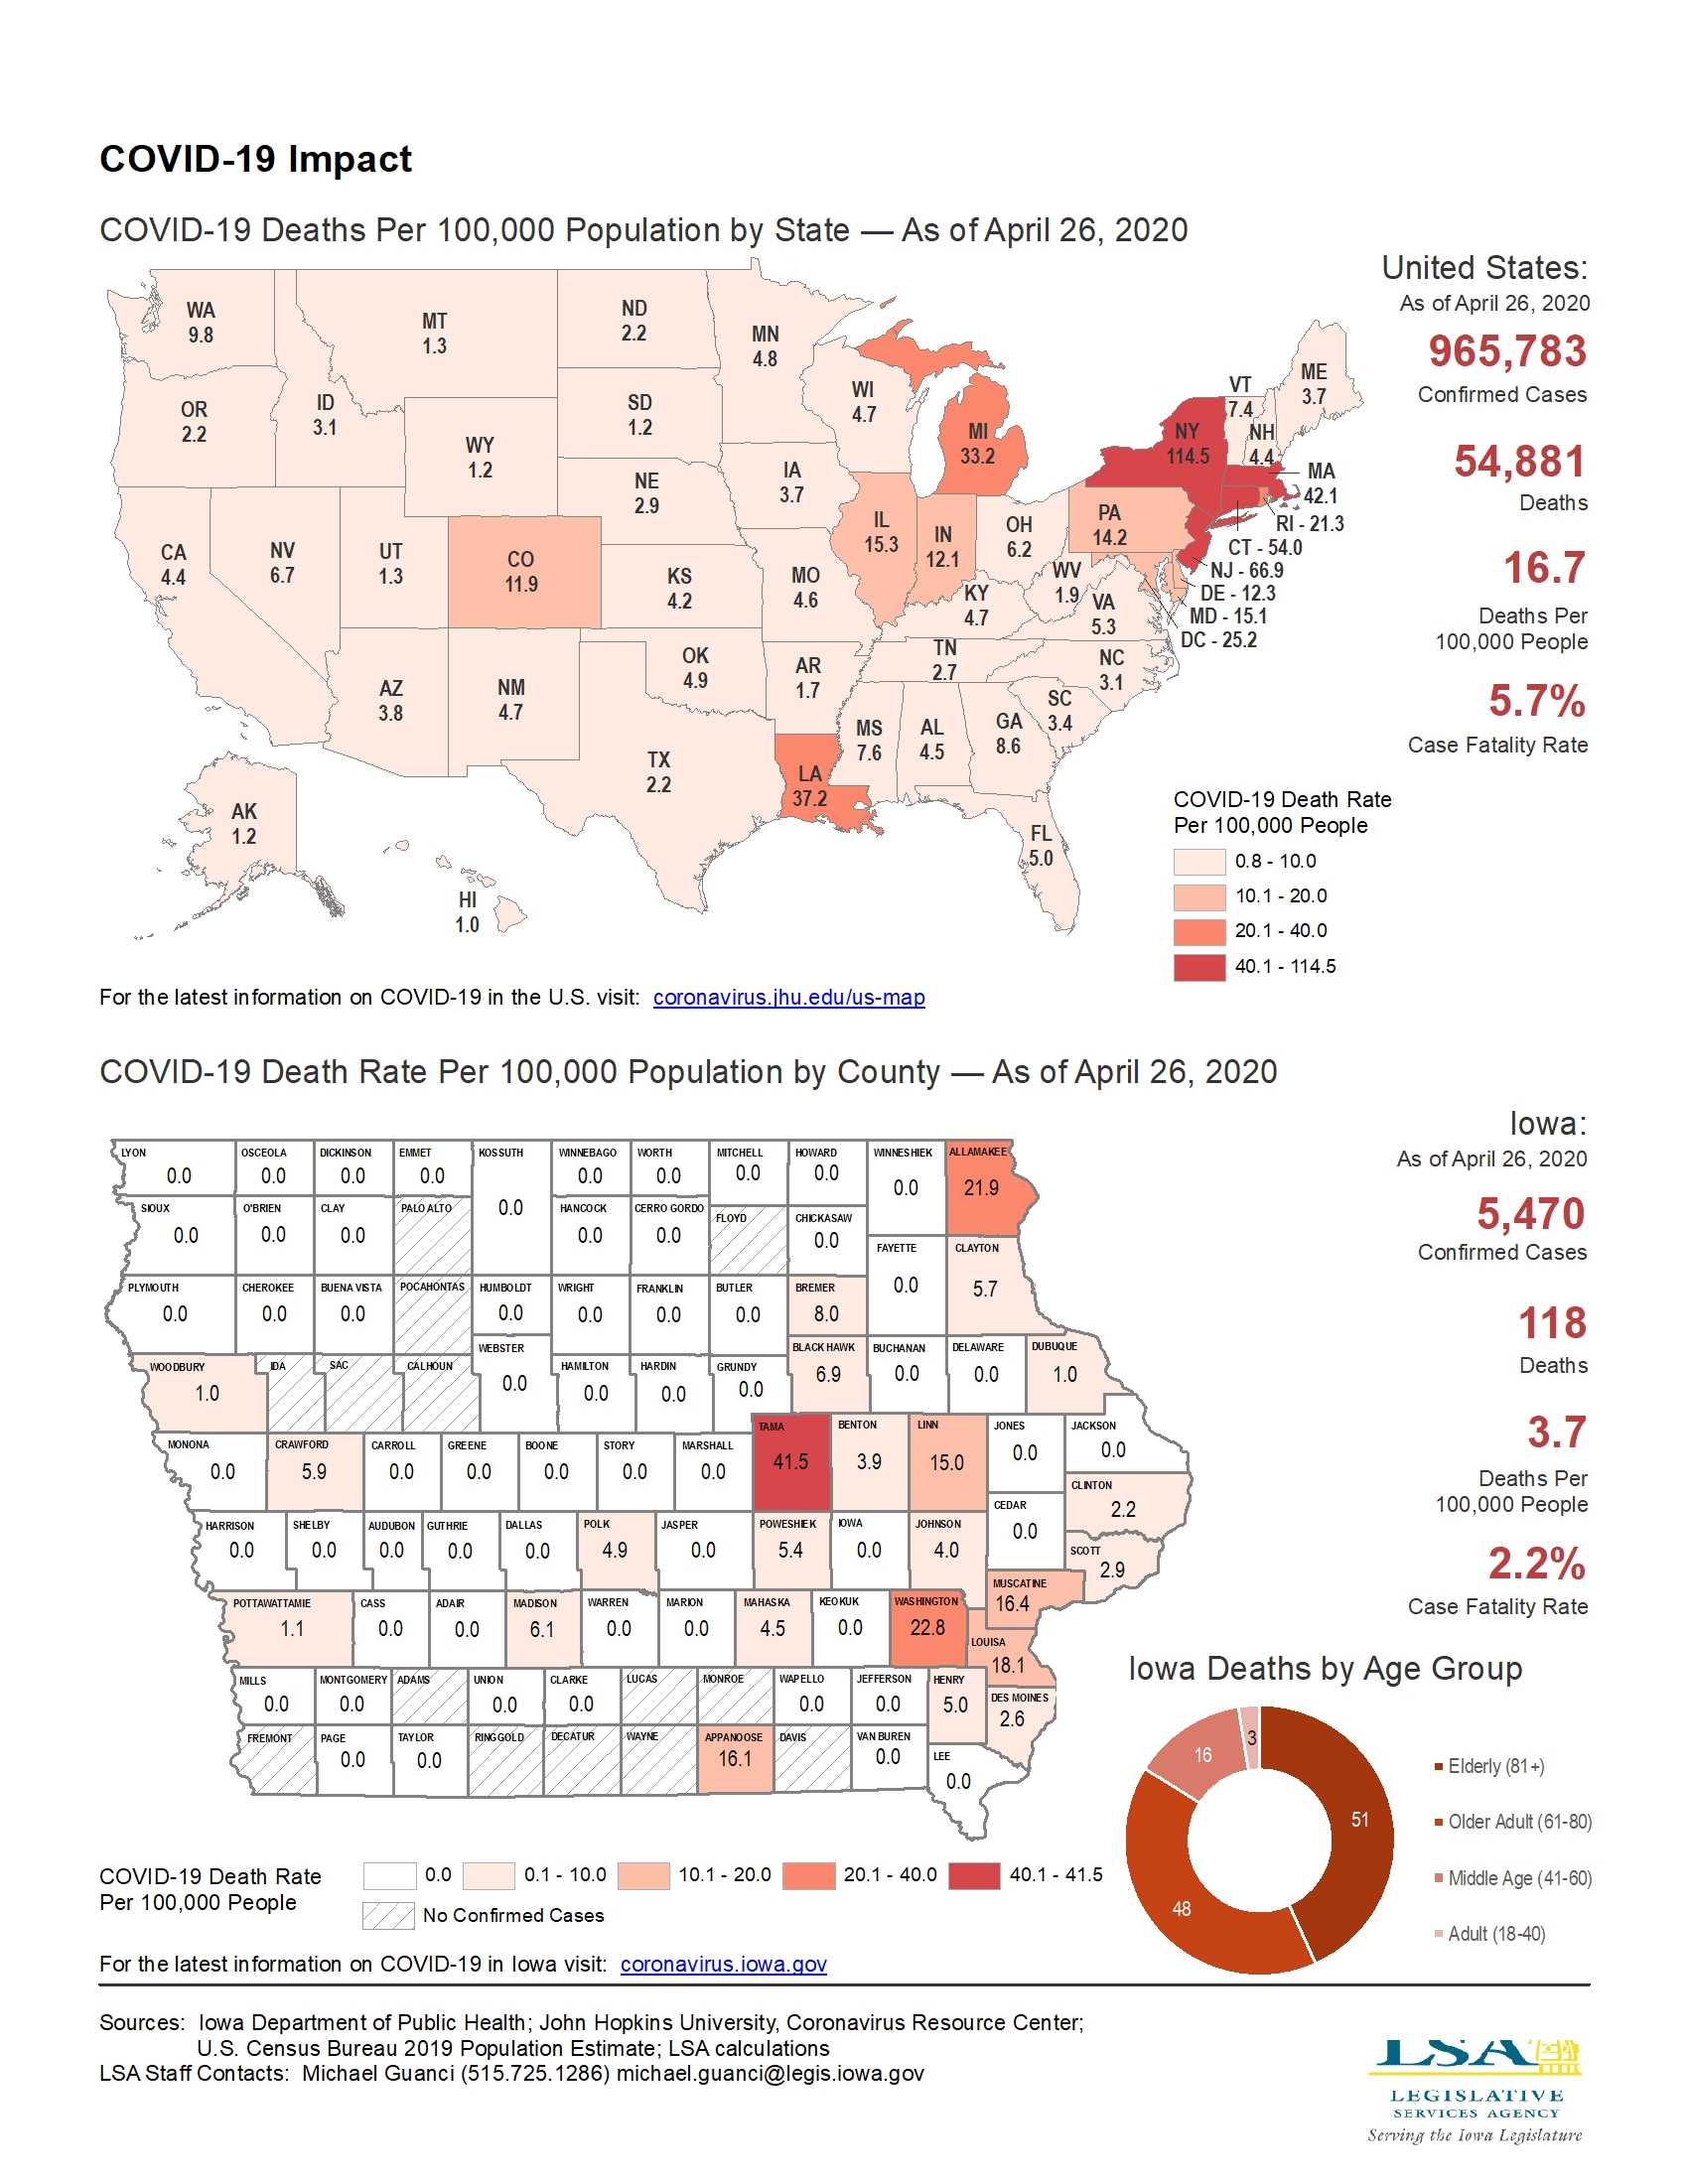
COVID-19 Impact — Death Rate Per 100,000
|
|
|
|
|
| 04/20/2020 |
Iowa Insights |
COVID-19 — Continuous Learning Plans for Iowa School Districts and Nonpublic Schools
|
|
|
|
|
| 04/13/2020 |
Iowa Insights |
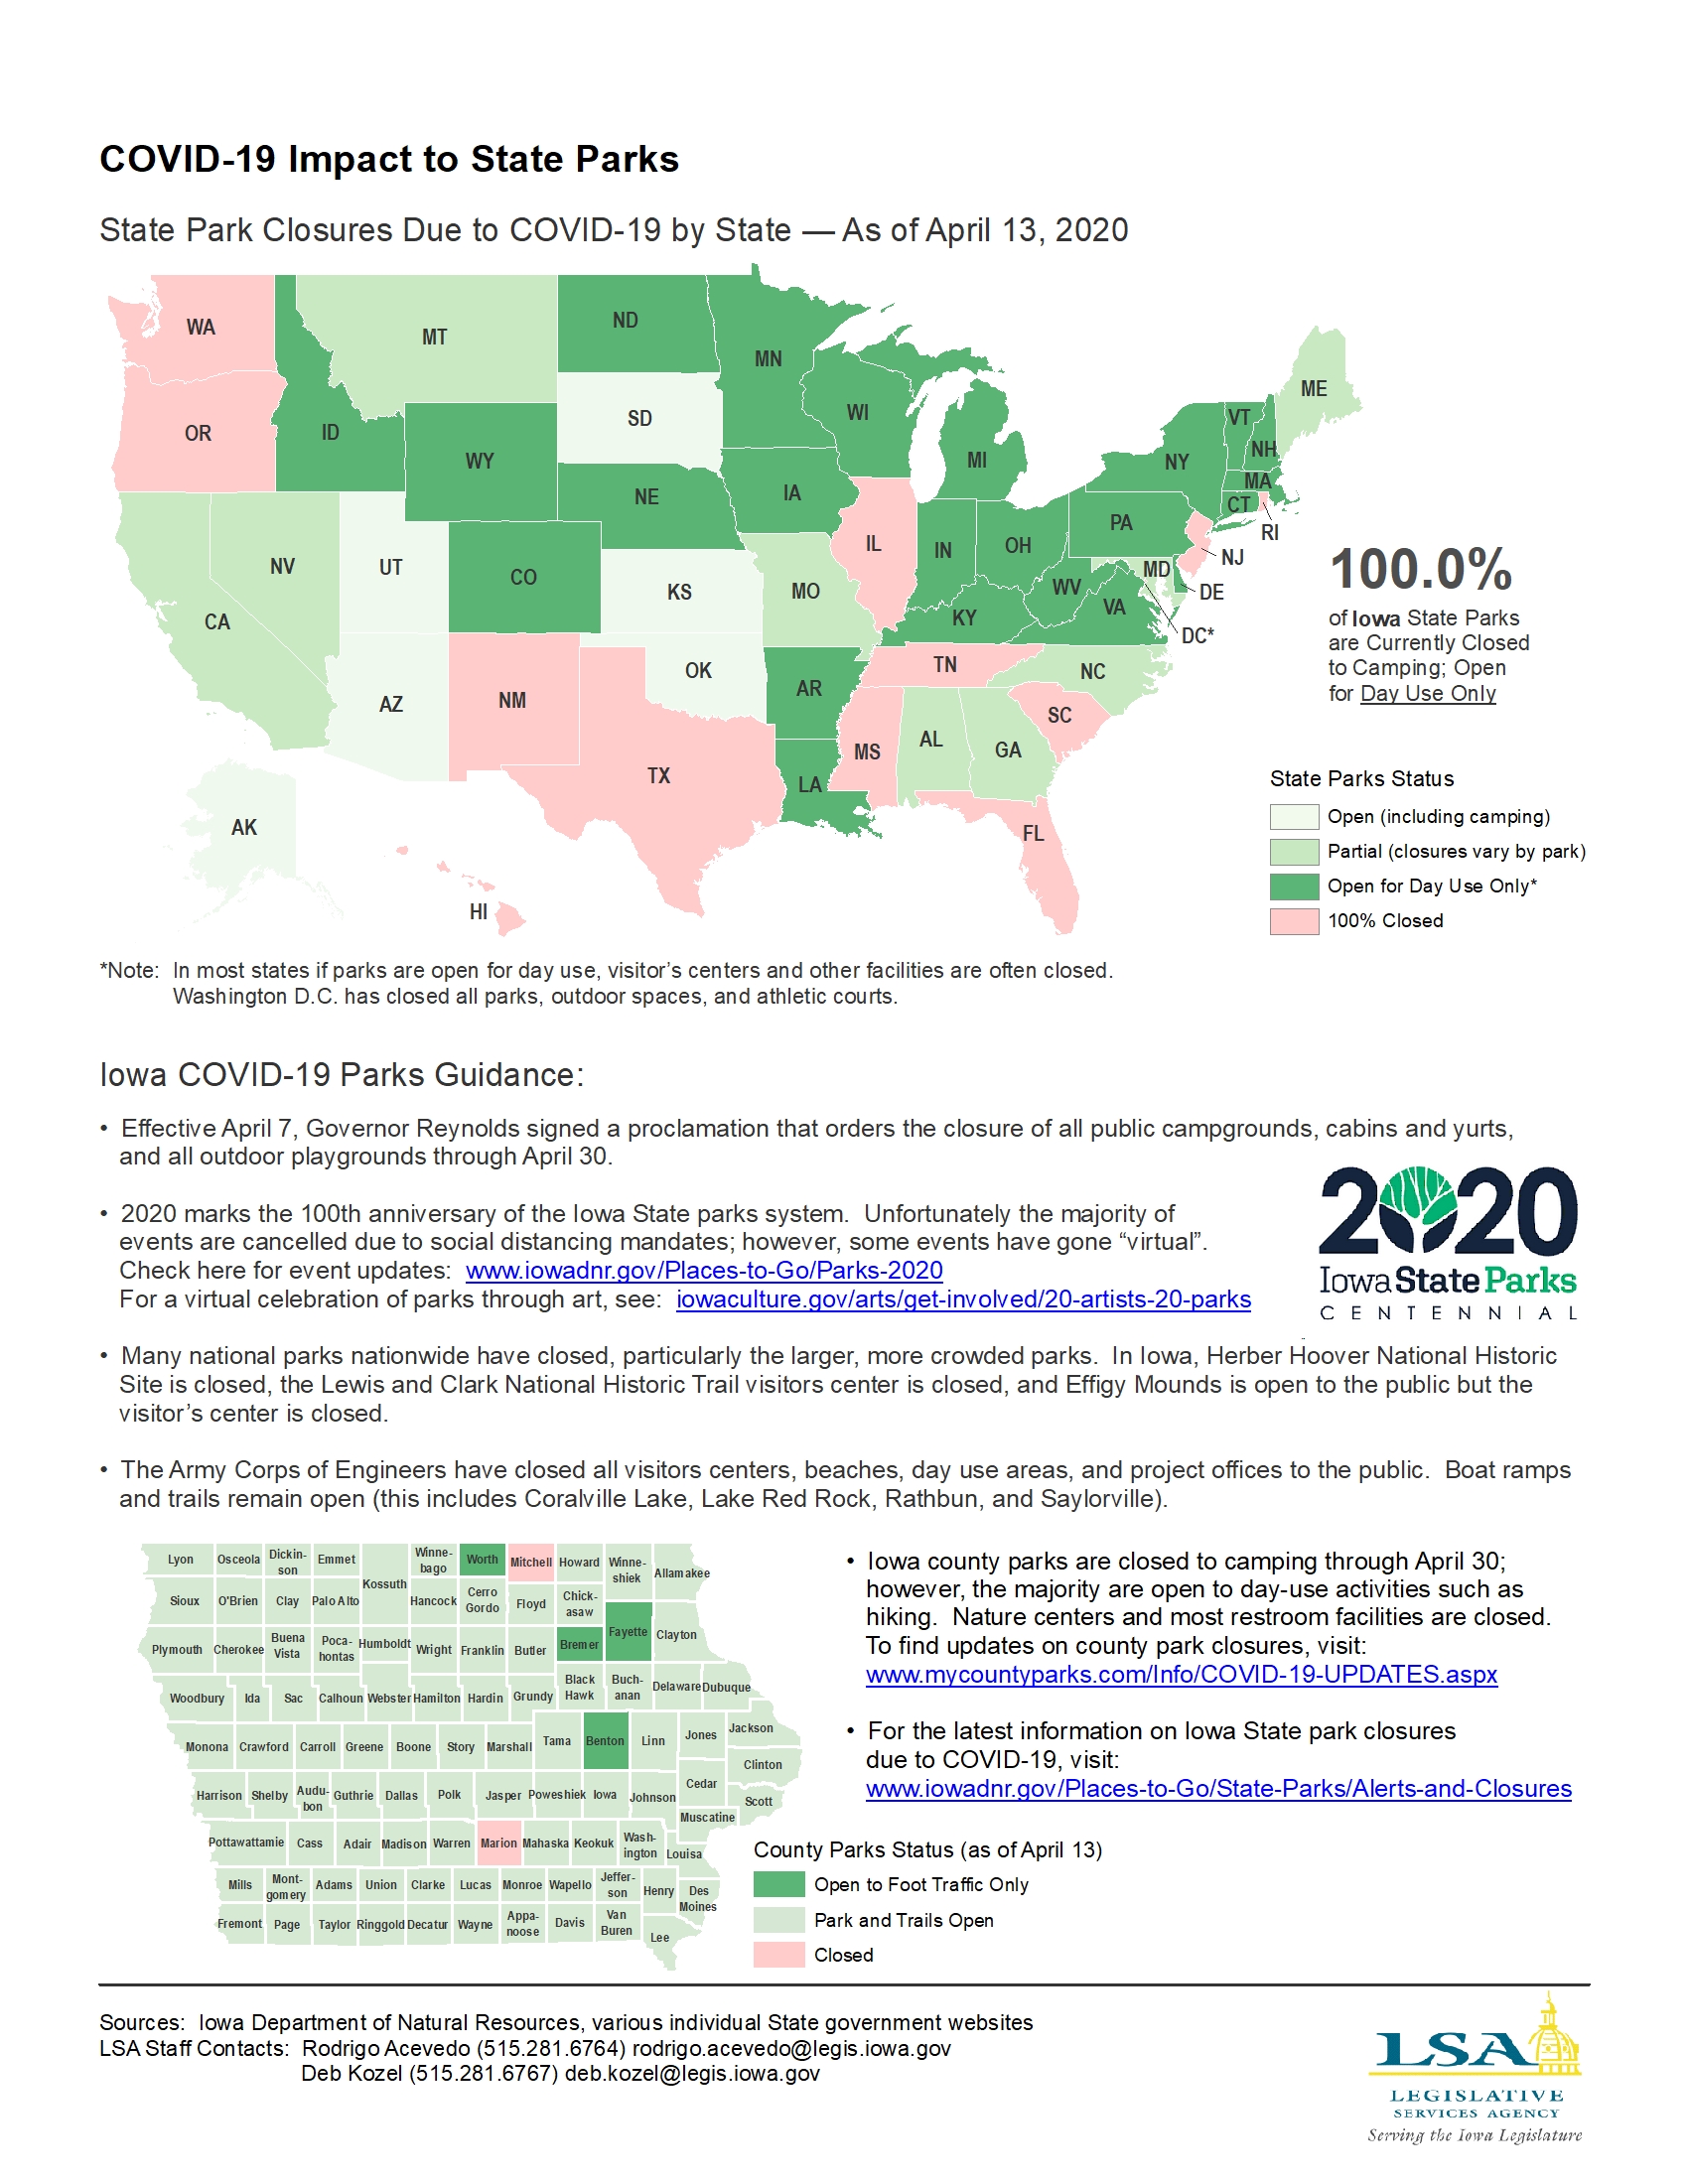
COVID-19 Impact to State Parks
|
|
|
|
|
| 04/06/2020 |
Iowa Insights |
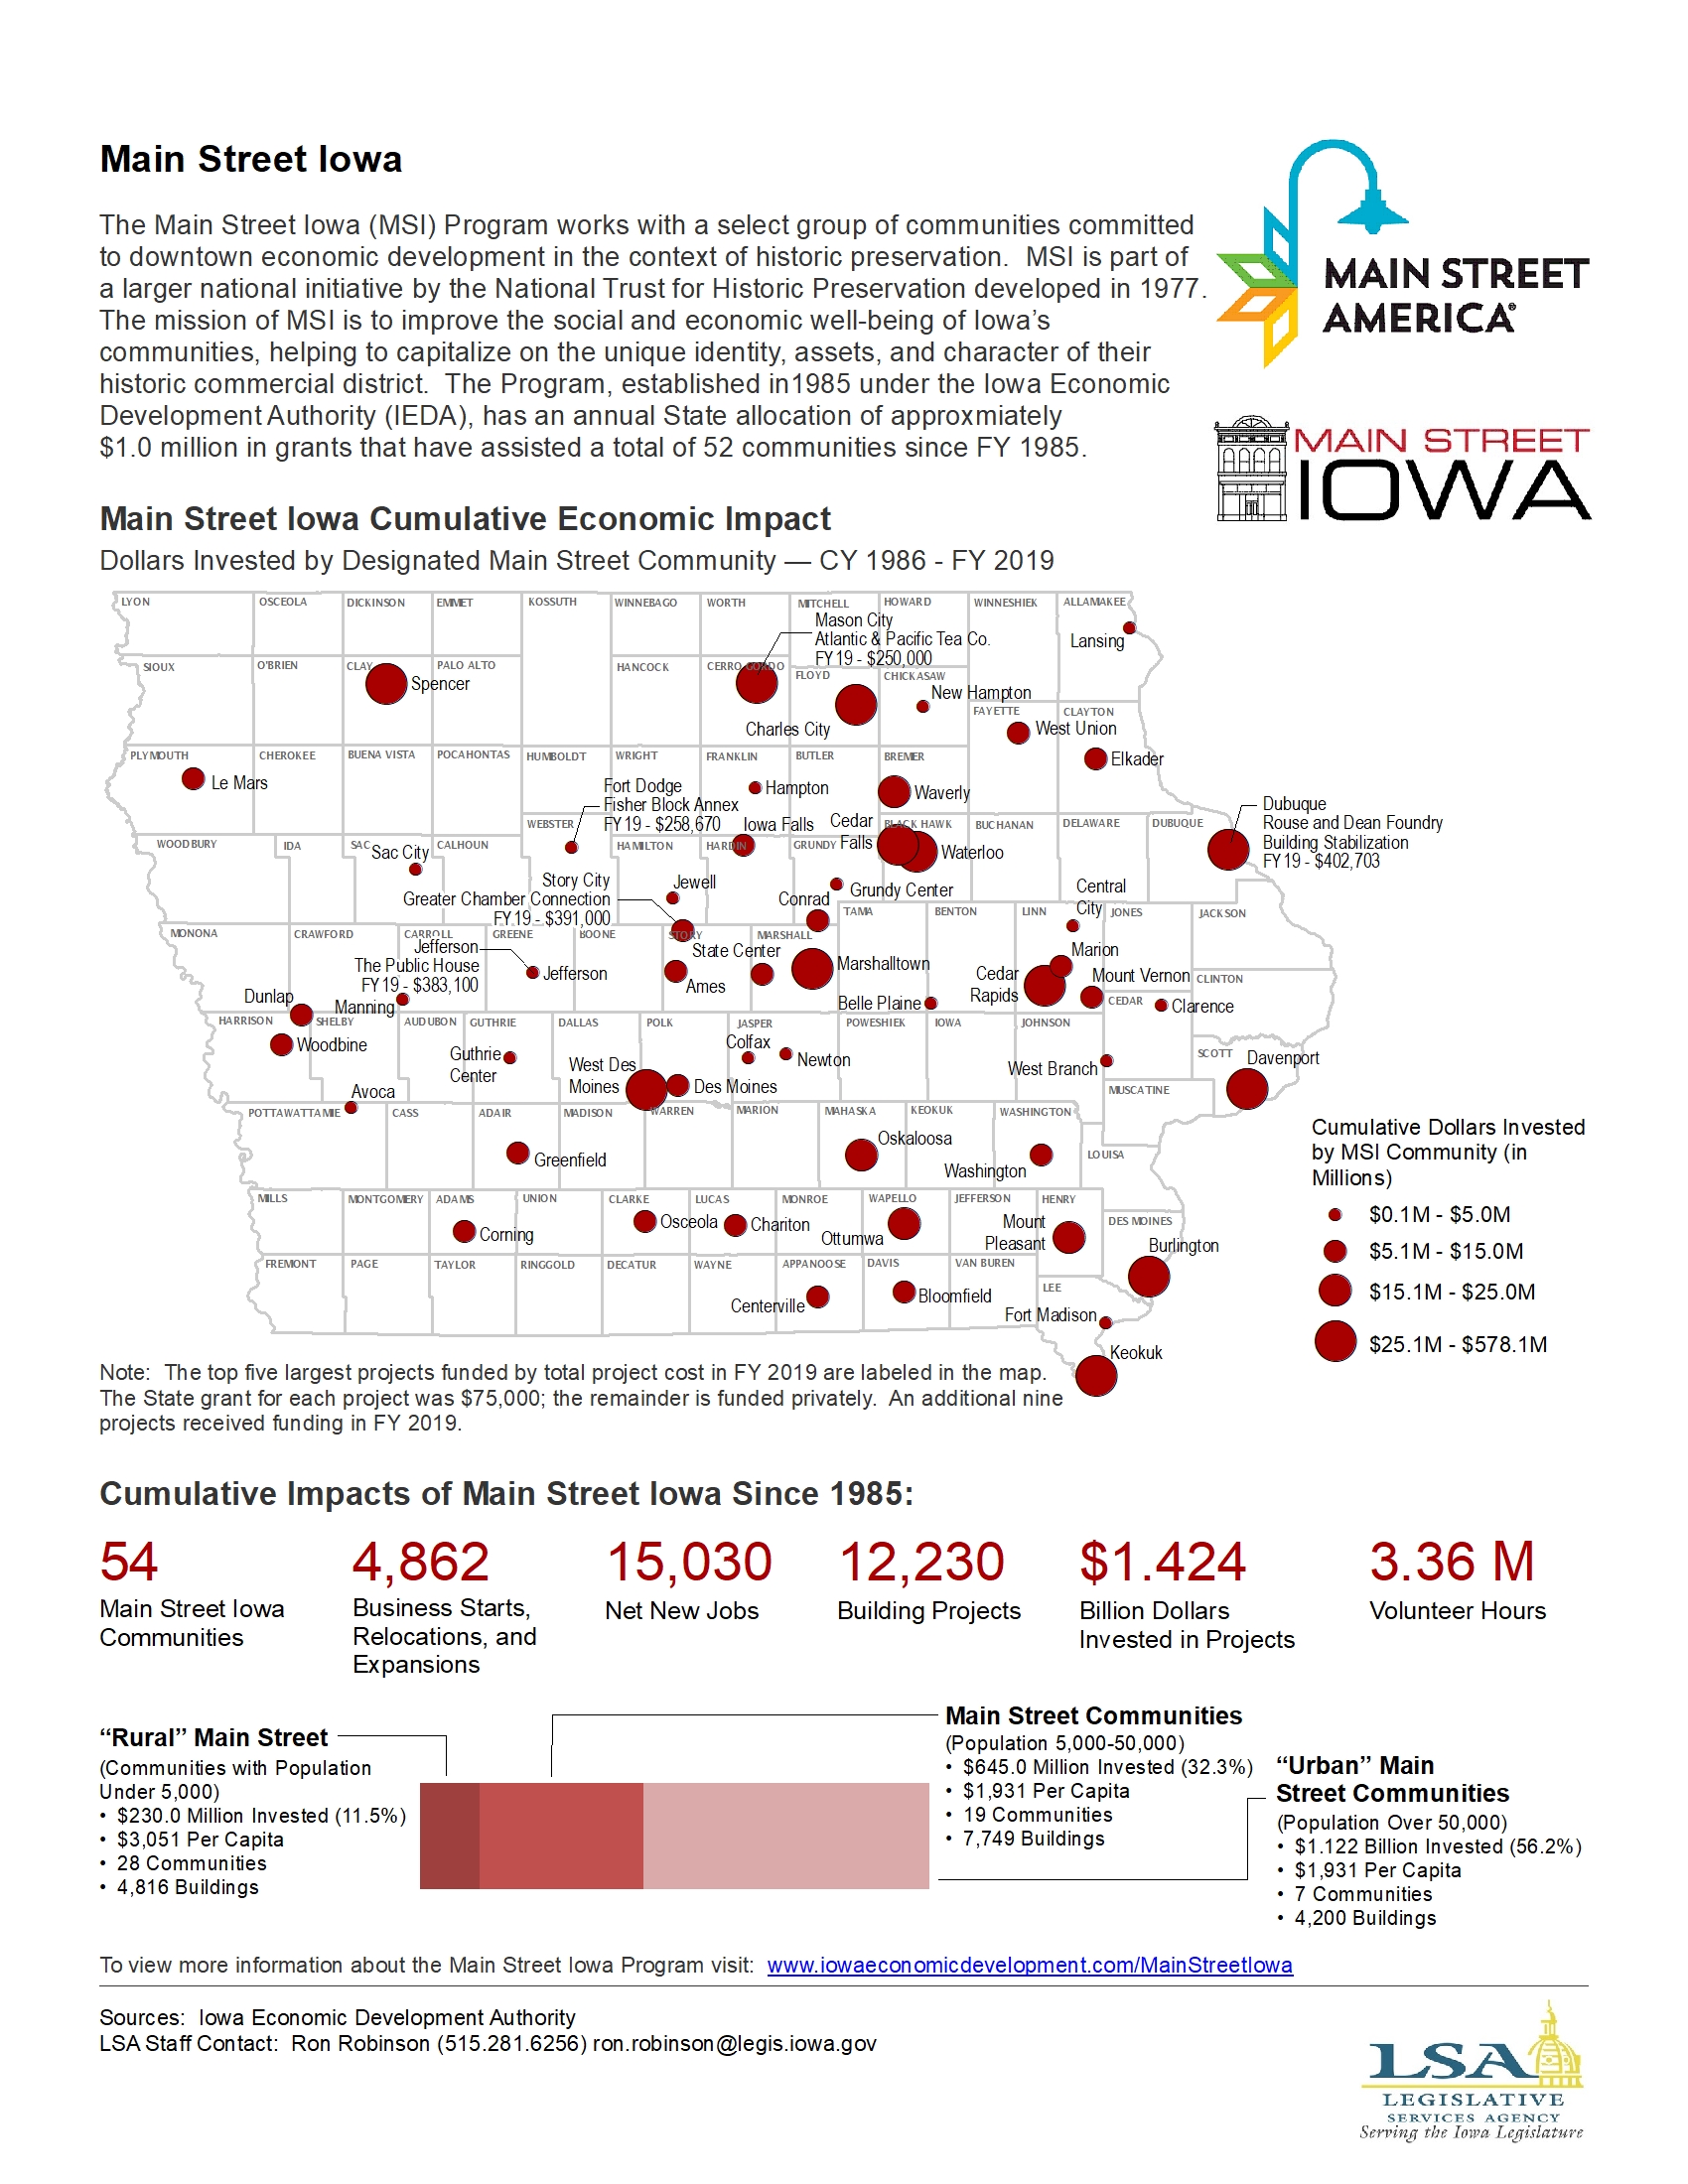
Main Street Iowa
|
|
|
|
|
| 03/30/2020 |
Iowa Insights |
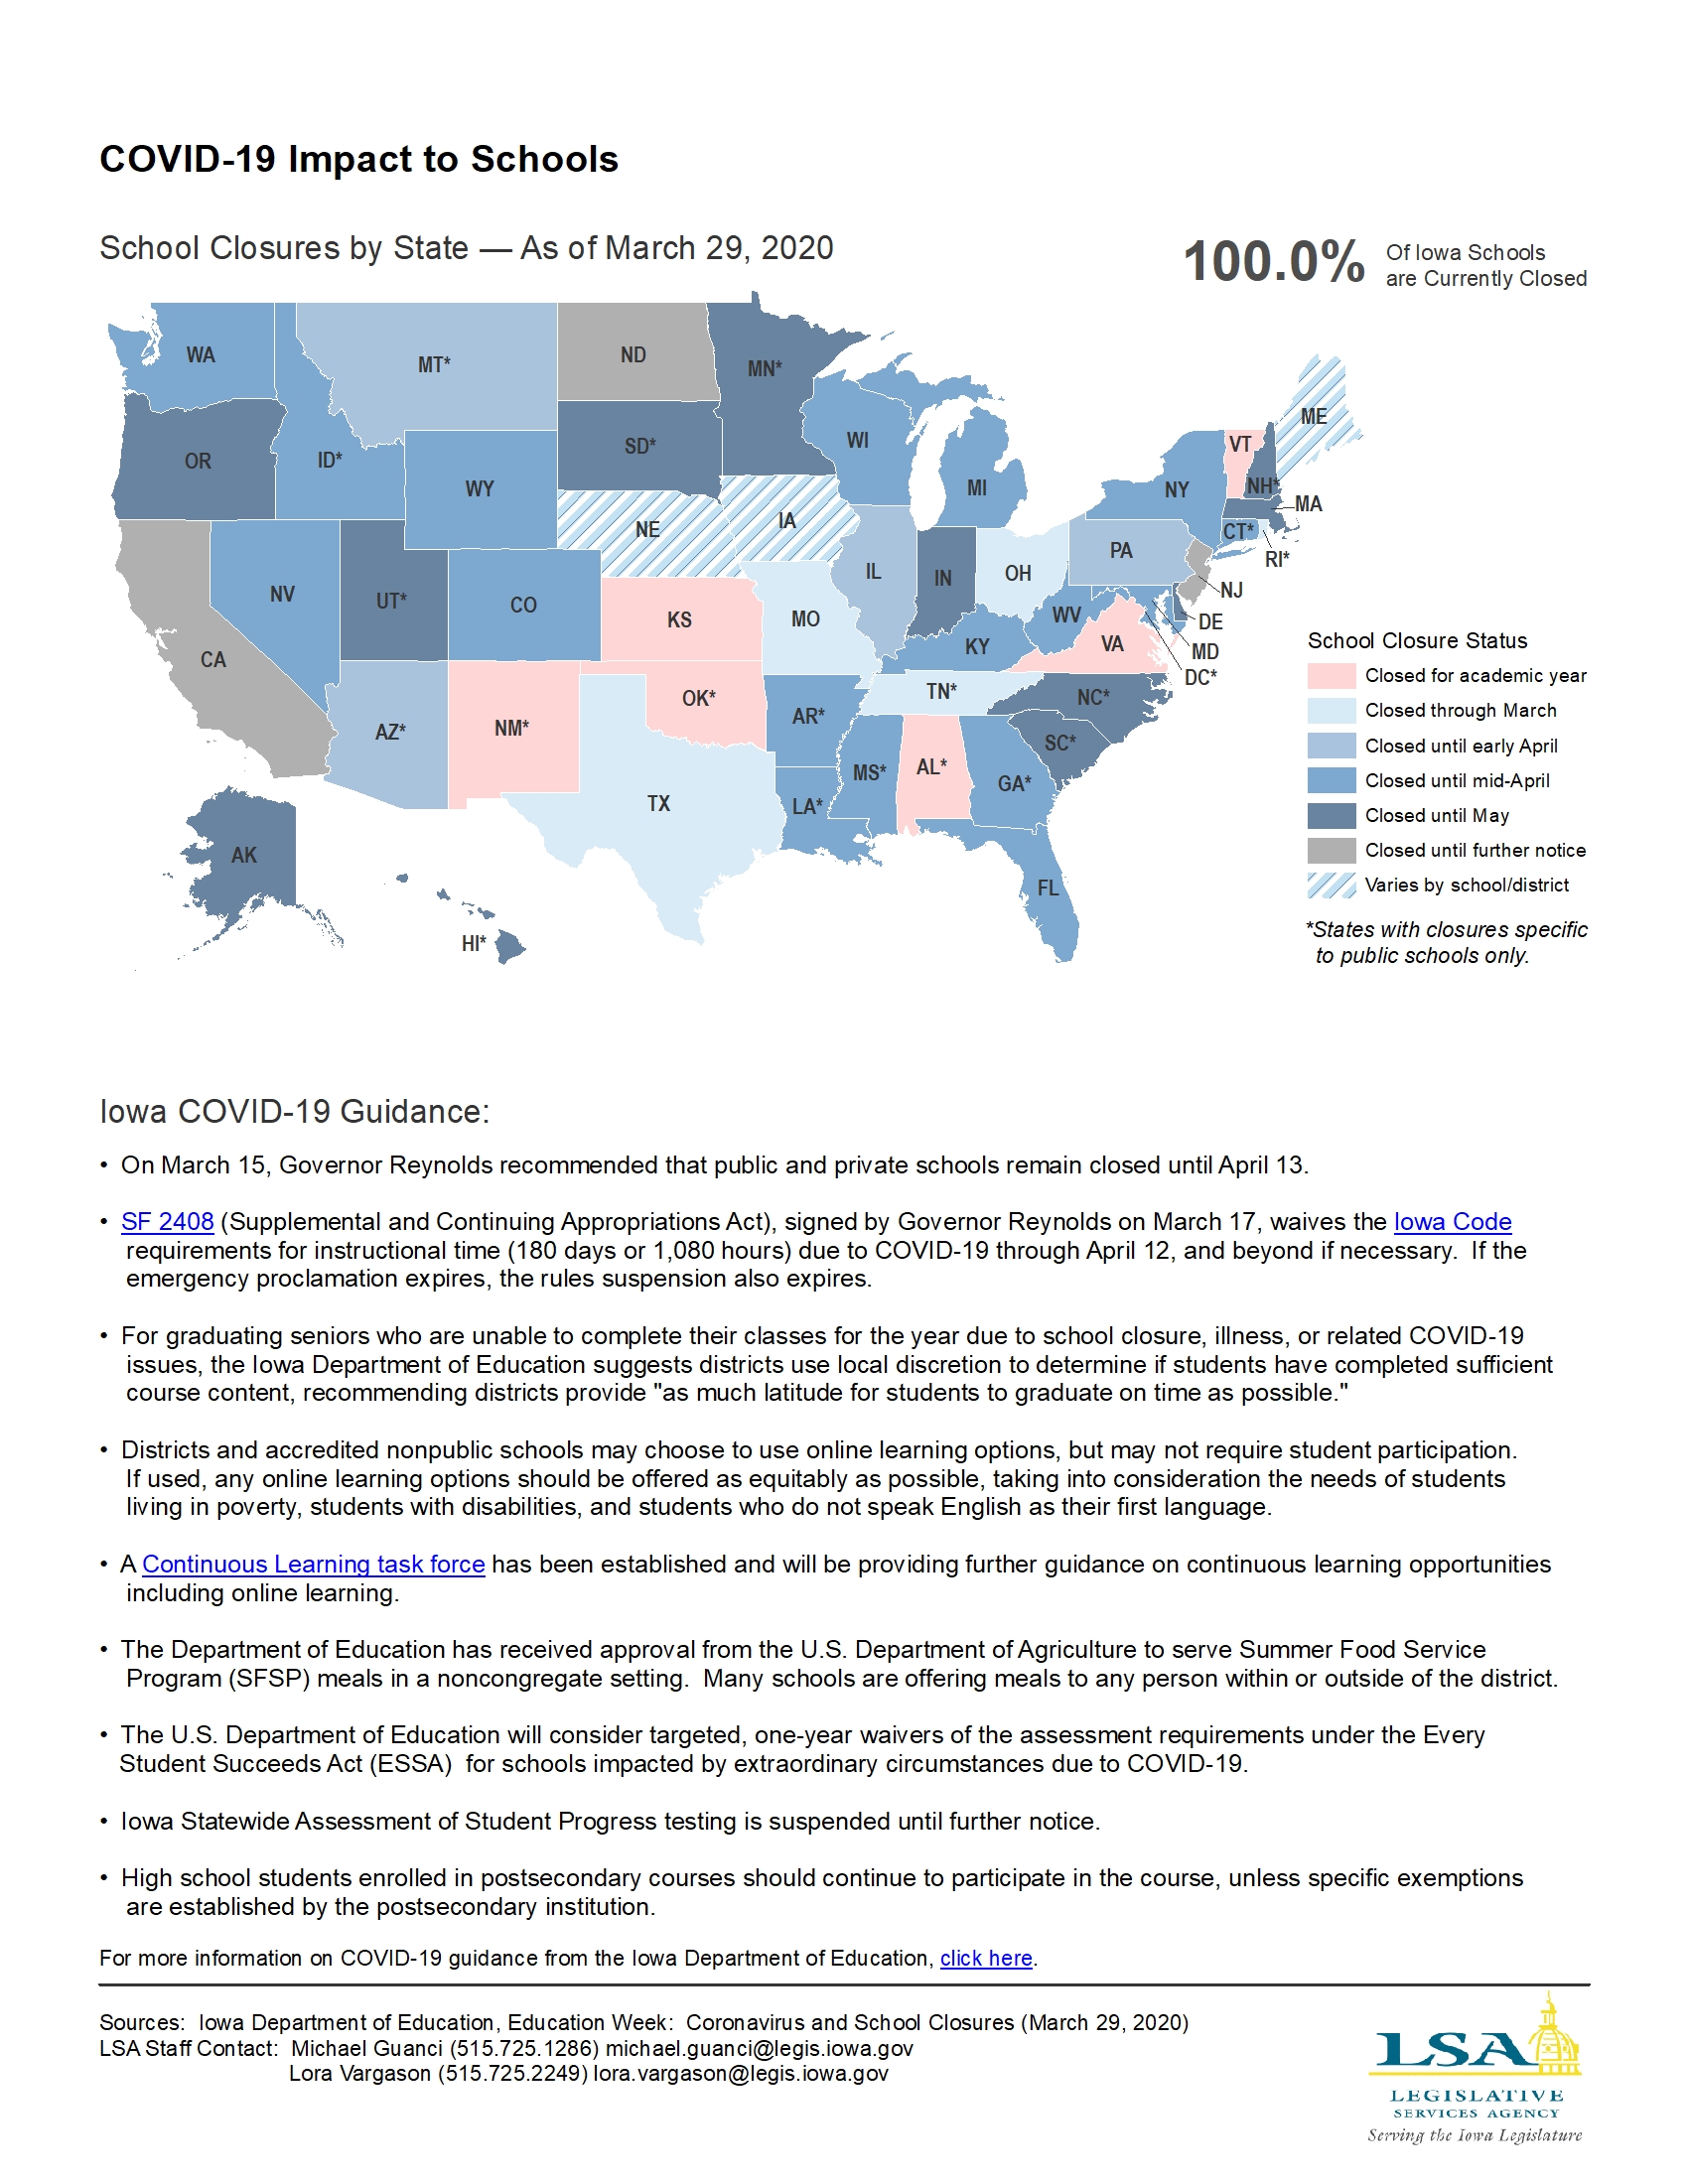
COVID-19 Impact to Schools
|
|
|
|
|
| 03/23/2020 |
Iowa Insights |
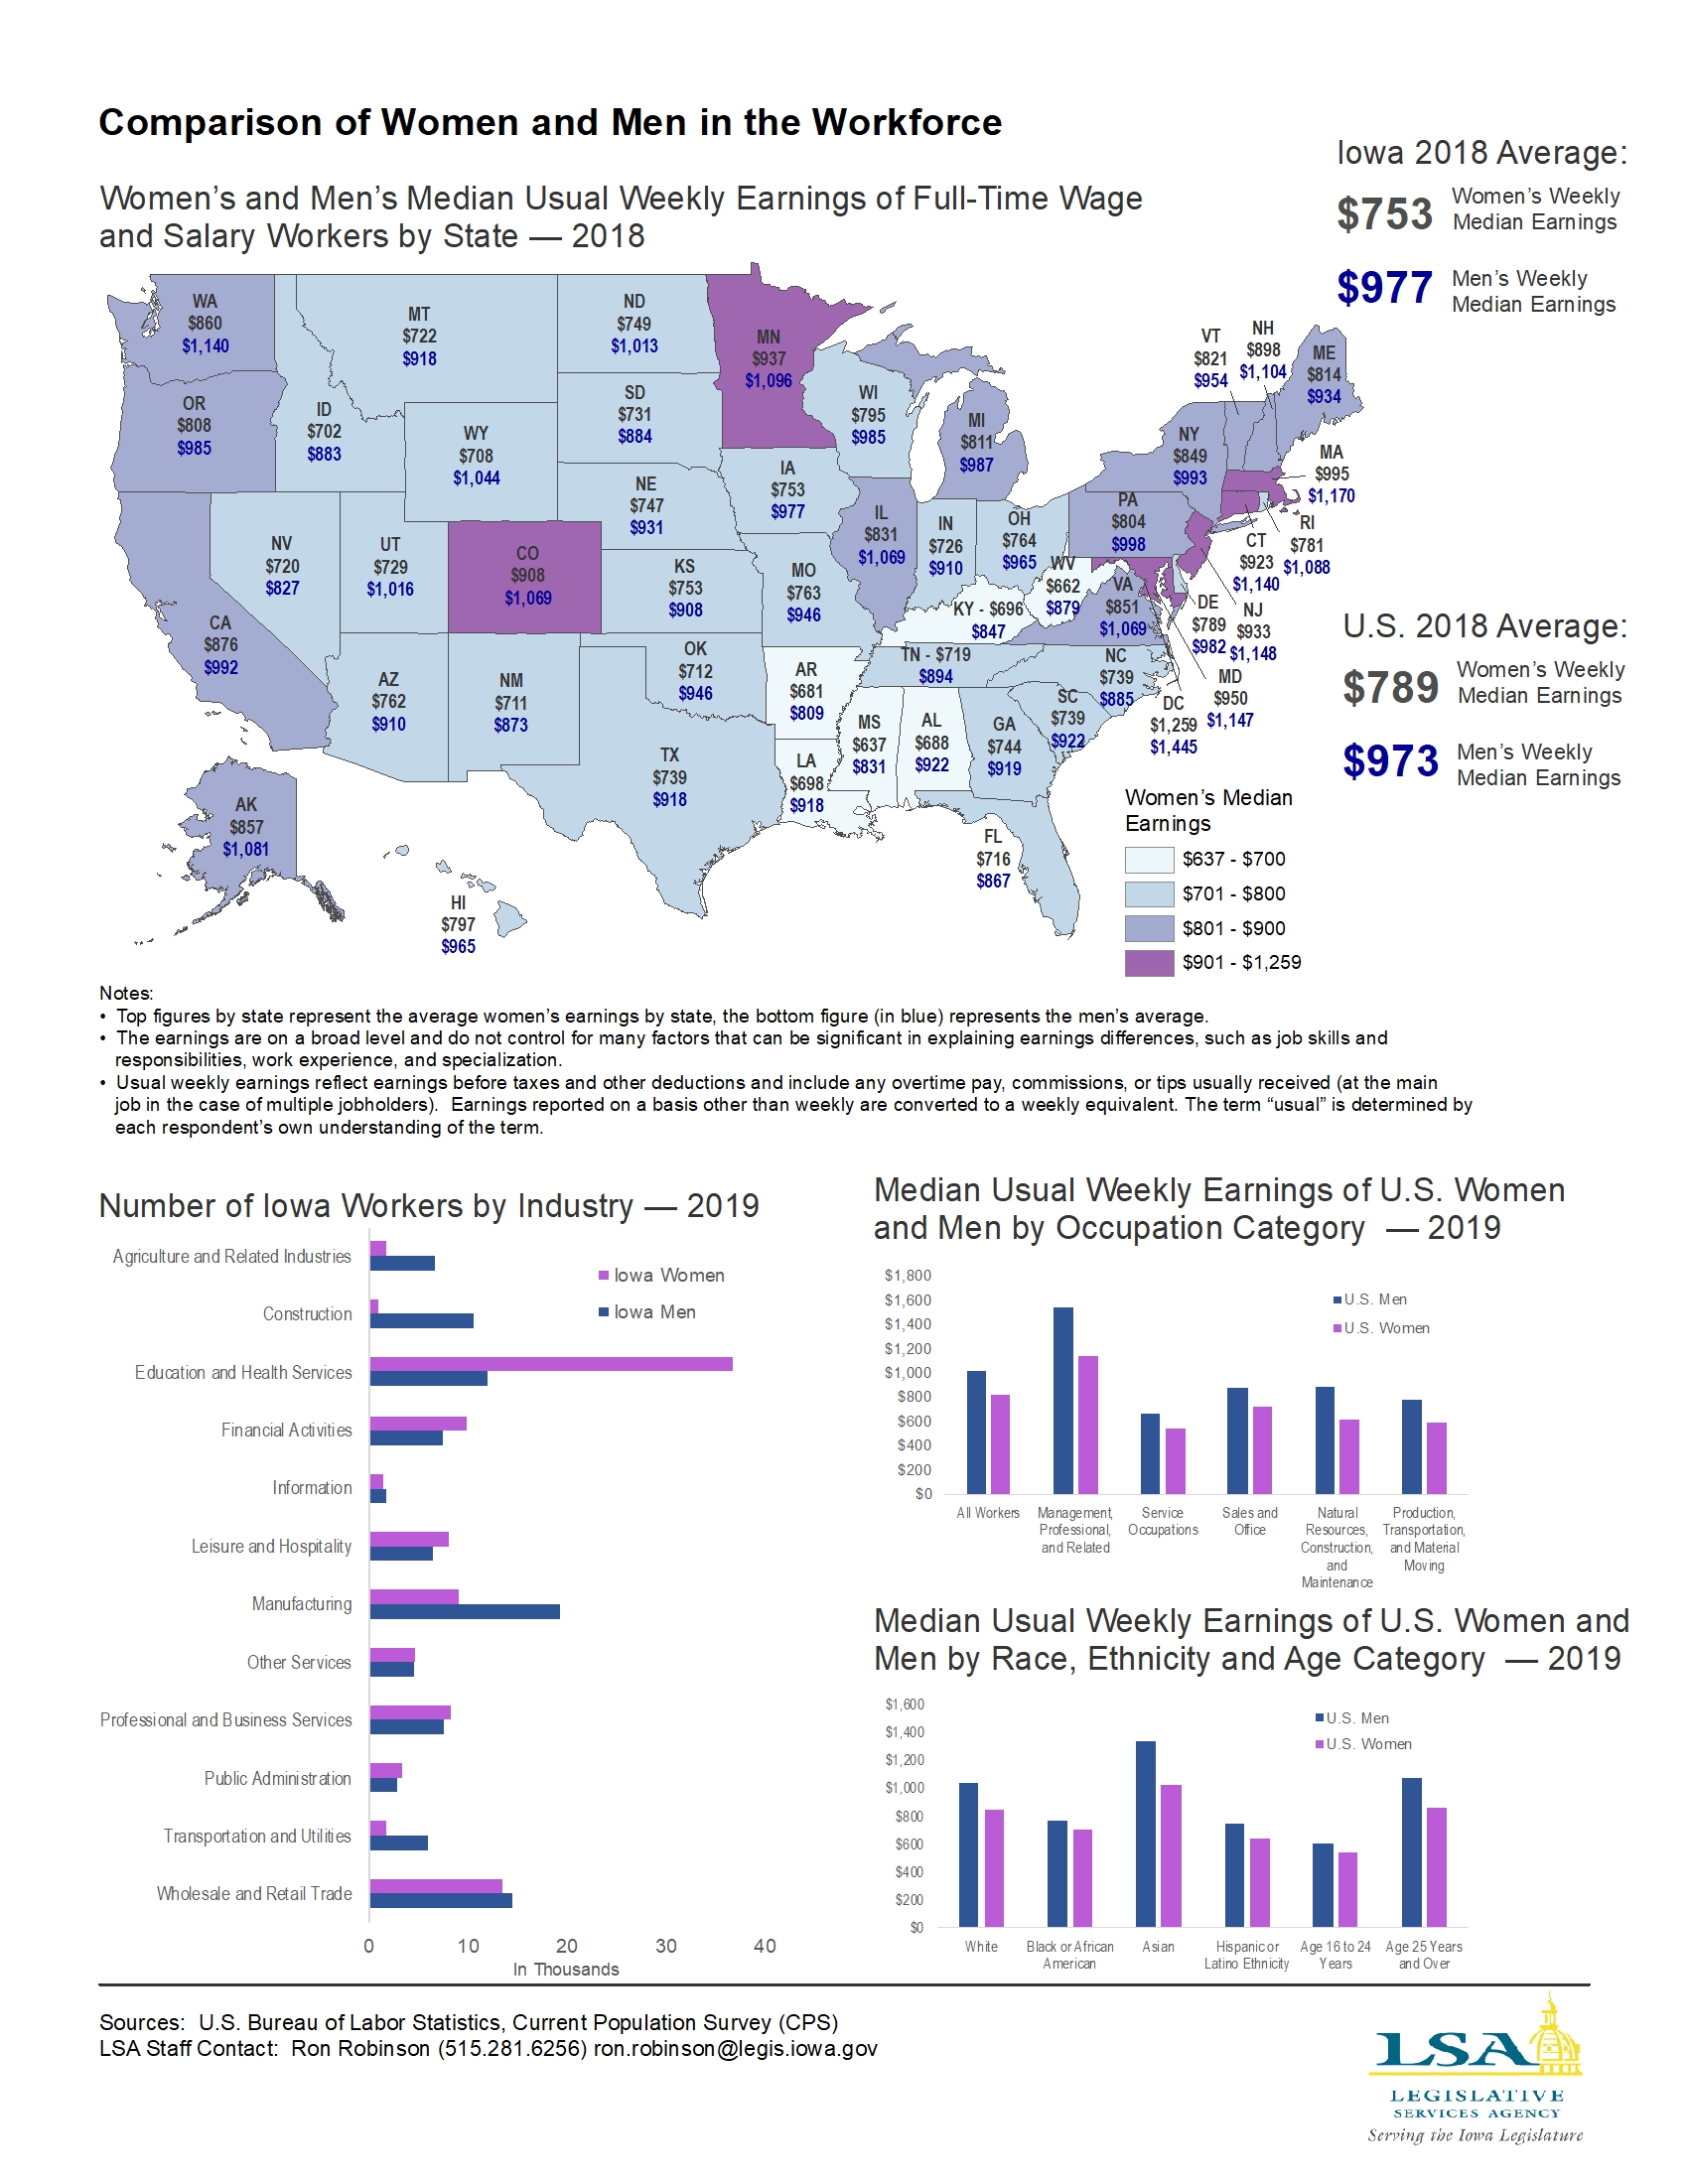
Comparison of Women and Men in the Workforce
|
|
|
|
|
| 03/16/2020 |
Iowa Insights |
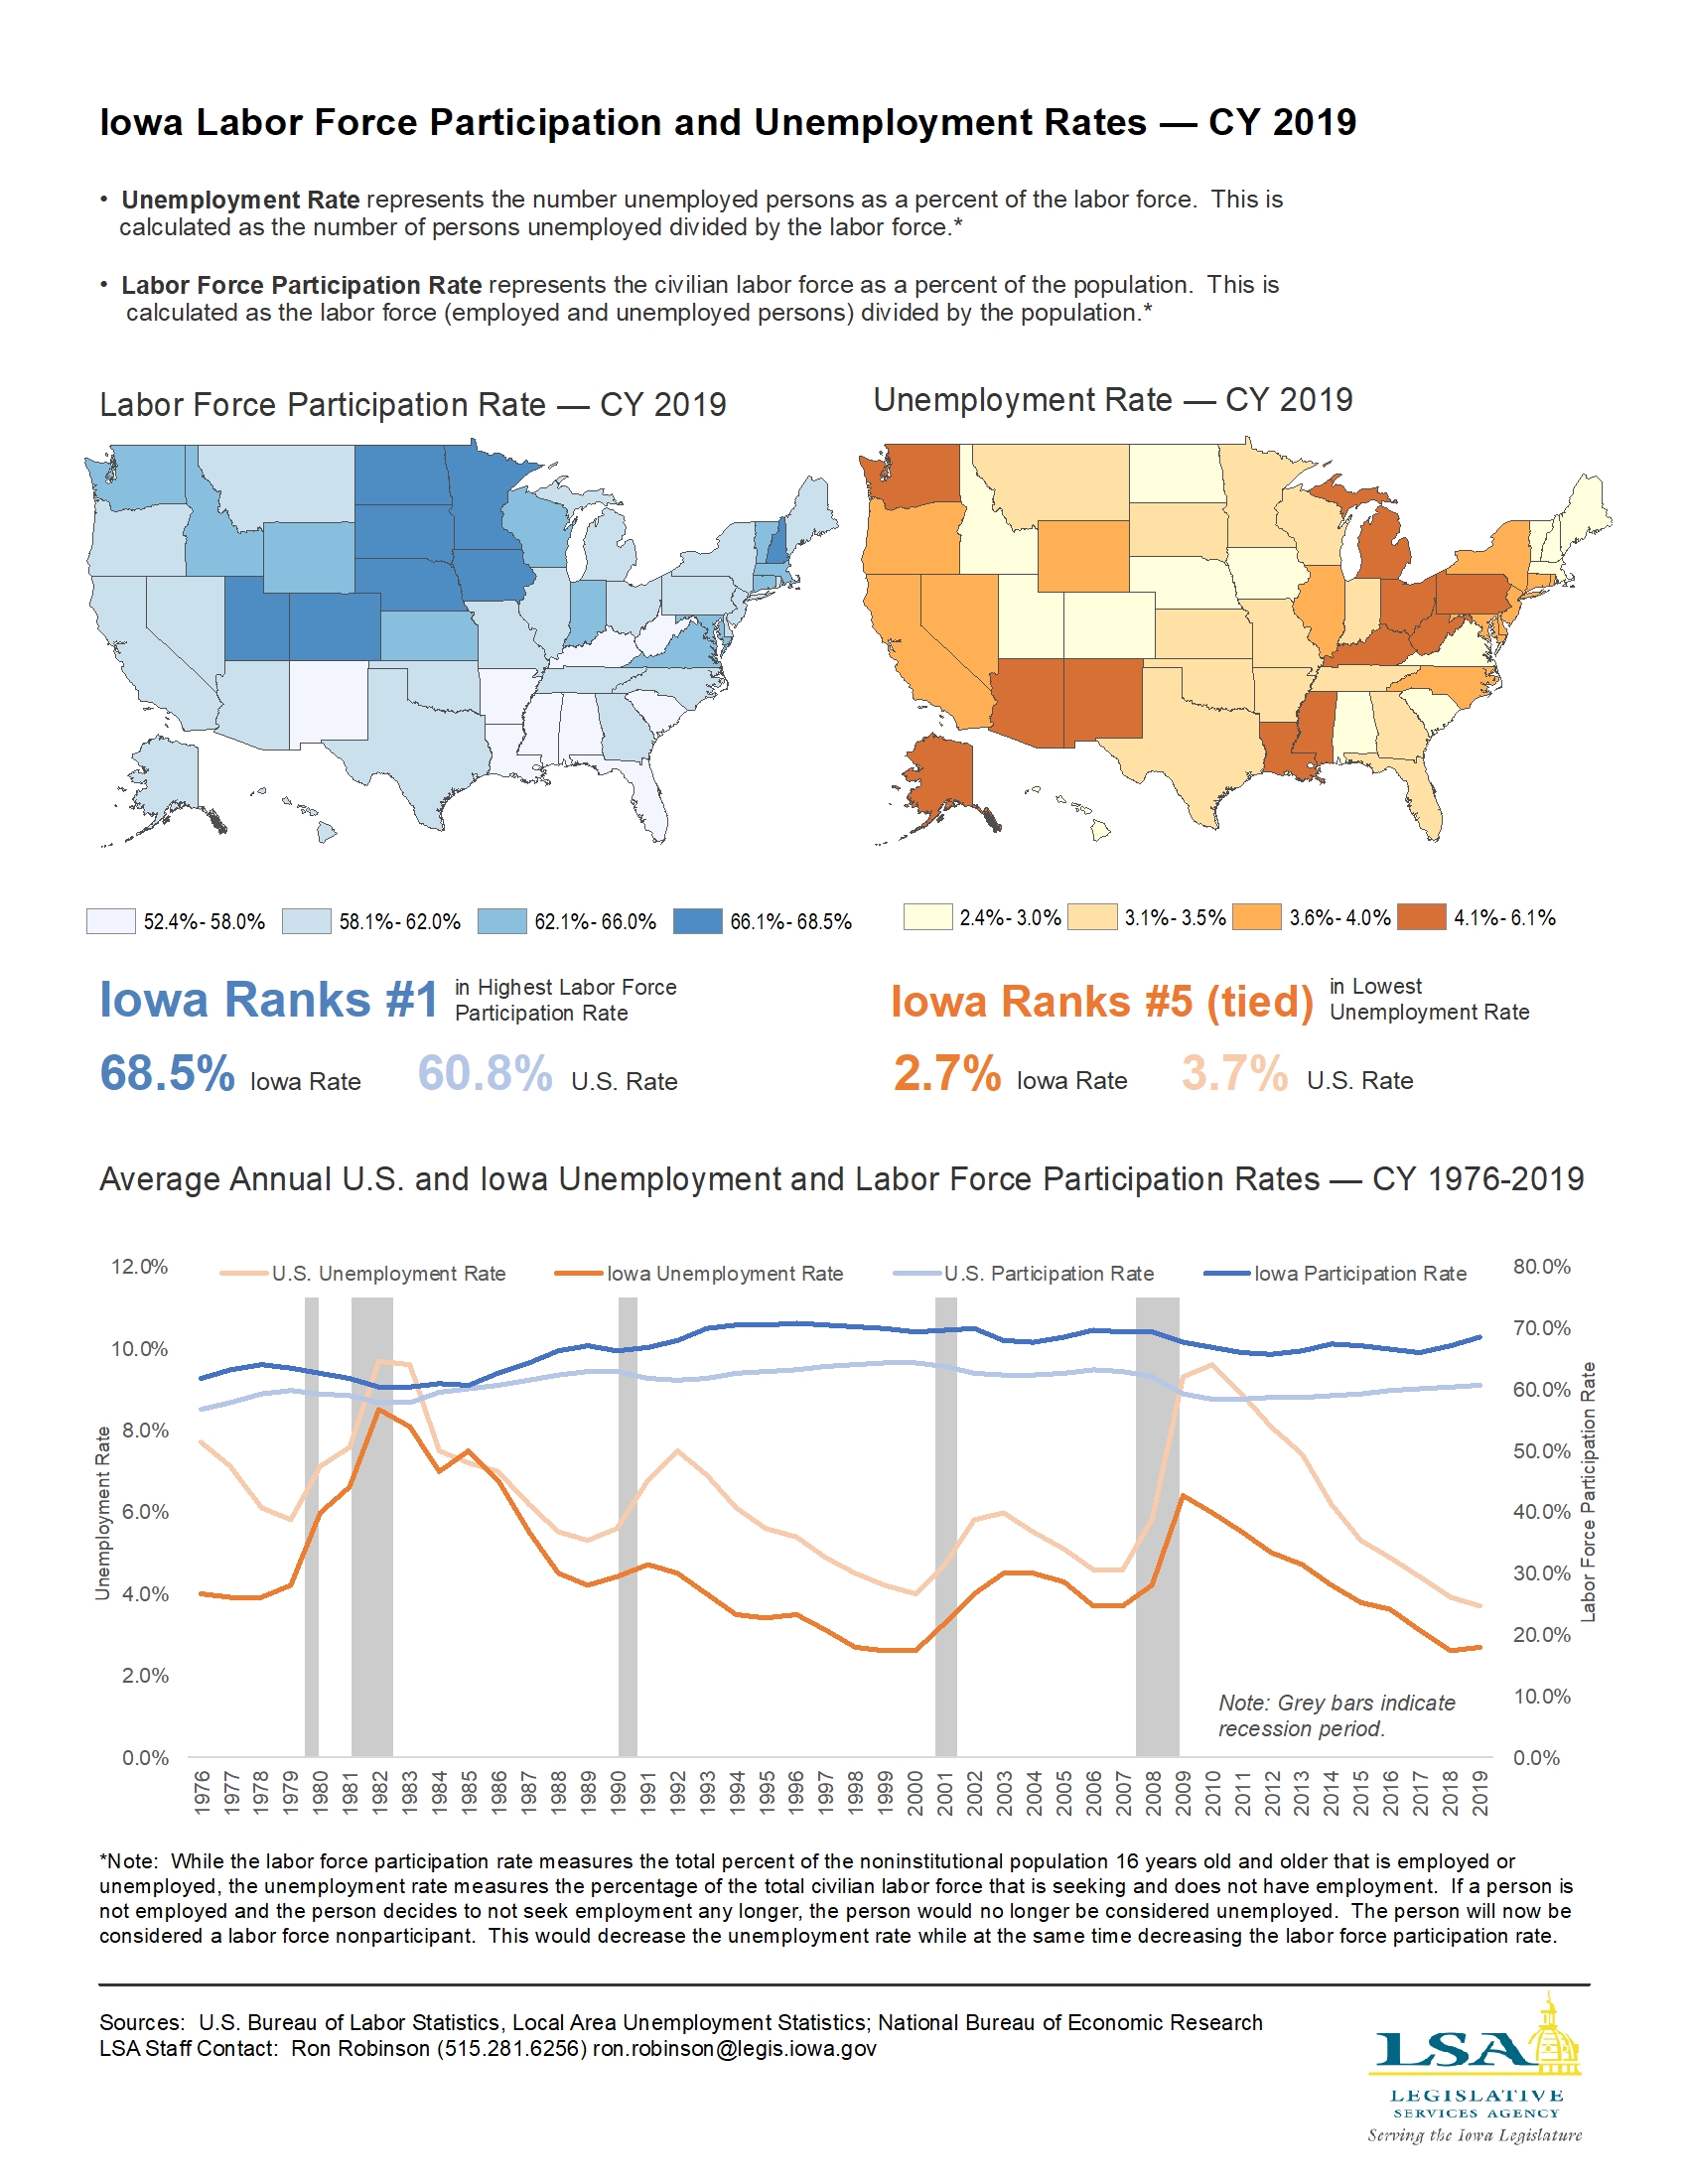
Iowa Labor Force Participation and Unemployment Rates — CY 2019
|
|
|
|
|
| 03/09/2020 |
Iowa Insights |
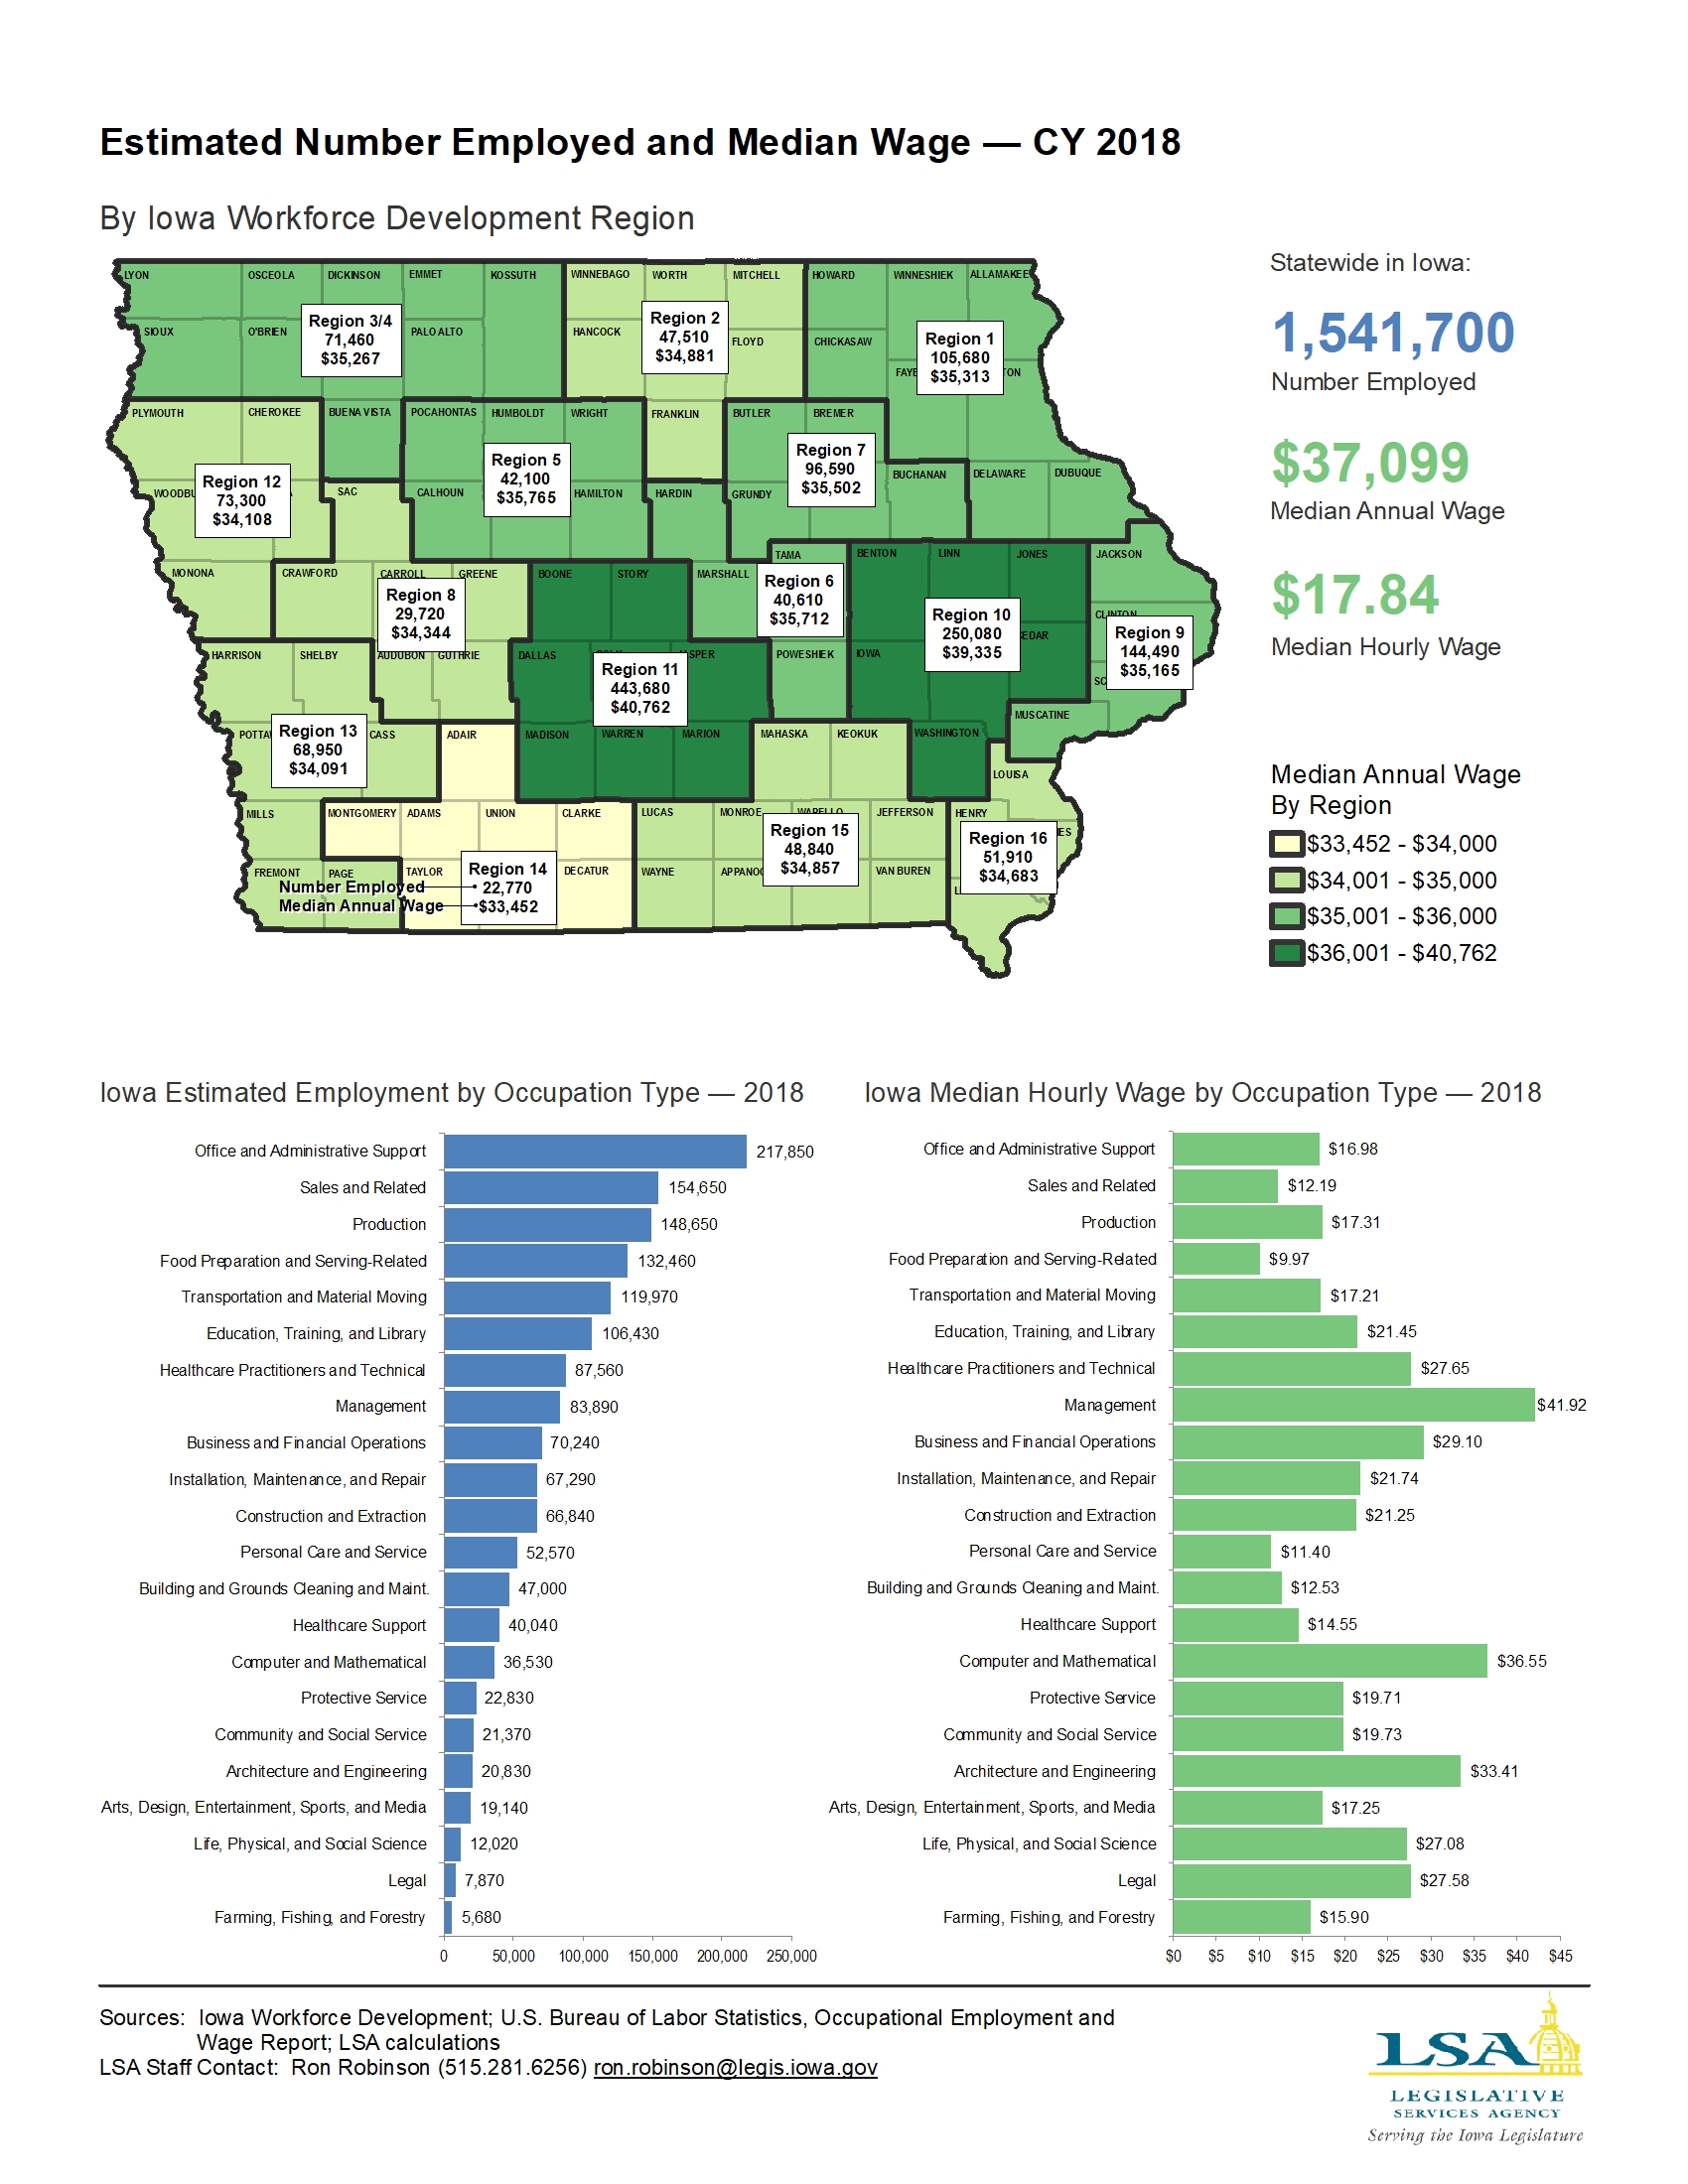
Employment and Median Wage by Iowa Workforce Development Region — CY 2018
|
|
|
|
|
| 03/02/2020 |
Iowa Insights |
Congressional Apportionment

|
|
|
|
|
| 02/24/2020 |
Iowa Insights |
2020 Census Overview

|
|
|
|
|
| 02/17/2020 |
Iowa Insights |
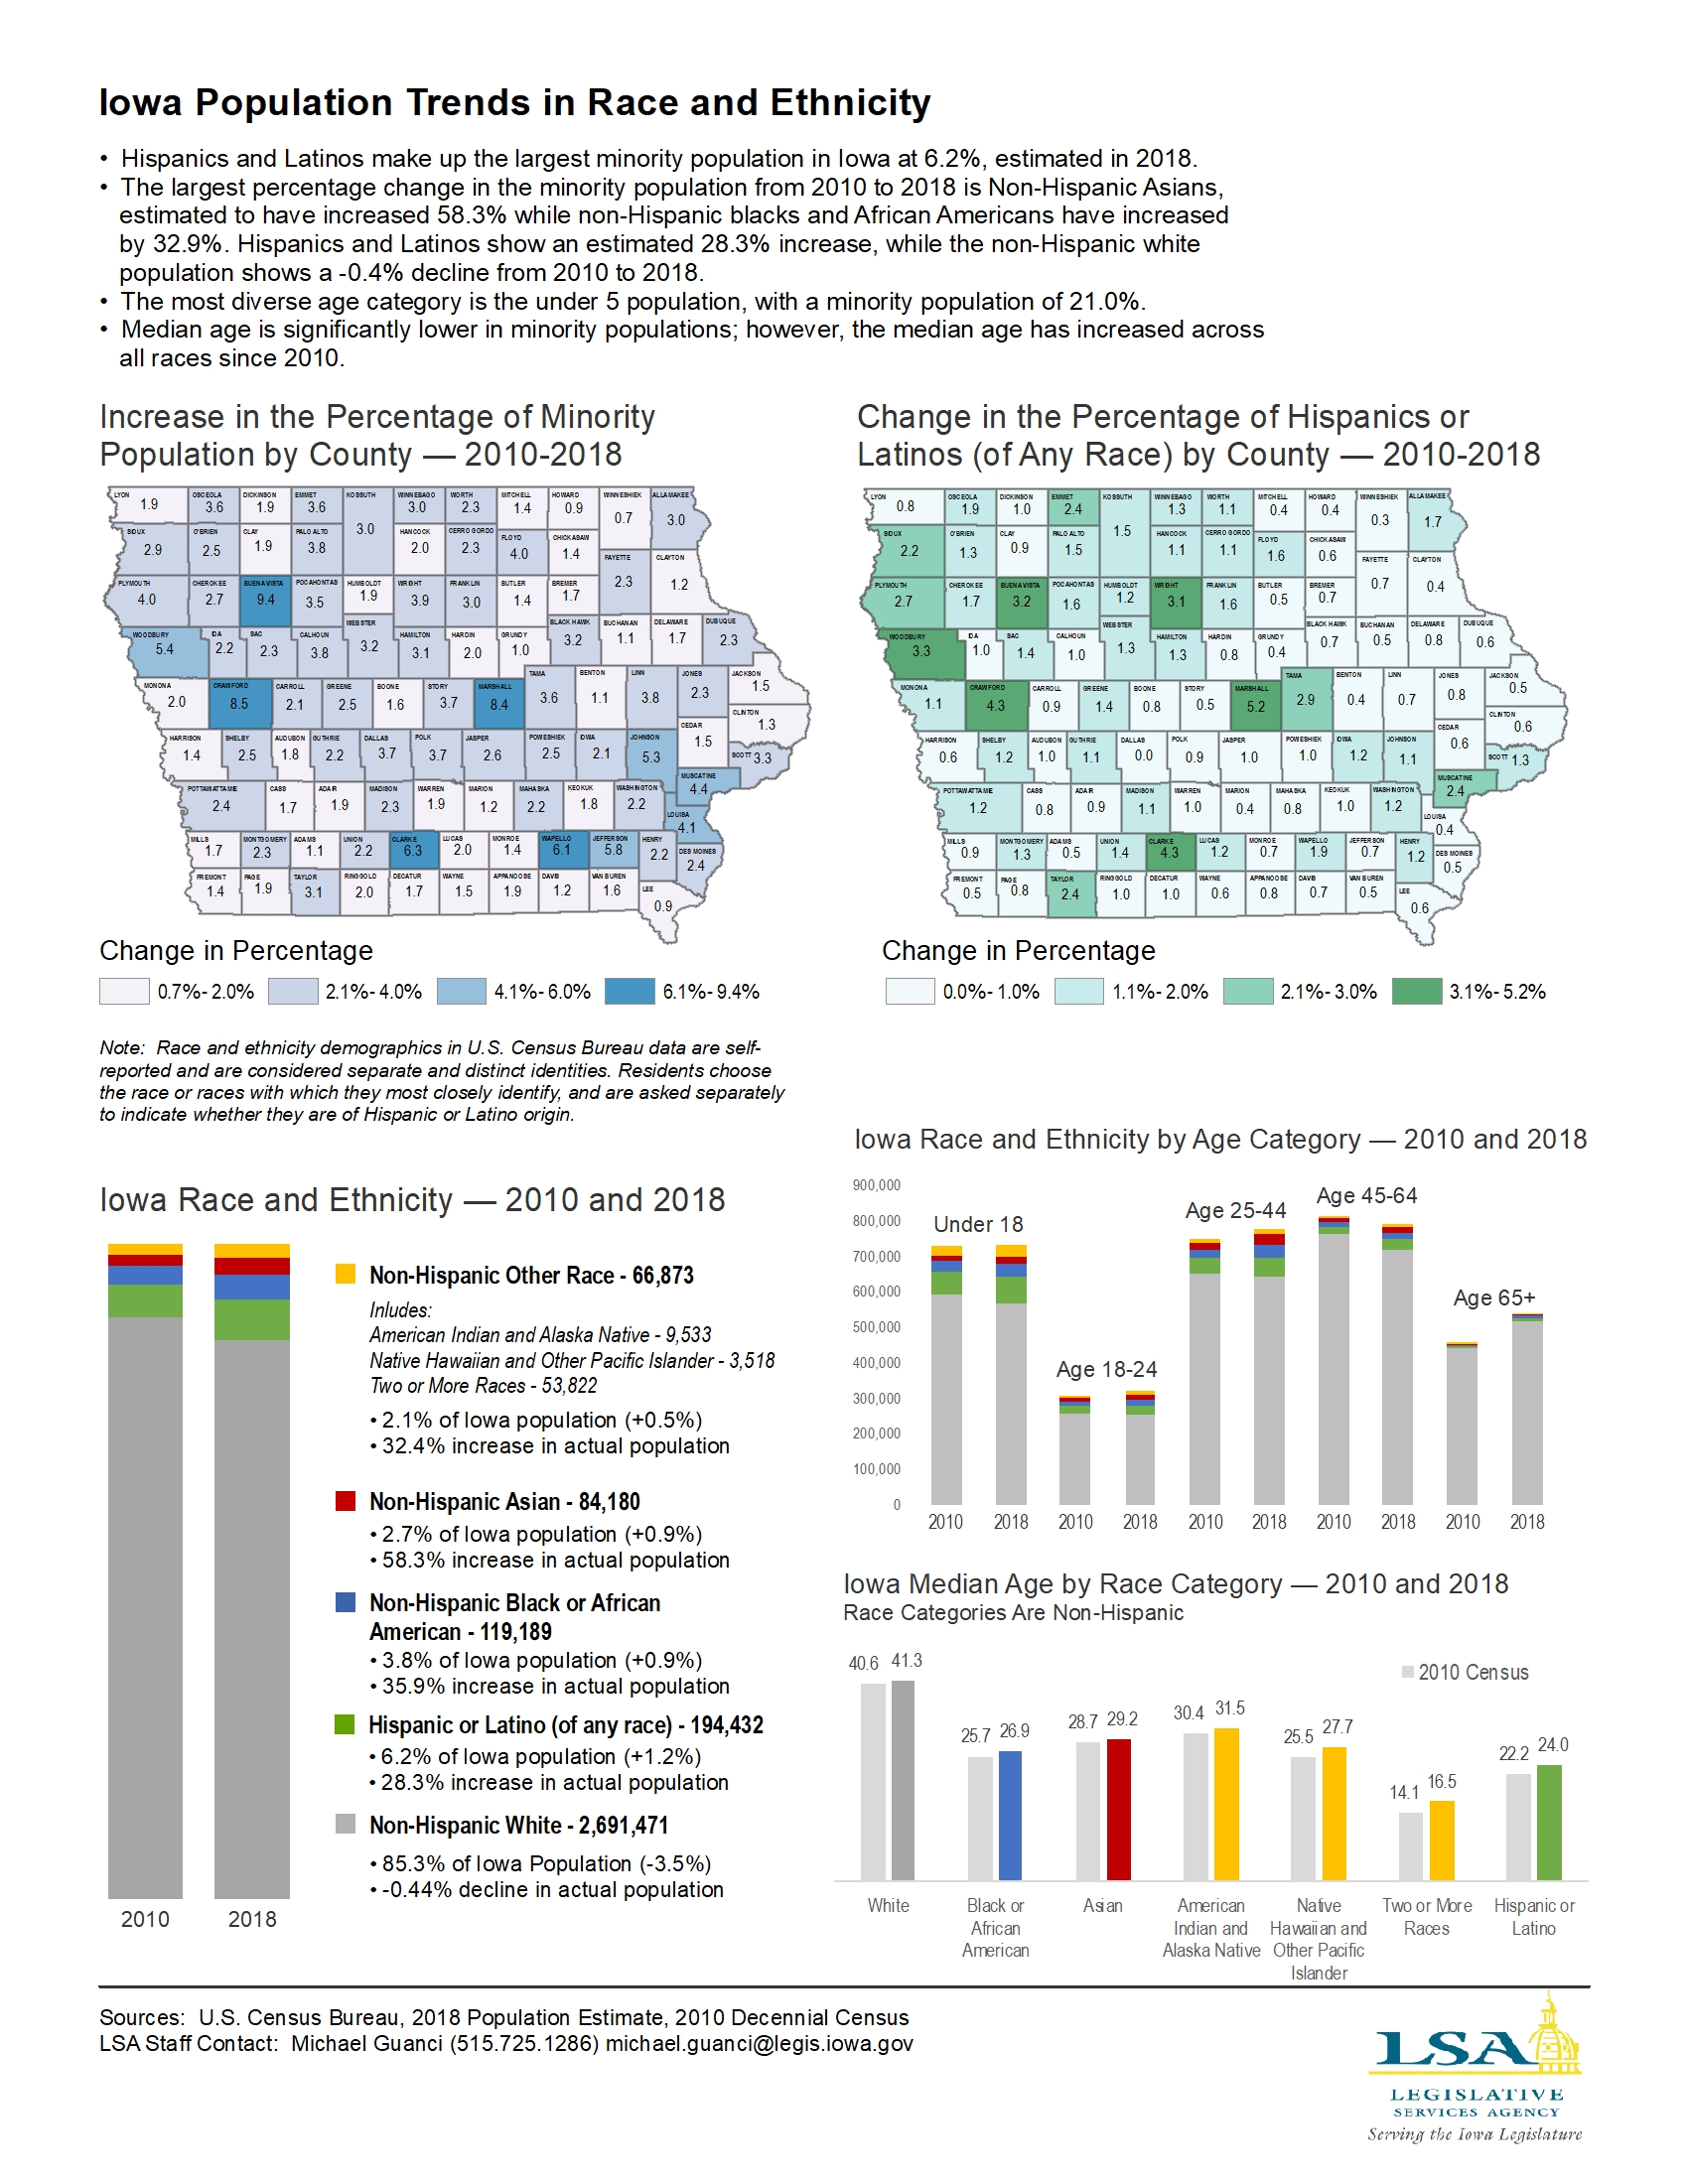
Iowa Population Trends in Race and Ethnicity
|
|
|
|
|
| 02/10/2020 |
Iowa Insights |
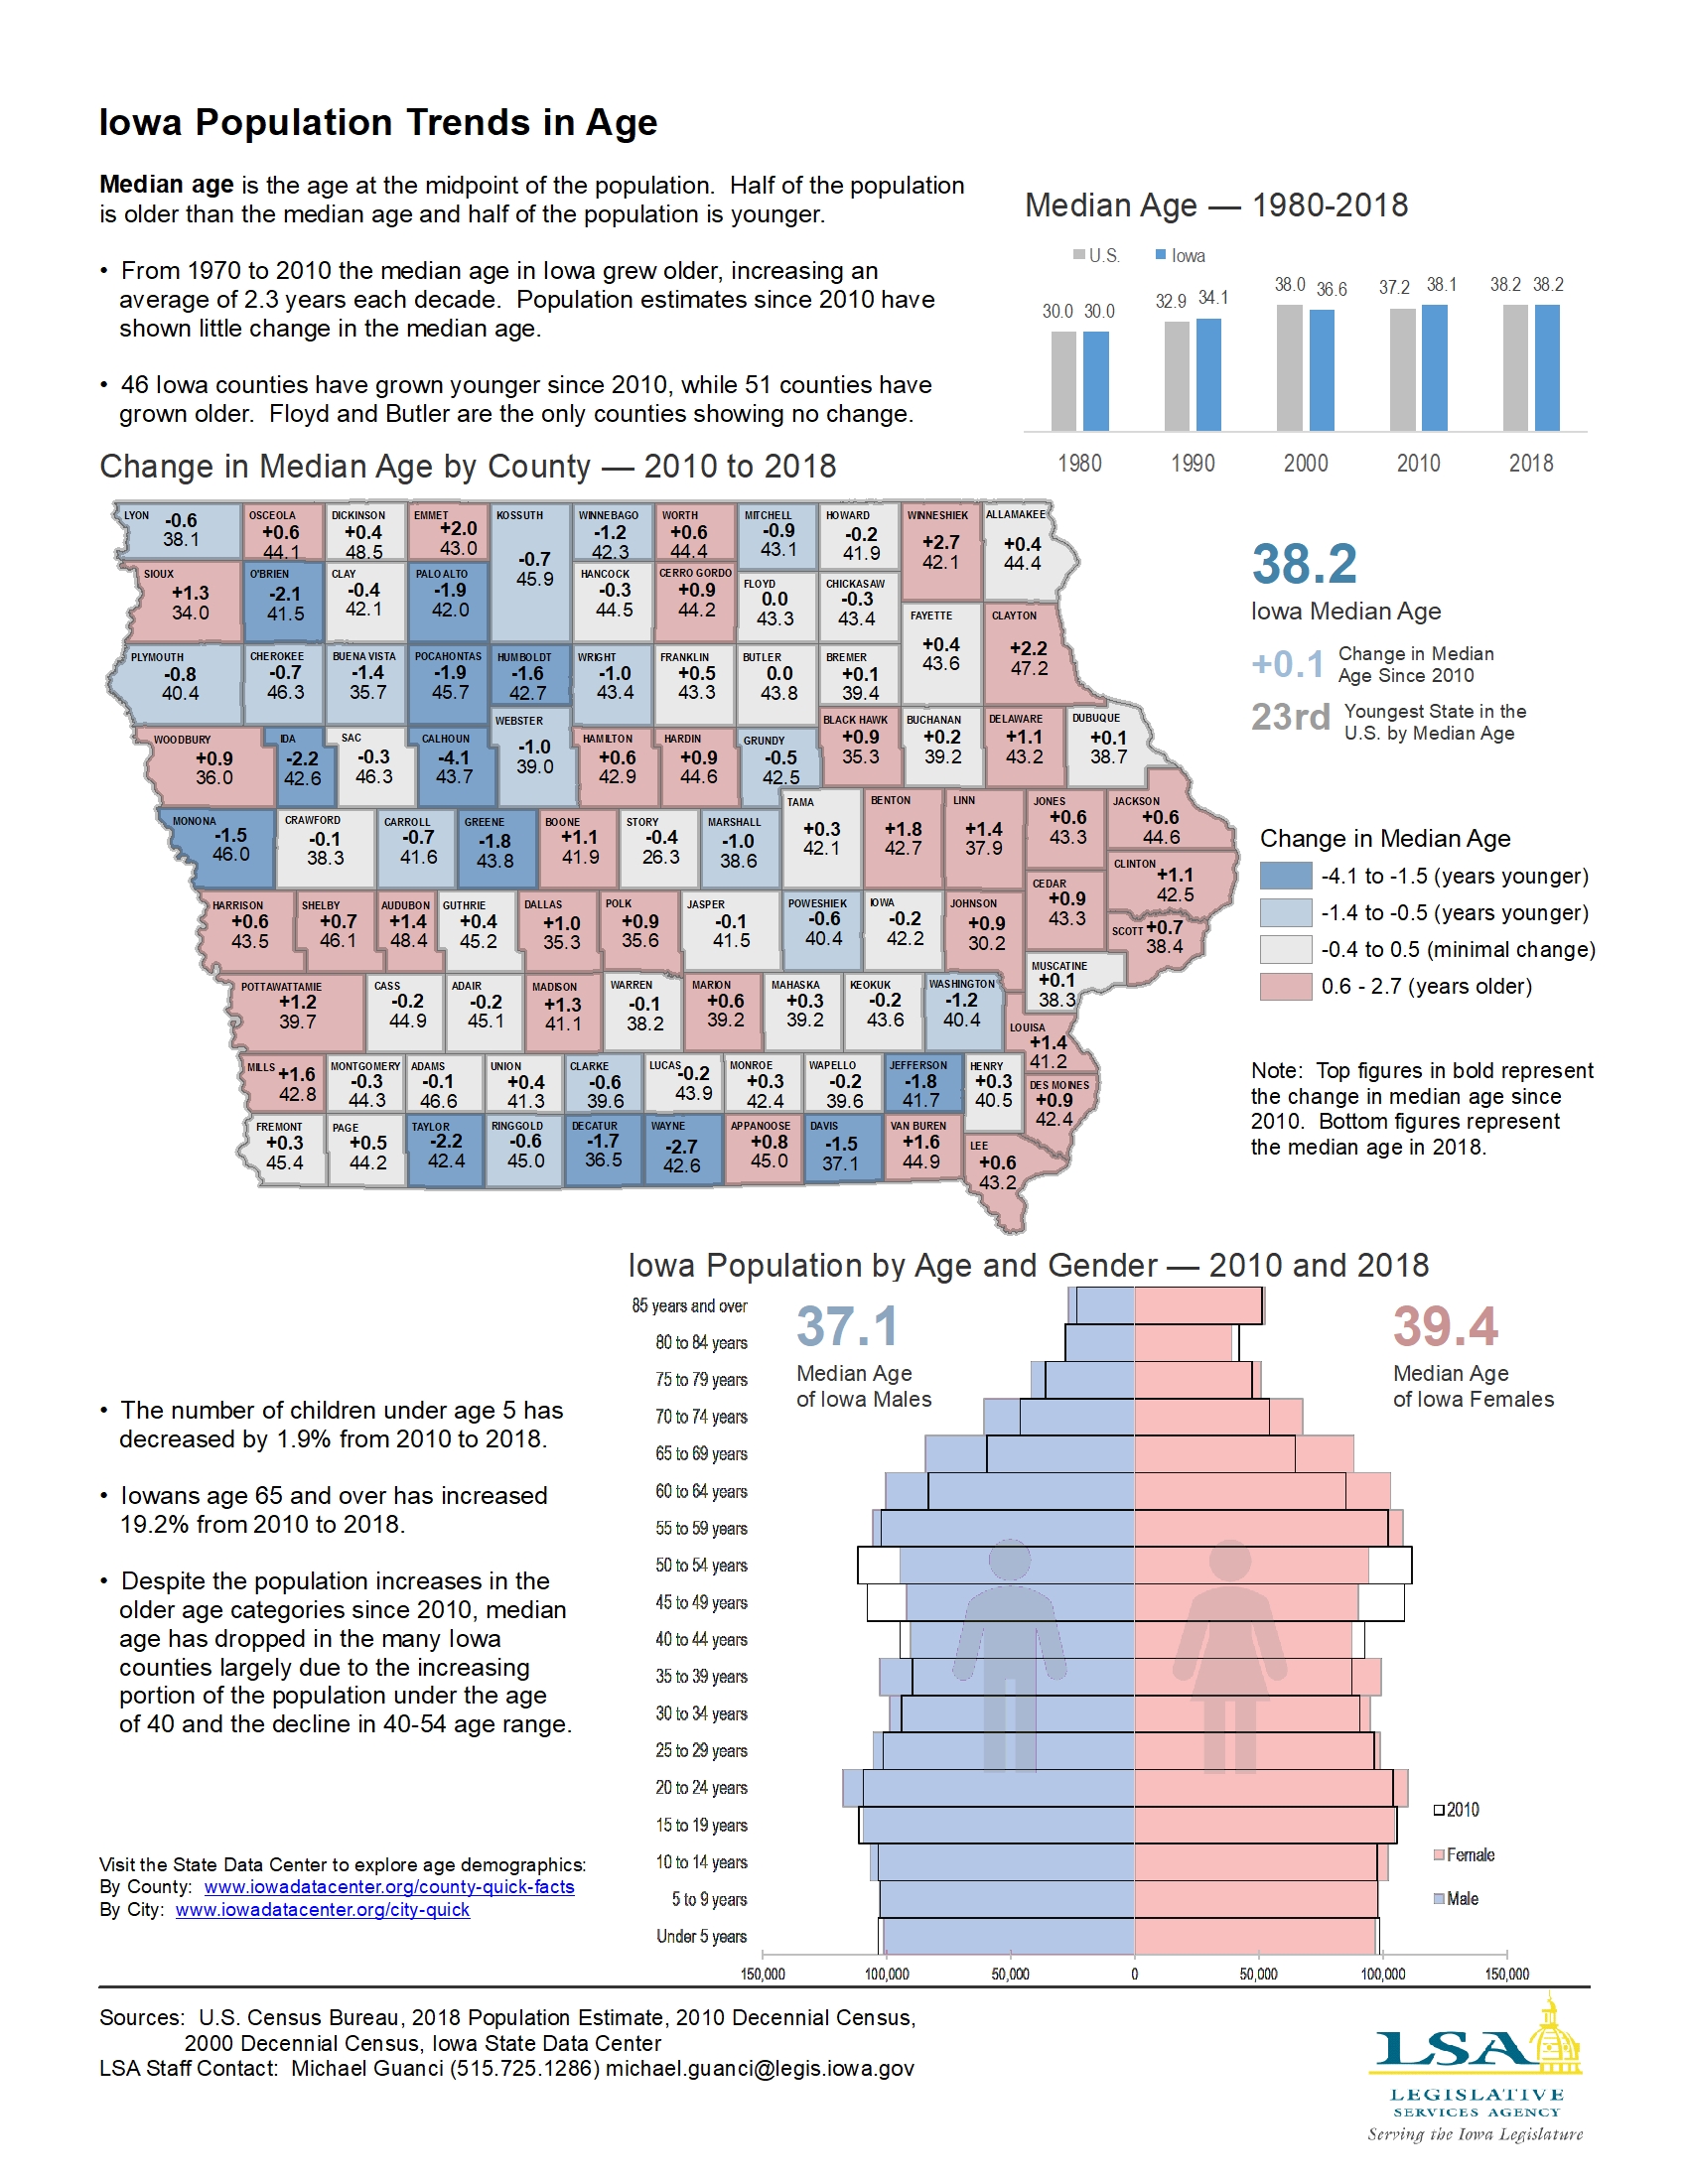
Iowa Population Trends in Age
|
|
|
|
|
| 02/03/2020 |
Iowa Insights |
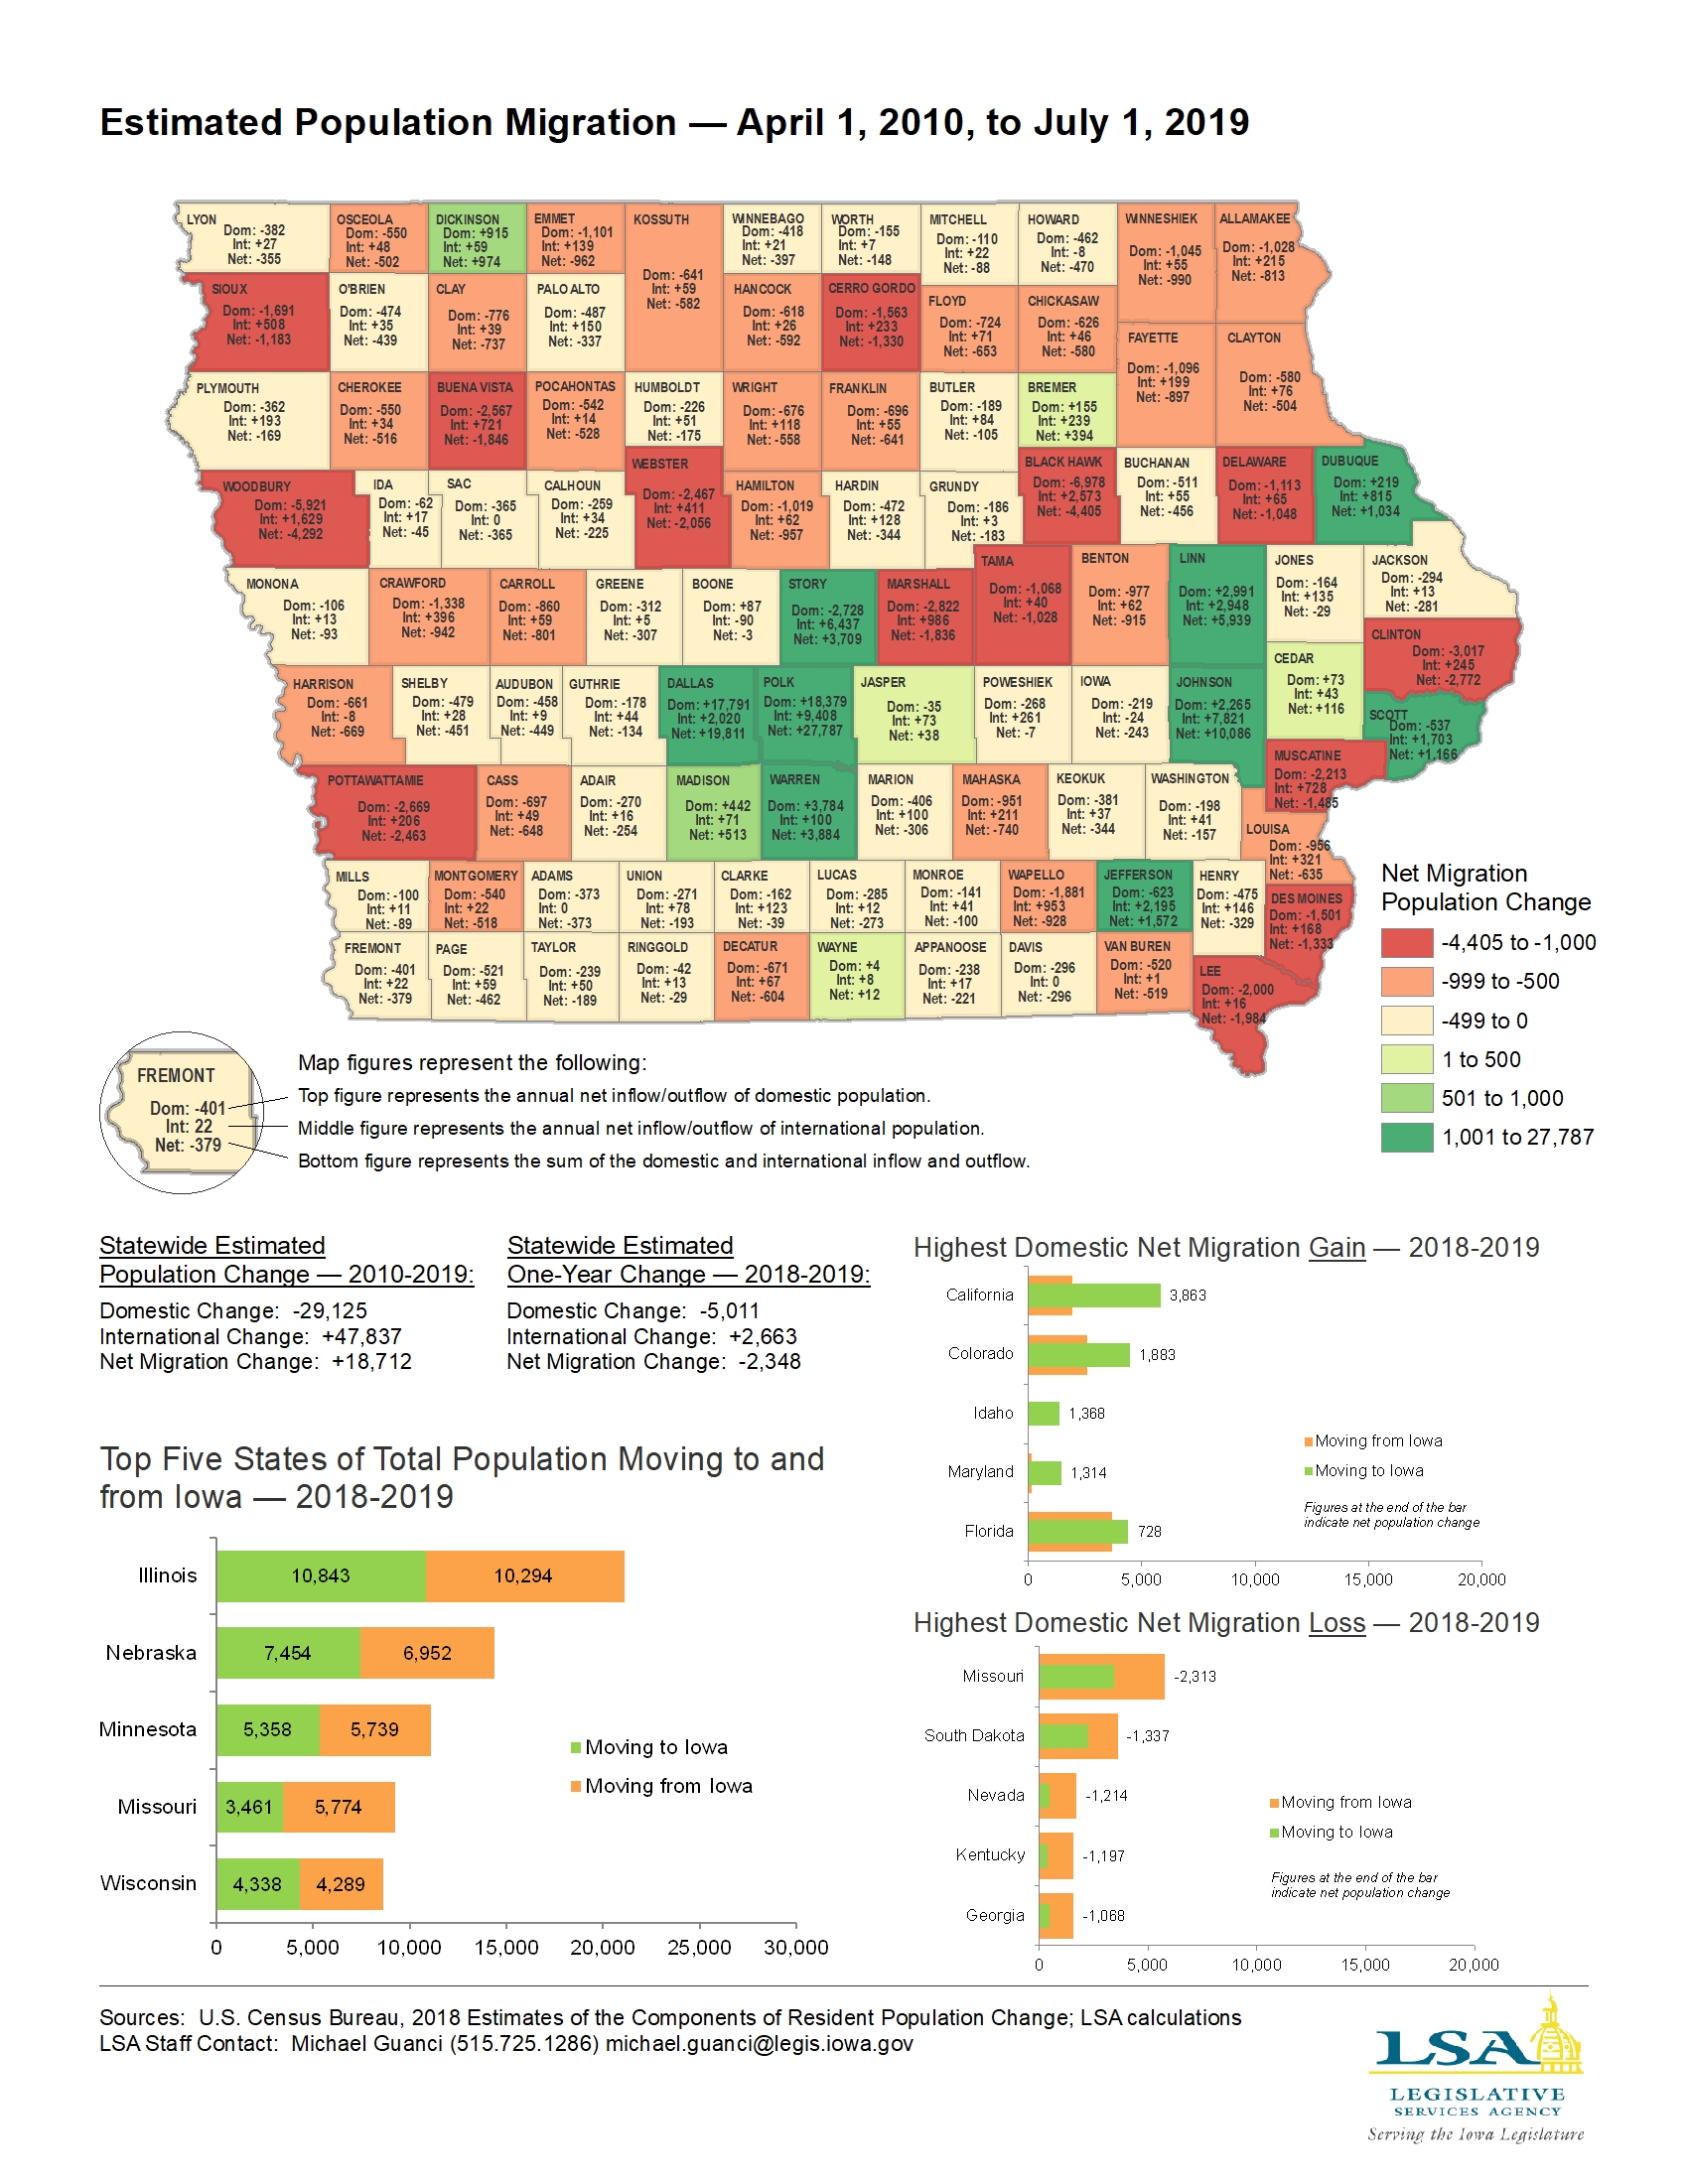
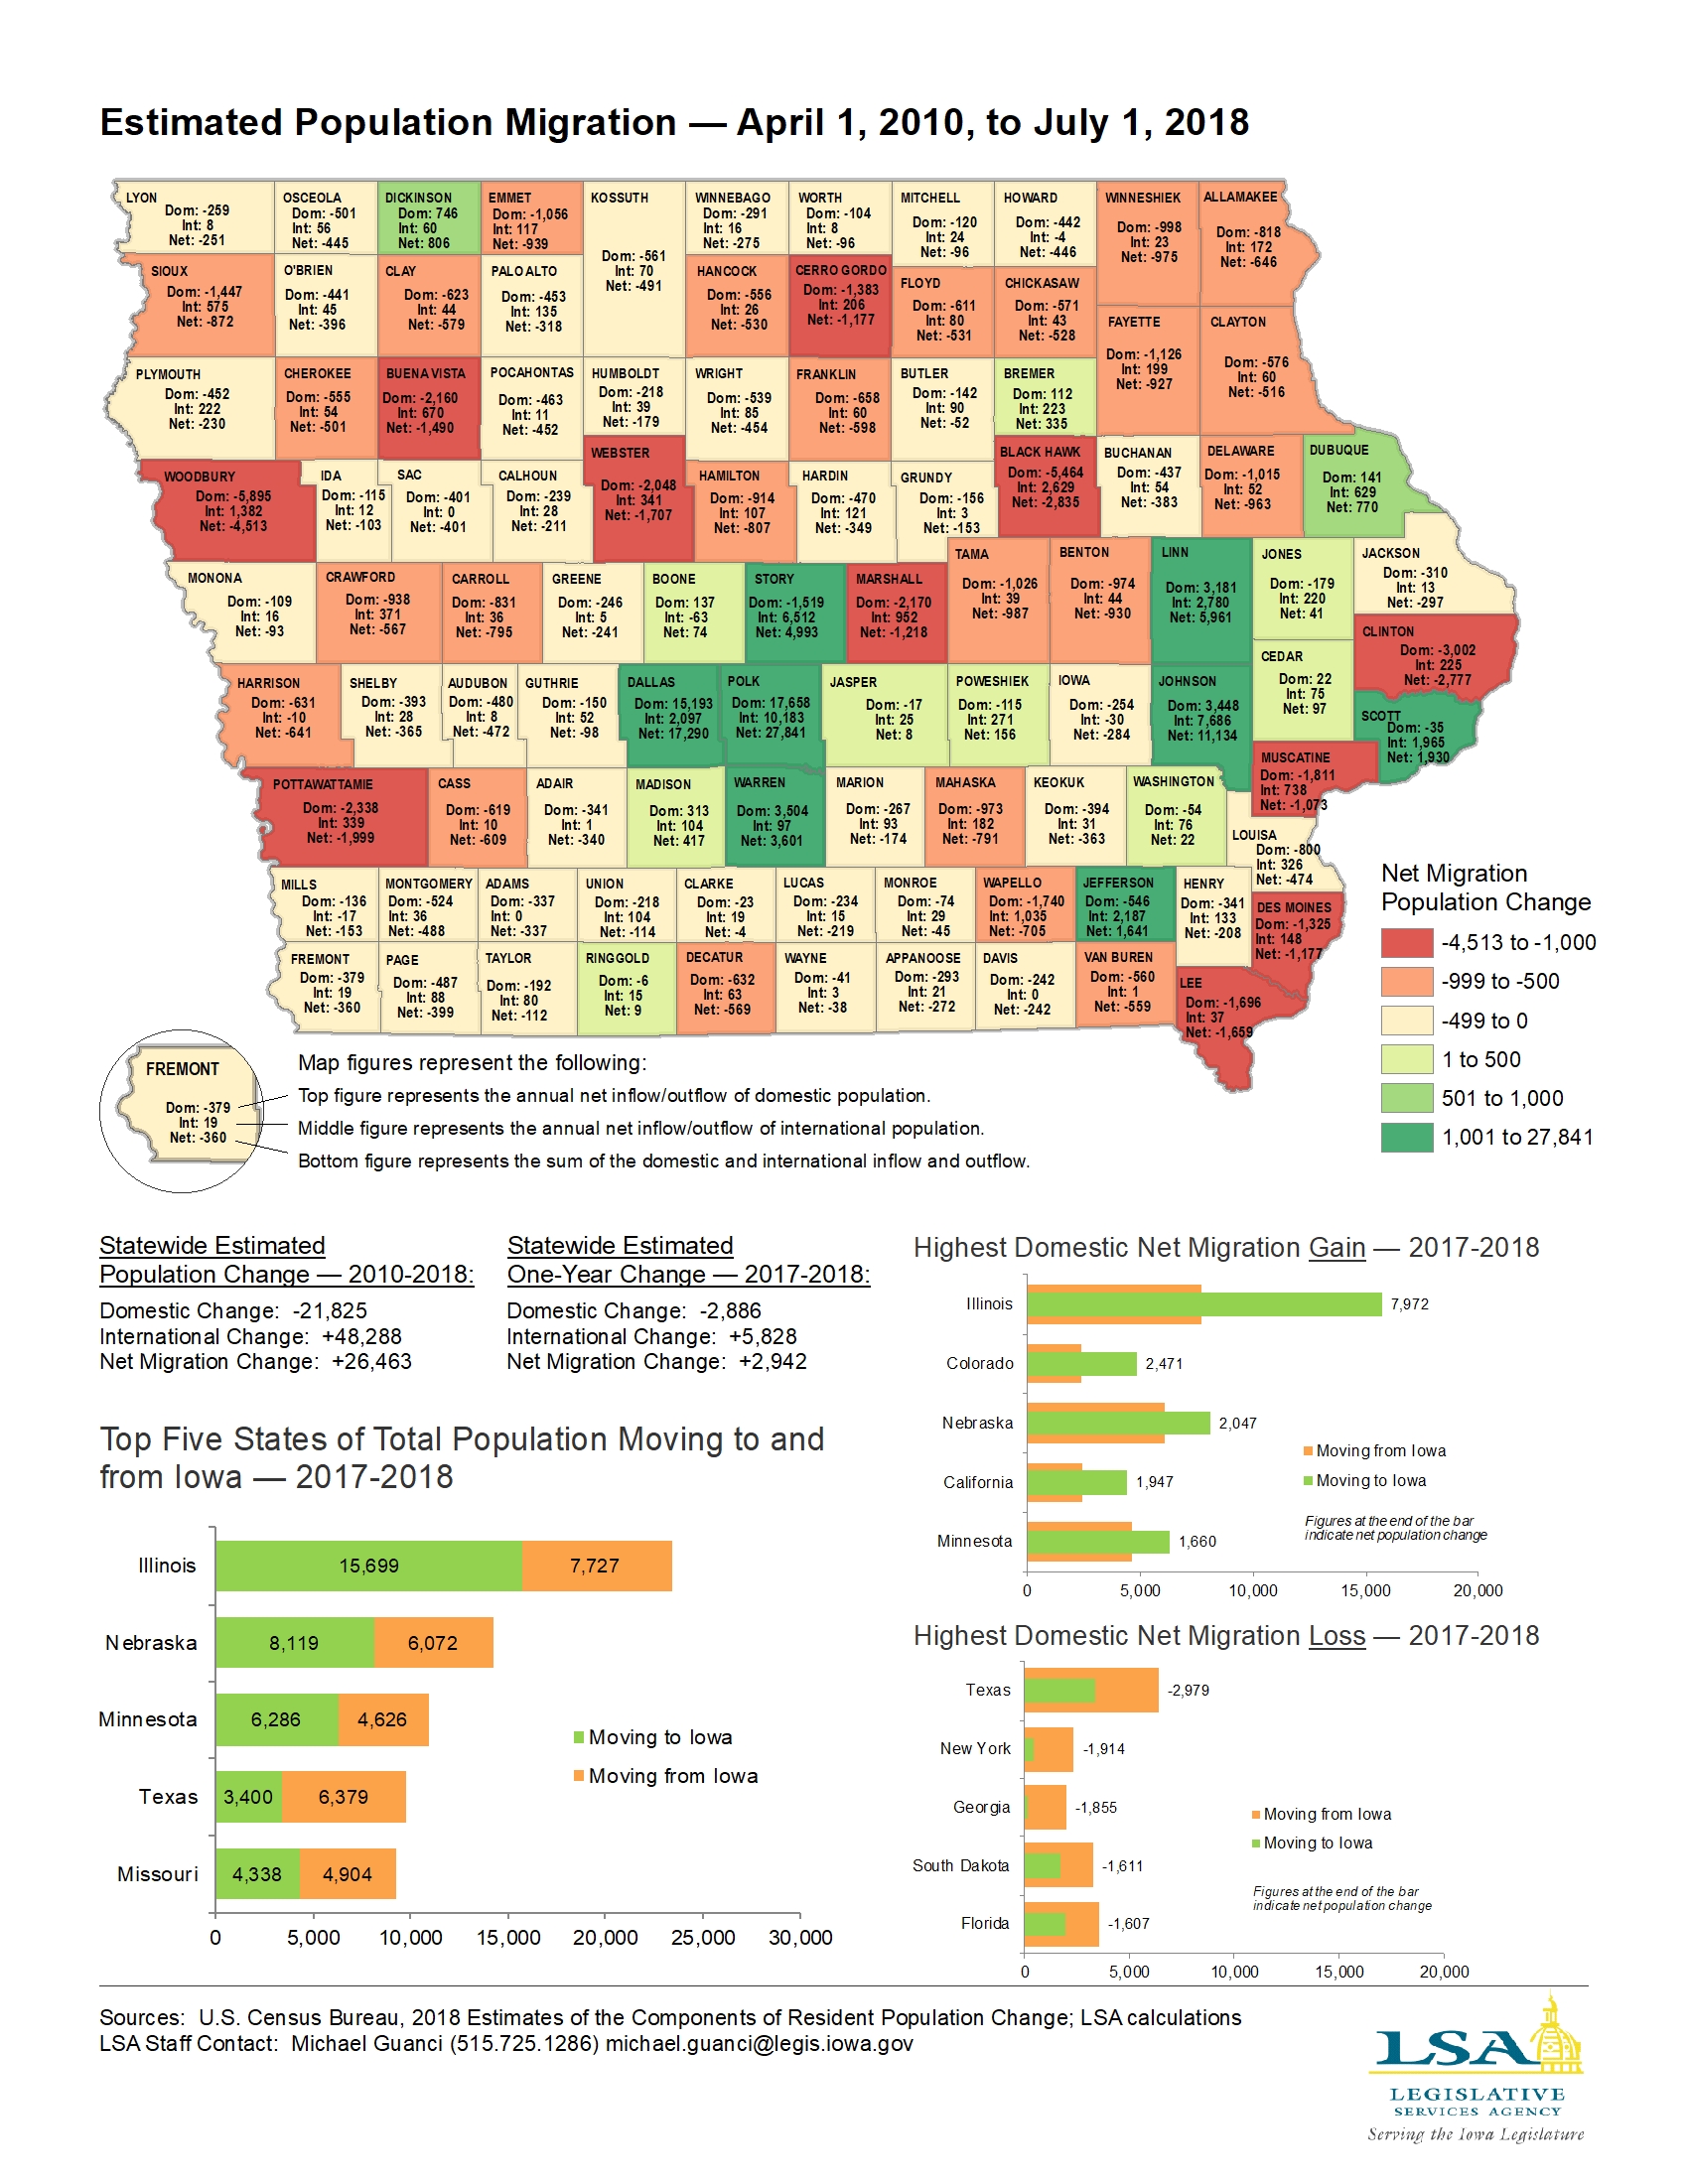
Estimated Population Migration — April 1, 2010, to July 1, 2018
|
|
|
|
|
| 01/27/2020 |
Iowa Insights |
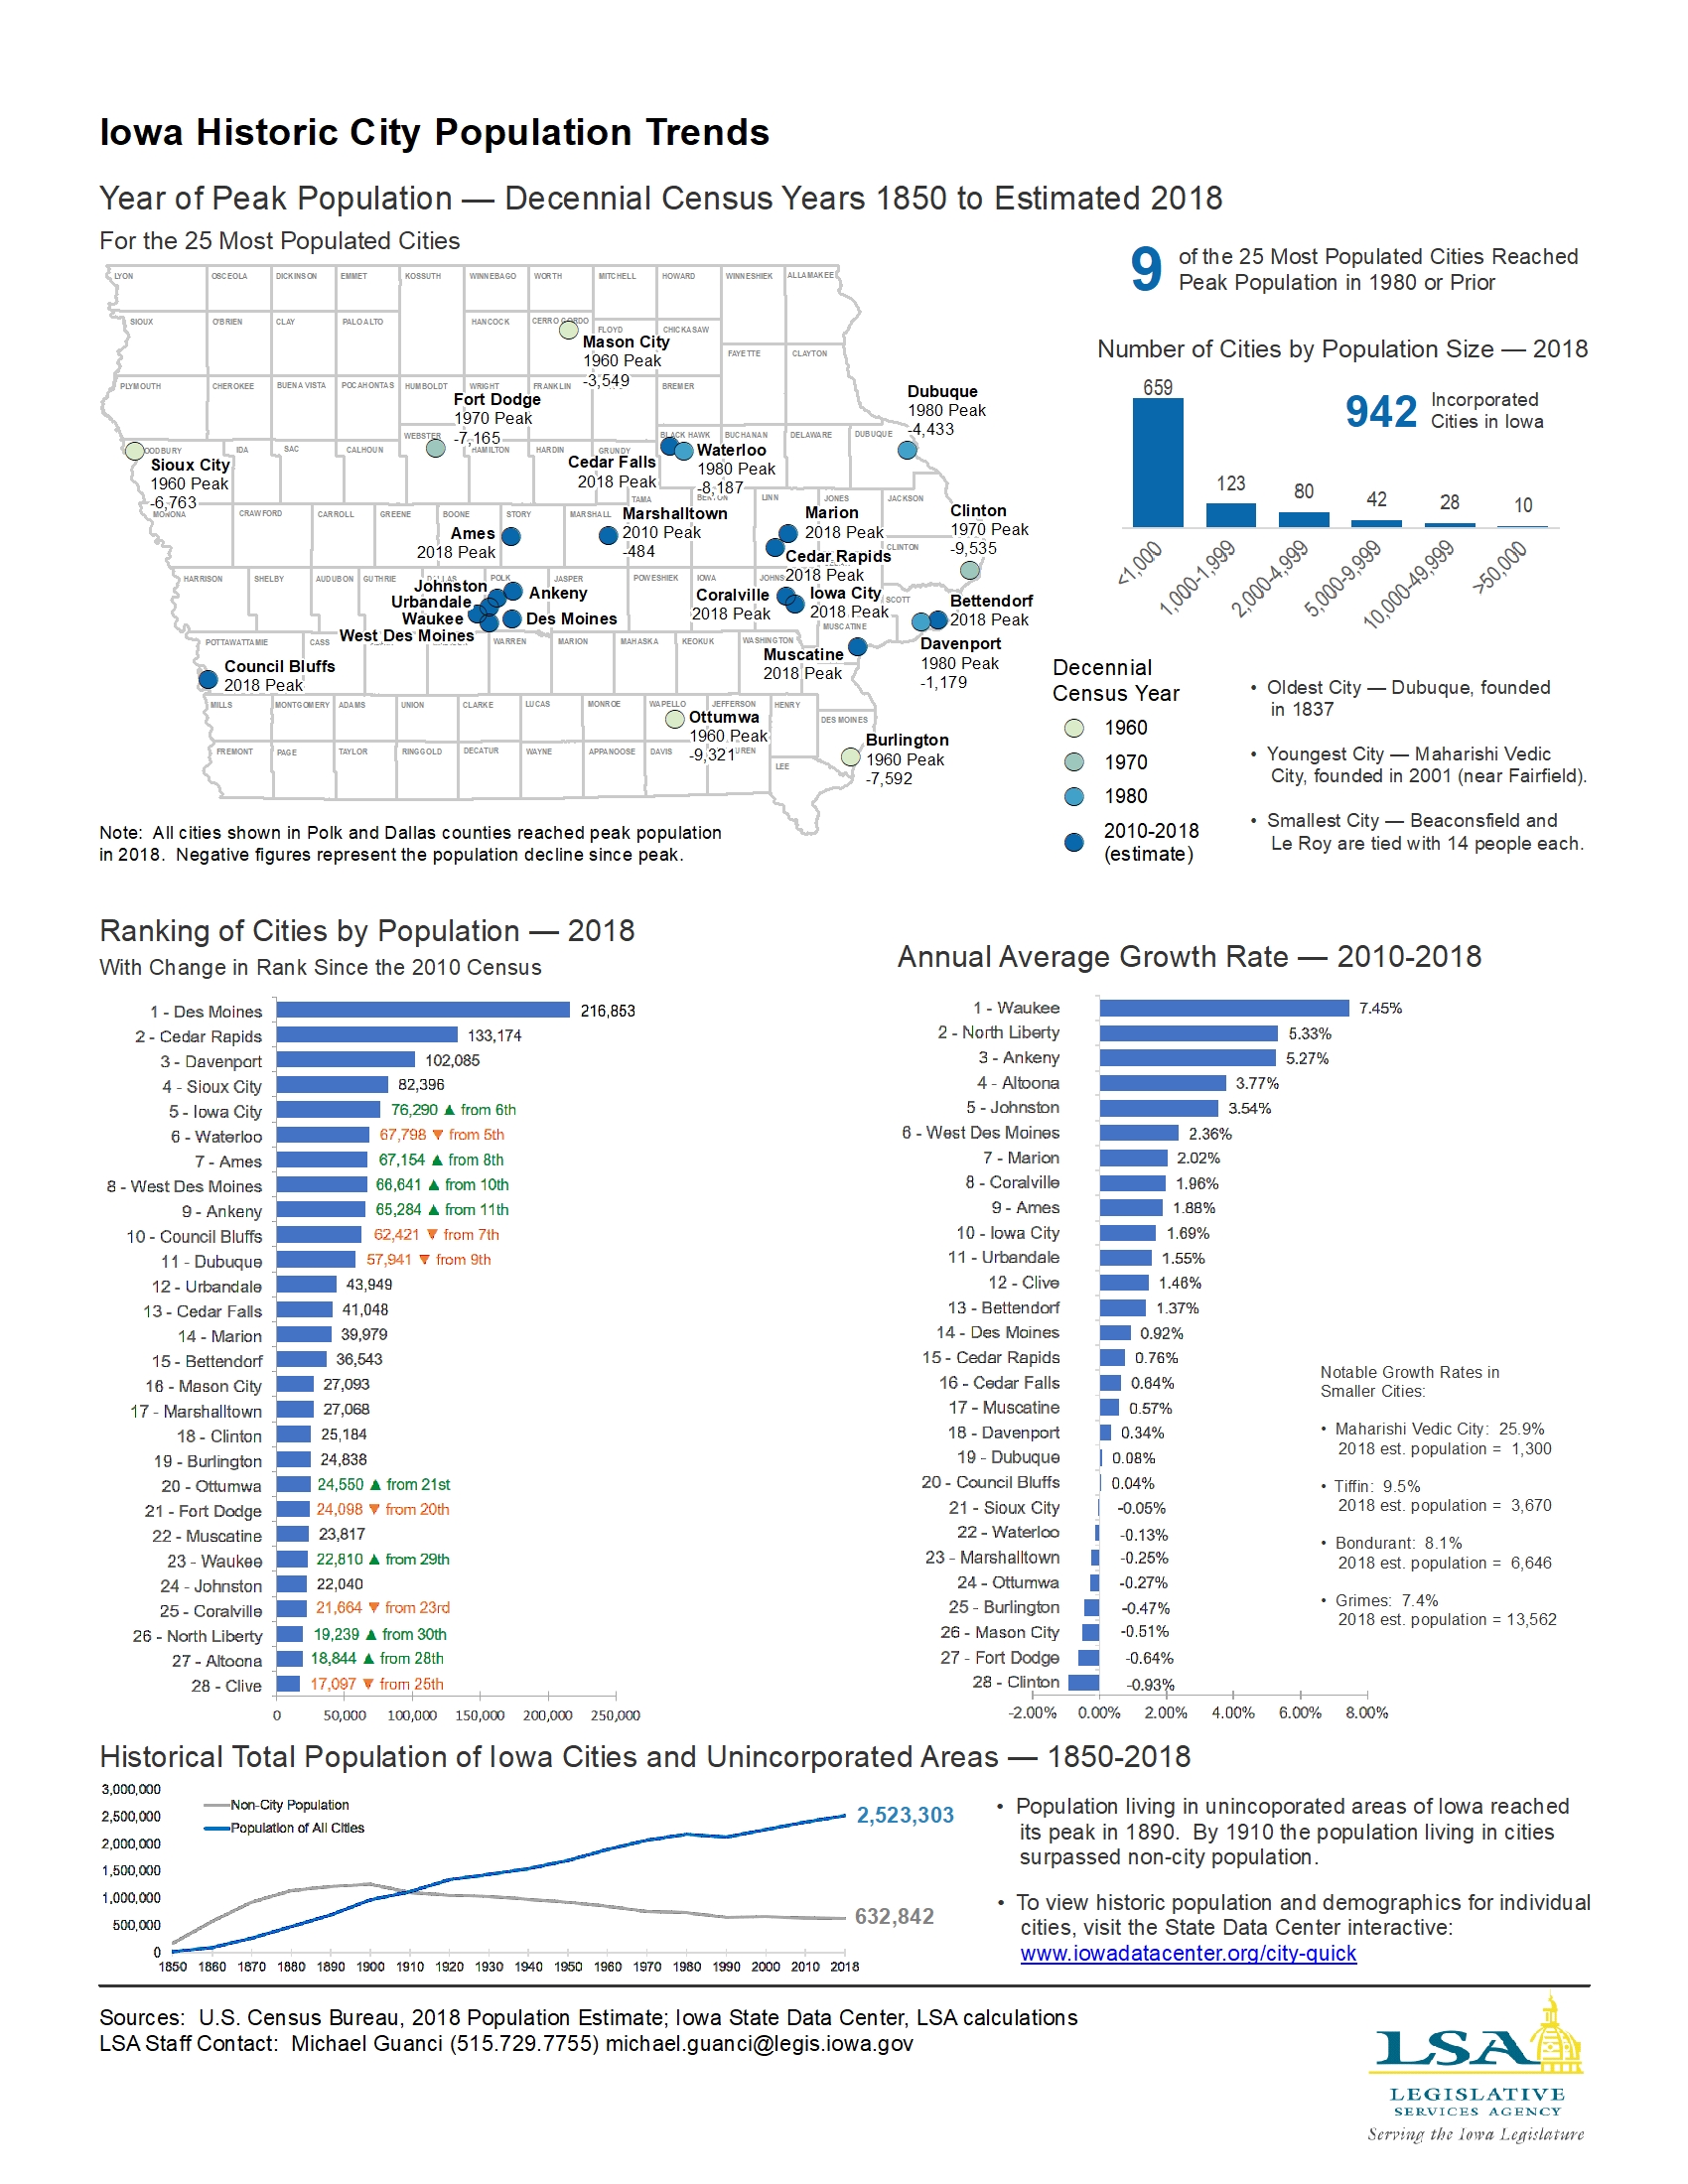
Historic City Population Trends in Iowa
|
|
|
|
|
| 01/20/2020 |
Iowa Insights |
Historic Population Trends in Iowa

|
|
|
|
|
| 01/13/2020 |
Iowa Insights |
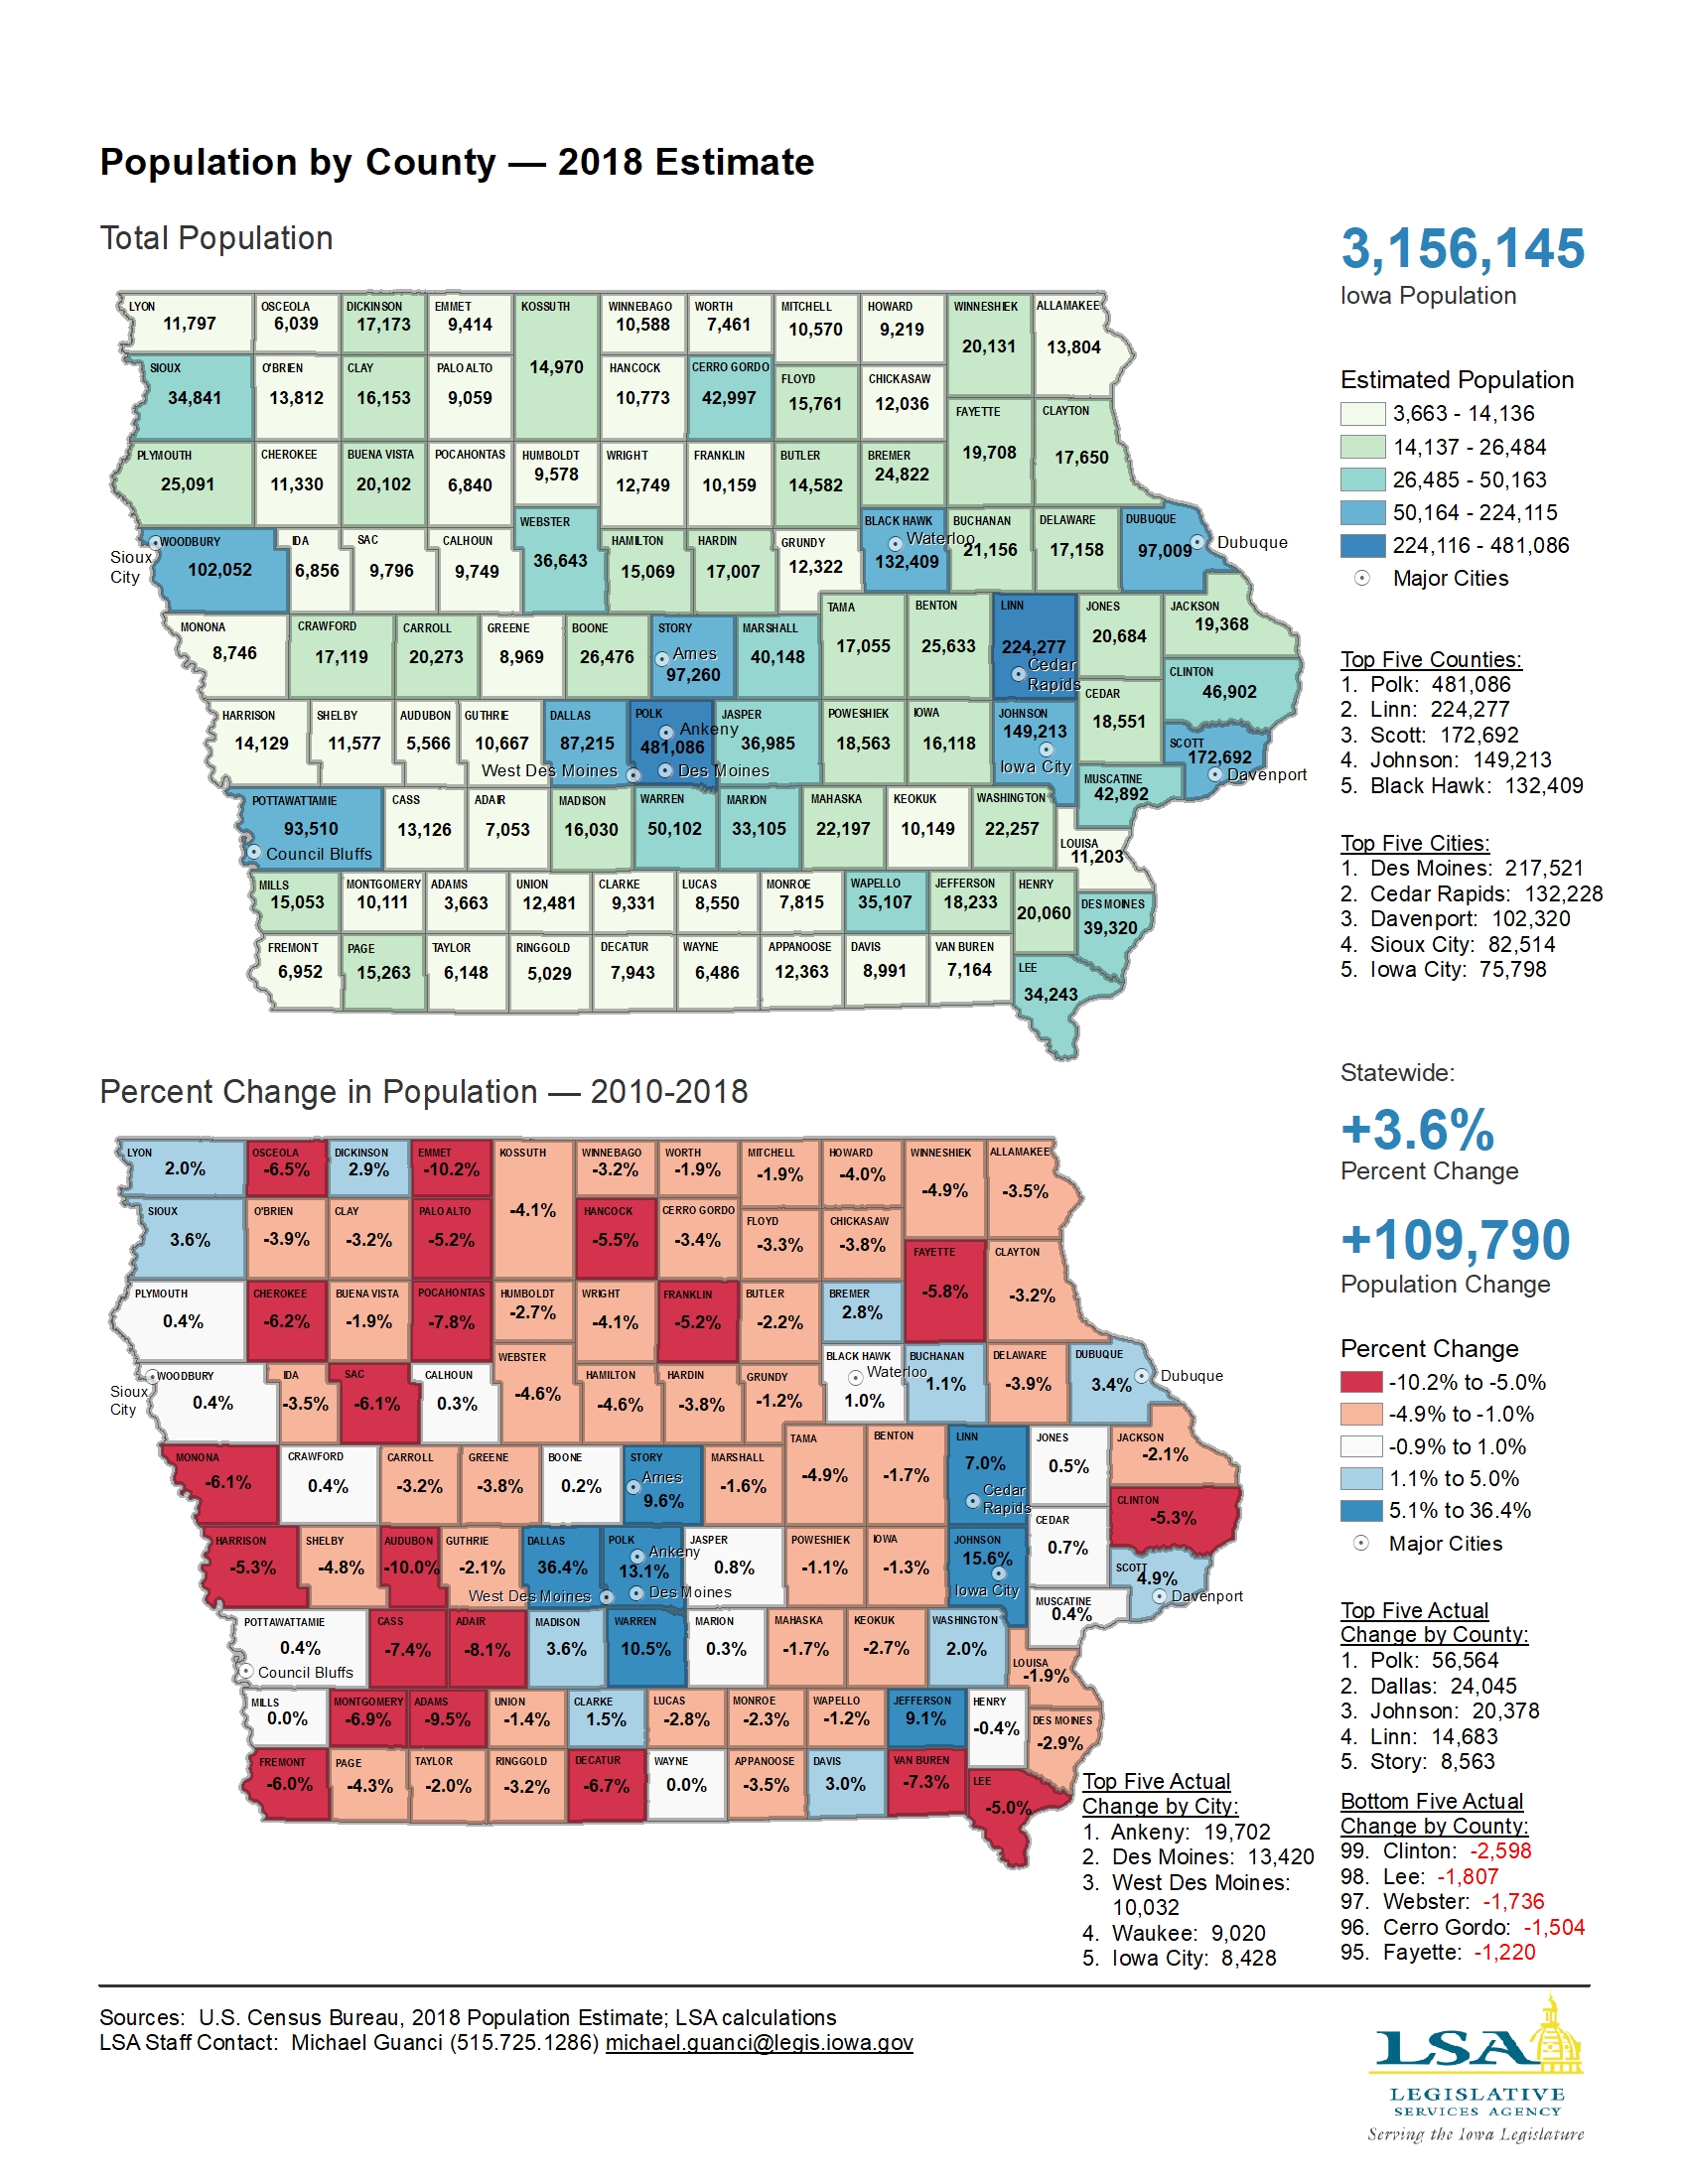
Population by County - 2018
|
|
|
|
|
| 12/16/2019 |
Iowa Insights |
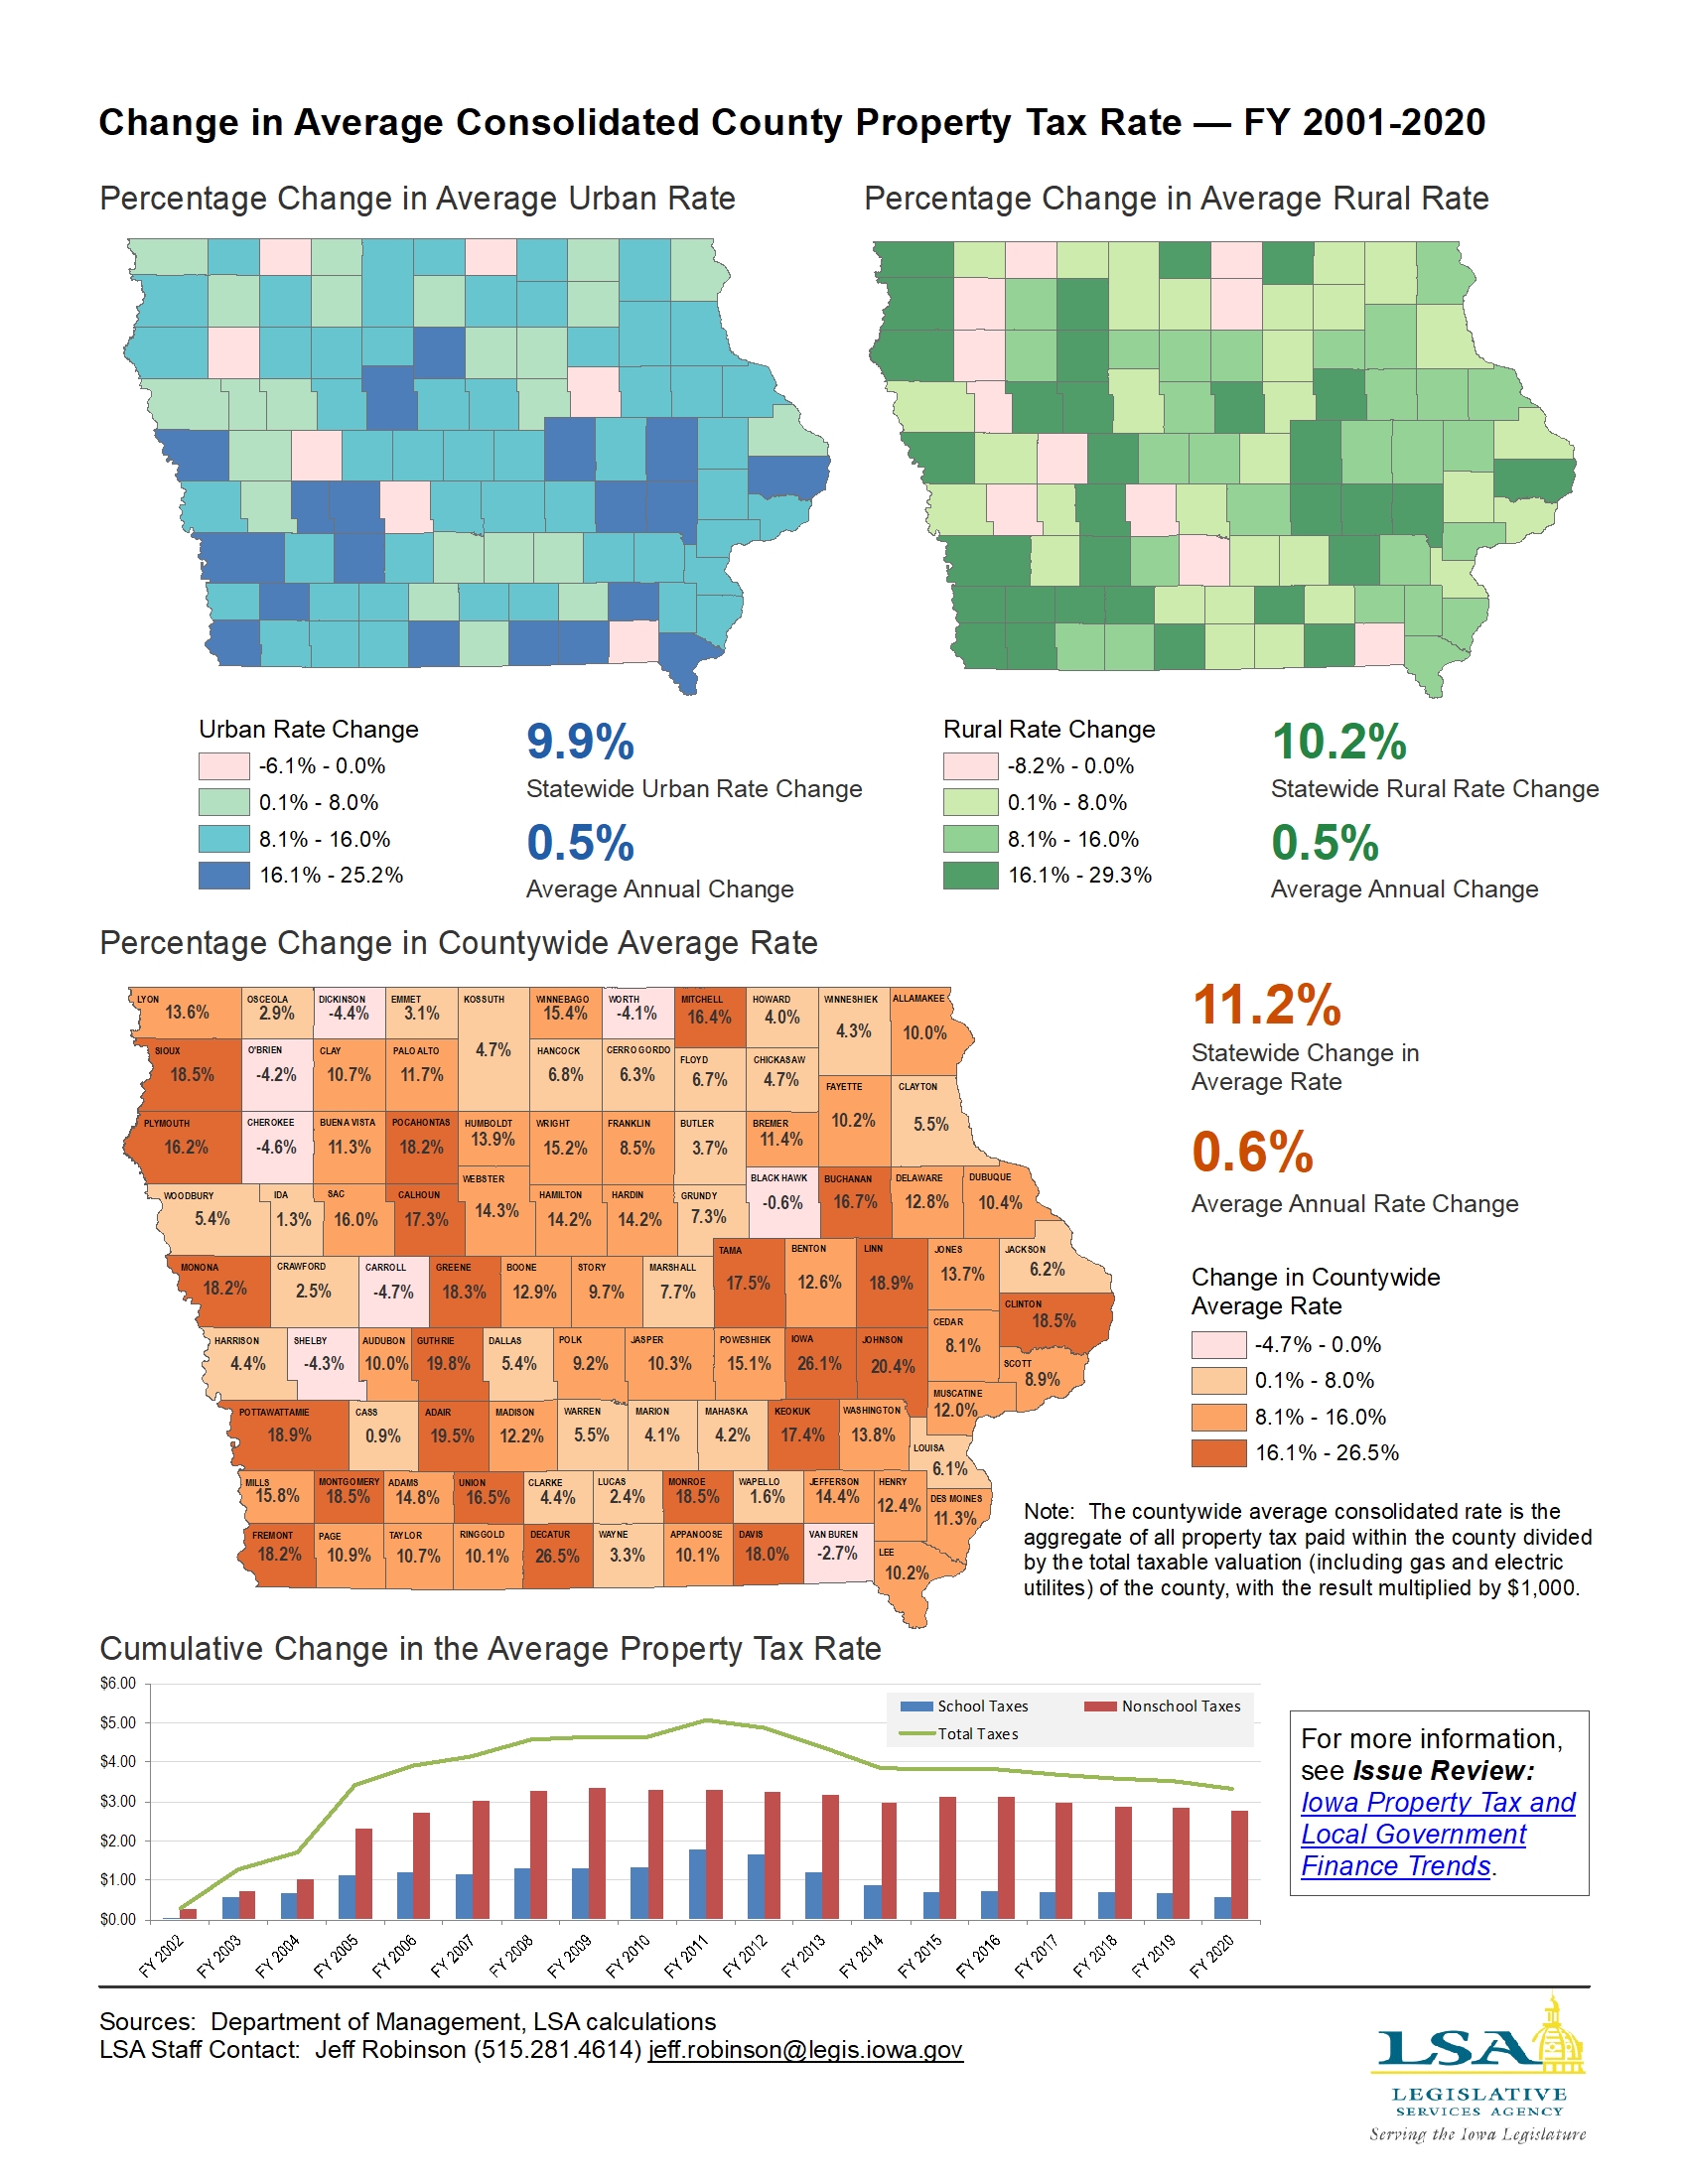
Change in Average Consolidated County Property Tax Rate — FY 2001-2020
|
|
|
|
|
| 12/09/2019 |
Iowa Insights |
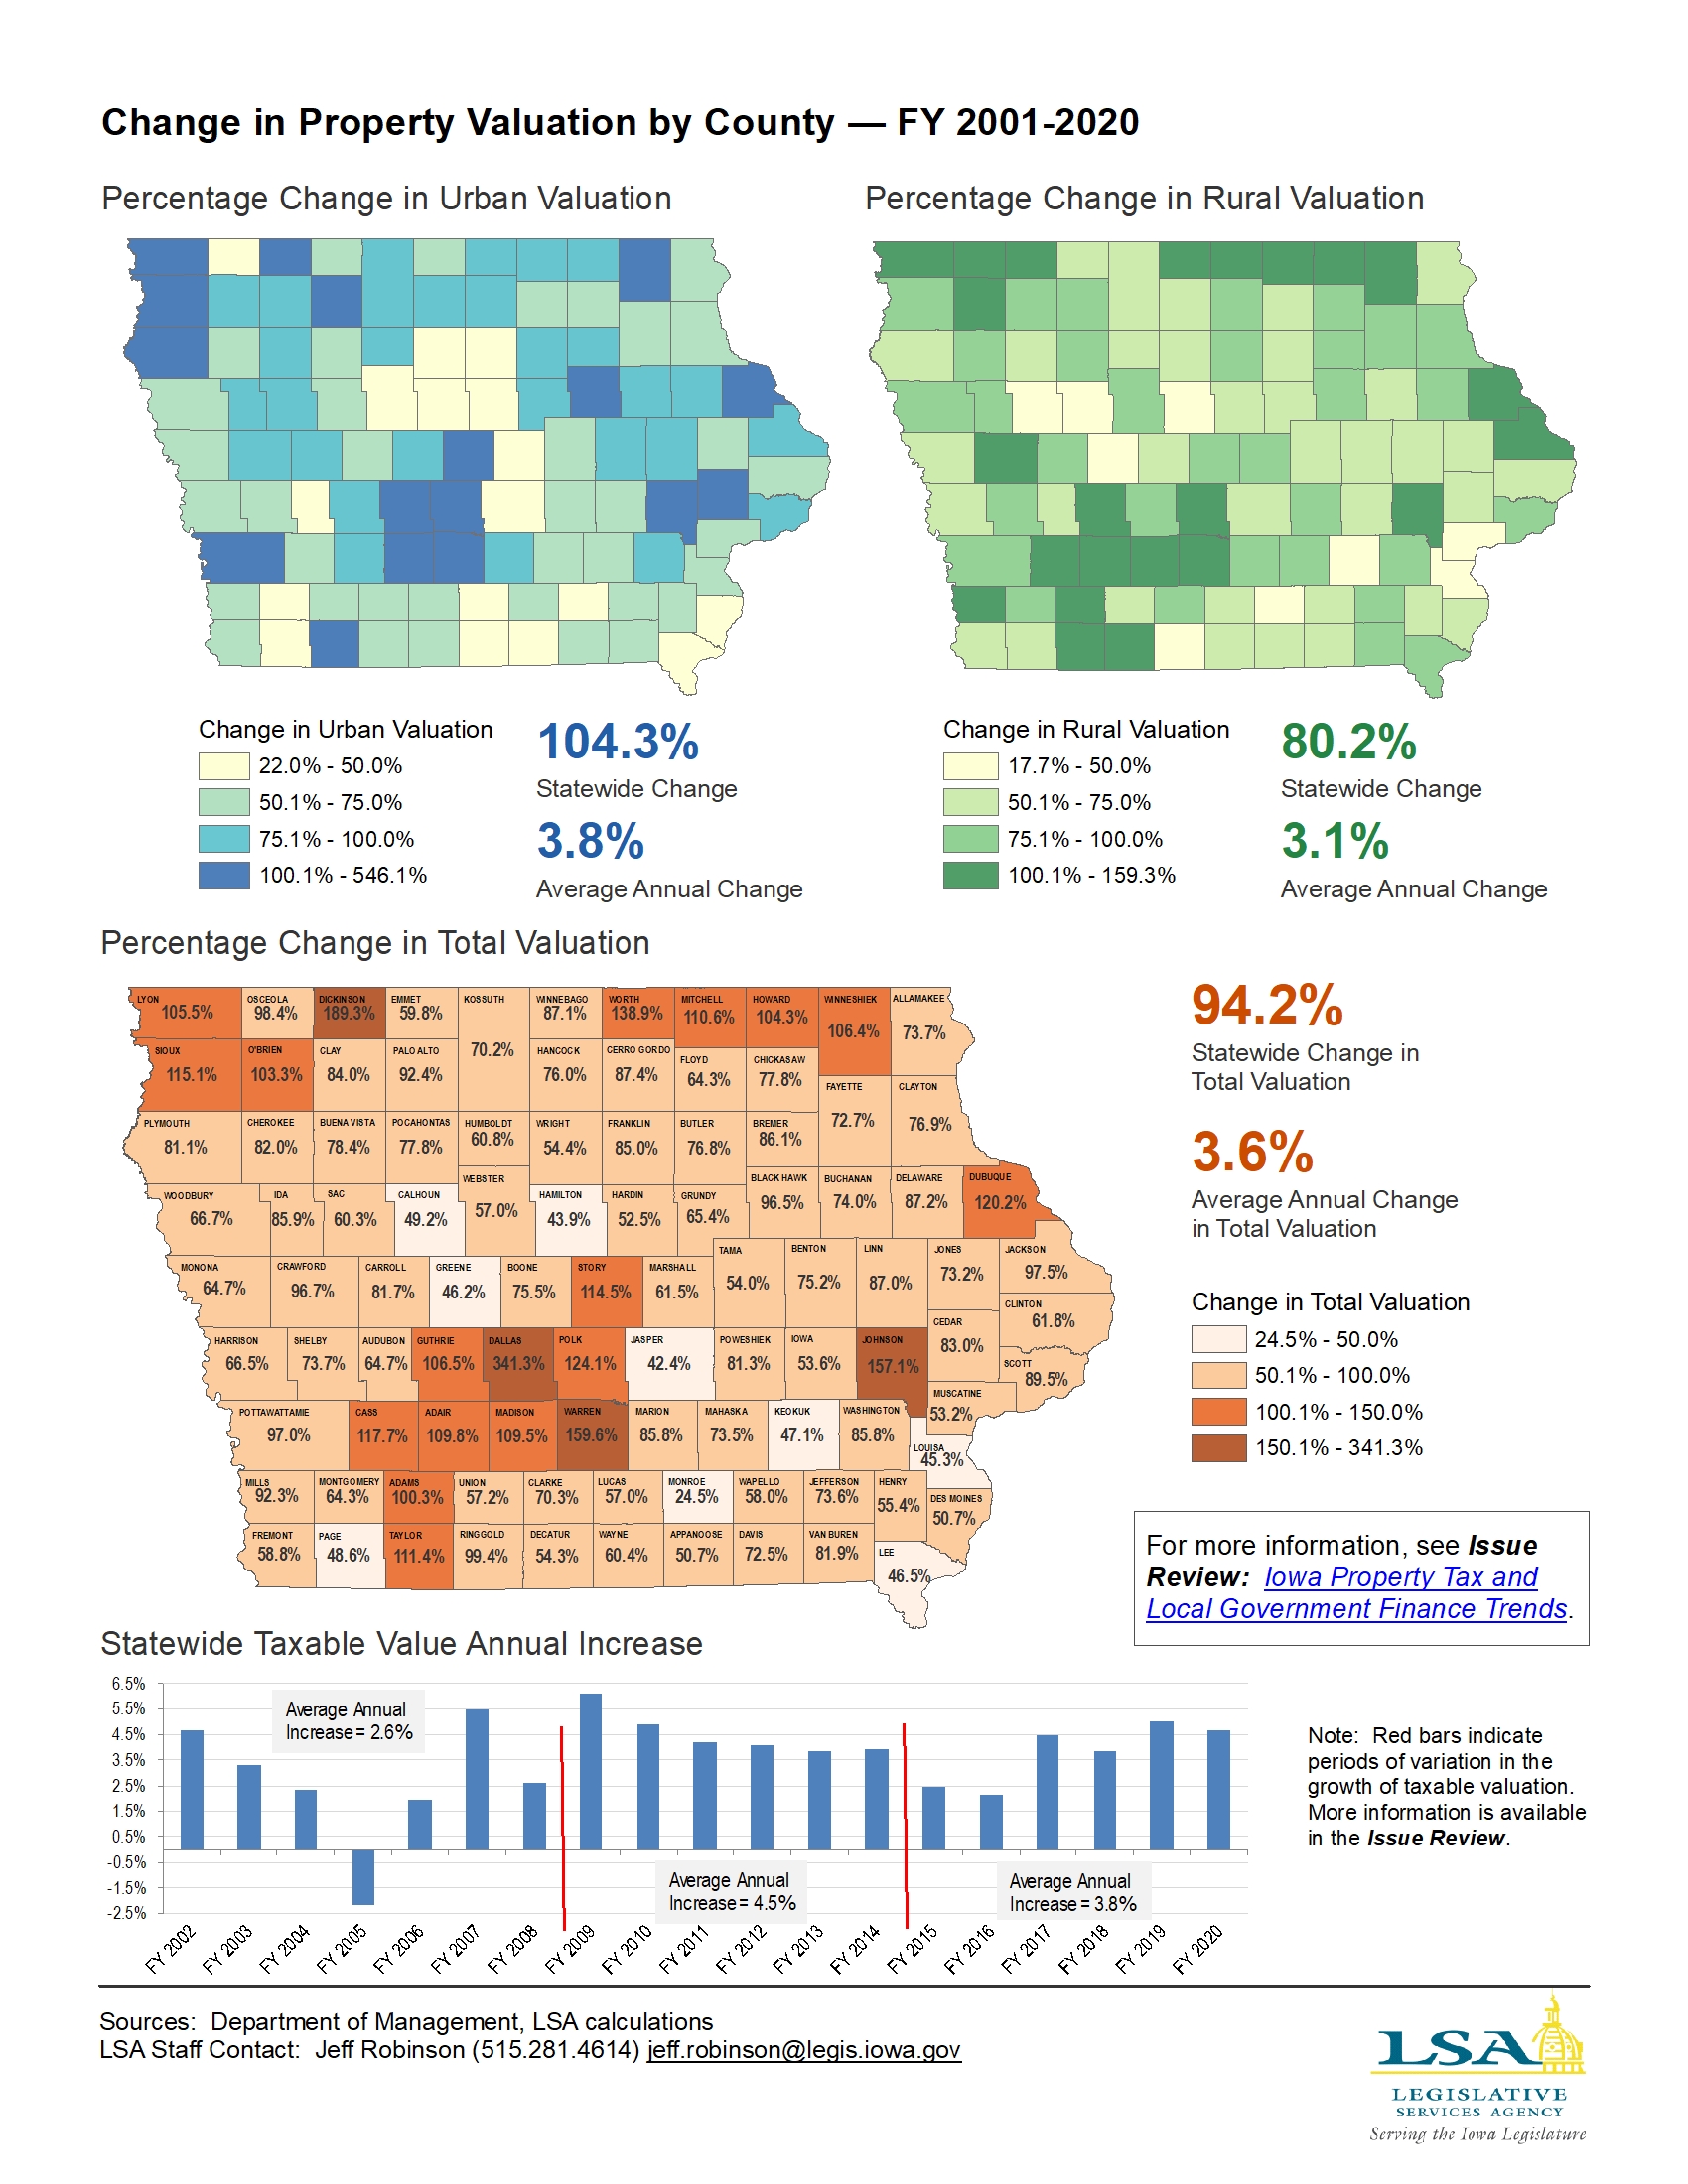
Change in Property Valuation by County — FY 2001-2020
|
|
|
|
|
| 12/02/2019 |
Iowa Insights |
Comparison of Iowa Crime Rates by City — 2017

|
|
|
|
|
| 11/25/2019 |
Iowa Insights |
National Comparison of Crime Rates

|
|
|
|
|
| 11/18/2019 |
Iowa Insights |
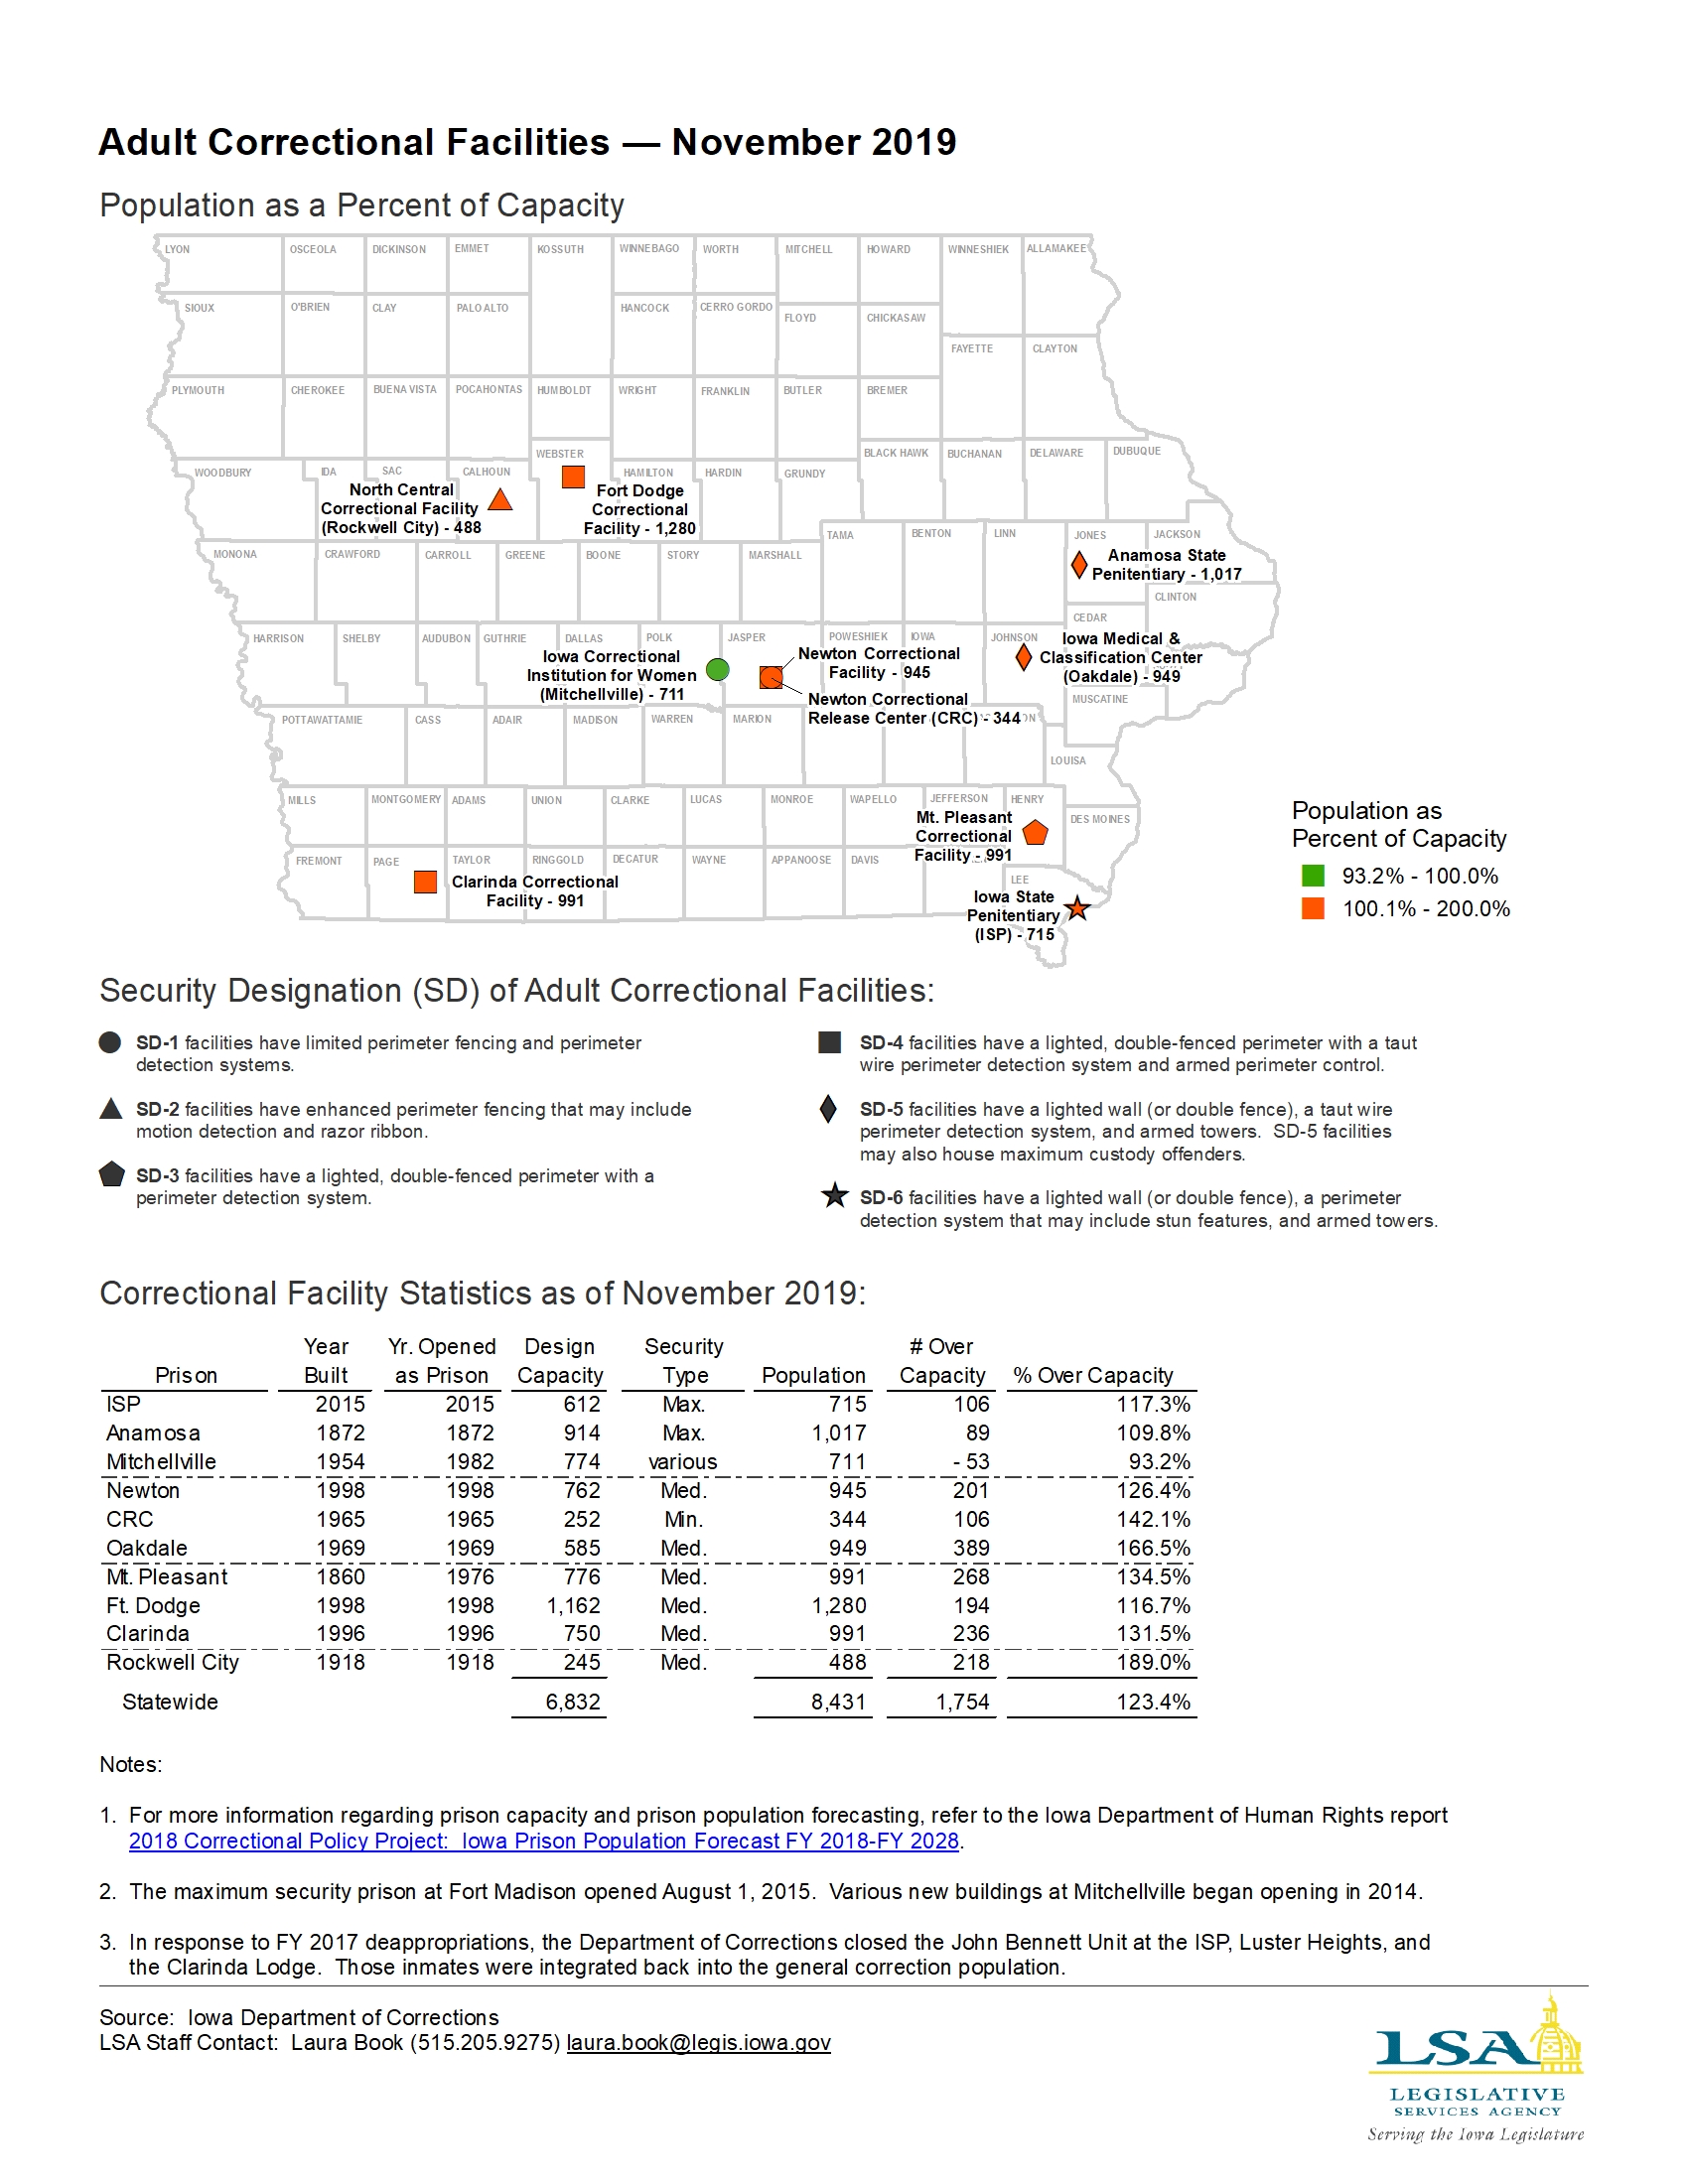
Map — Adult Correctional Facilities
|
|
|
|
|
| 11/11/2019 |
Iowa Insights |
Iowa District Court Case Filings — 2018

|
|
|
|
|
| 11/04/2019 |
Iowa Insights |
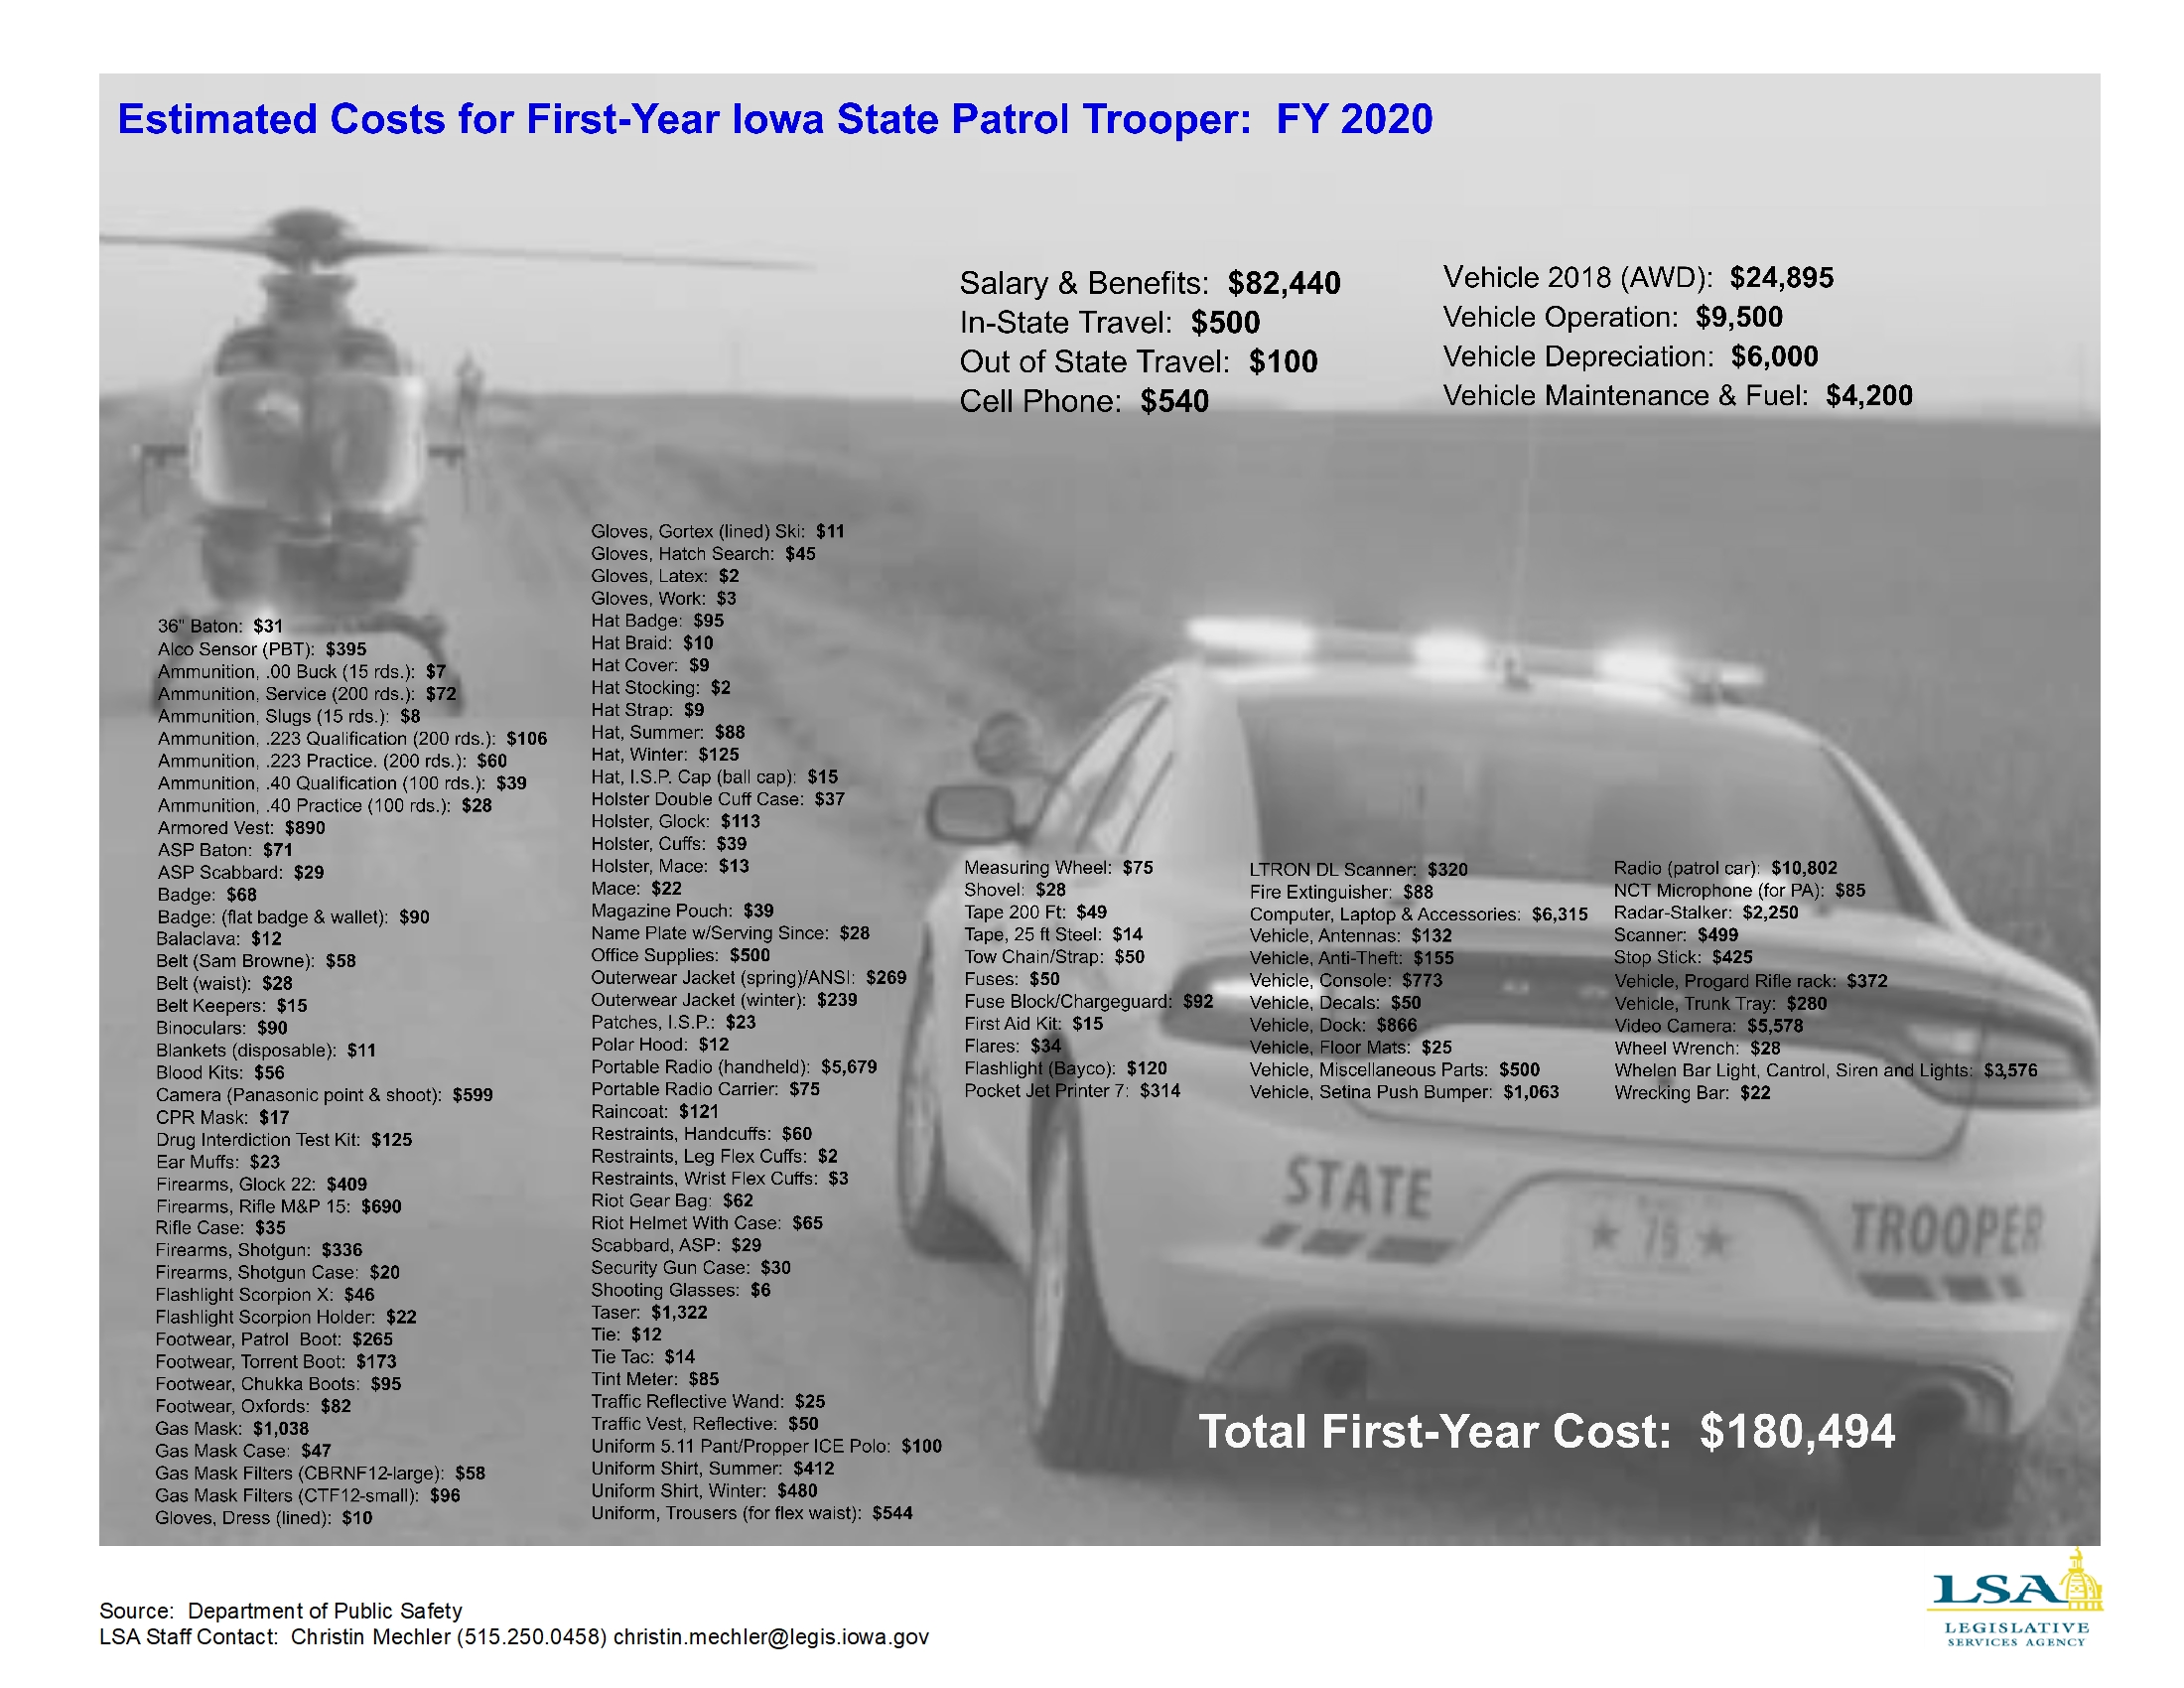
Estimated Costs for First-Year Iowa State Patrol Trooper
|
|
|
|
|
| 10/28/2019 |
Iowa Insights |
High School Graduation Rates by District — Class of 2018

|
|
|
|
|
| 10/21/2019 |
Iowa Insights |
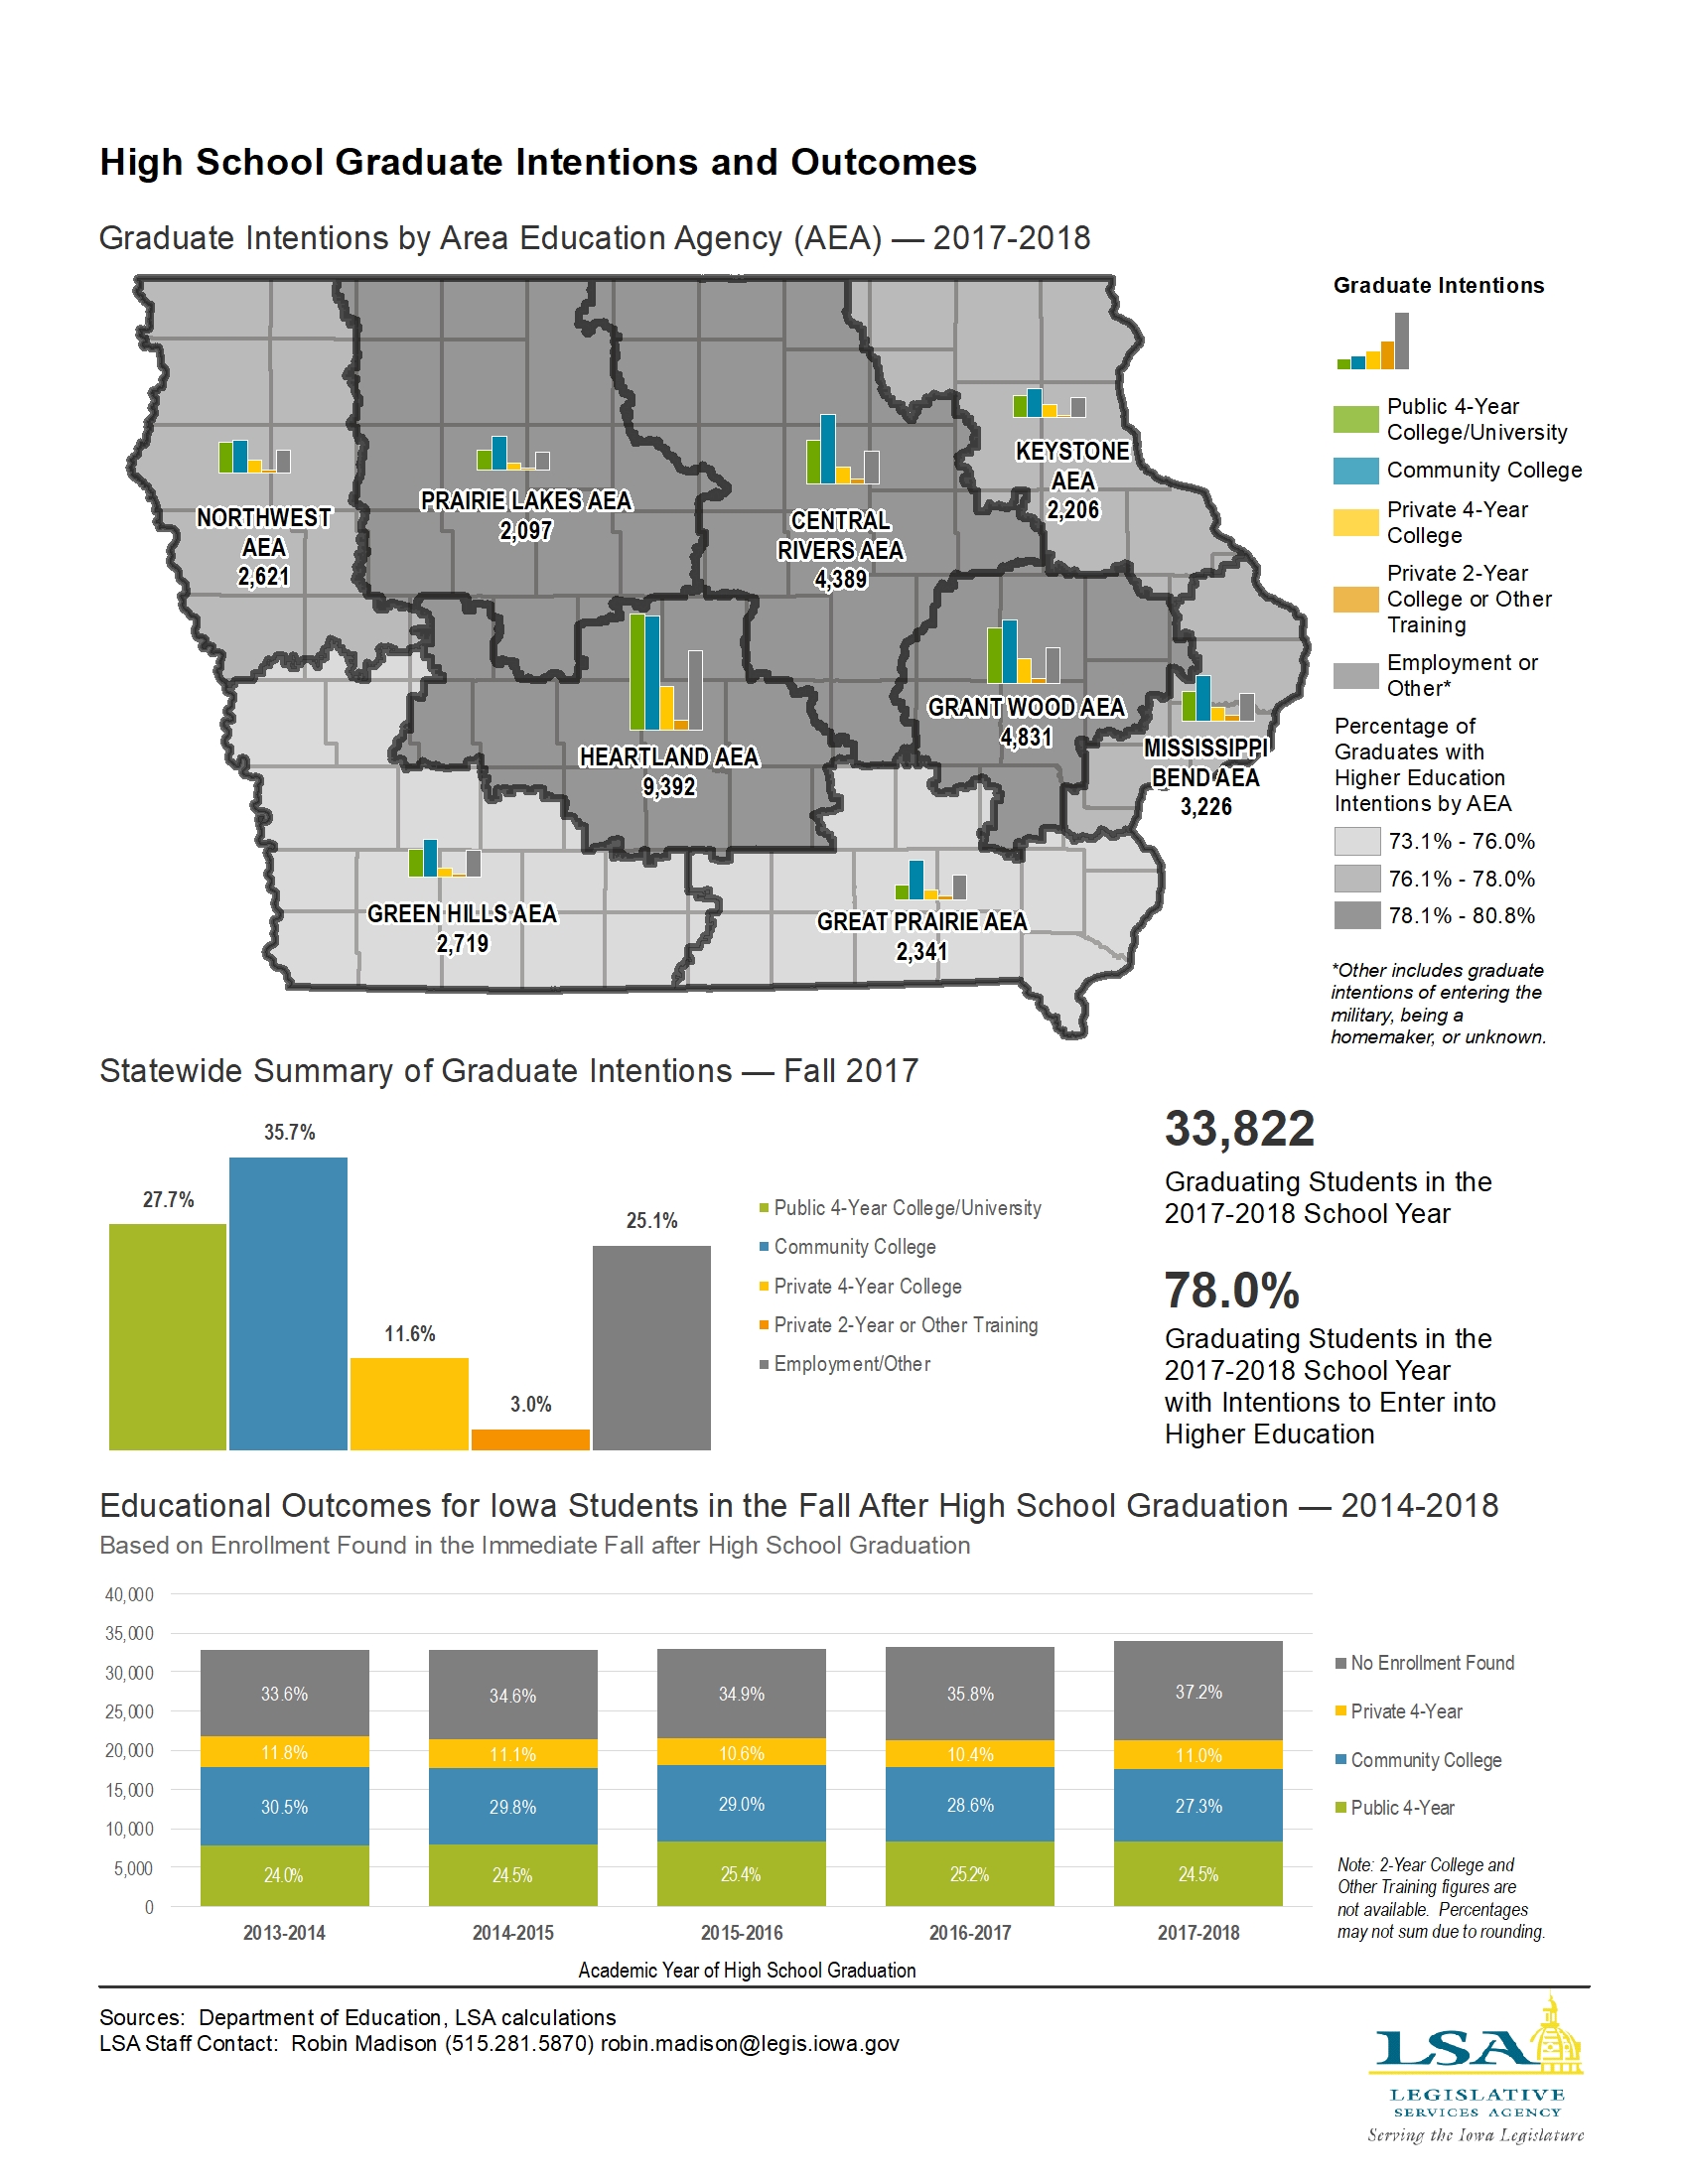
High School Graduate Intentions and Outcomes
|
|
|
|
|
| 10/14/2019 |
Iowa Insights |
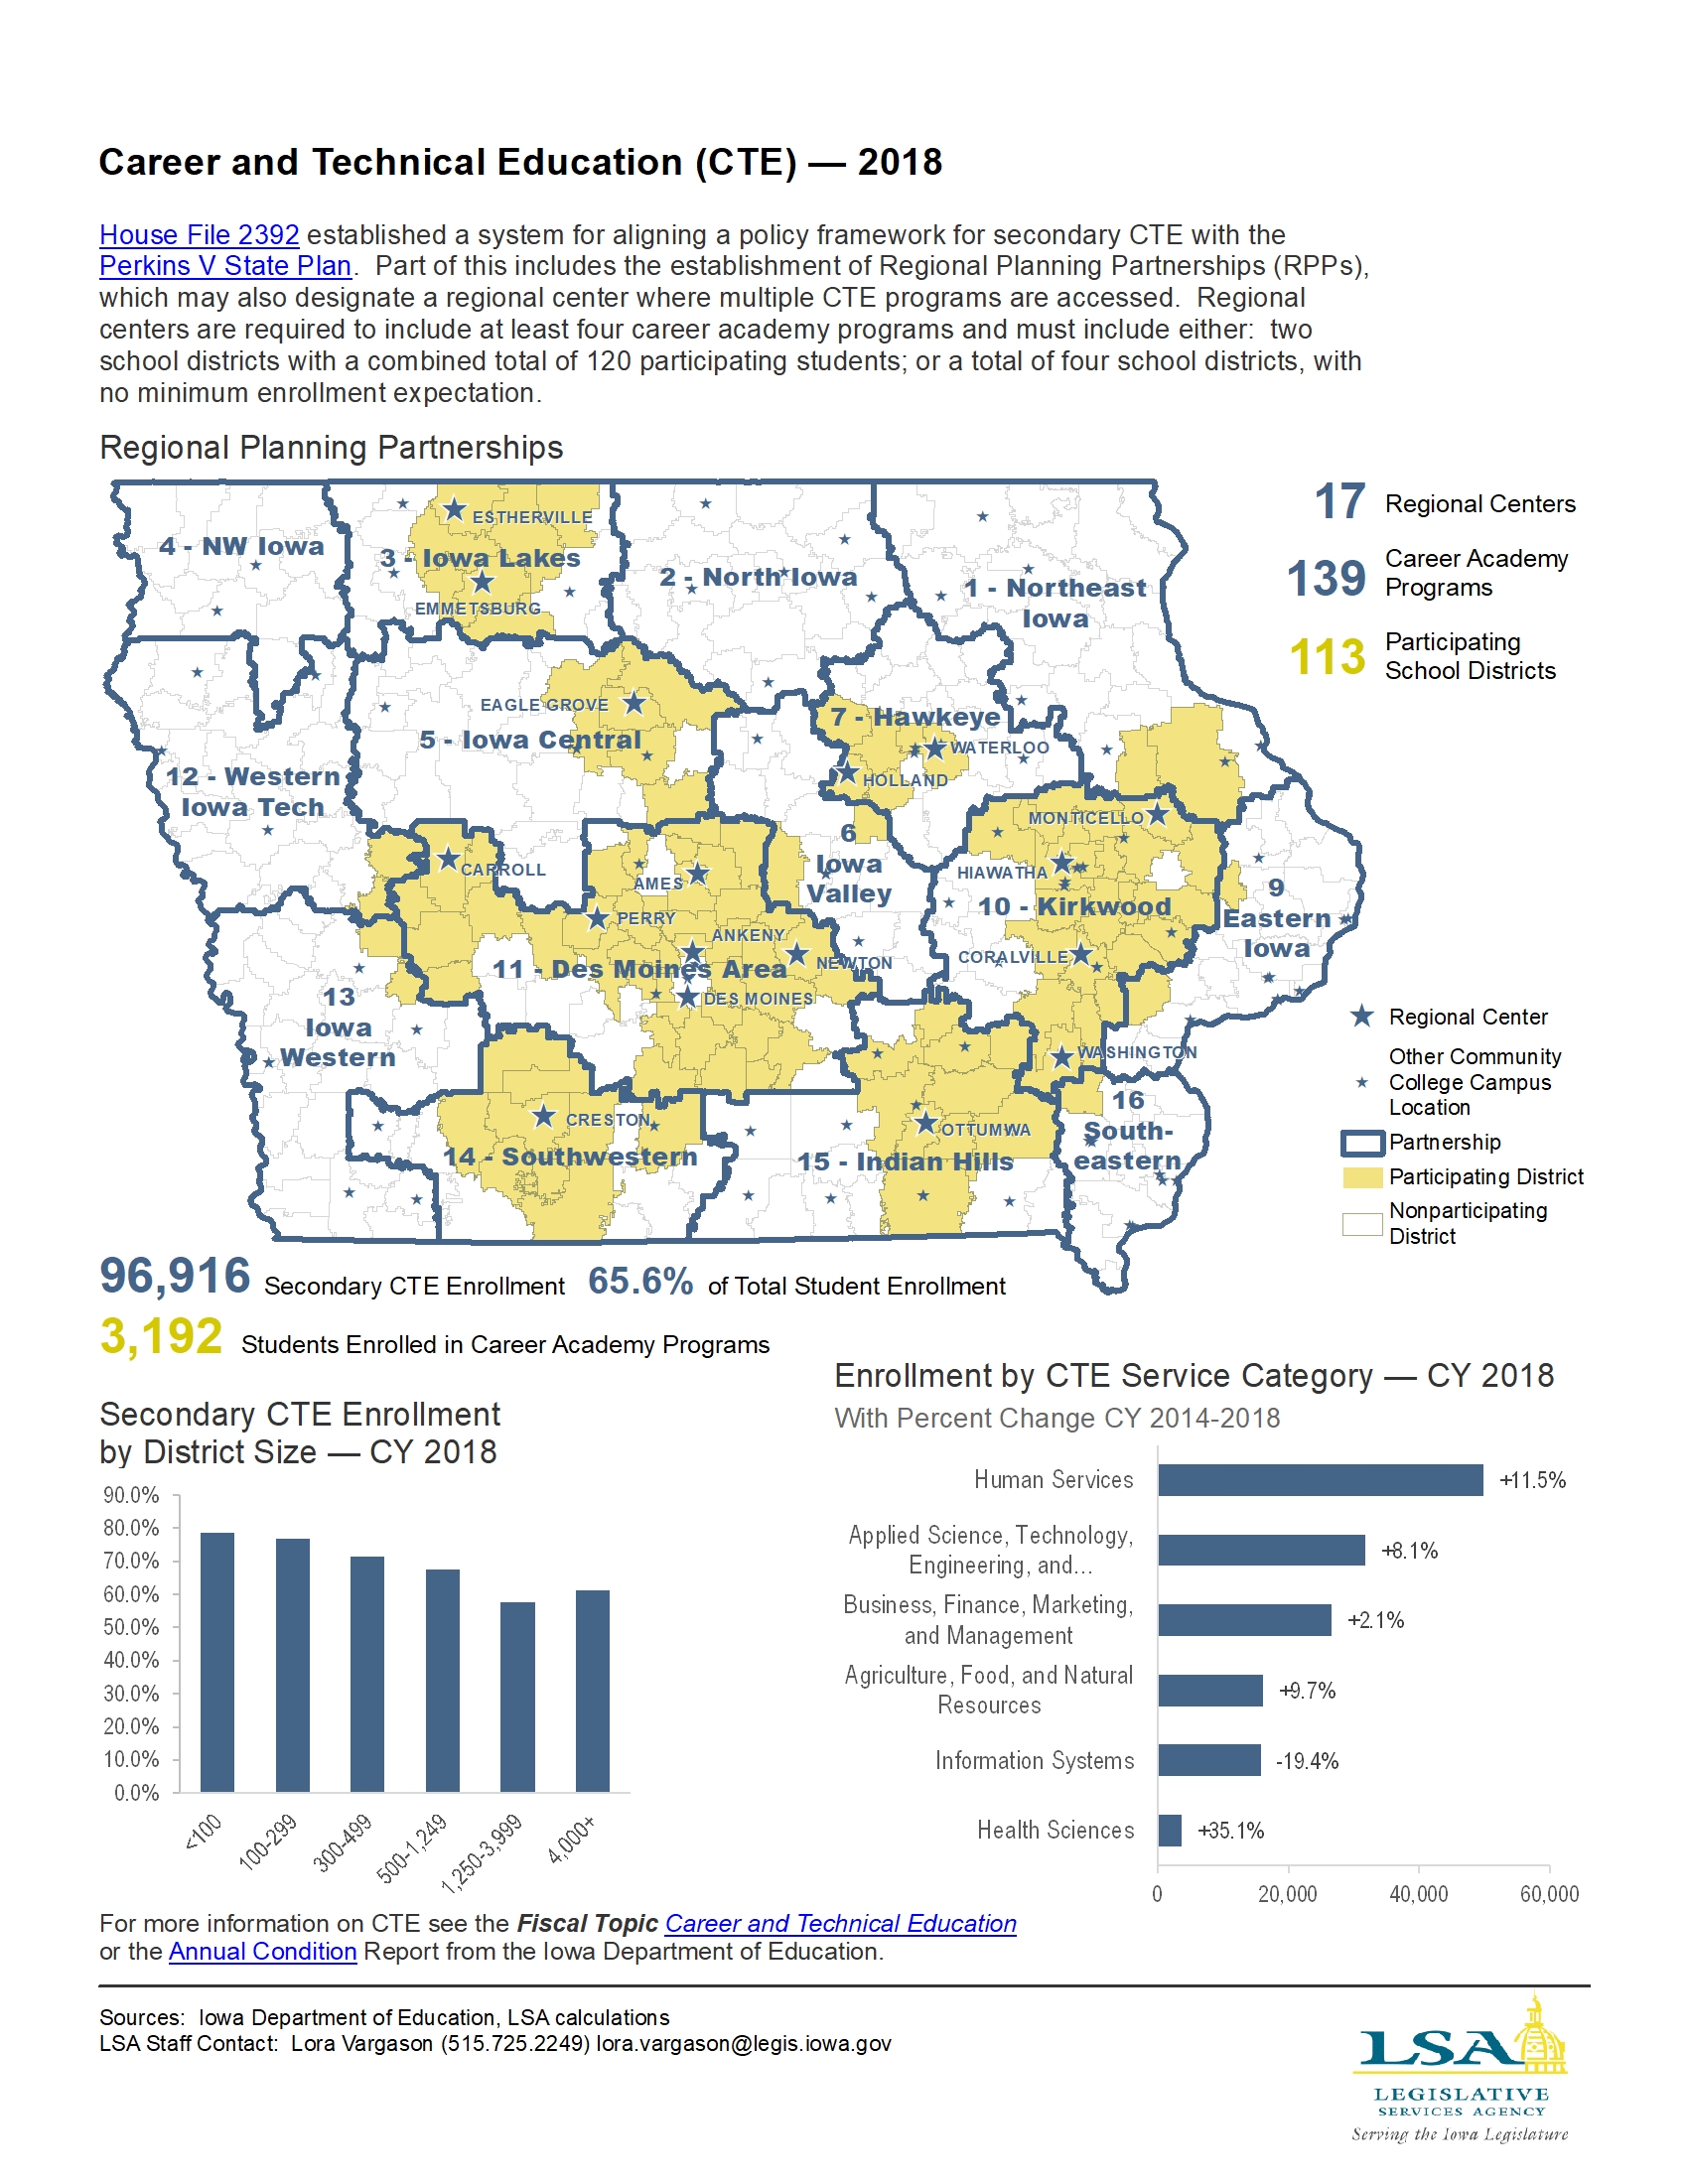
Career and Technical Education (CTE) — 2018
|
|
|
|
|
| 10/07/2019 |
Iowa Insights |
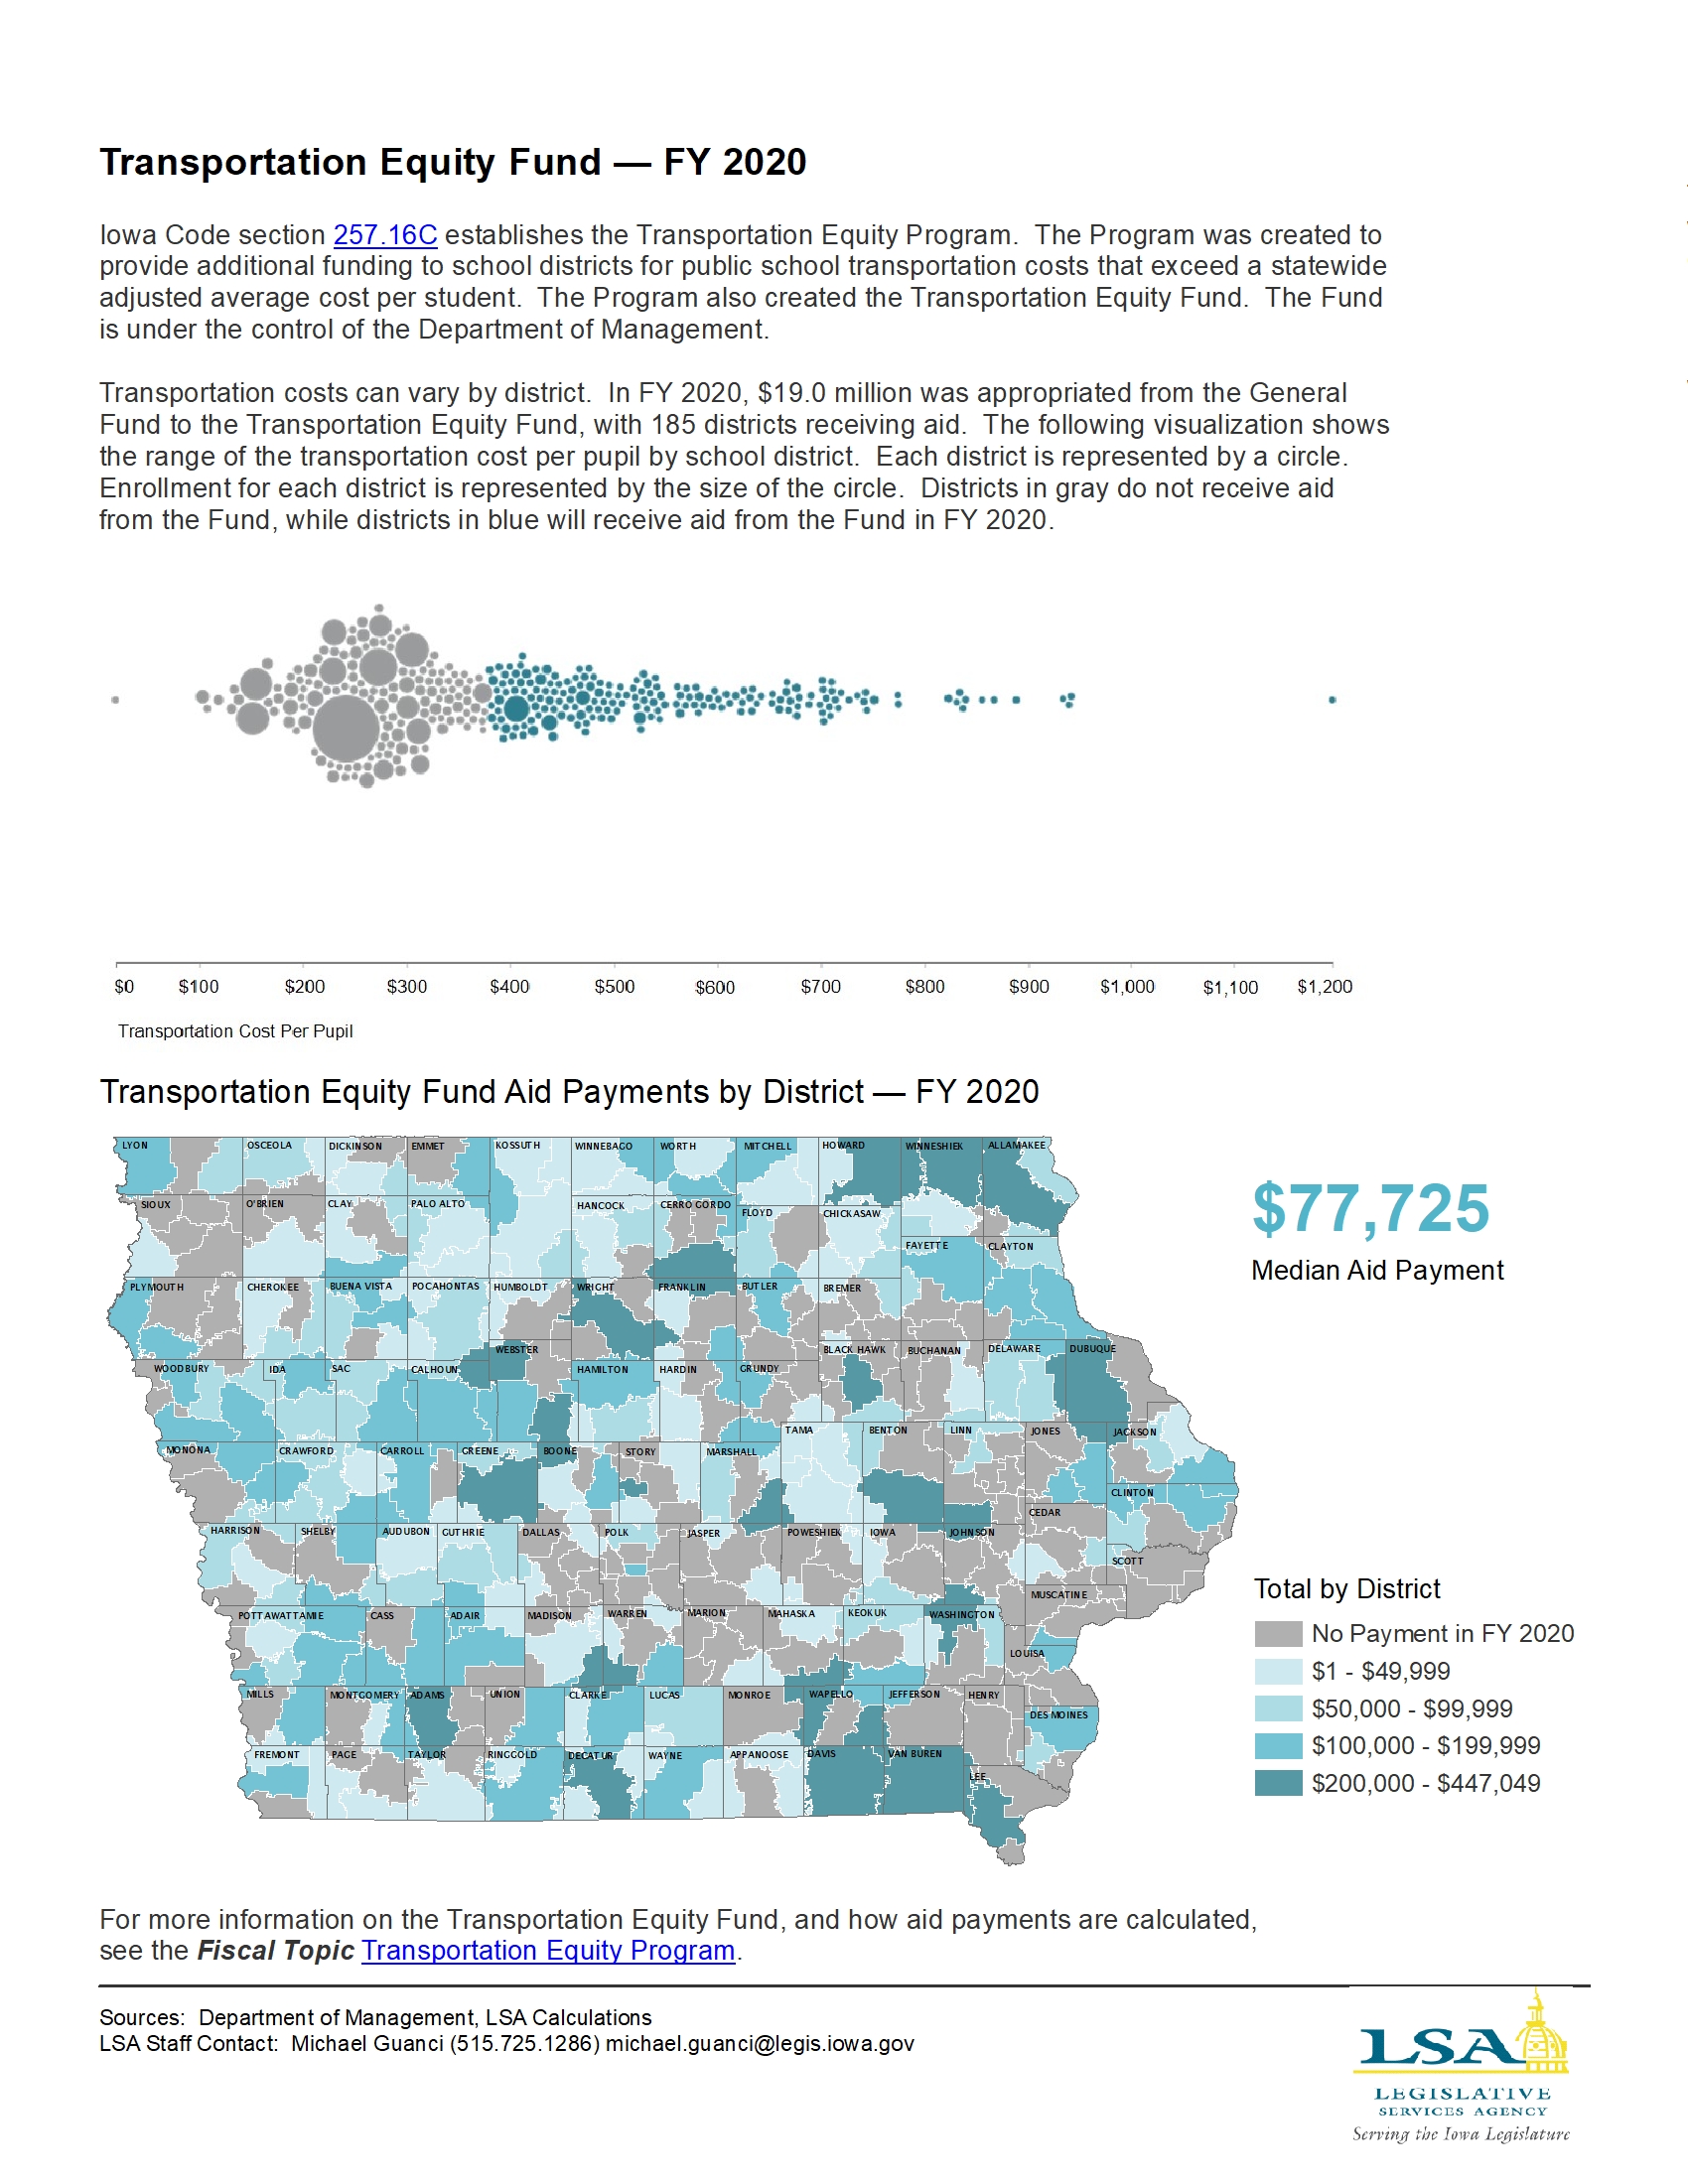
Transportation Equity Fund
|
|
|
|
|
| 09/23/2019 |
Iowa Insights |
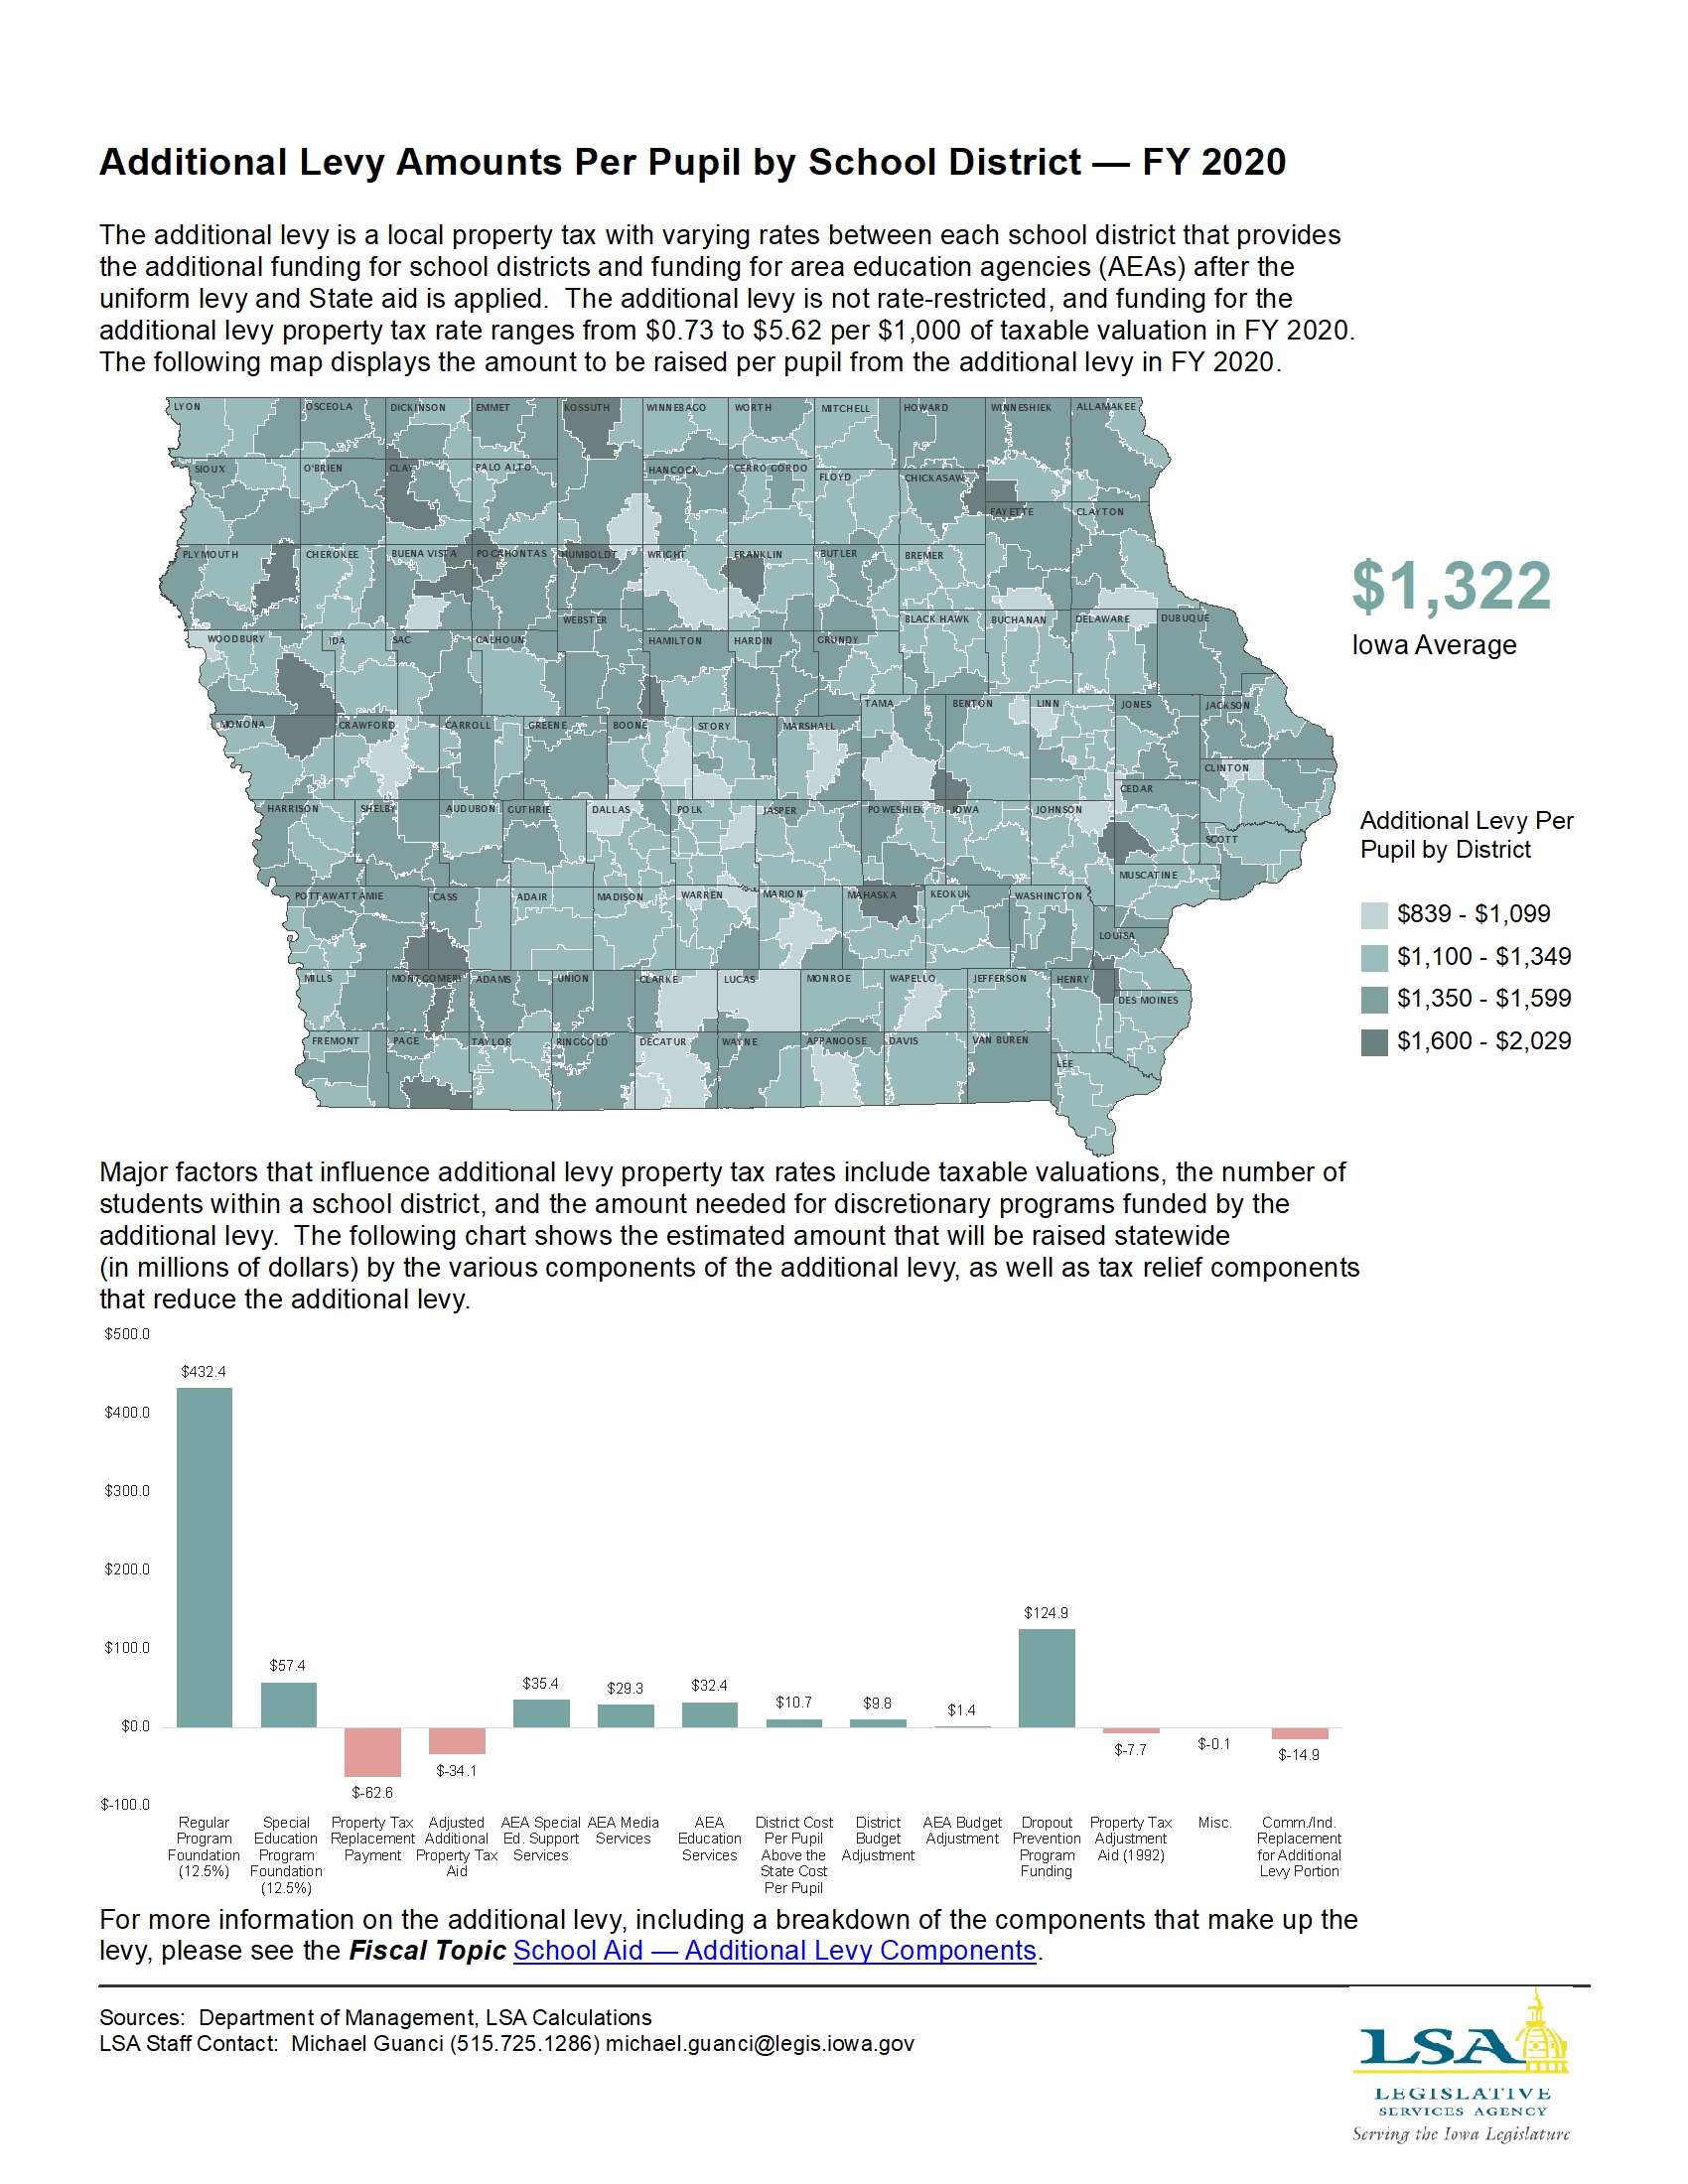
Additional Levy Amounts Per Pupil by School District — FY 2020
|
|
|
|
|
| 09/16/2019 |
Iowa Insights |
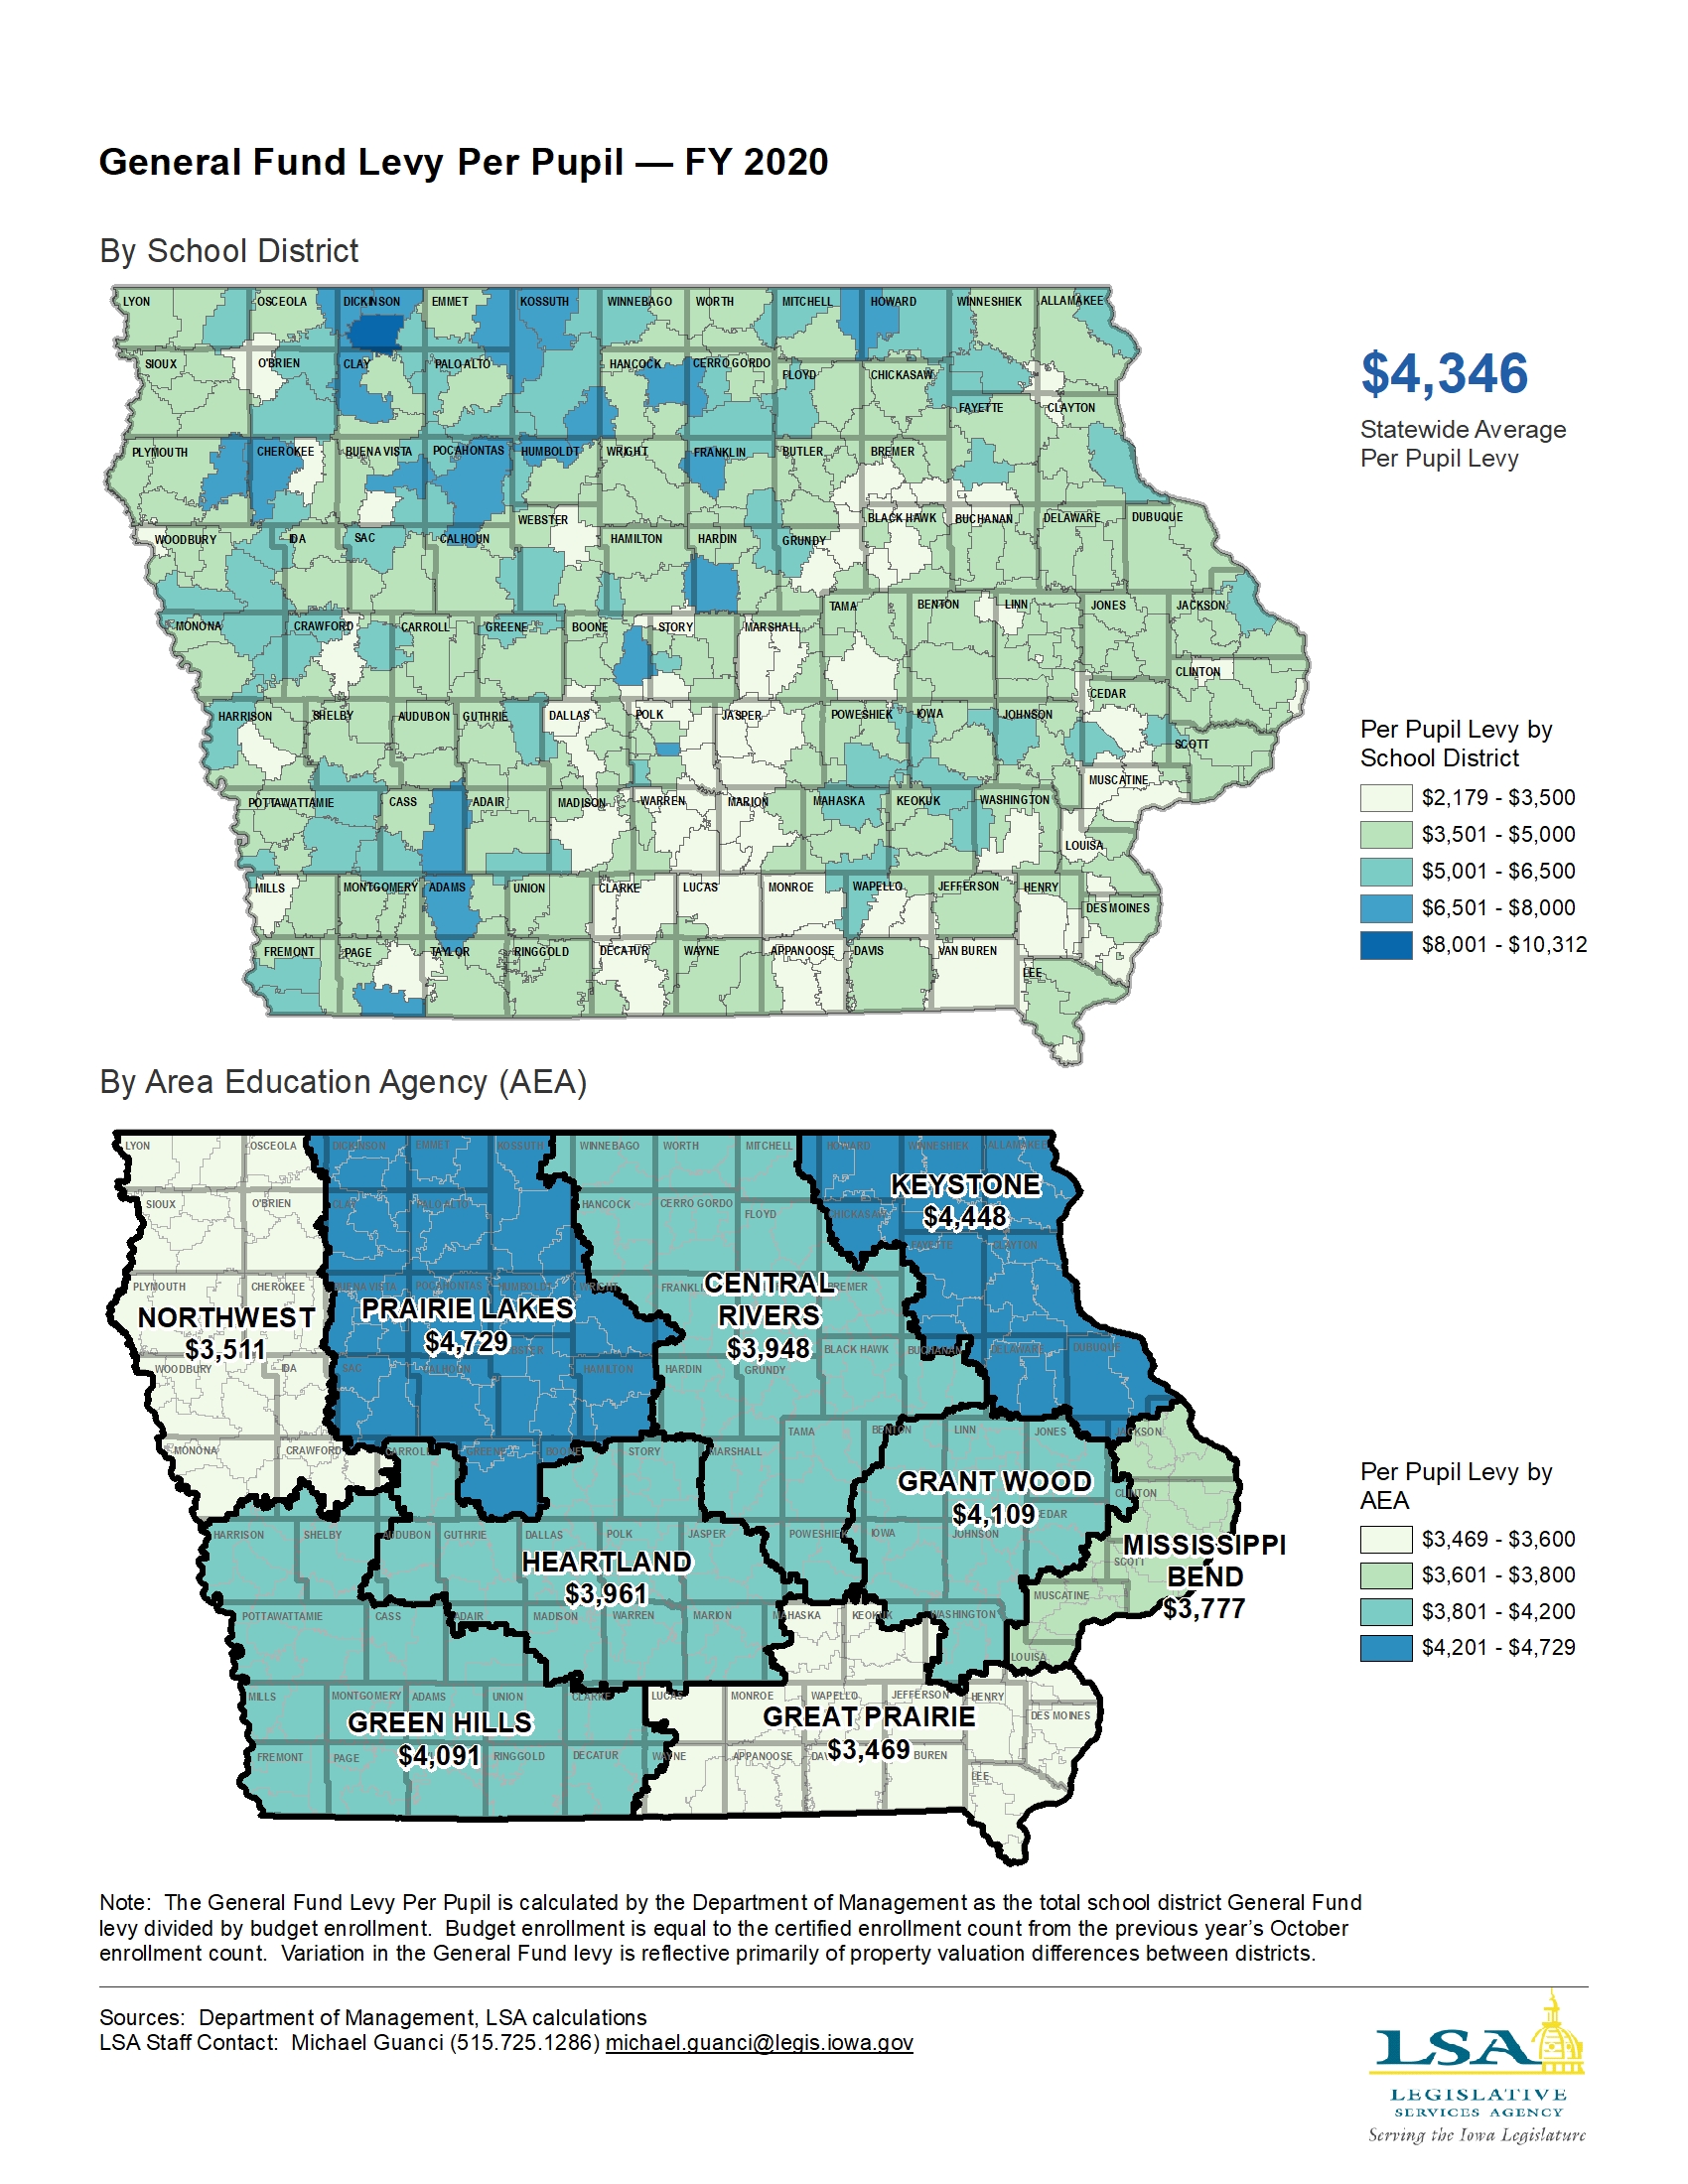
Map — General Fund Levy Per Pupil by School District and AEA
|
|
|
|
|
| 09/06/2019 |
Iowa Insights |
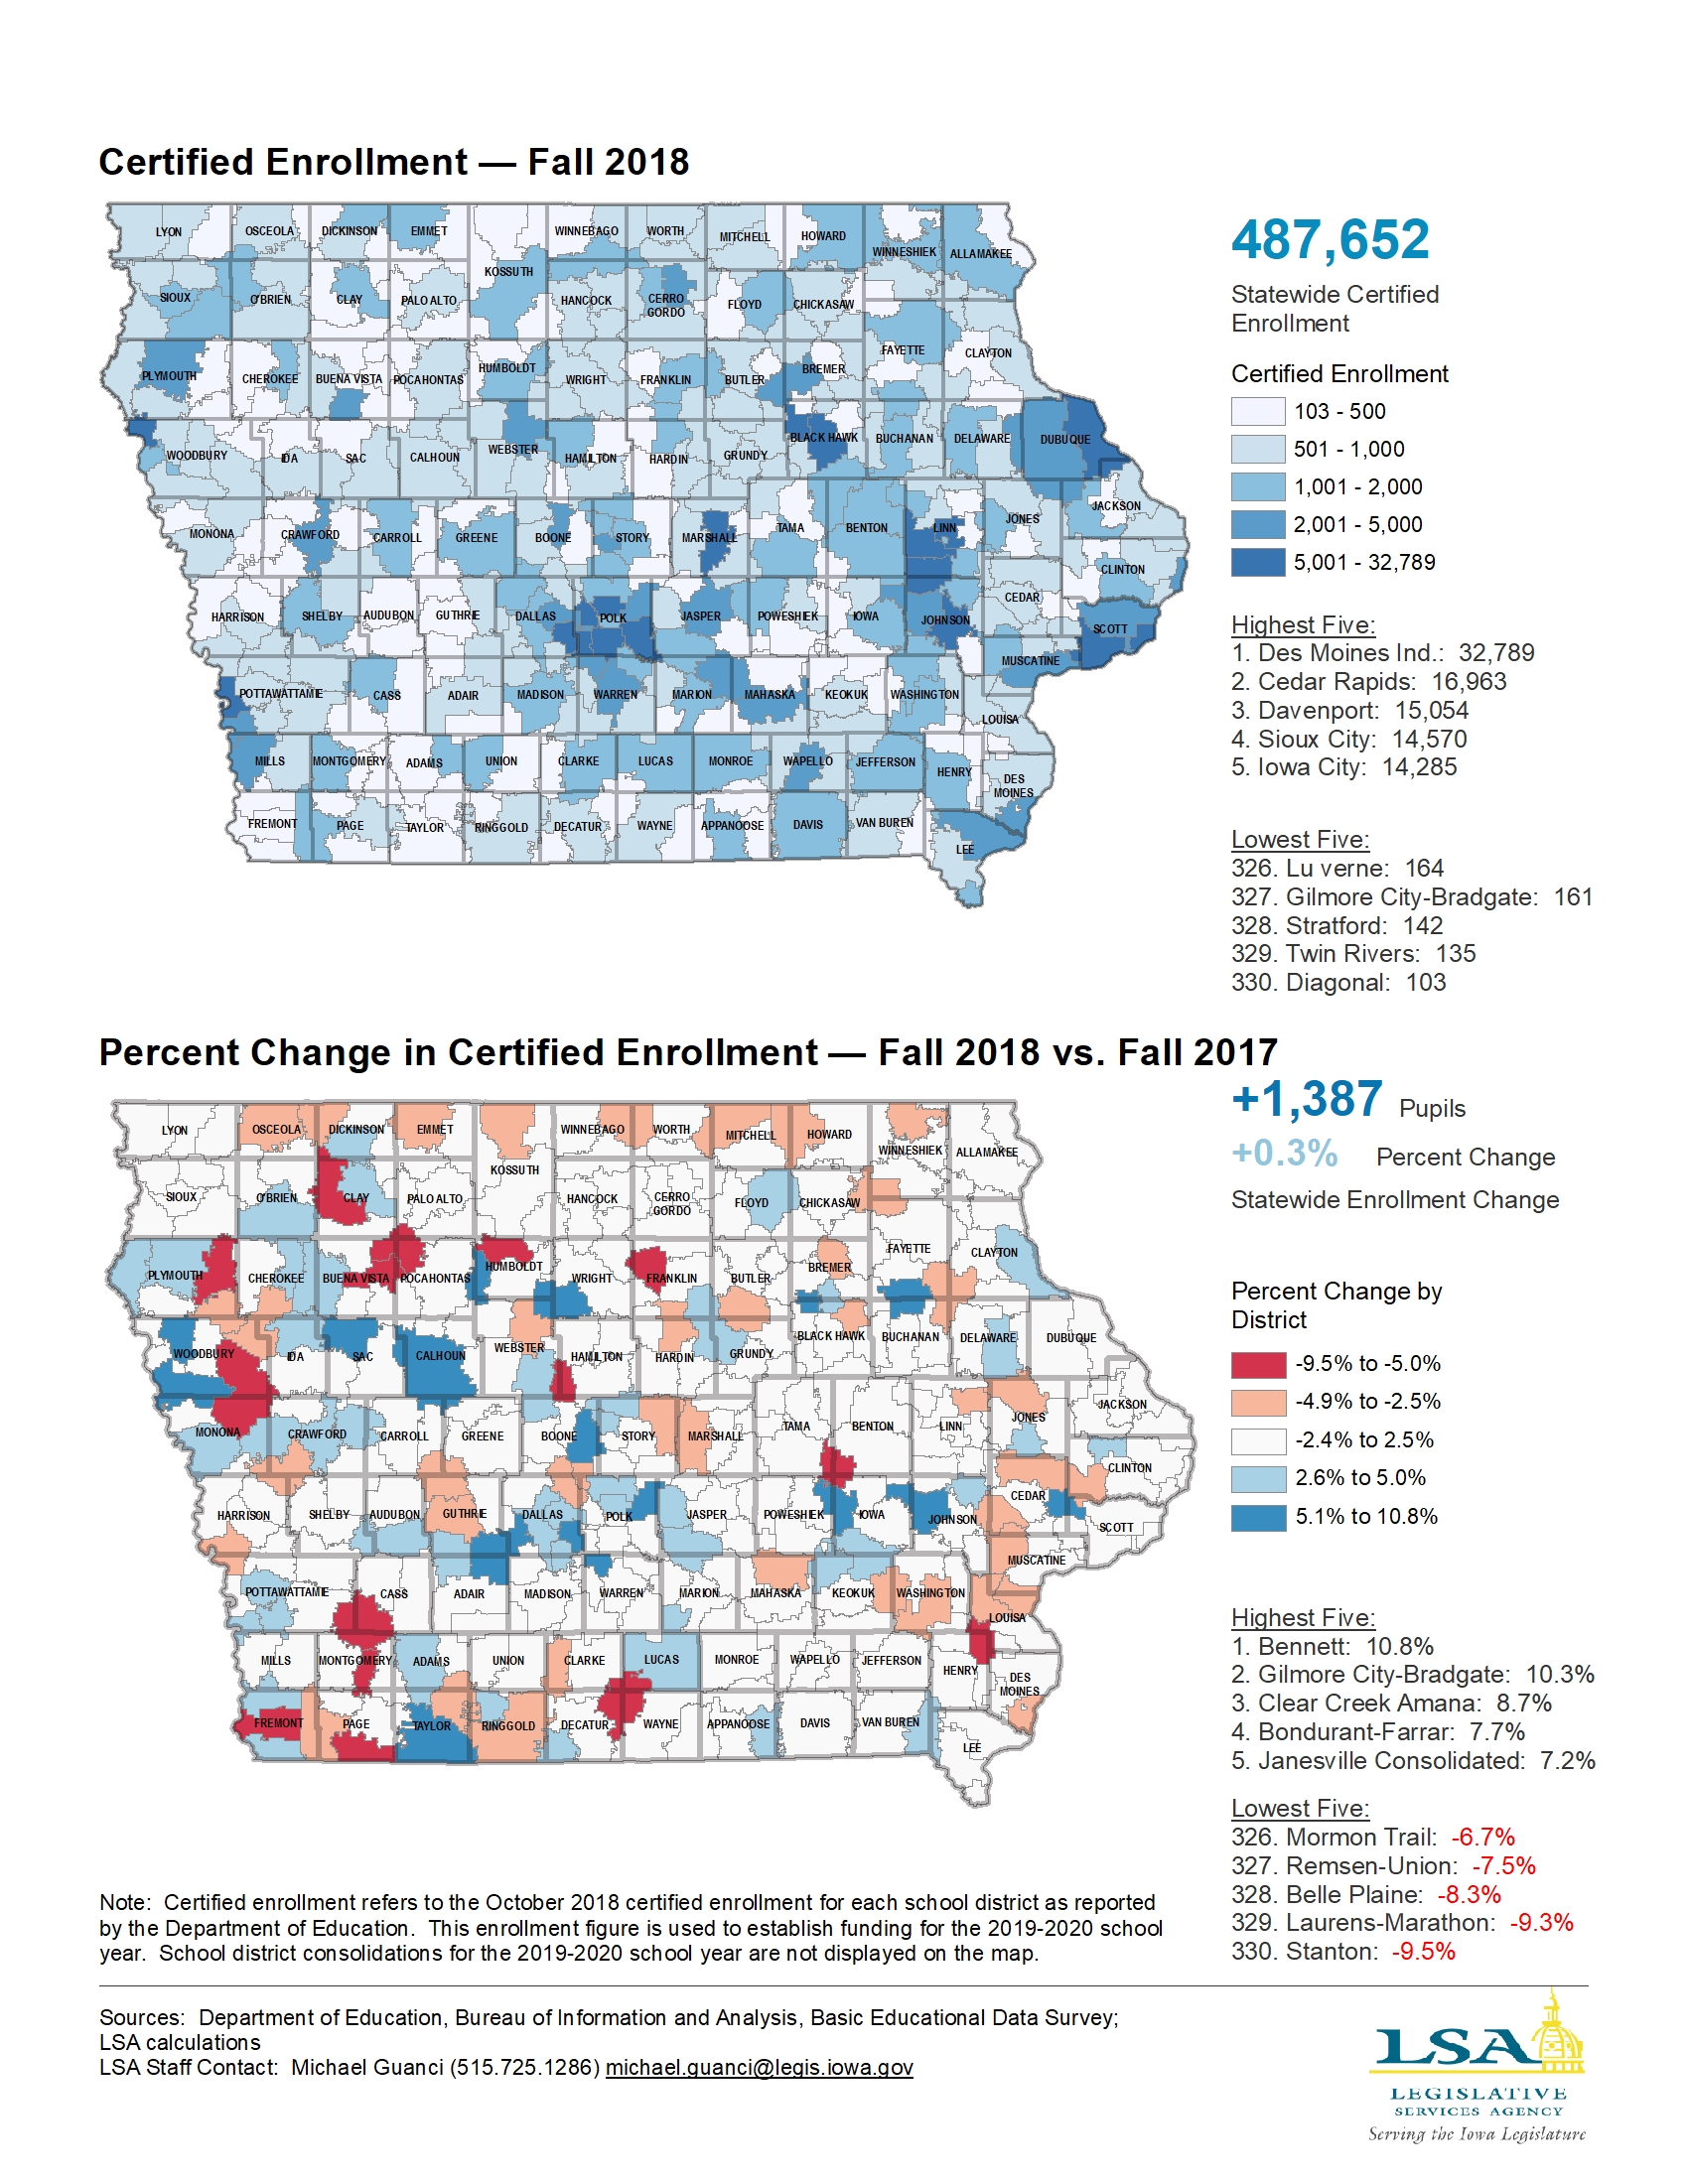
Map — Certified Enrollment and Percent Change in Enrollment
|
|
|
|
|
| 09/03/2019 |
Iowa Insights |
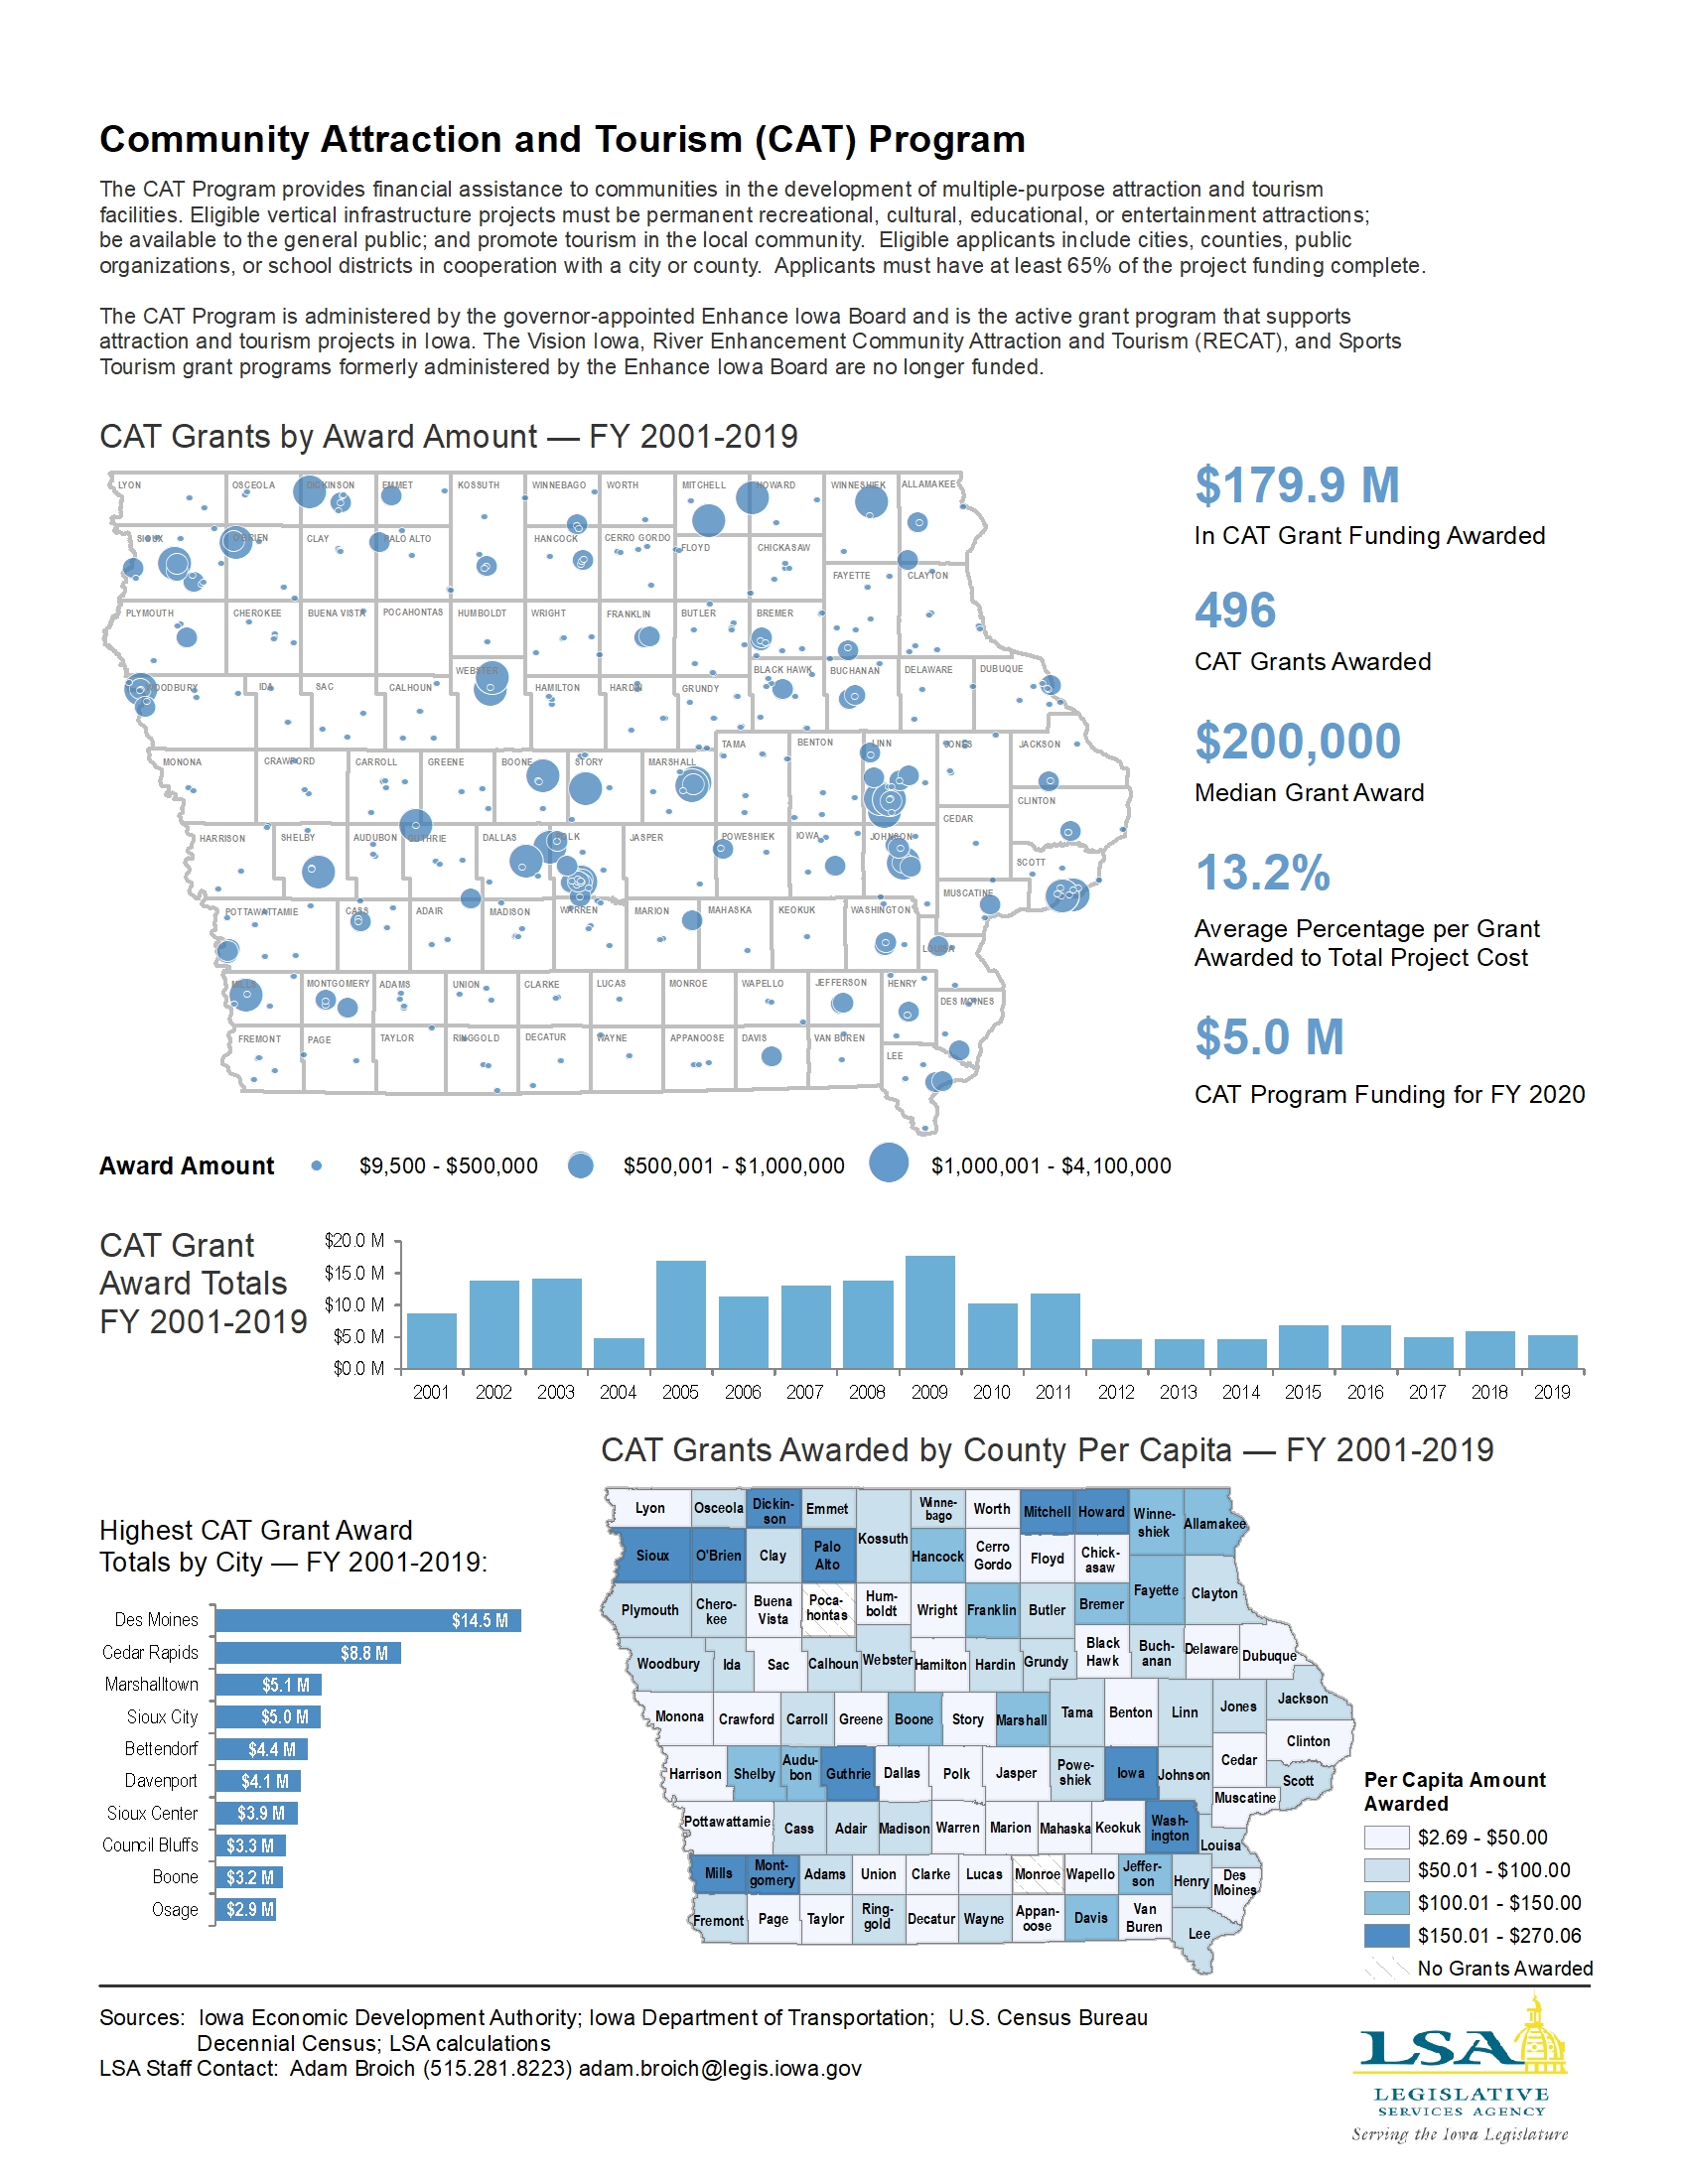
Community Attraction and Tourism (CAT) Program
|
|
|
|
|
| 08/26/2019 |
Iowa Insights |
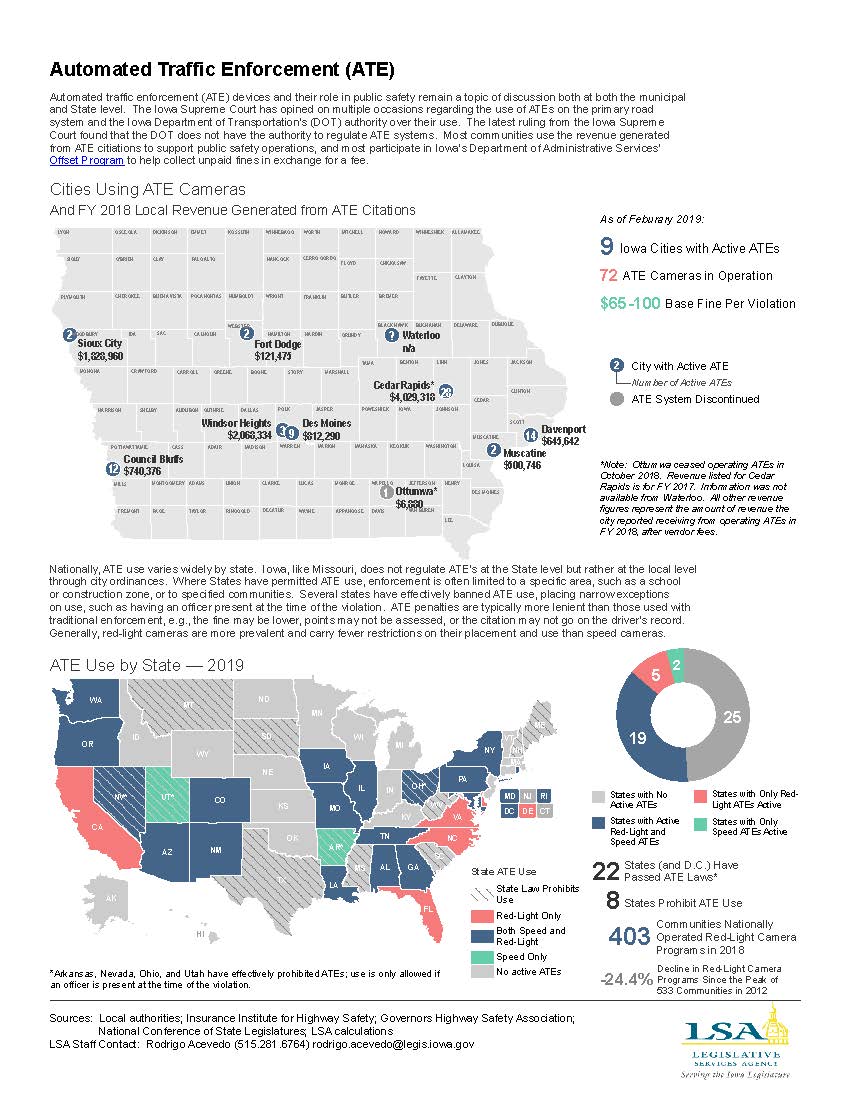
Automated Traffic Enforcement
|
|
|
|
|
| 08/19/2019 |
Iowa Insights |
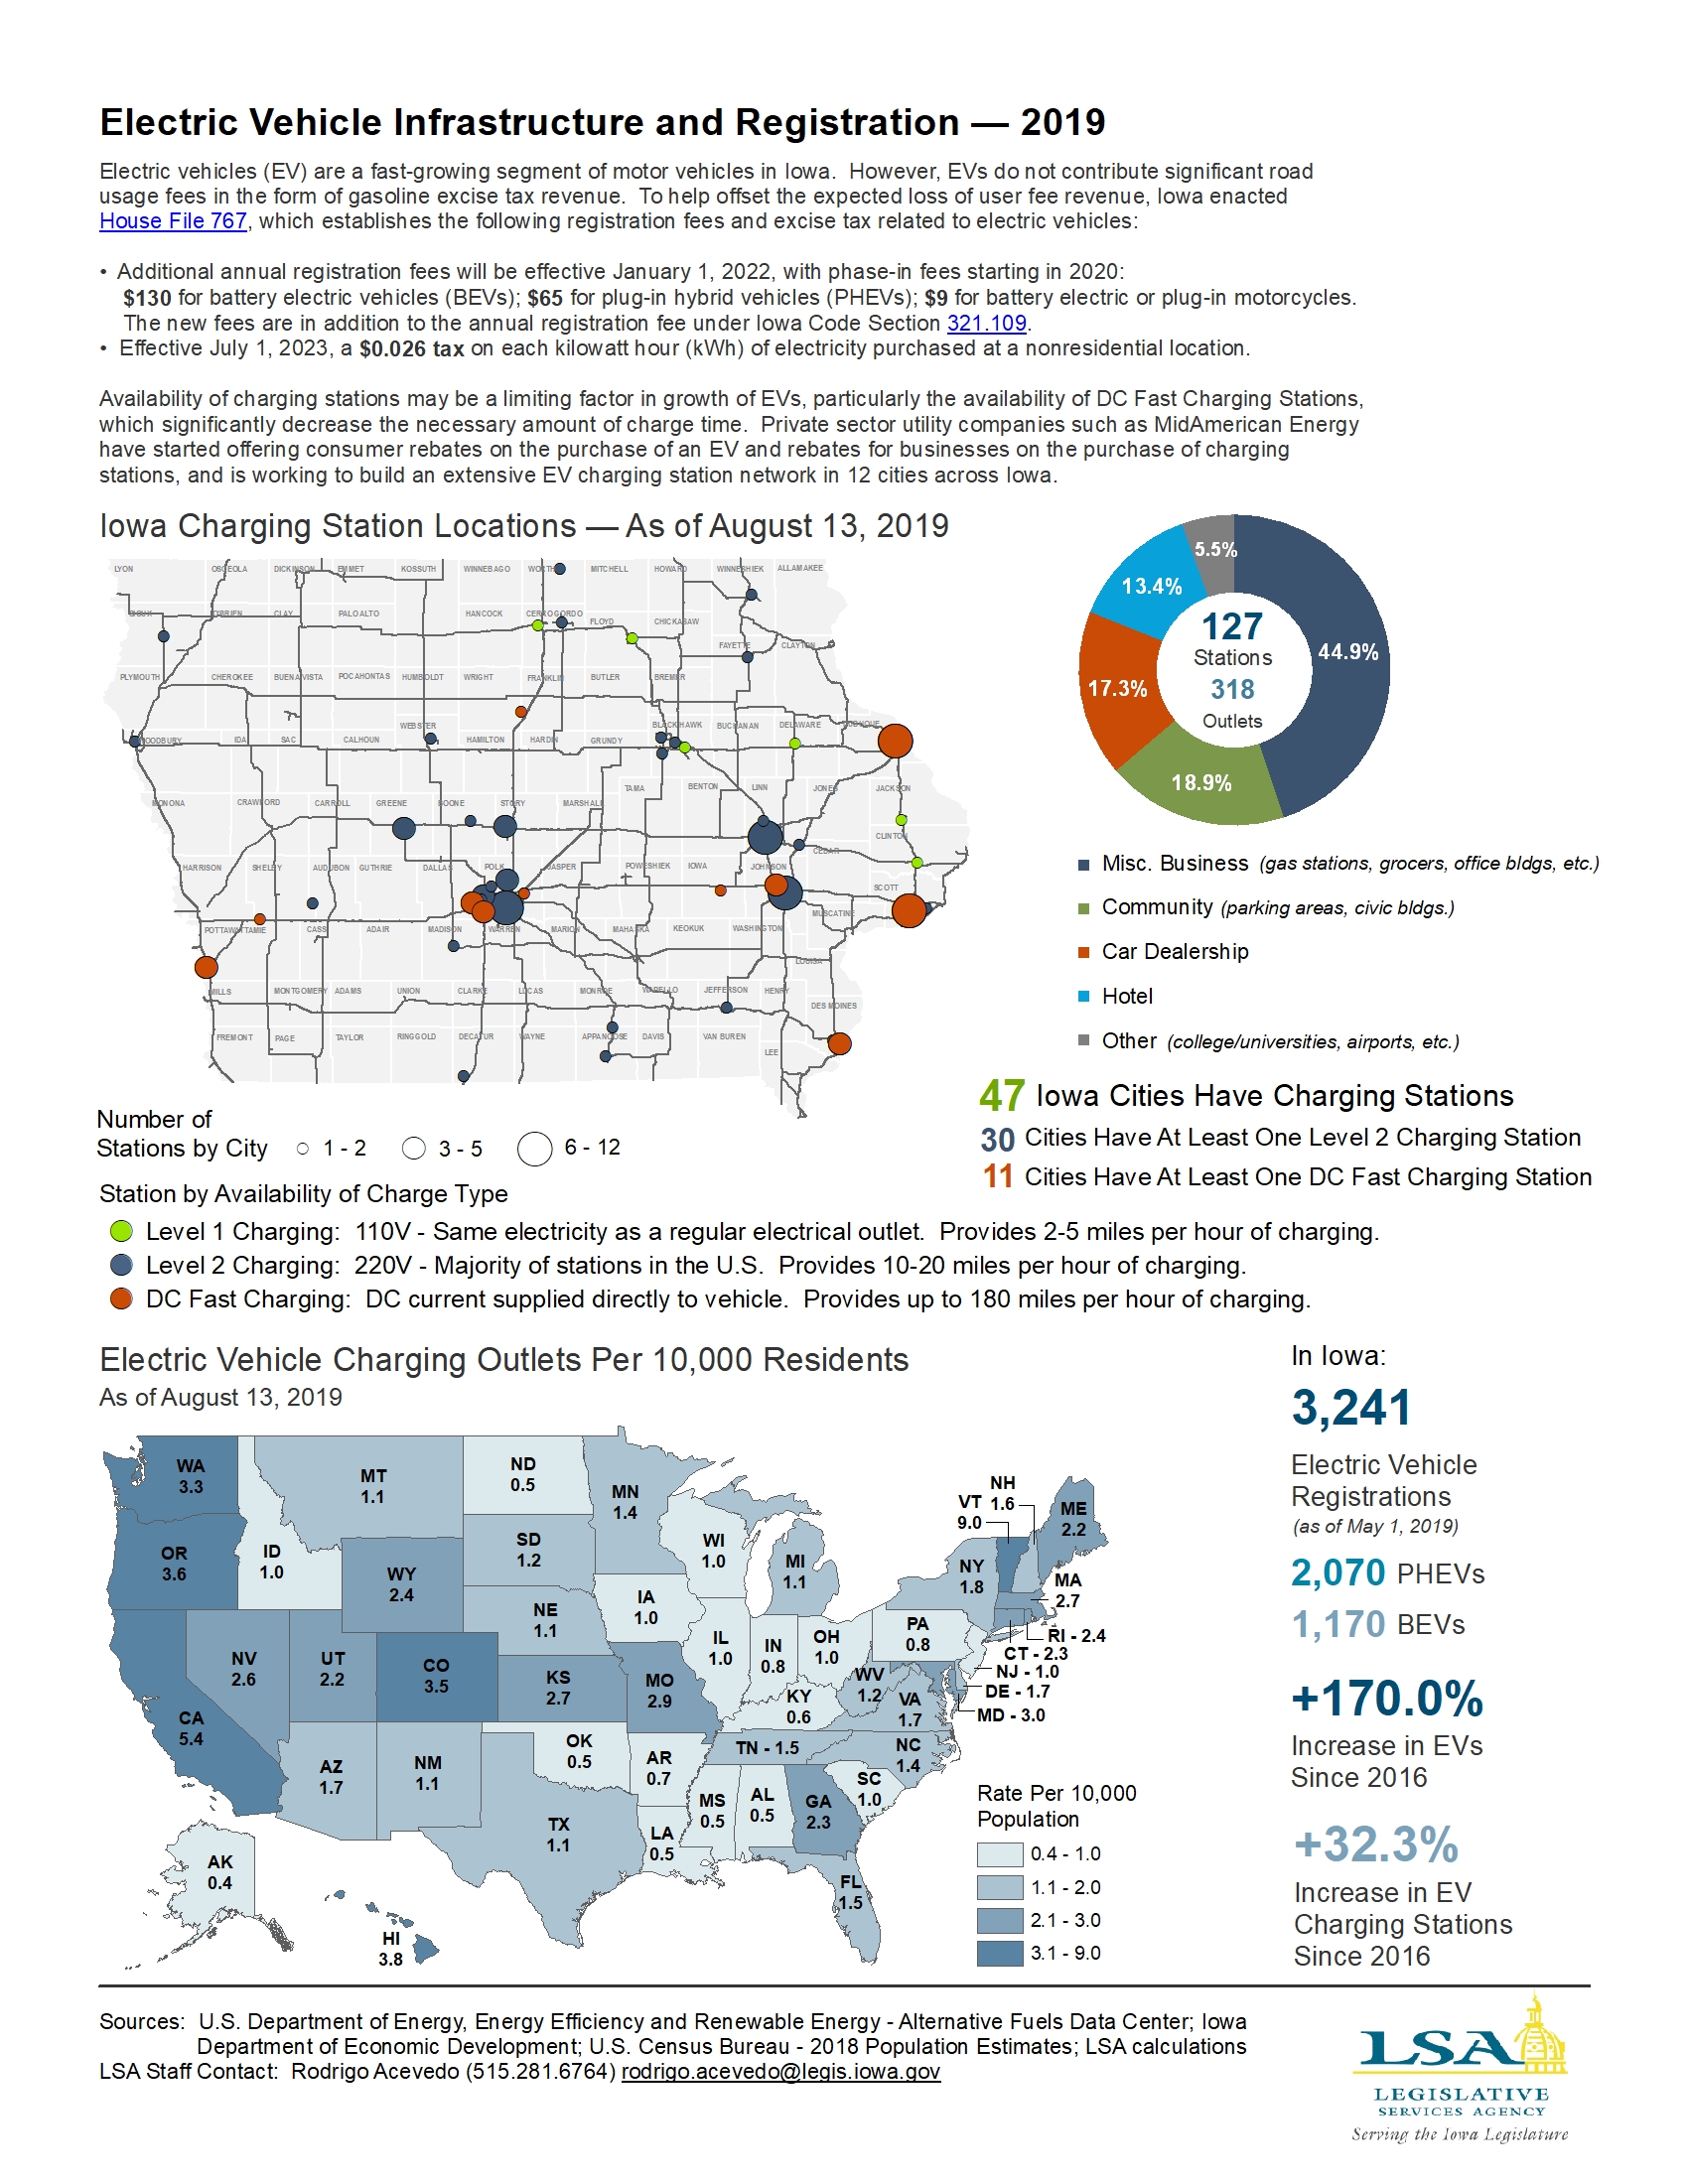
Electric Vehicle Infrastructure and Registration — 2019
|
|
|
|
|
| 08/12/2019 |
Iowa Insights |
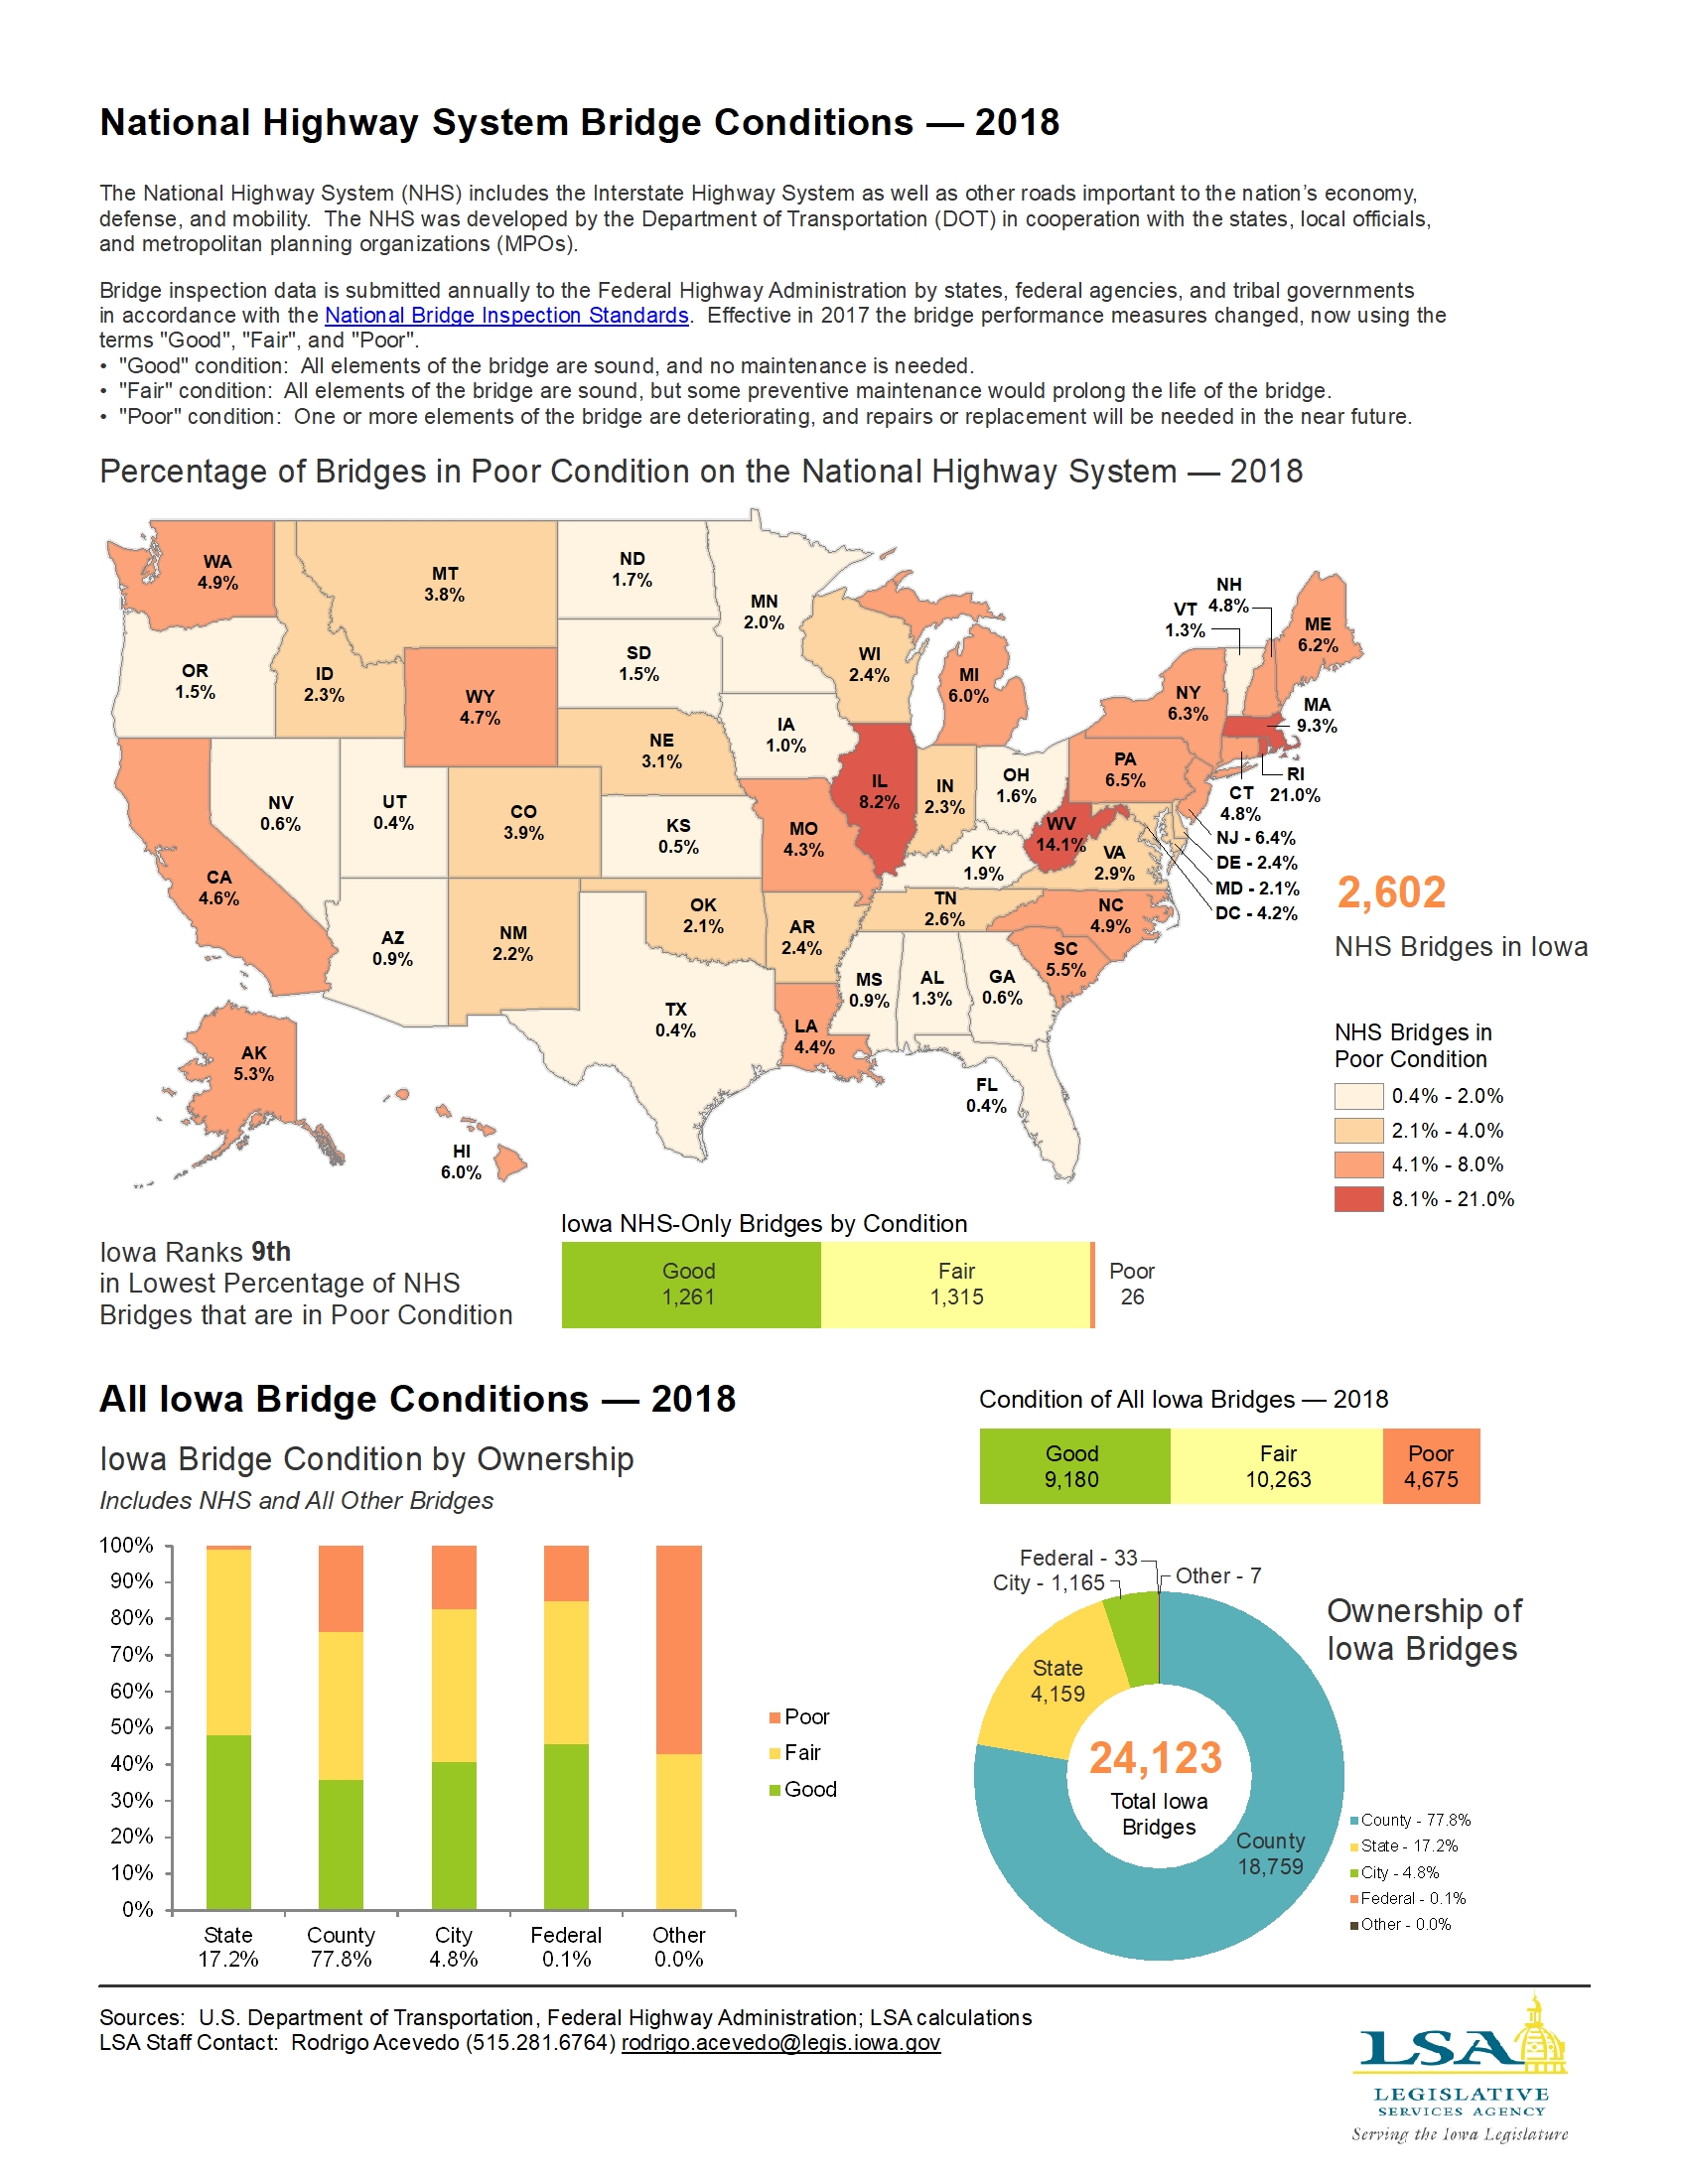
National Highway System Bridge Conditions — 2018
|
|
|
|
|
| 07/29/2019 |
Iowa Insights |
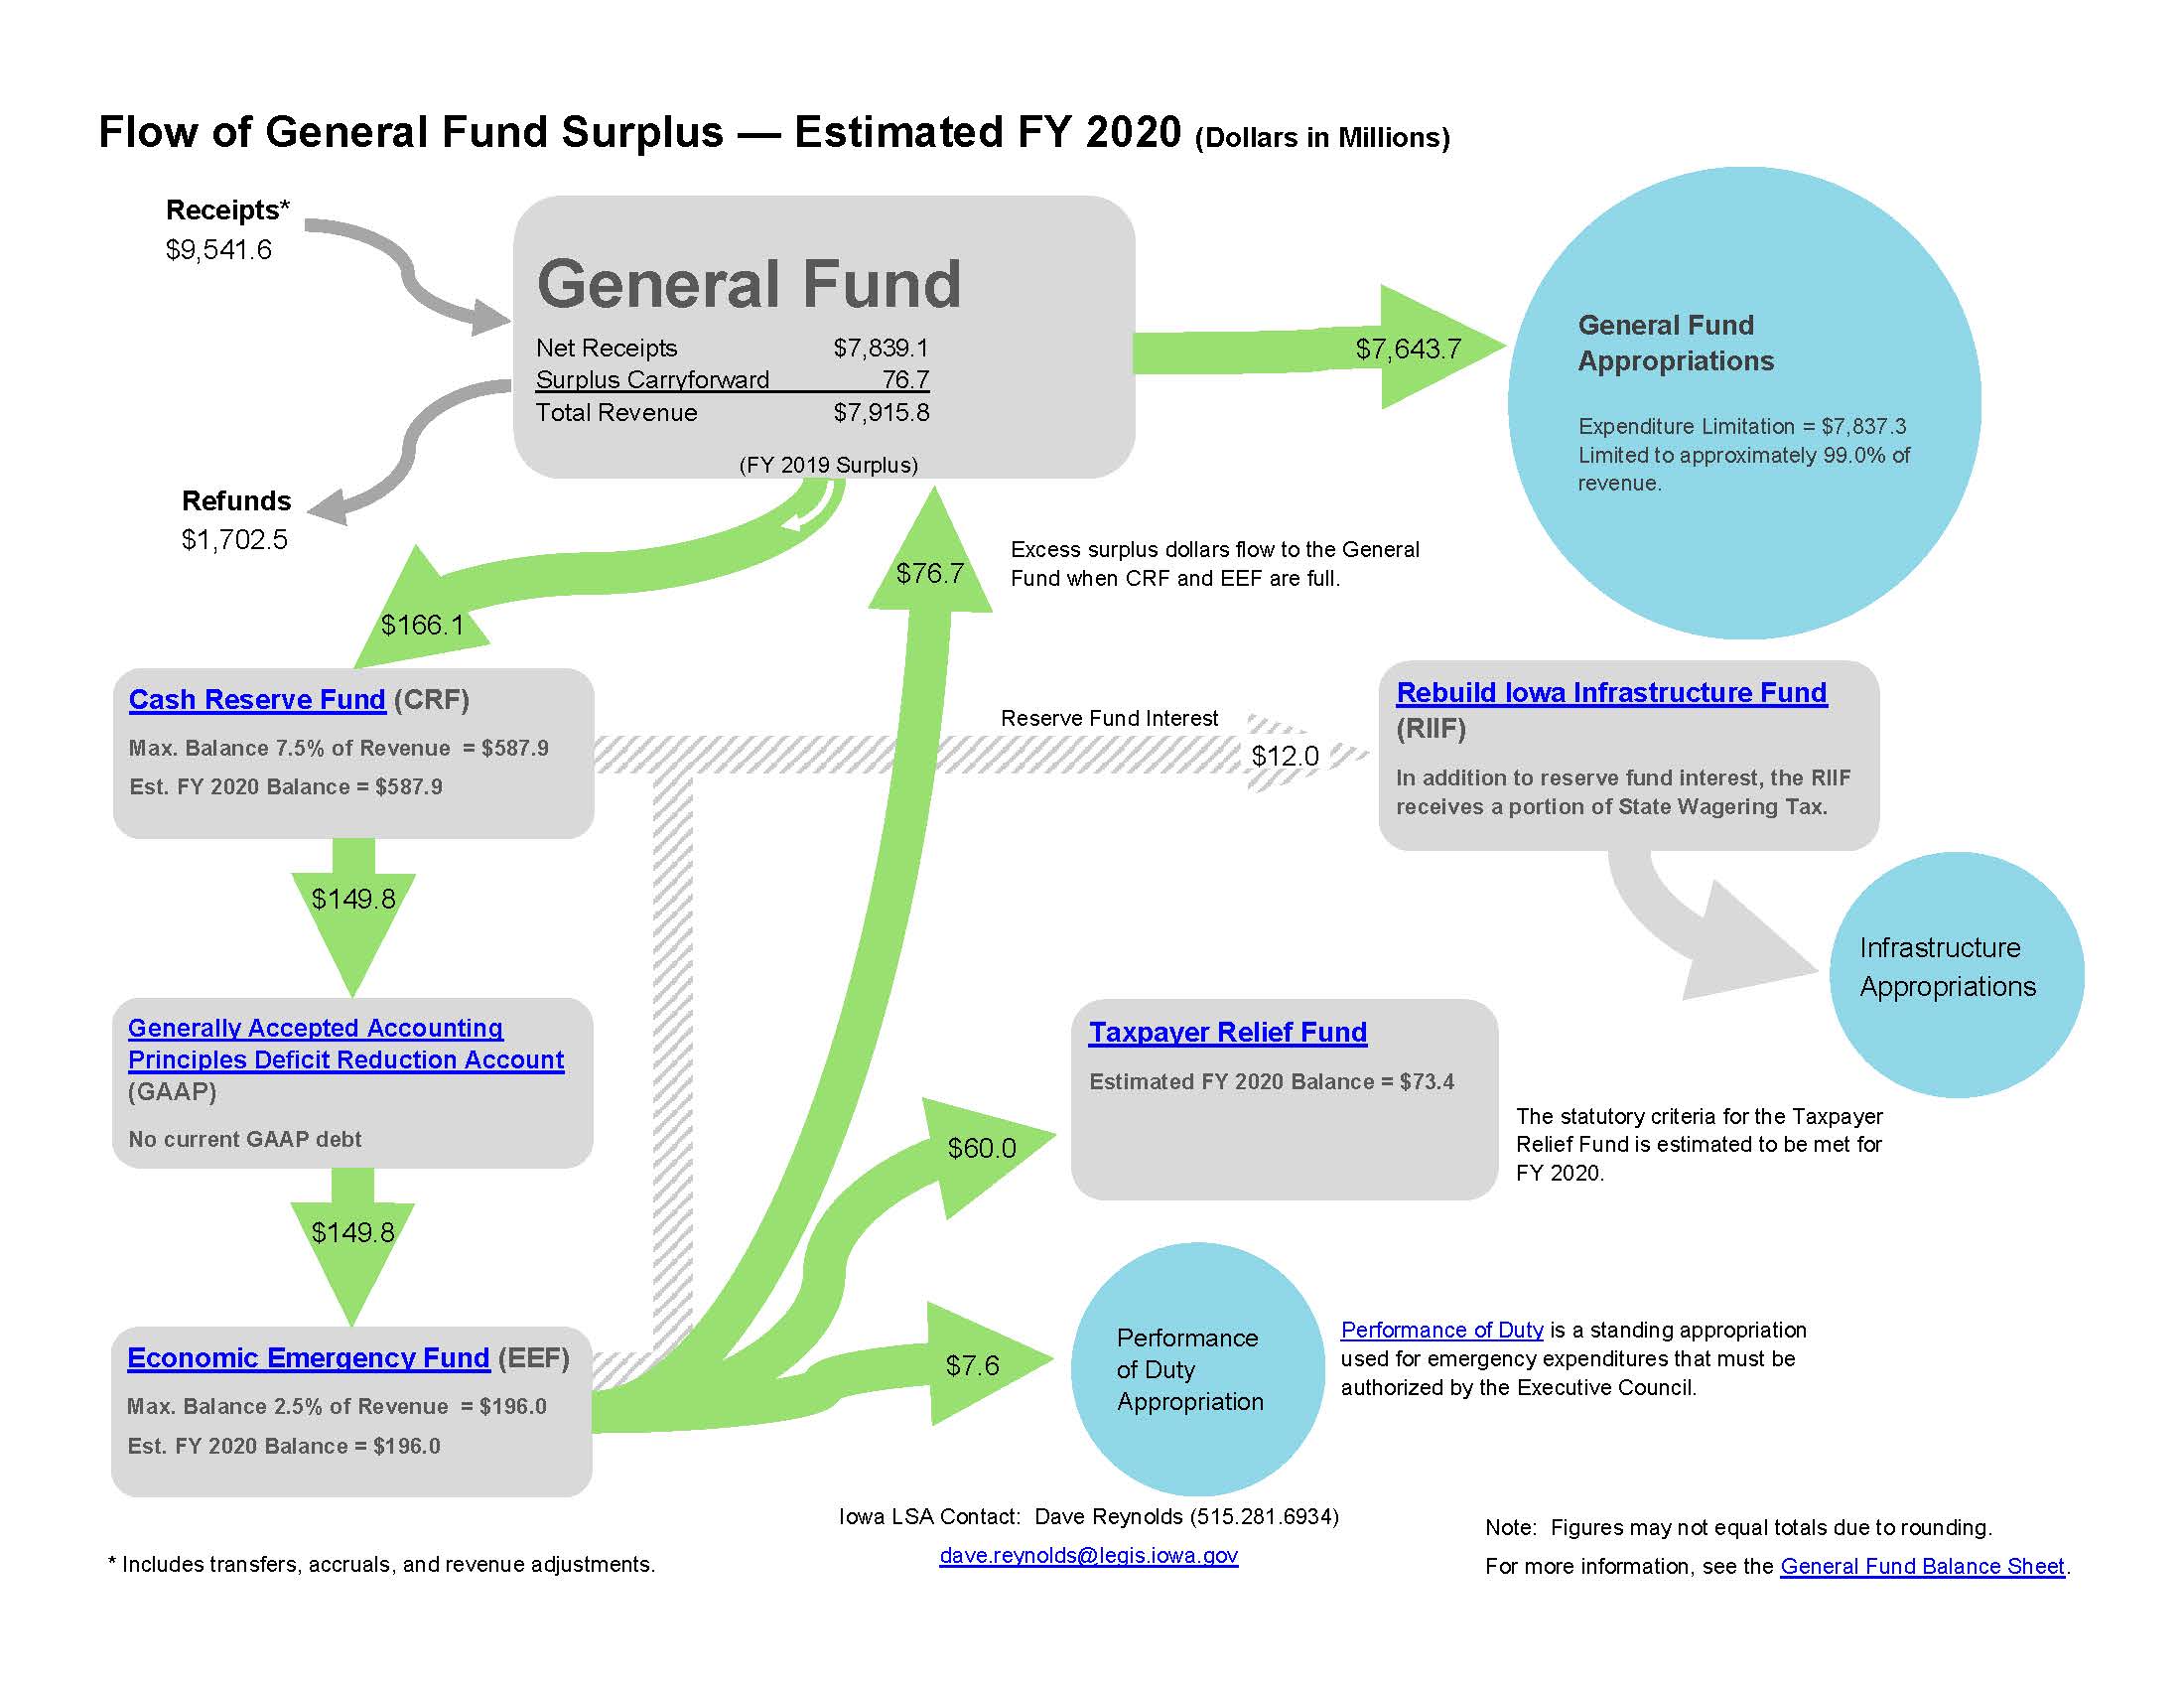
Flow of General Fund Surplus
|
|
|
|
|
| 07/22/2019 |
Iowa Insights |
FY 2020 Estimated Total Net General Fund Receipts

|
|
|
|
|
| 07/15/2019 |
Iowa Insights |
FY 2020 Estimated General Fund Appropriations
|
|
|
|
|
| 07/01/2019 |
Iowa Insights |
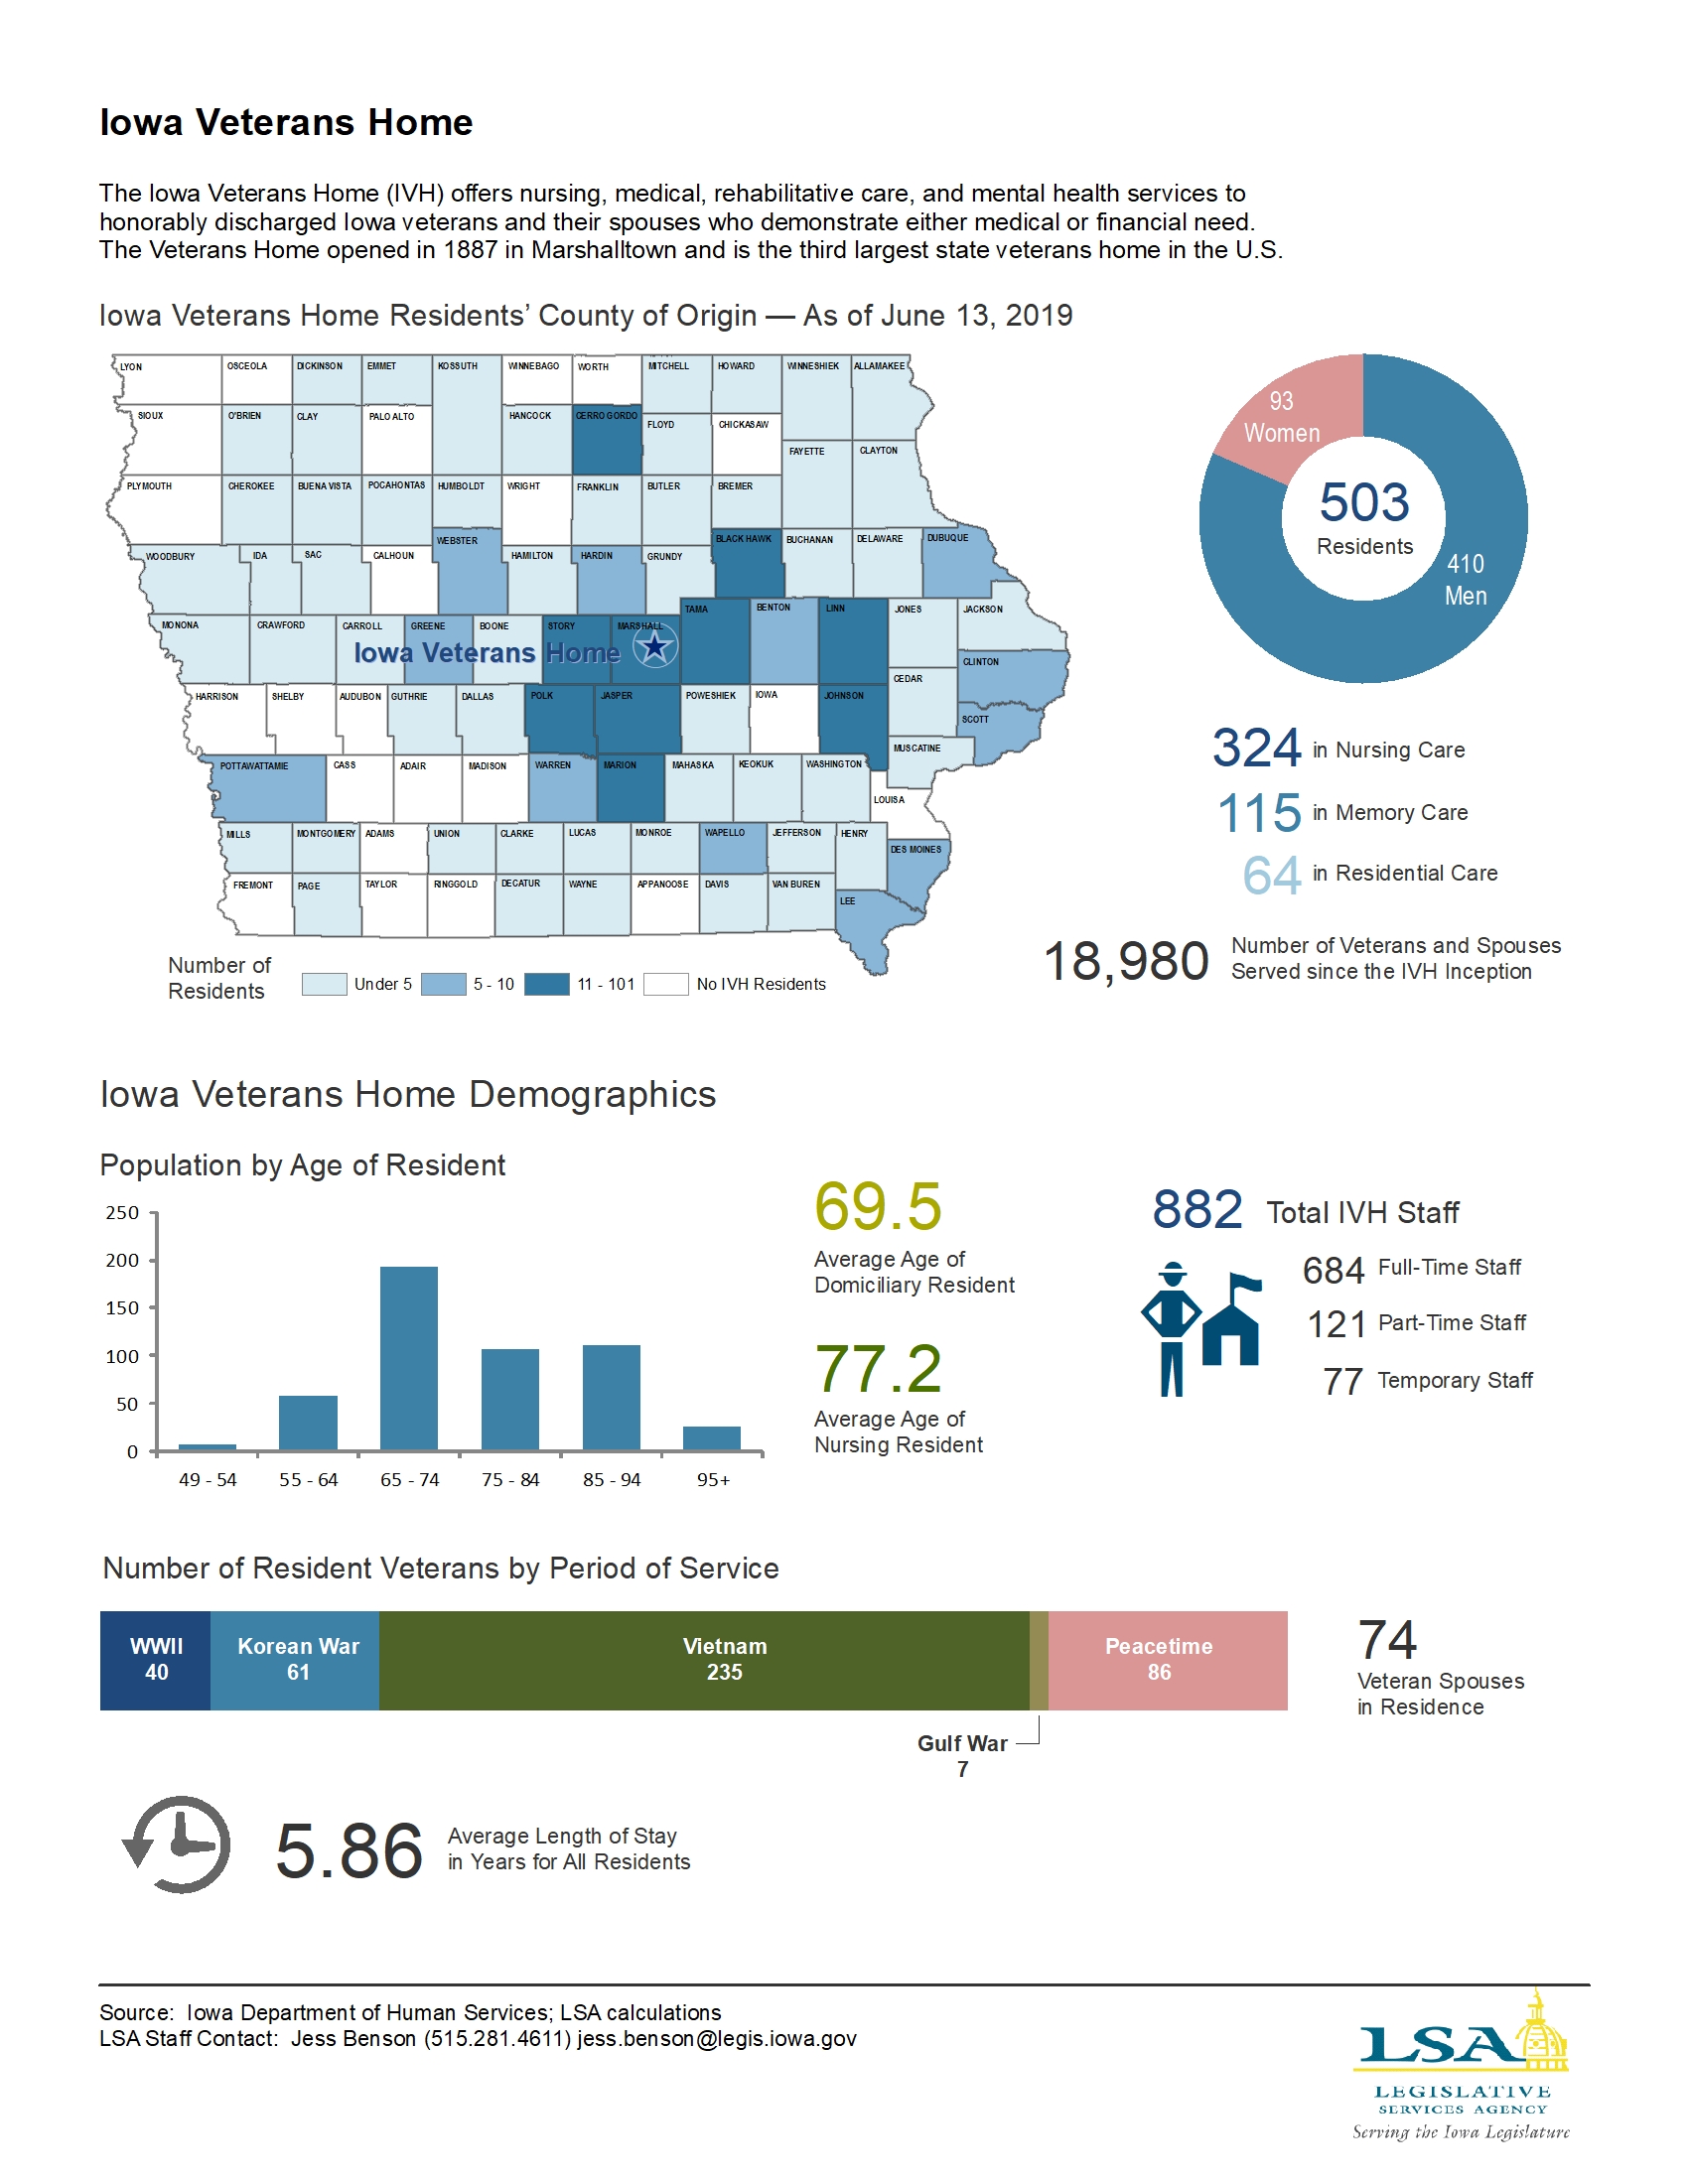
Iowa Veterans Home
|
|
|
|
|
| 06/24/2019 |
Iowa Insights |
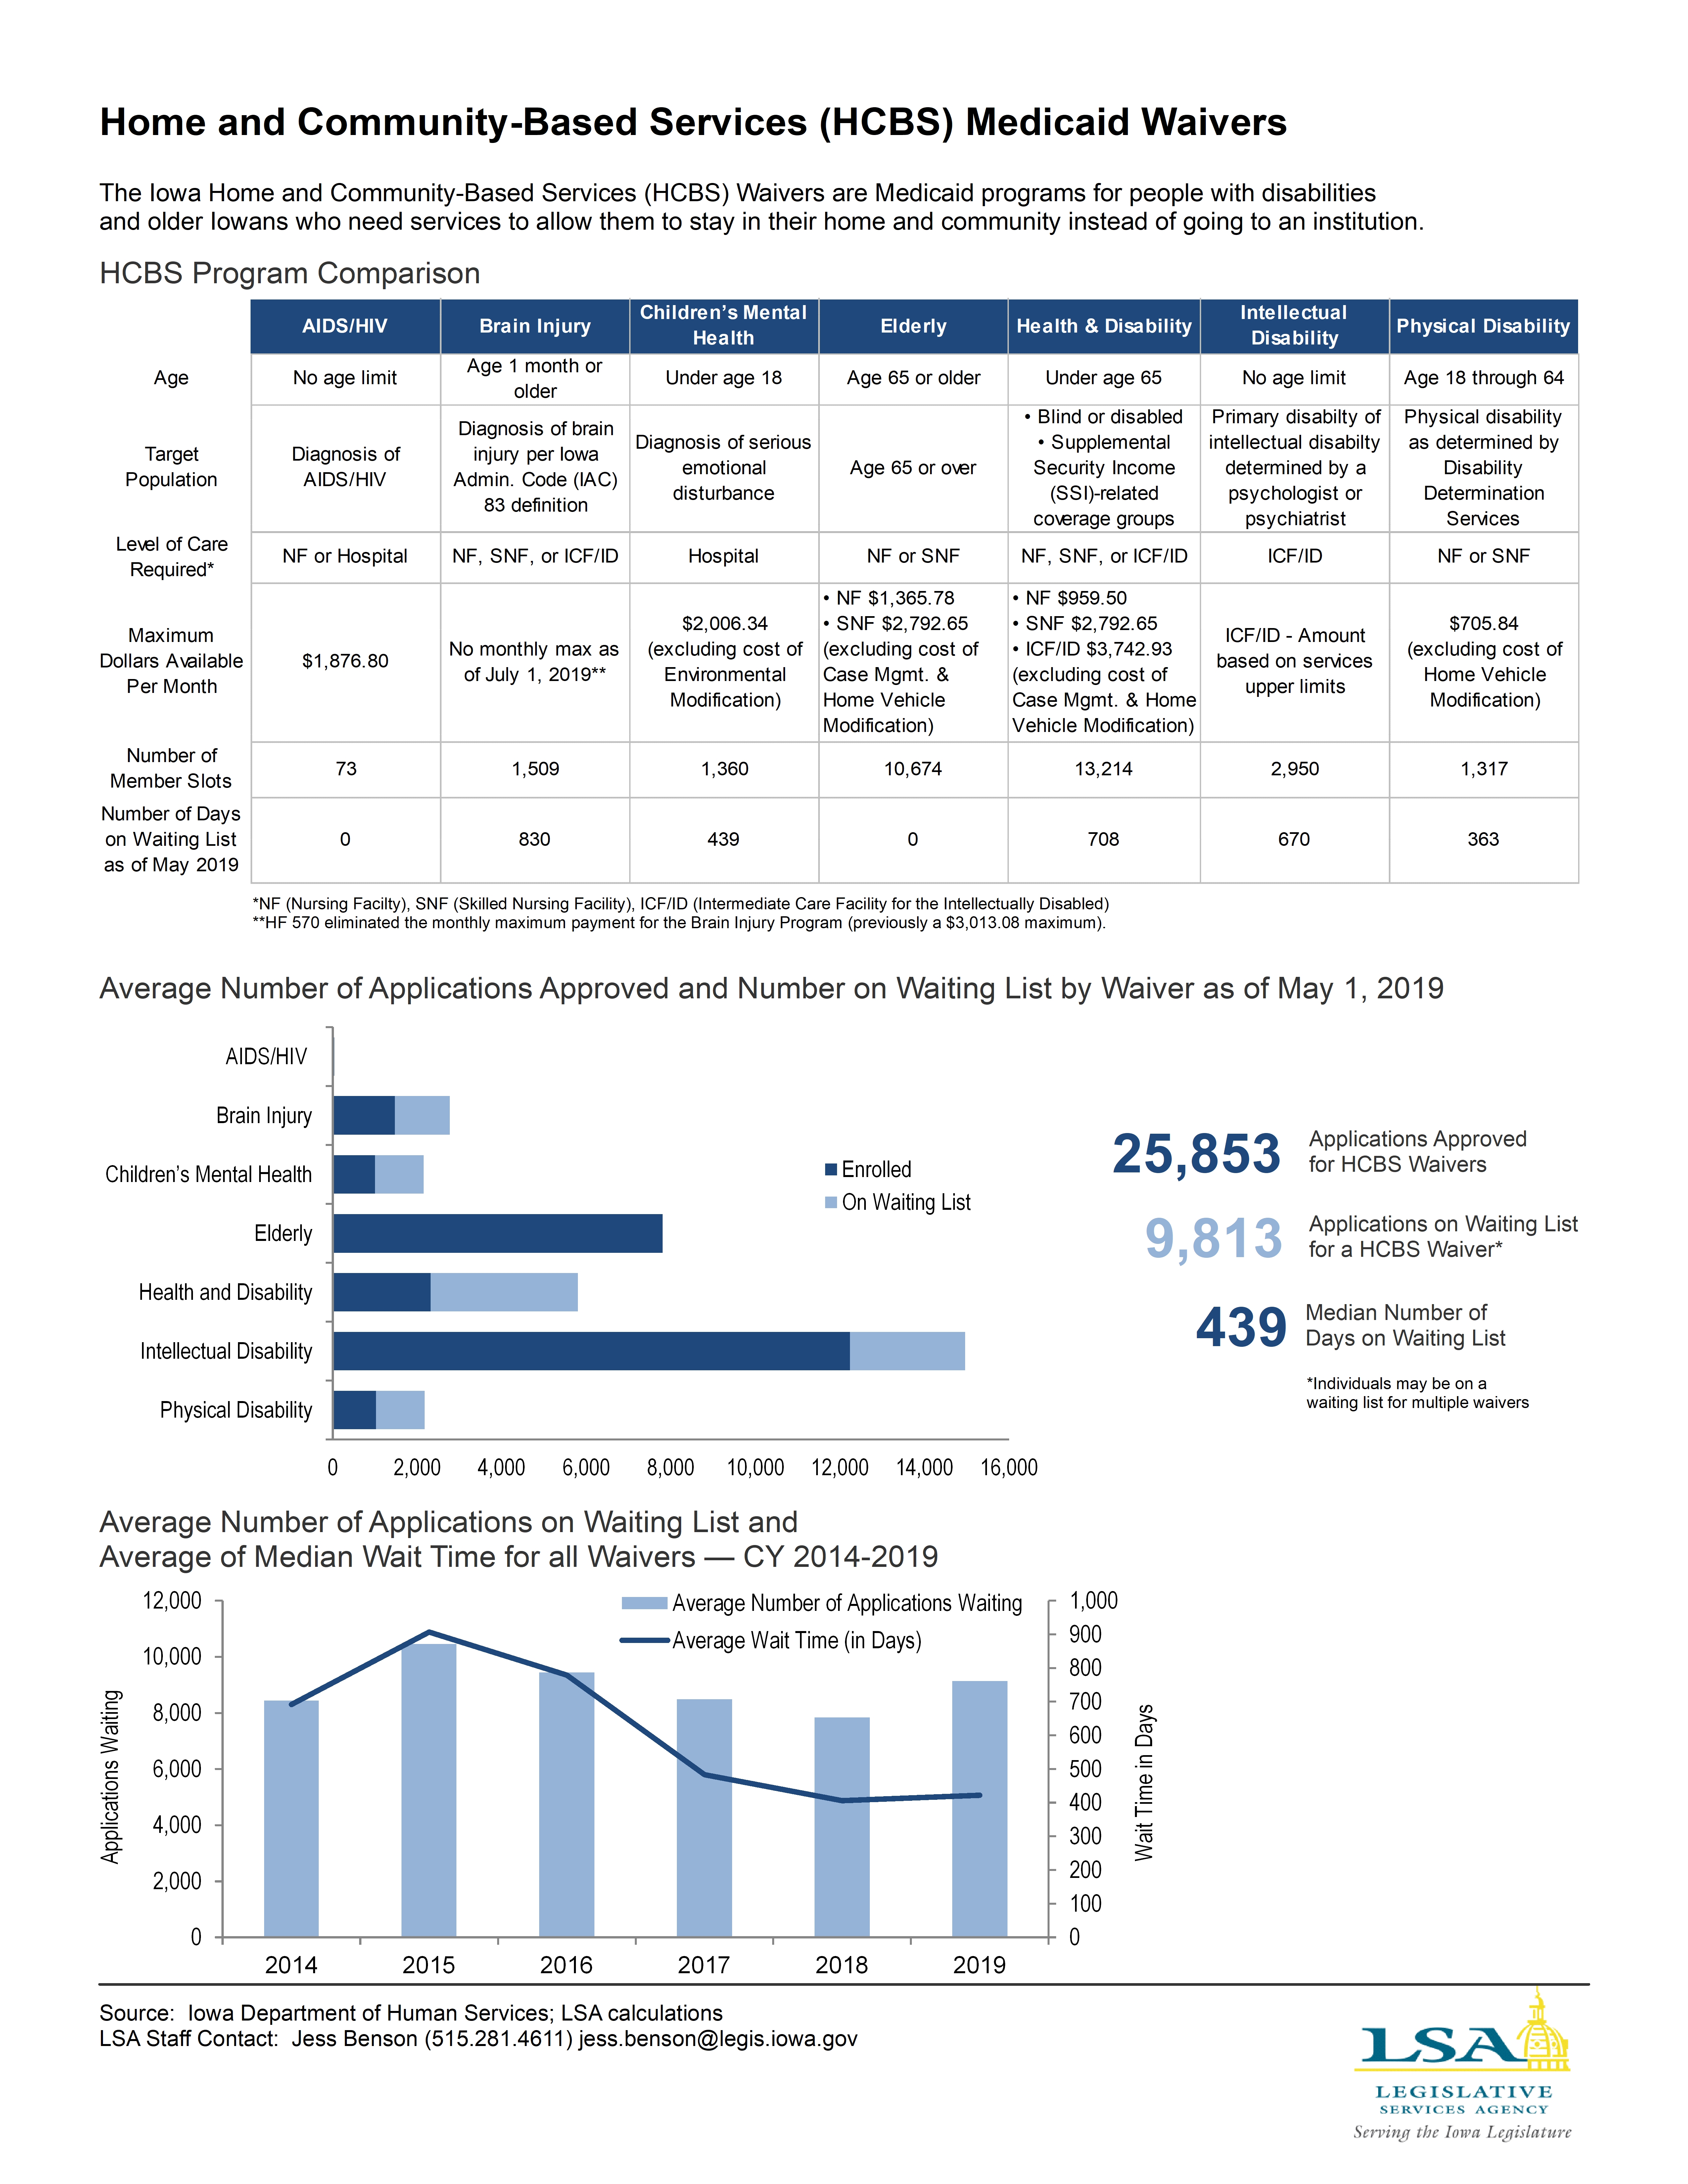
Home- and Community-Based Services (HCBS) Medicaid Waivers
|
|
|
|
|
| 06/17/2019 |
Iowa Insights |
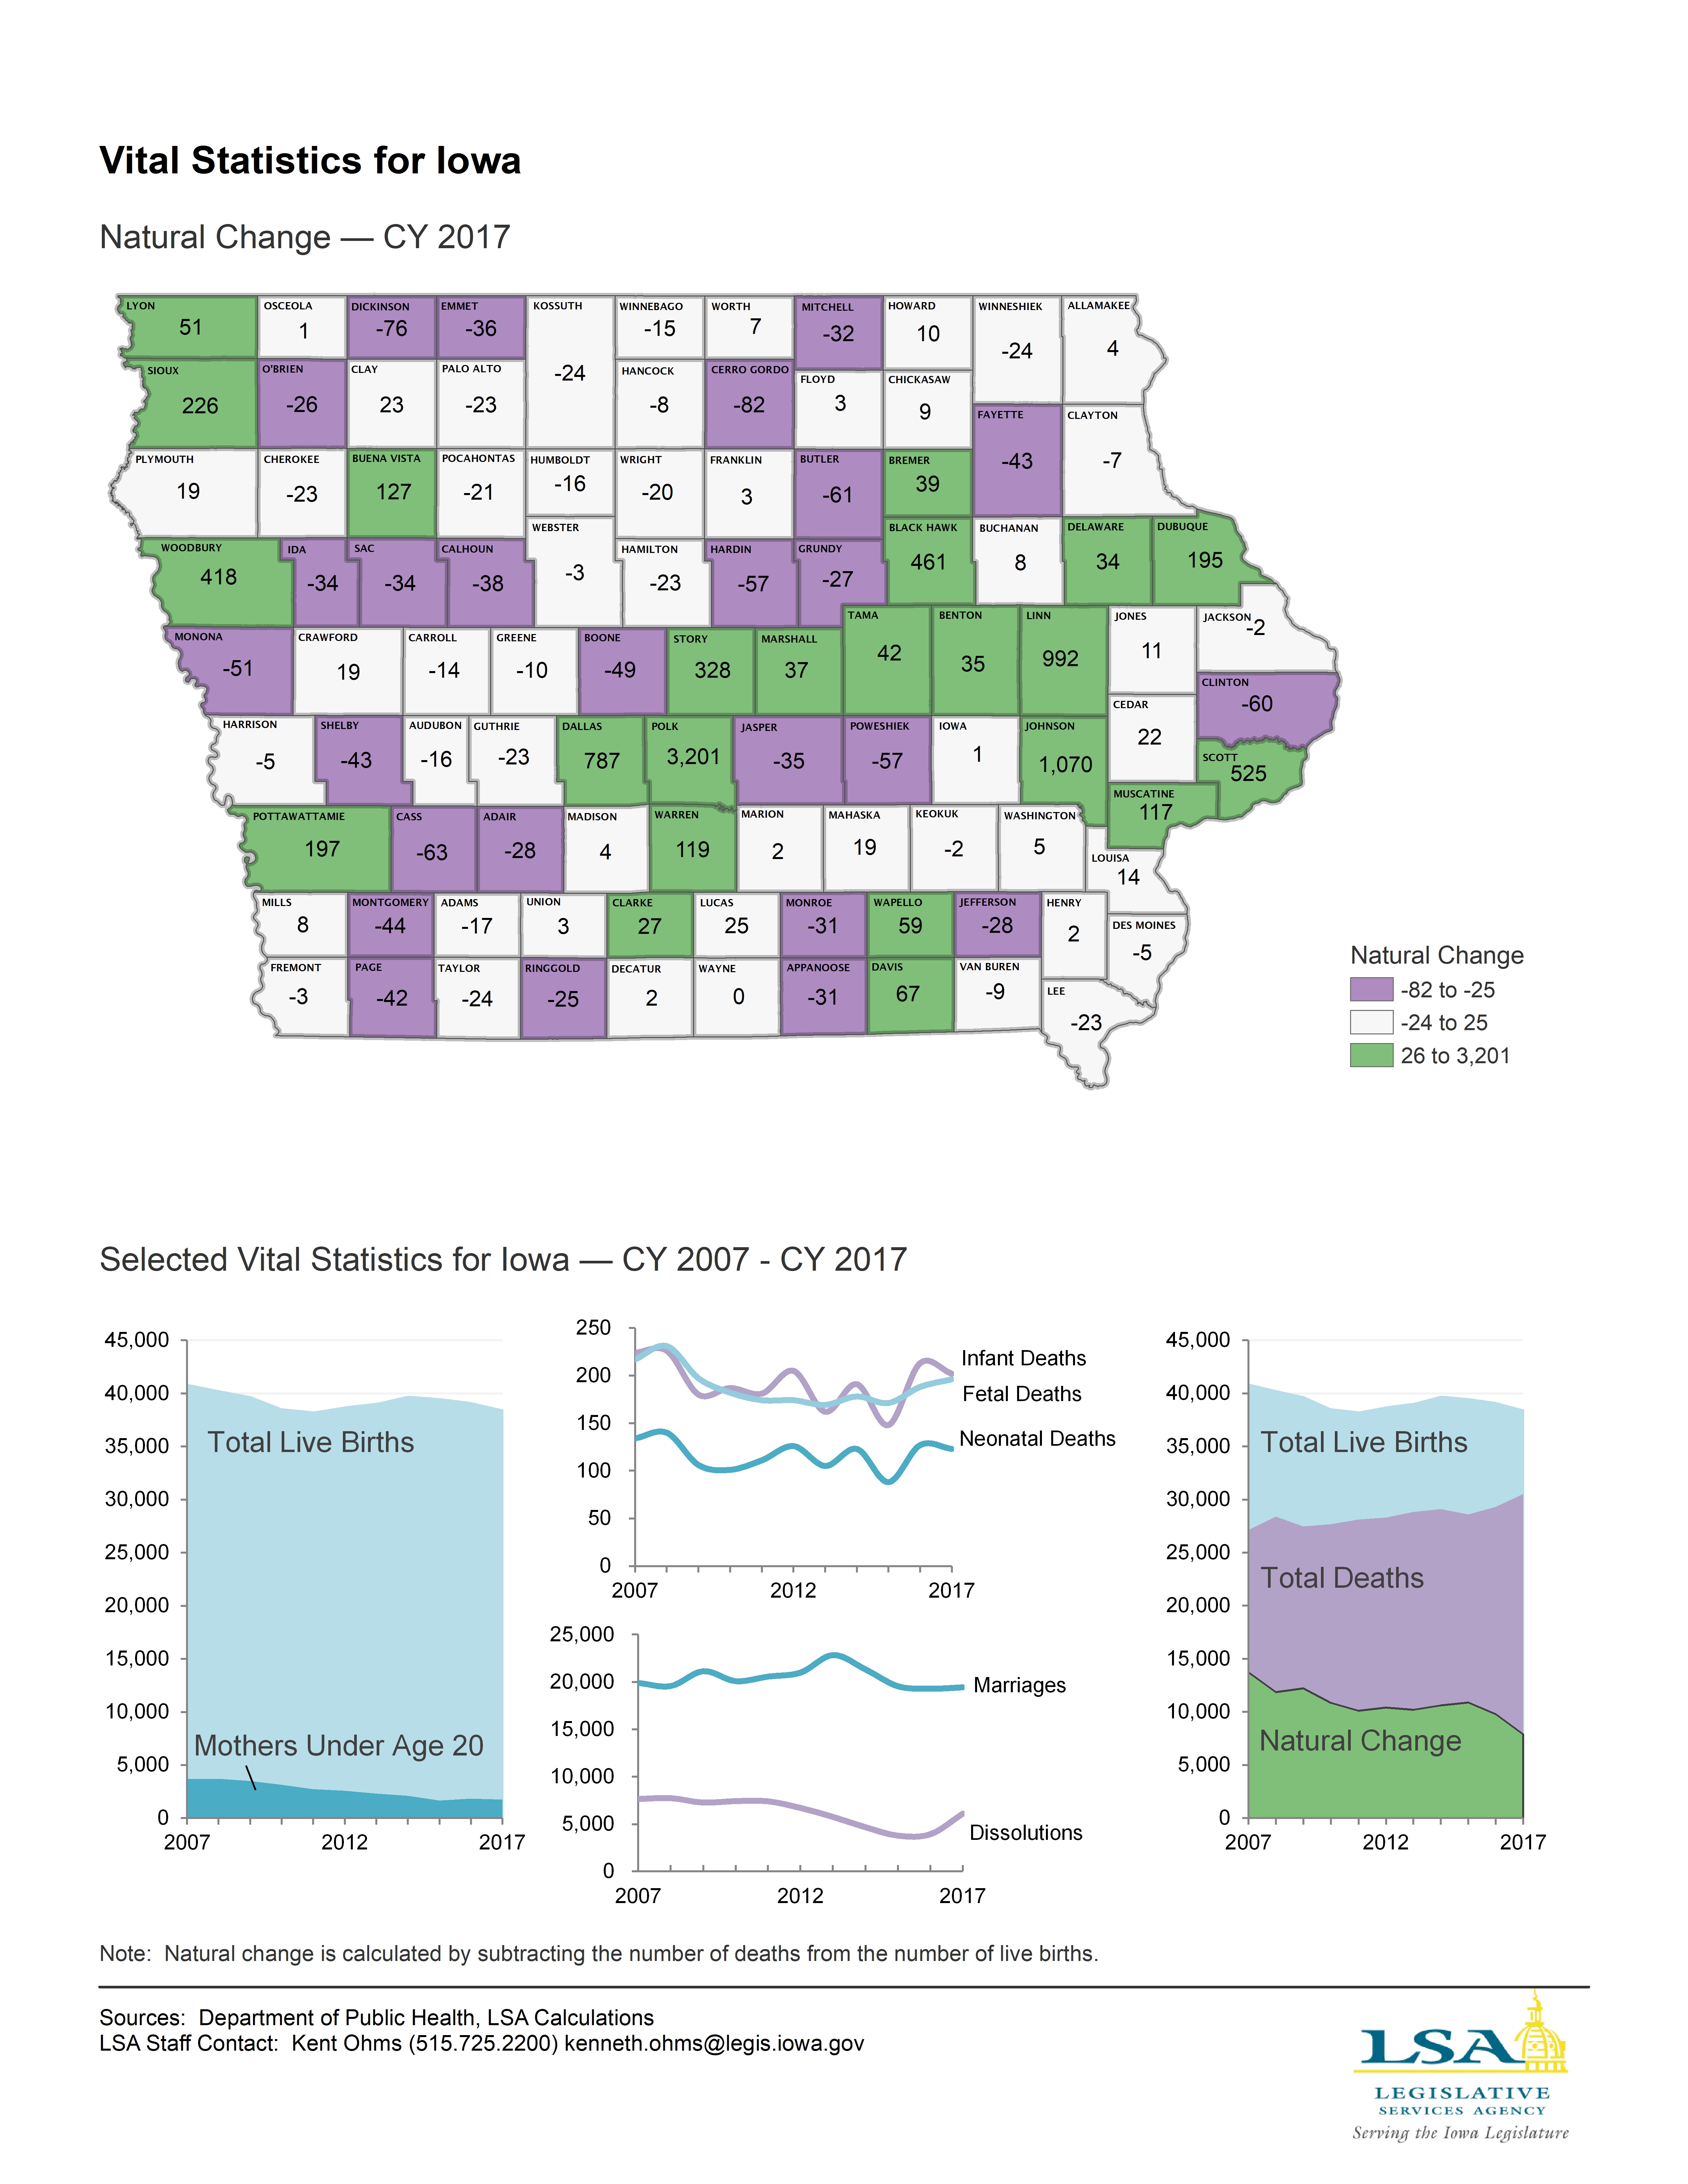
Vital Statistics for Iowa
|
|
|
|
|
| 06/10/2019 |
Iowa Insights |
Percent Change in the Number of Households in the Food Assistance Program by Count

|
|
|
|
|
| 06/03/2019 |
Iowa Insights |
Iowa Farmers Markets and Farm Stands — 2019

|
|
|
|
|
| 05/28/2019 |
Iowa Insights |
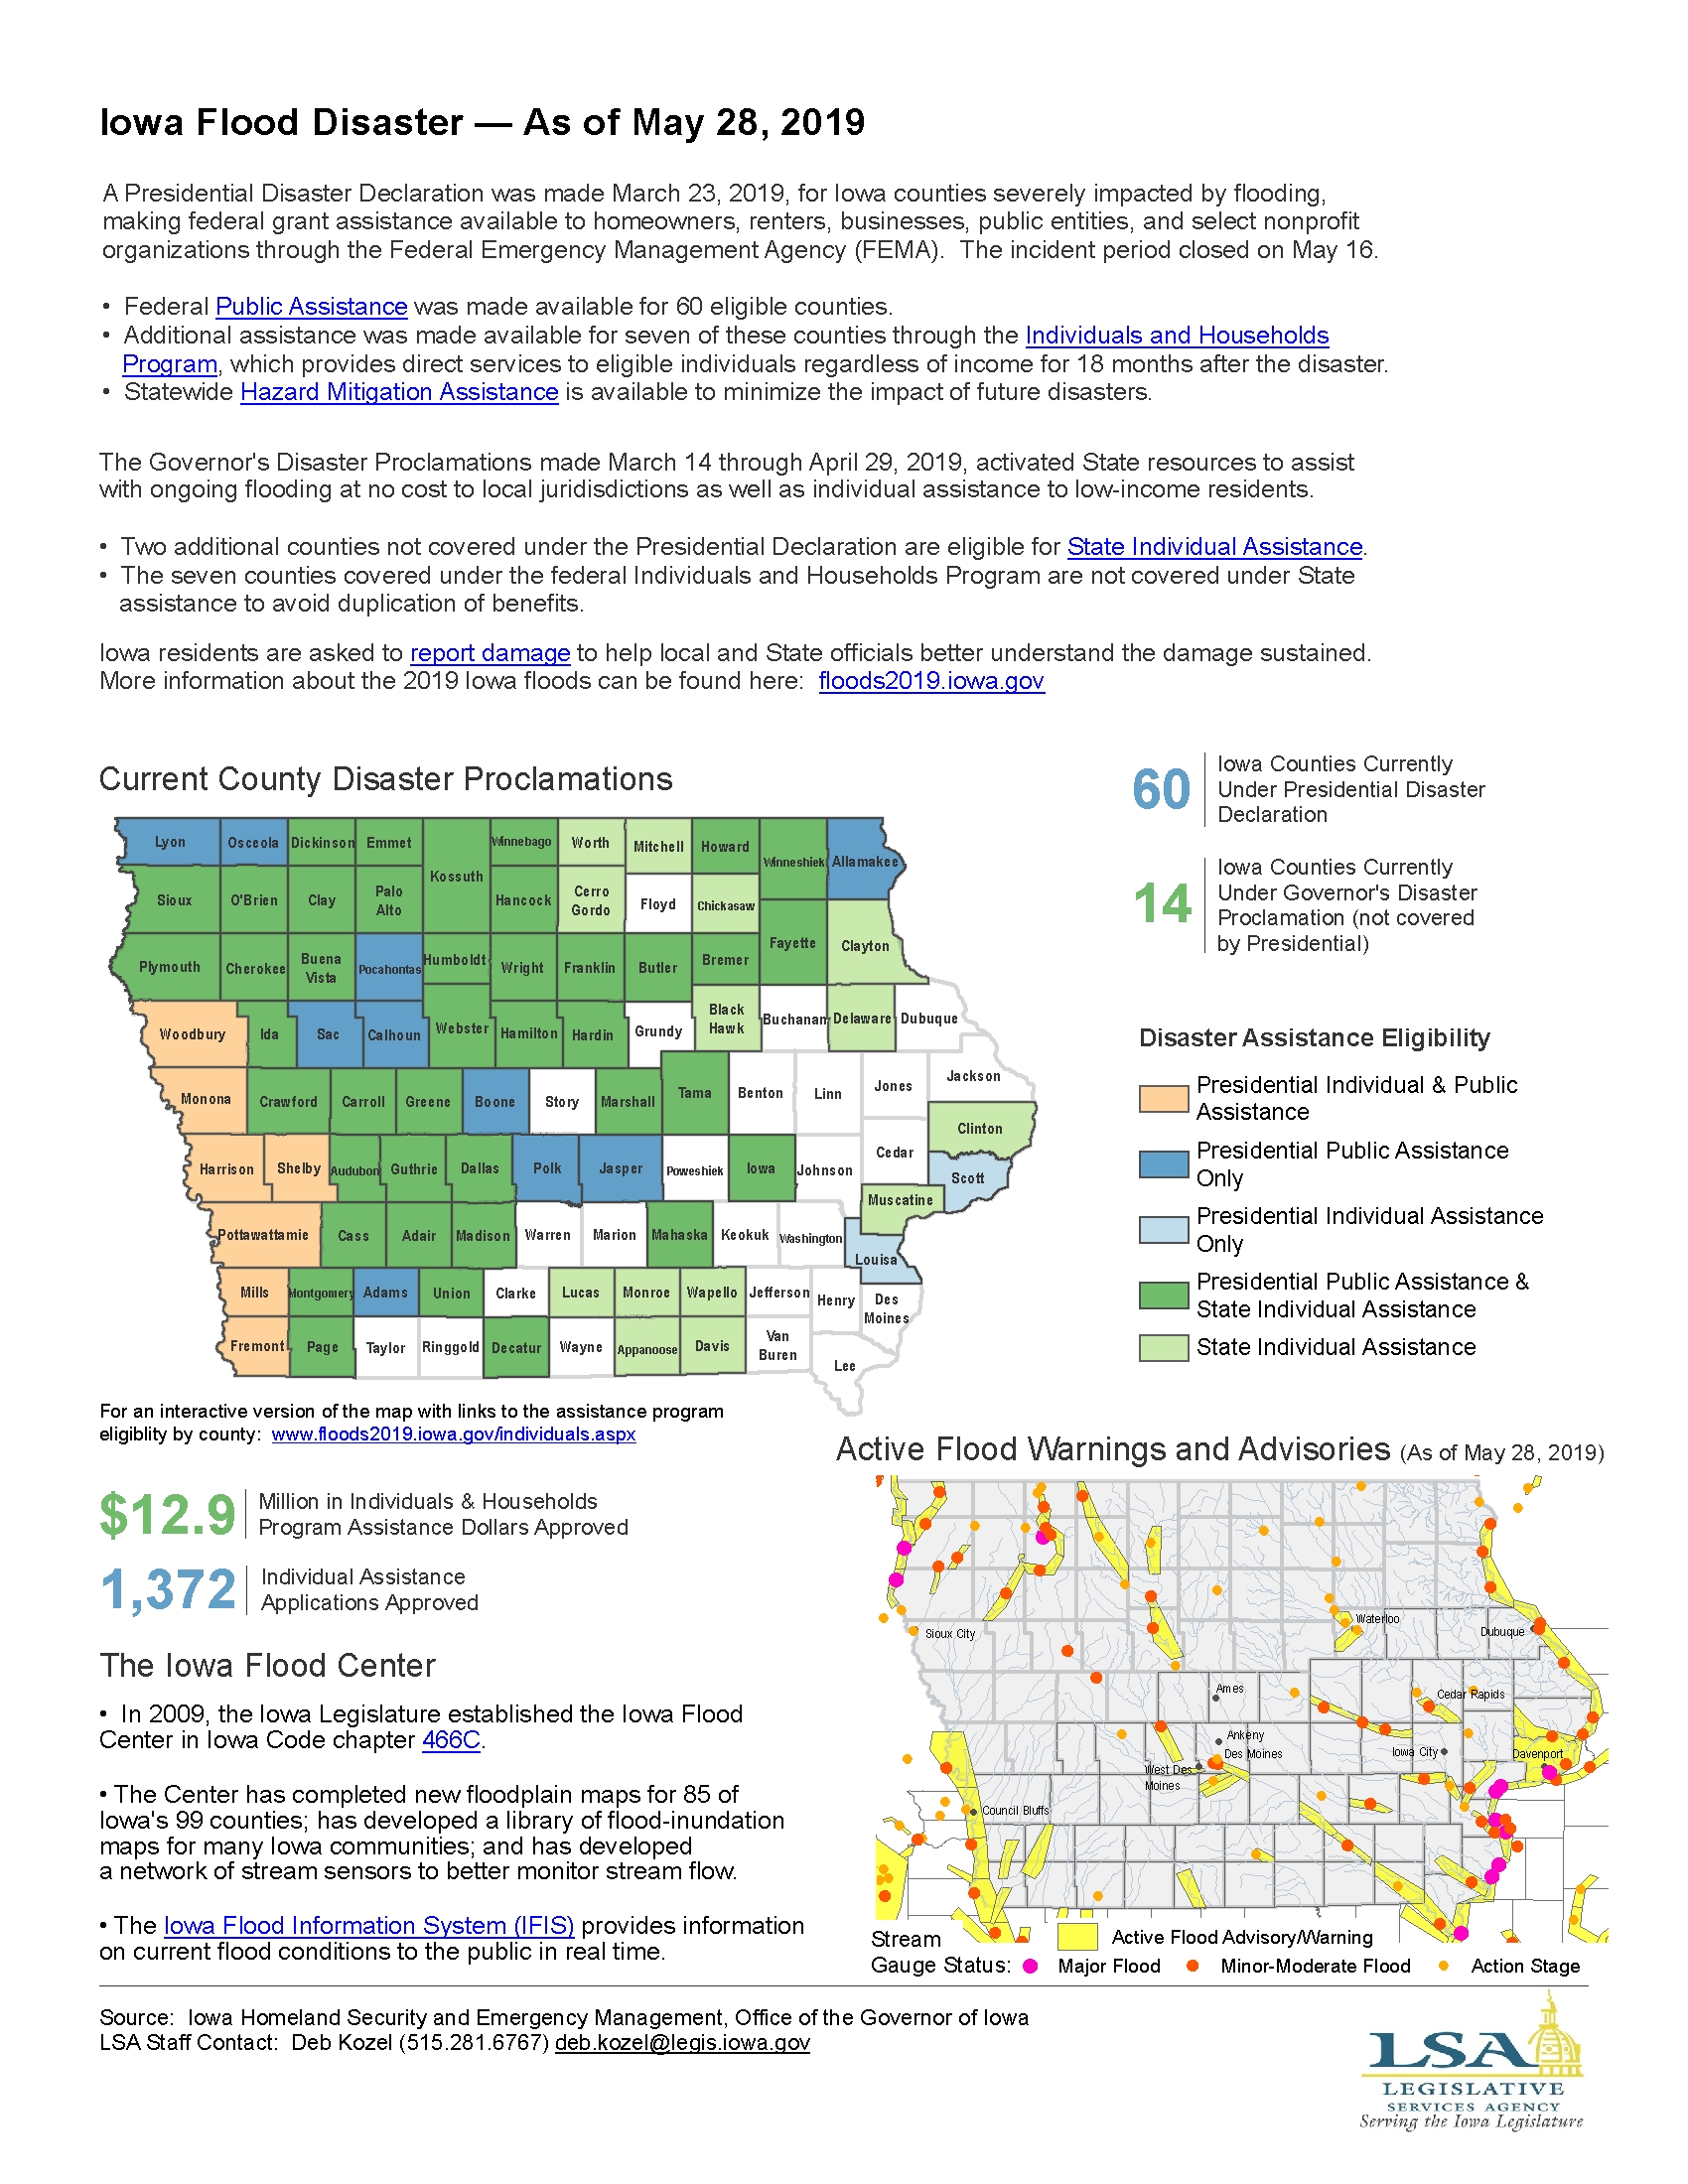
Iowa Flood Disaster — As of May 28, 2019
|
|
|
|
|
| 05/20/2019 |
Iowa Insights |
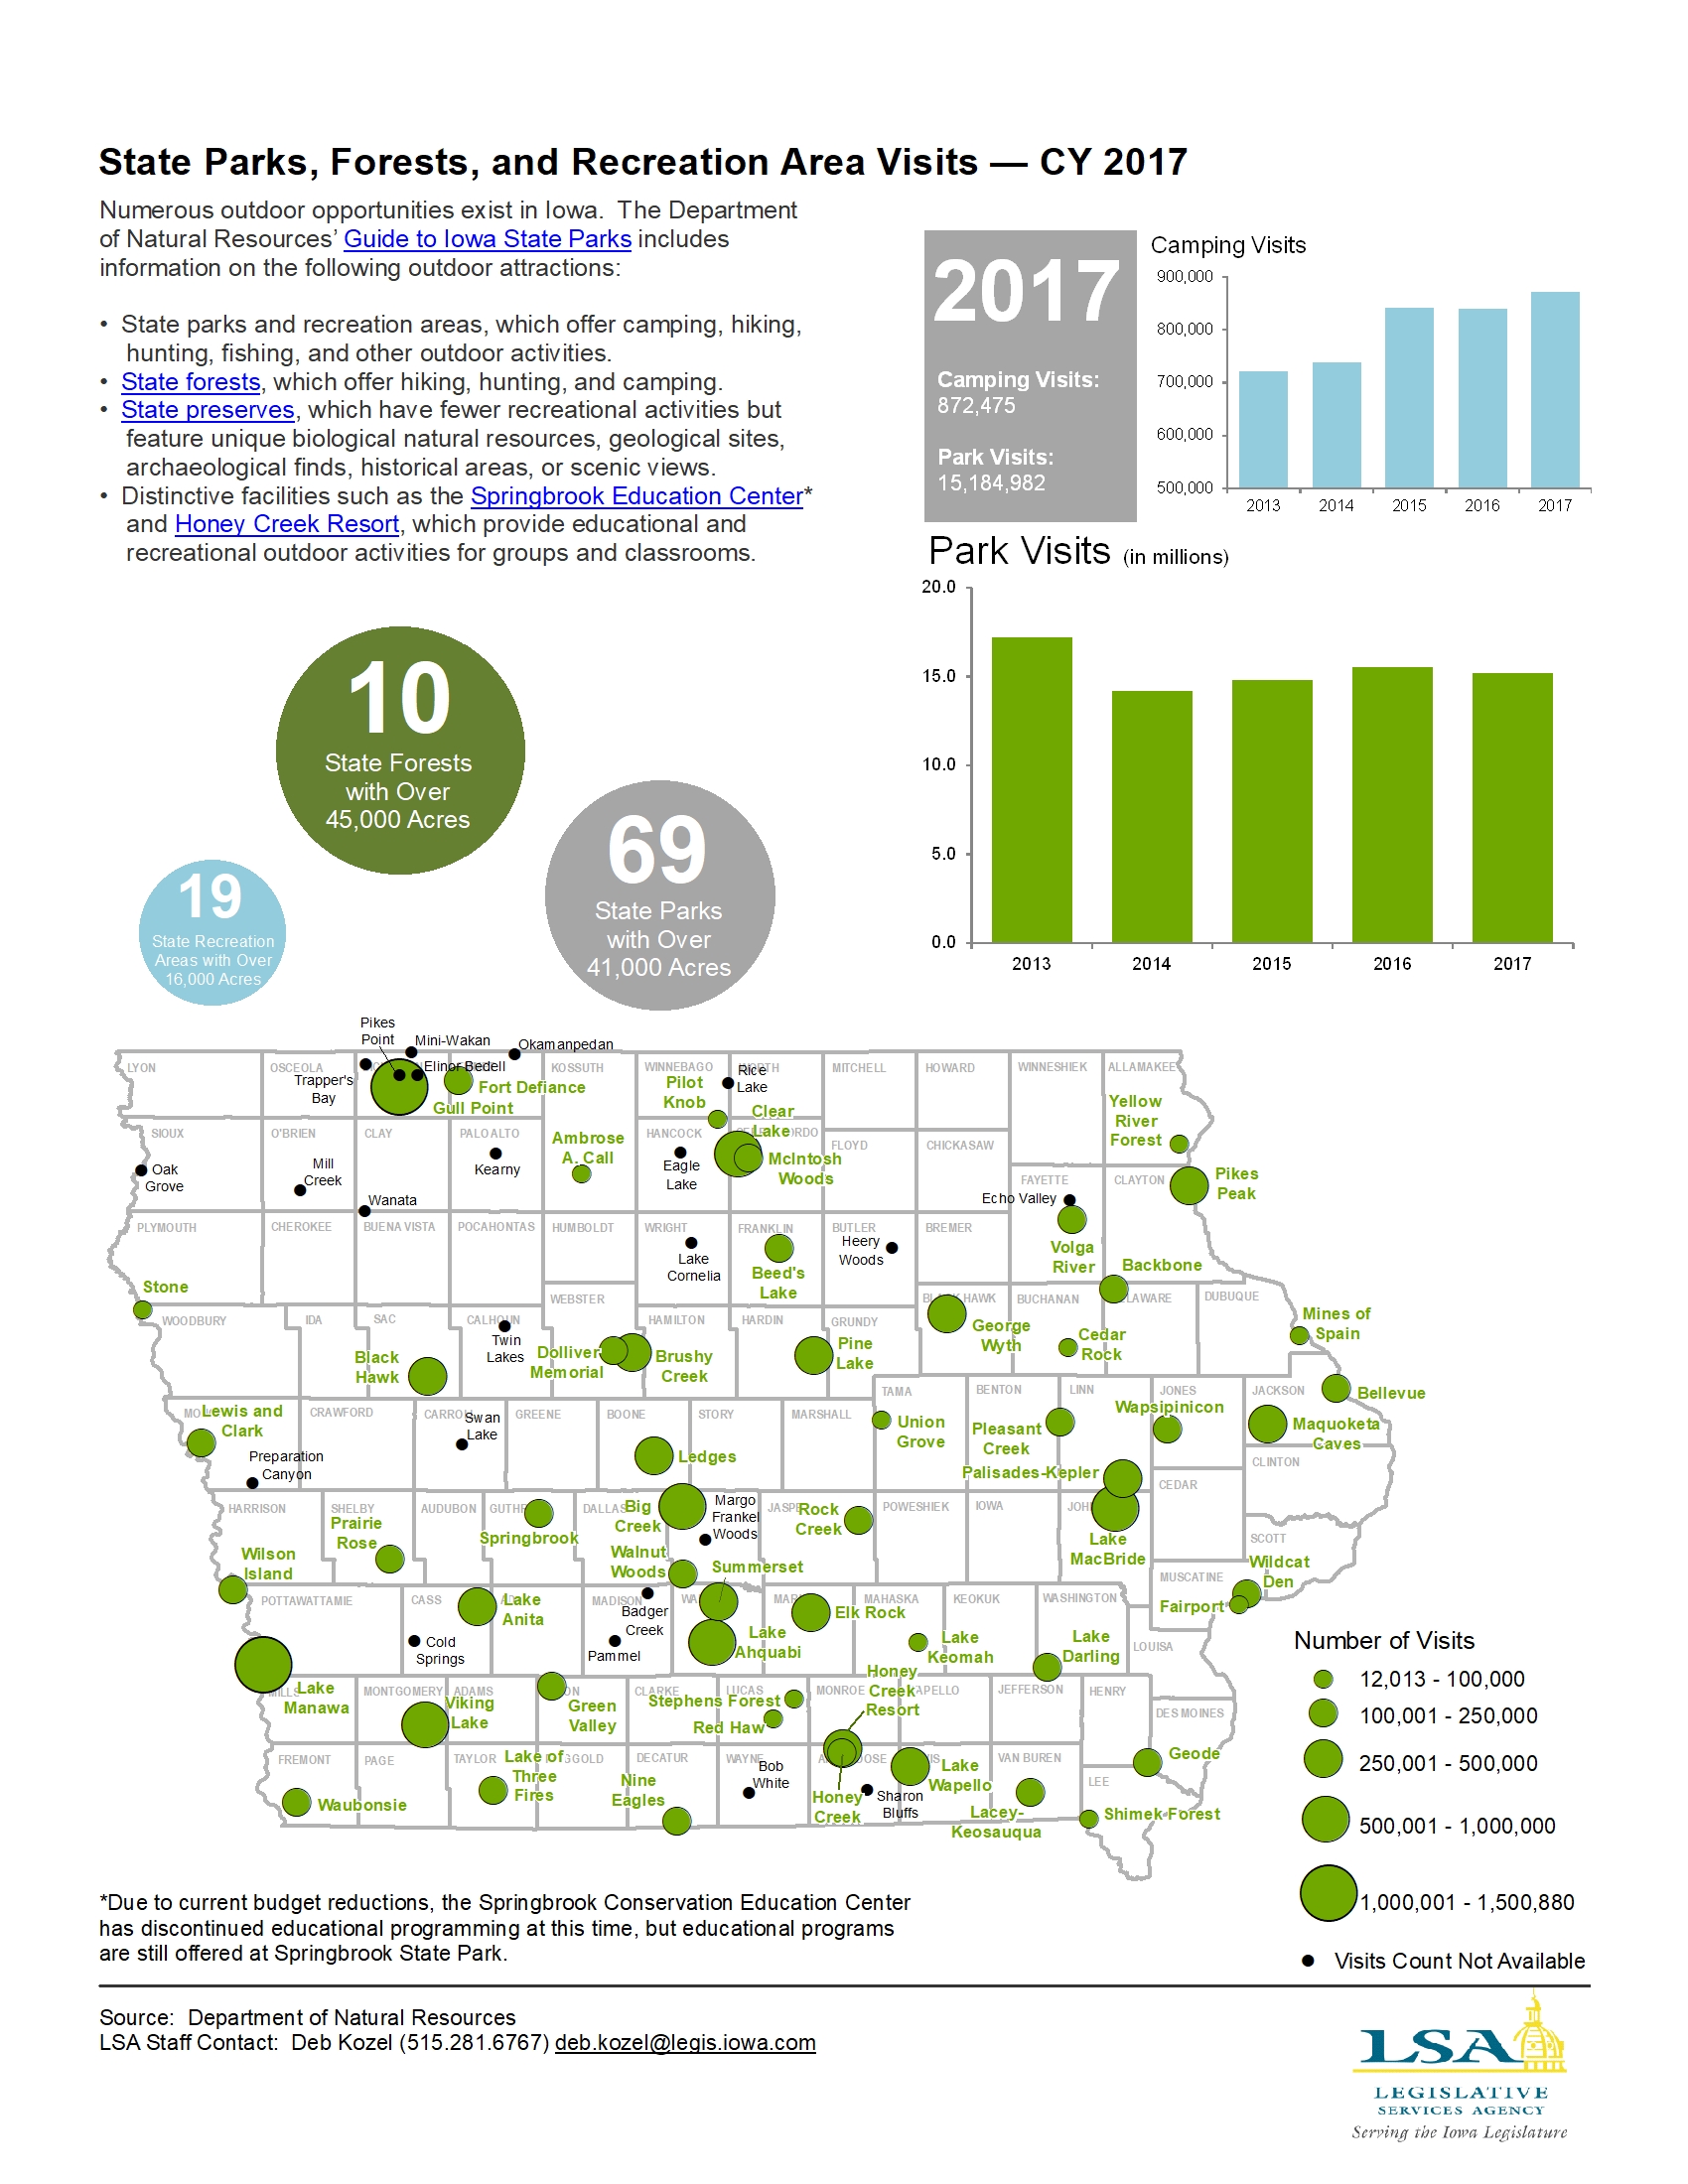
State Park and Recreation Area Visits — 2017
|
|
|
|
|
| 05/14/2019 |
Iowa Insights |
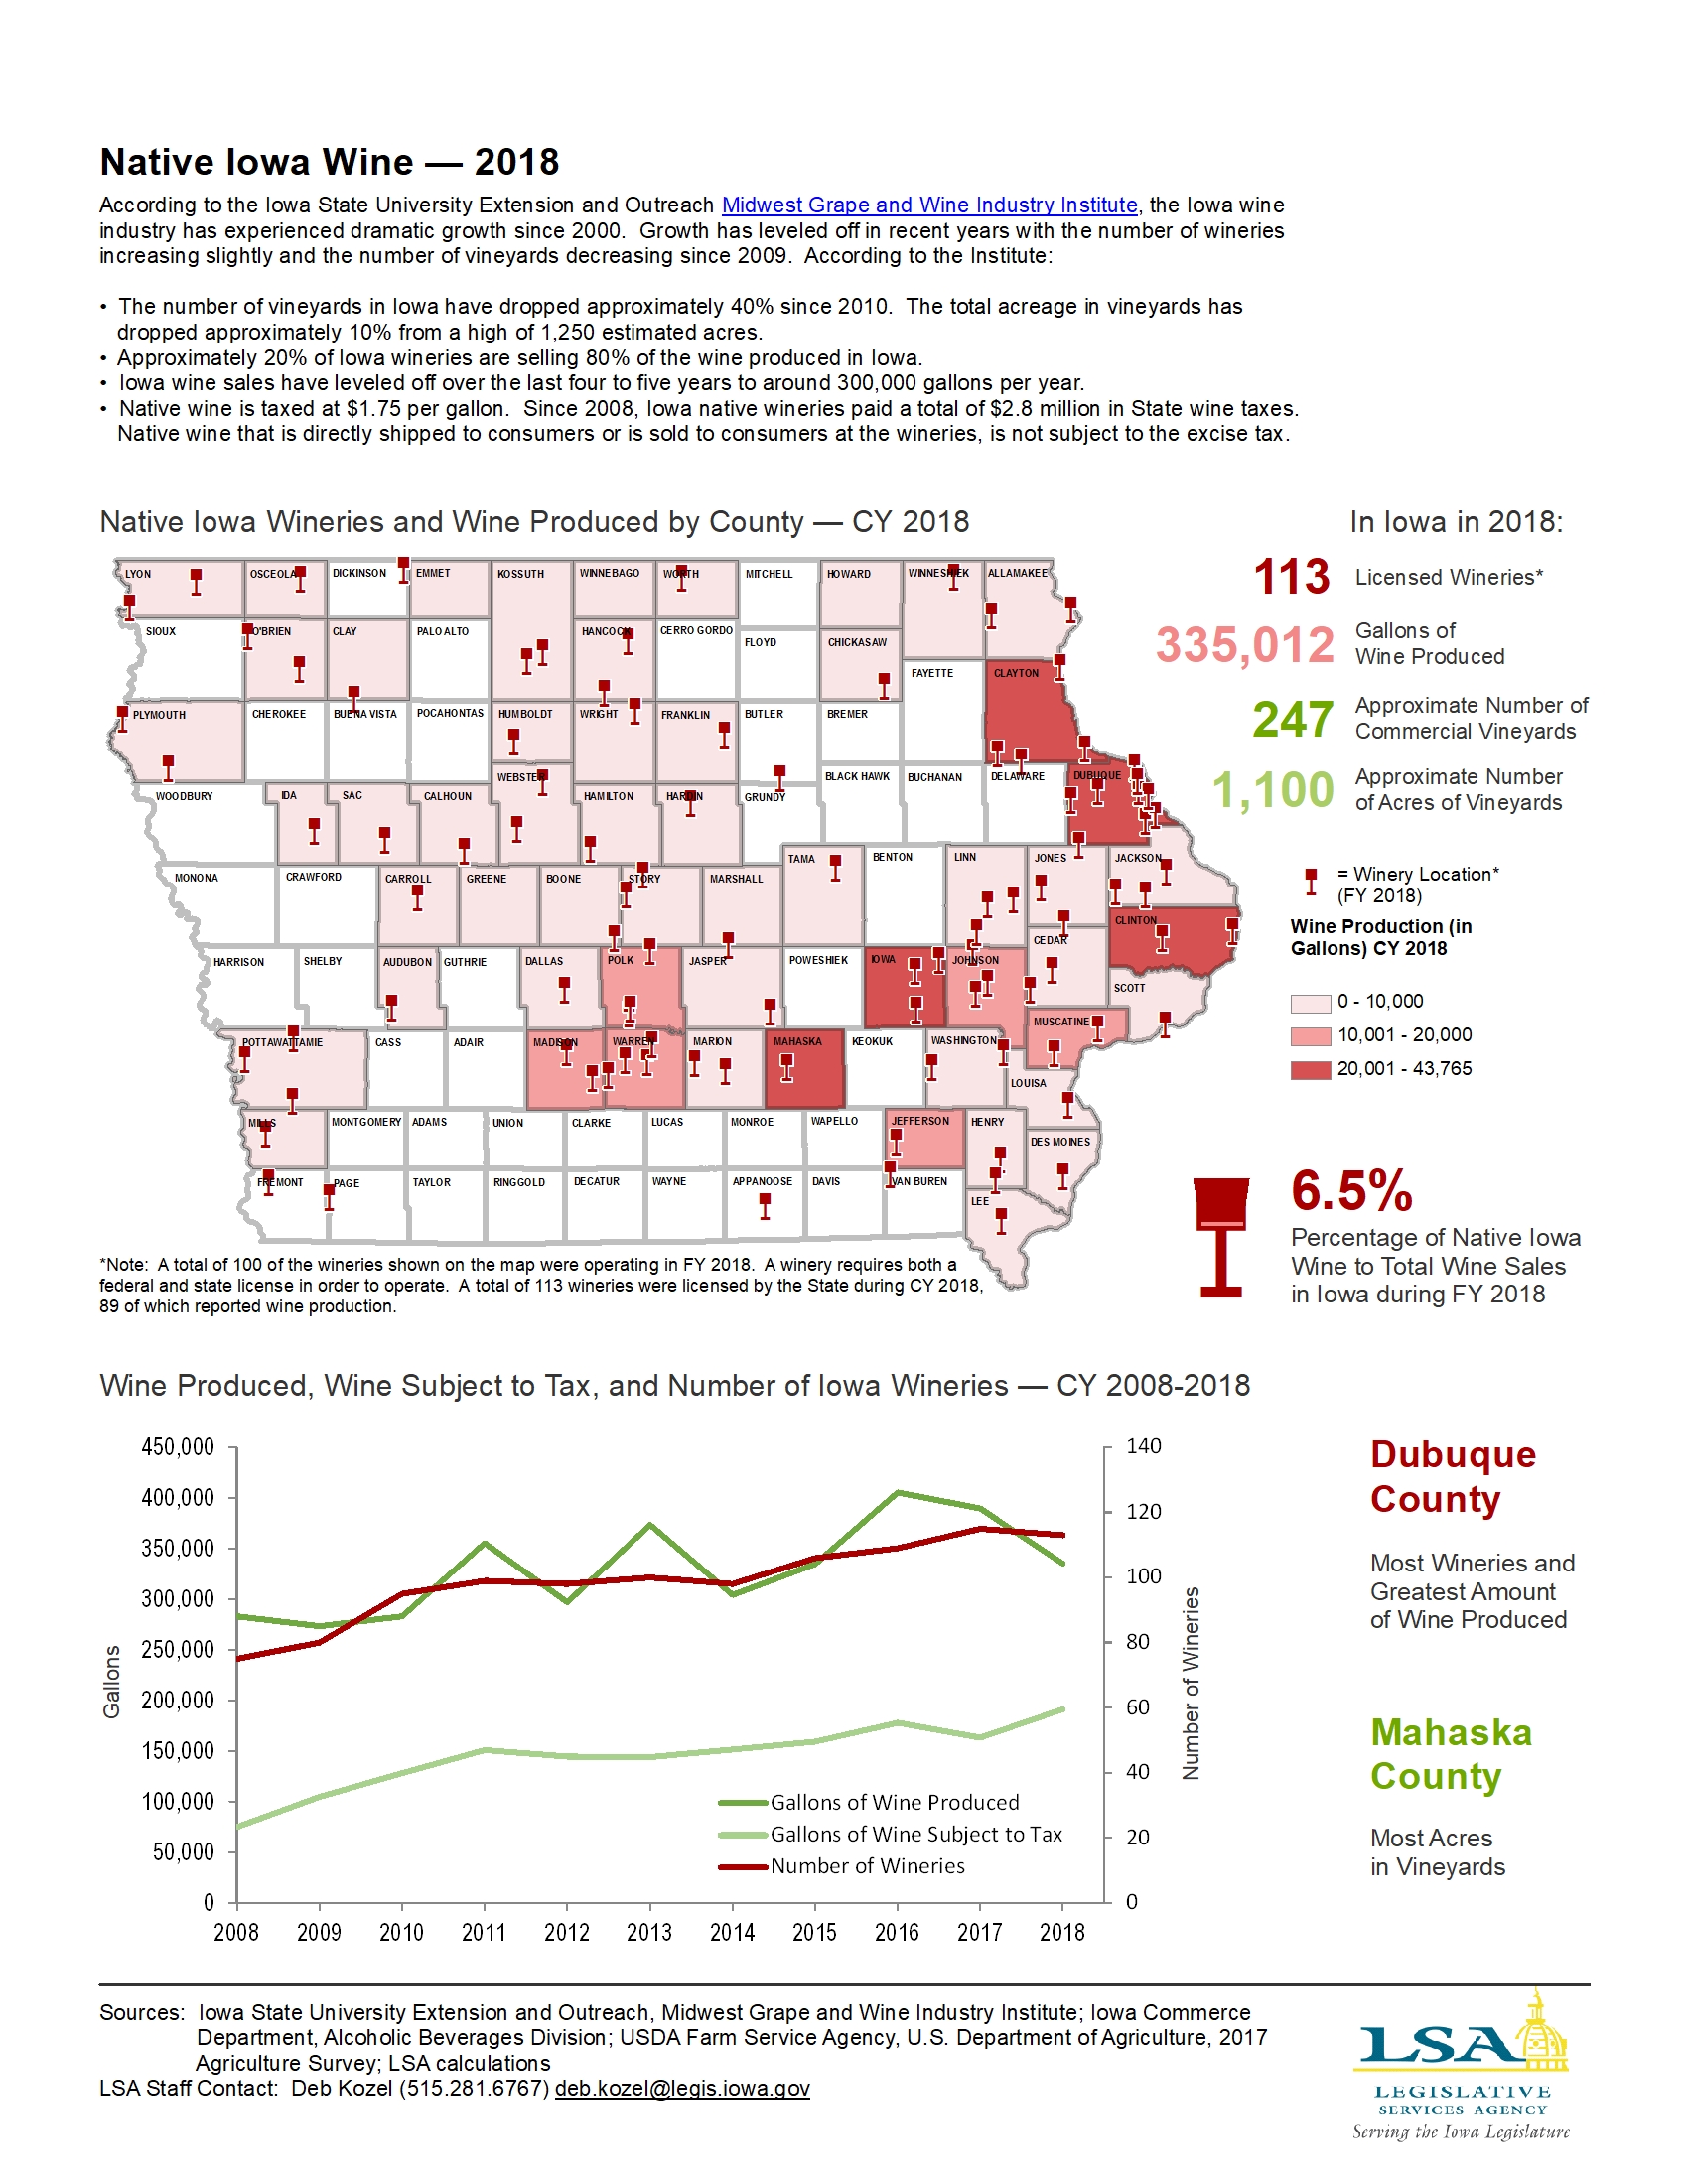
Native Iowa Wine — CY 2018
|
|
|
|
|
| 05/06/2019 |
Iowa Insights |
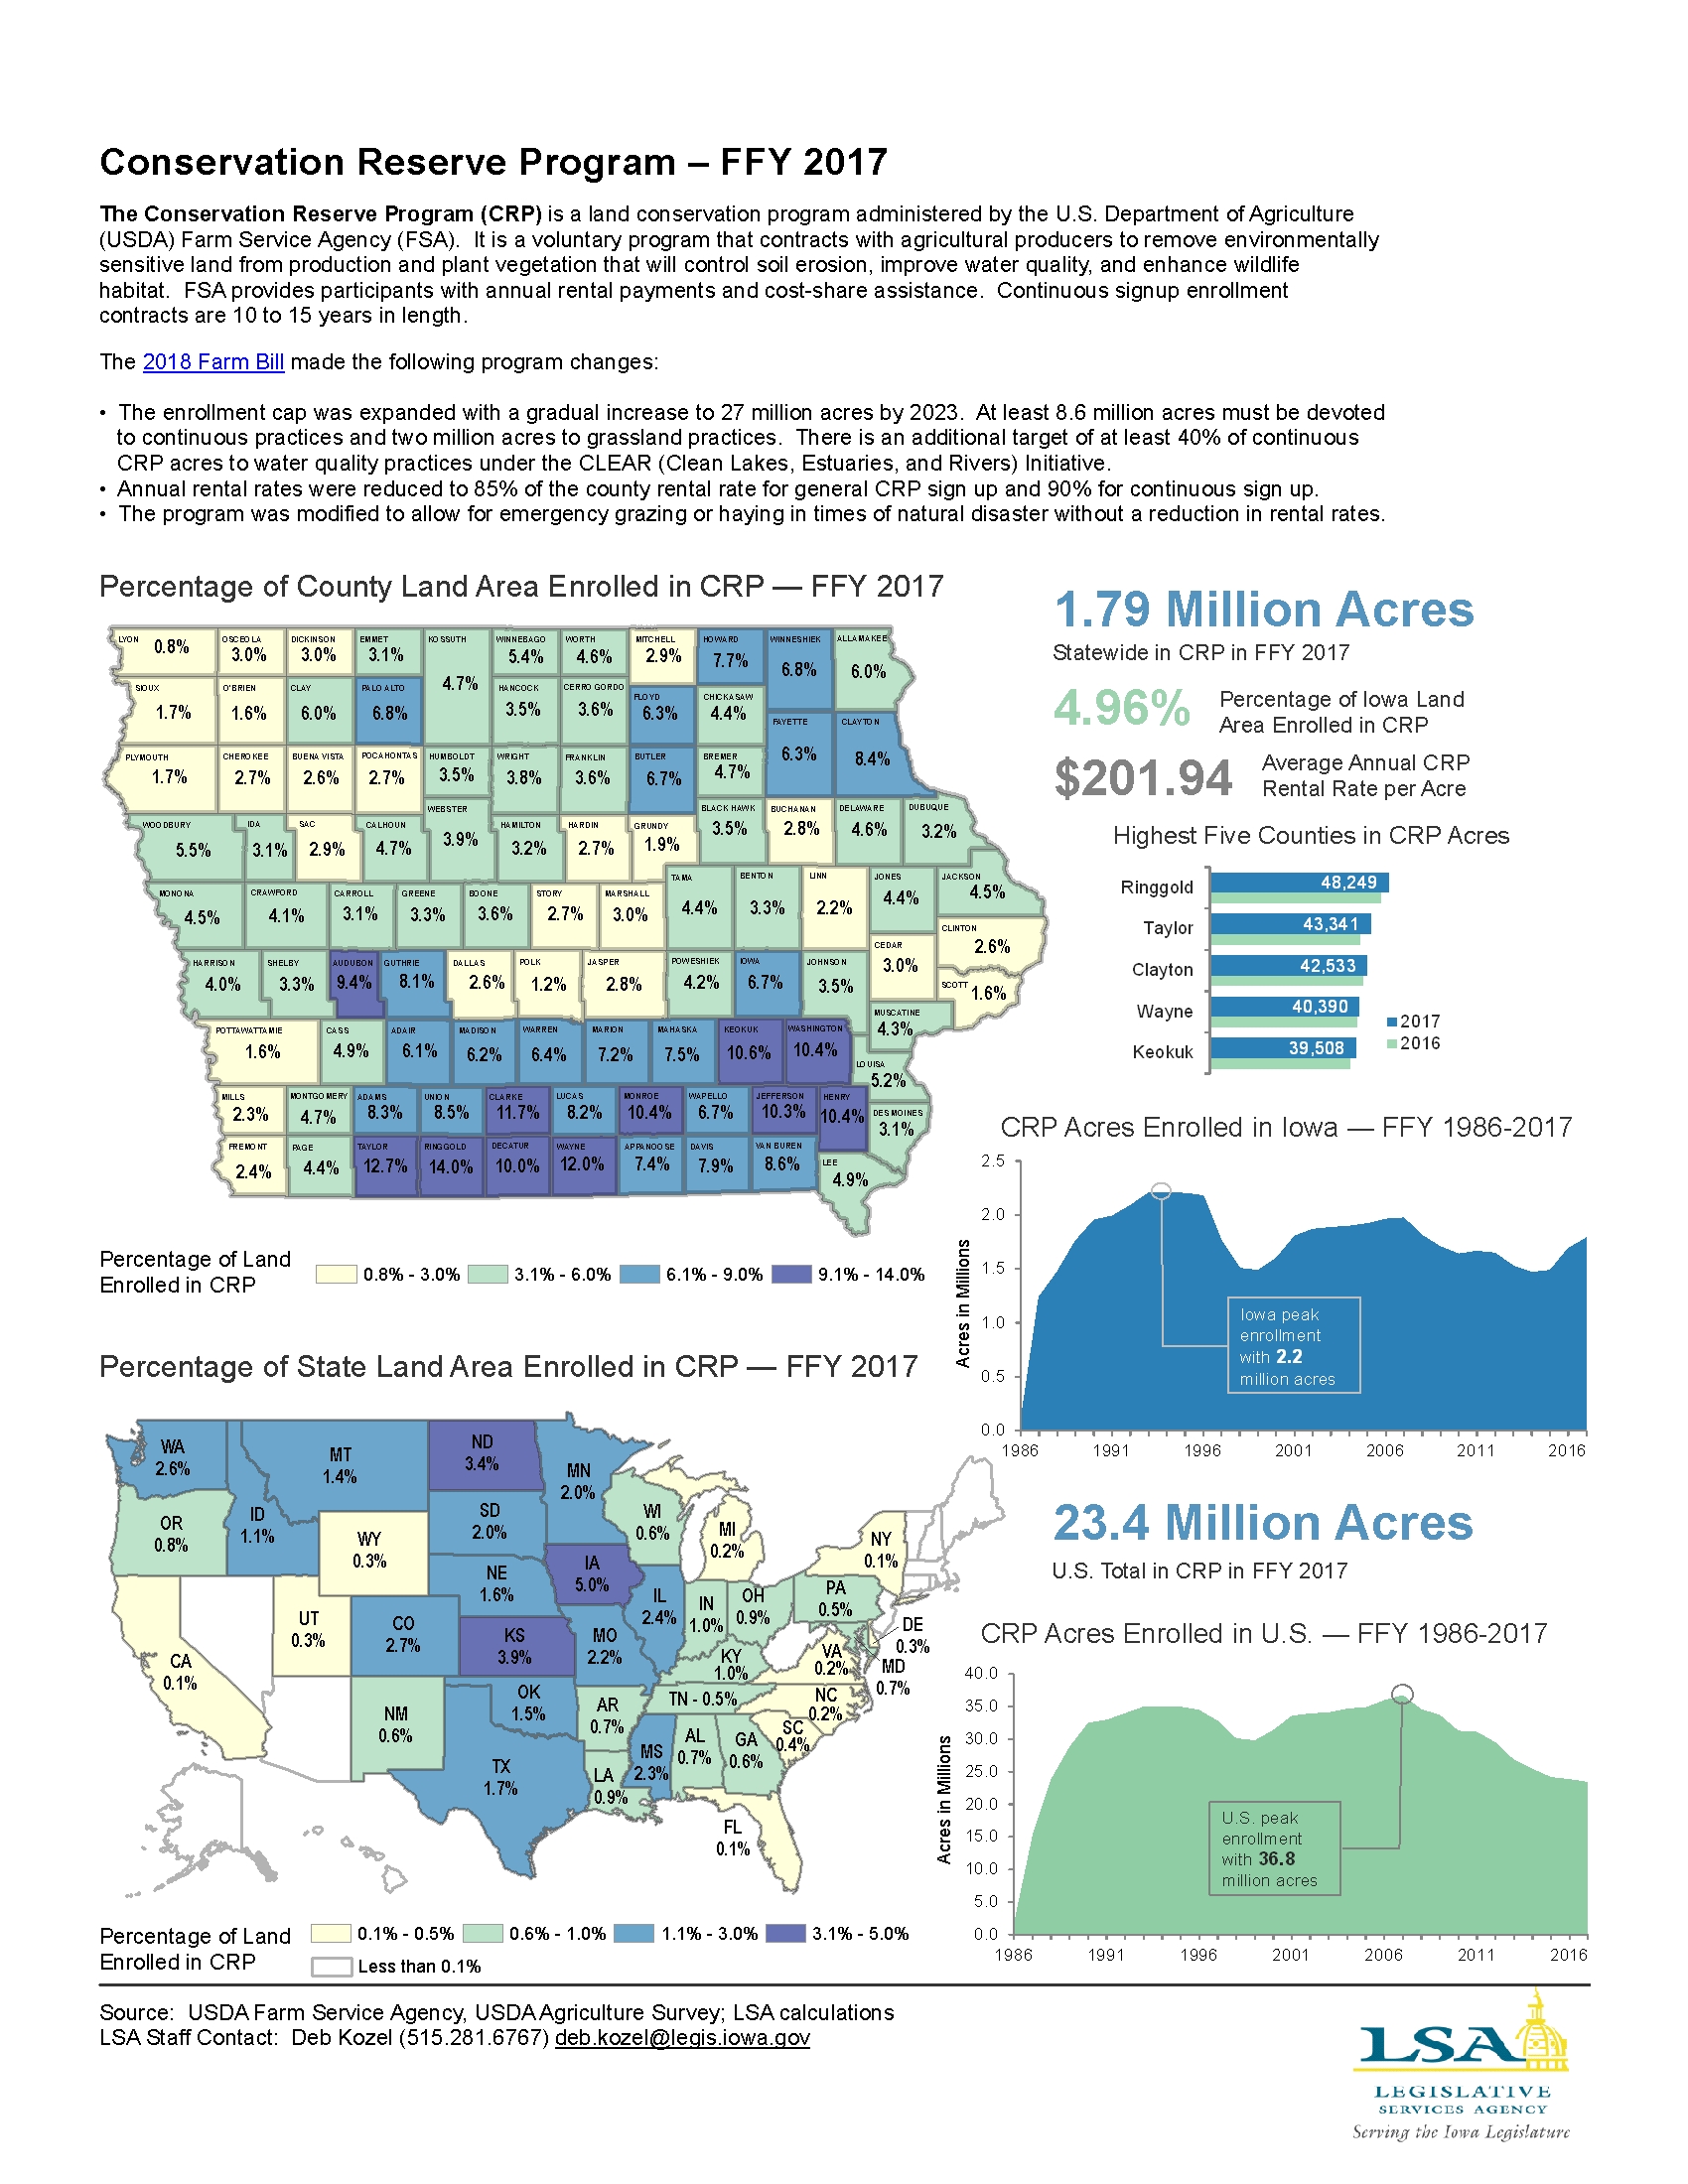
Conservation Reserve Program — FFY2017
|
|
|
|
|
| 04/29/2019 |
Iowa Insights |
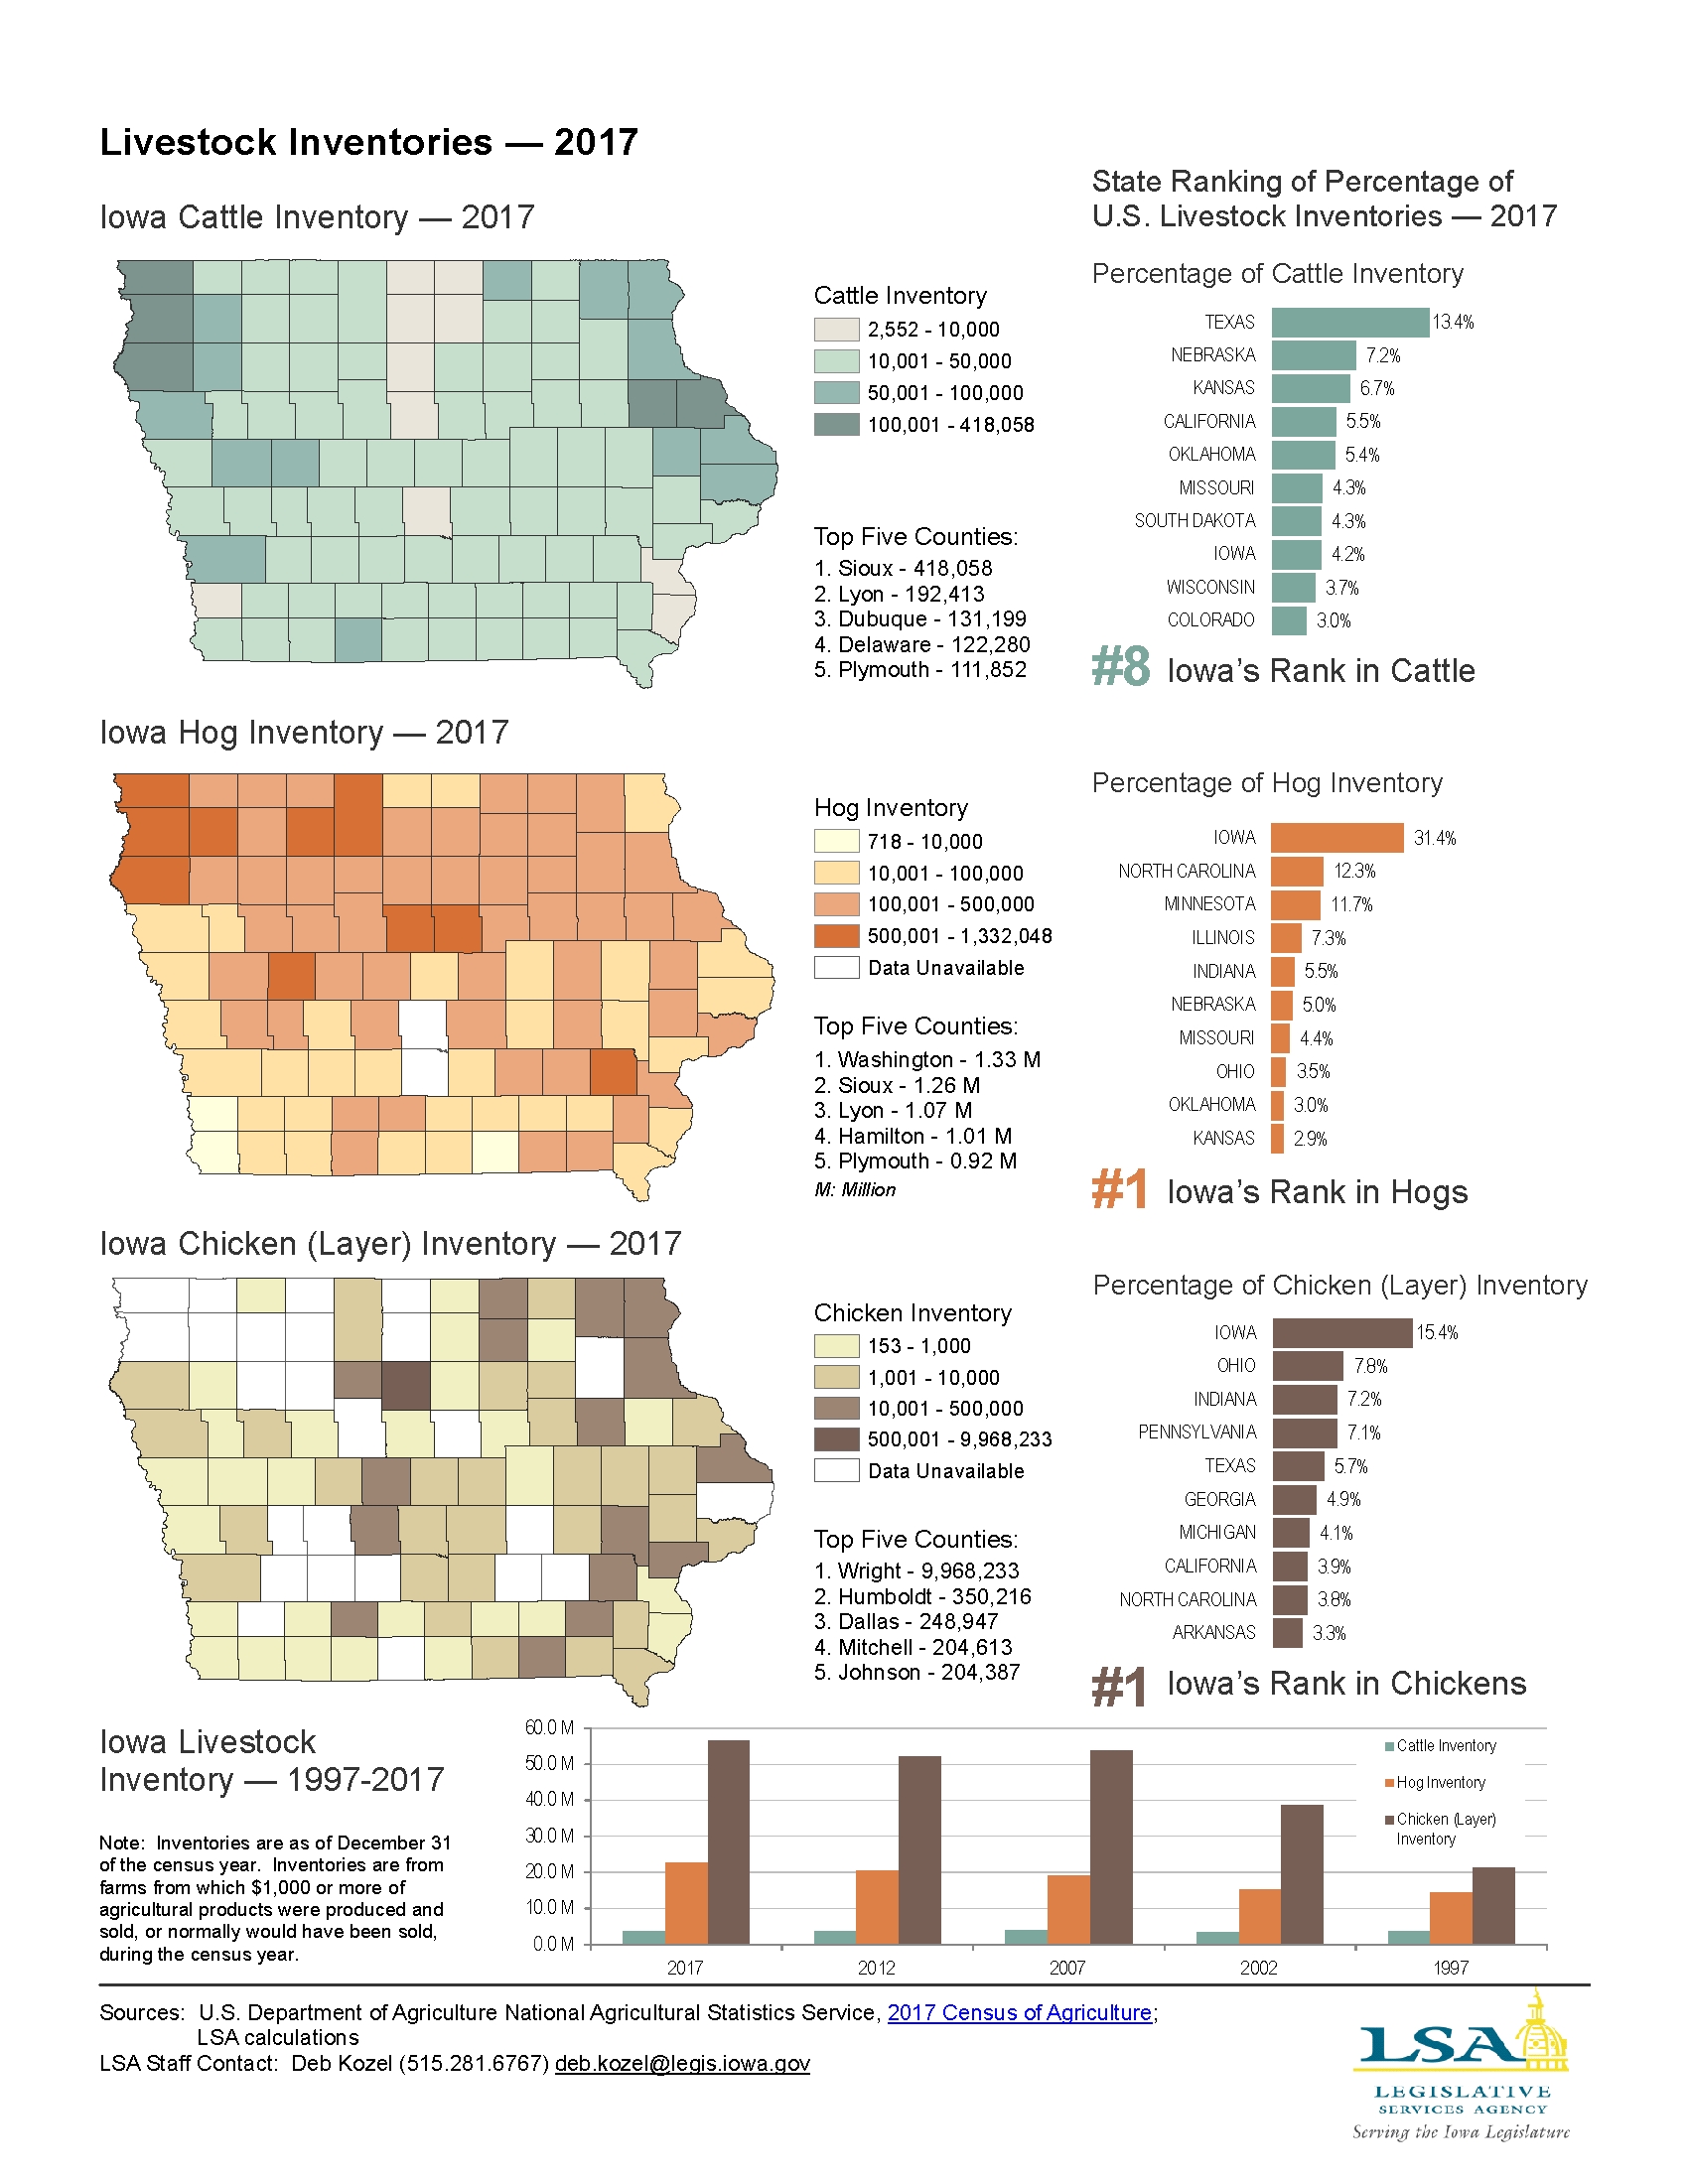
Livestock Inventories — 2017
|
|
|
|
|
| 04/23/2019 |
Iowa Insights |
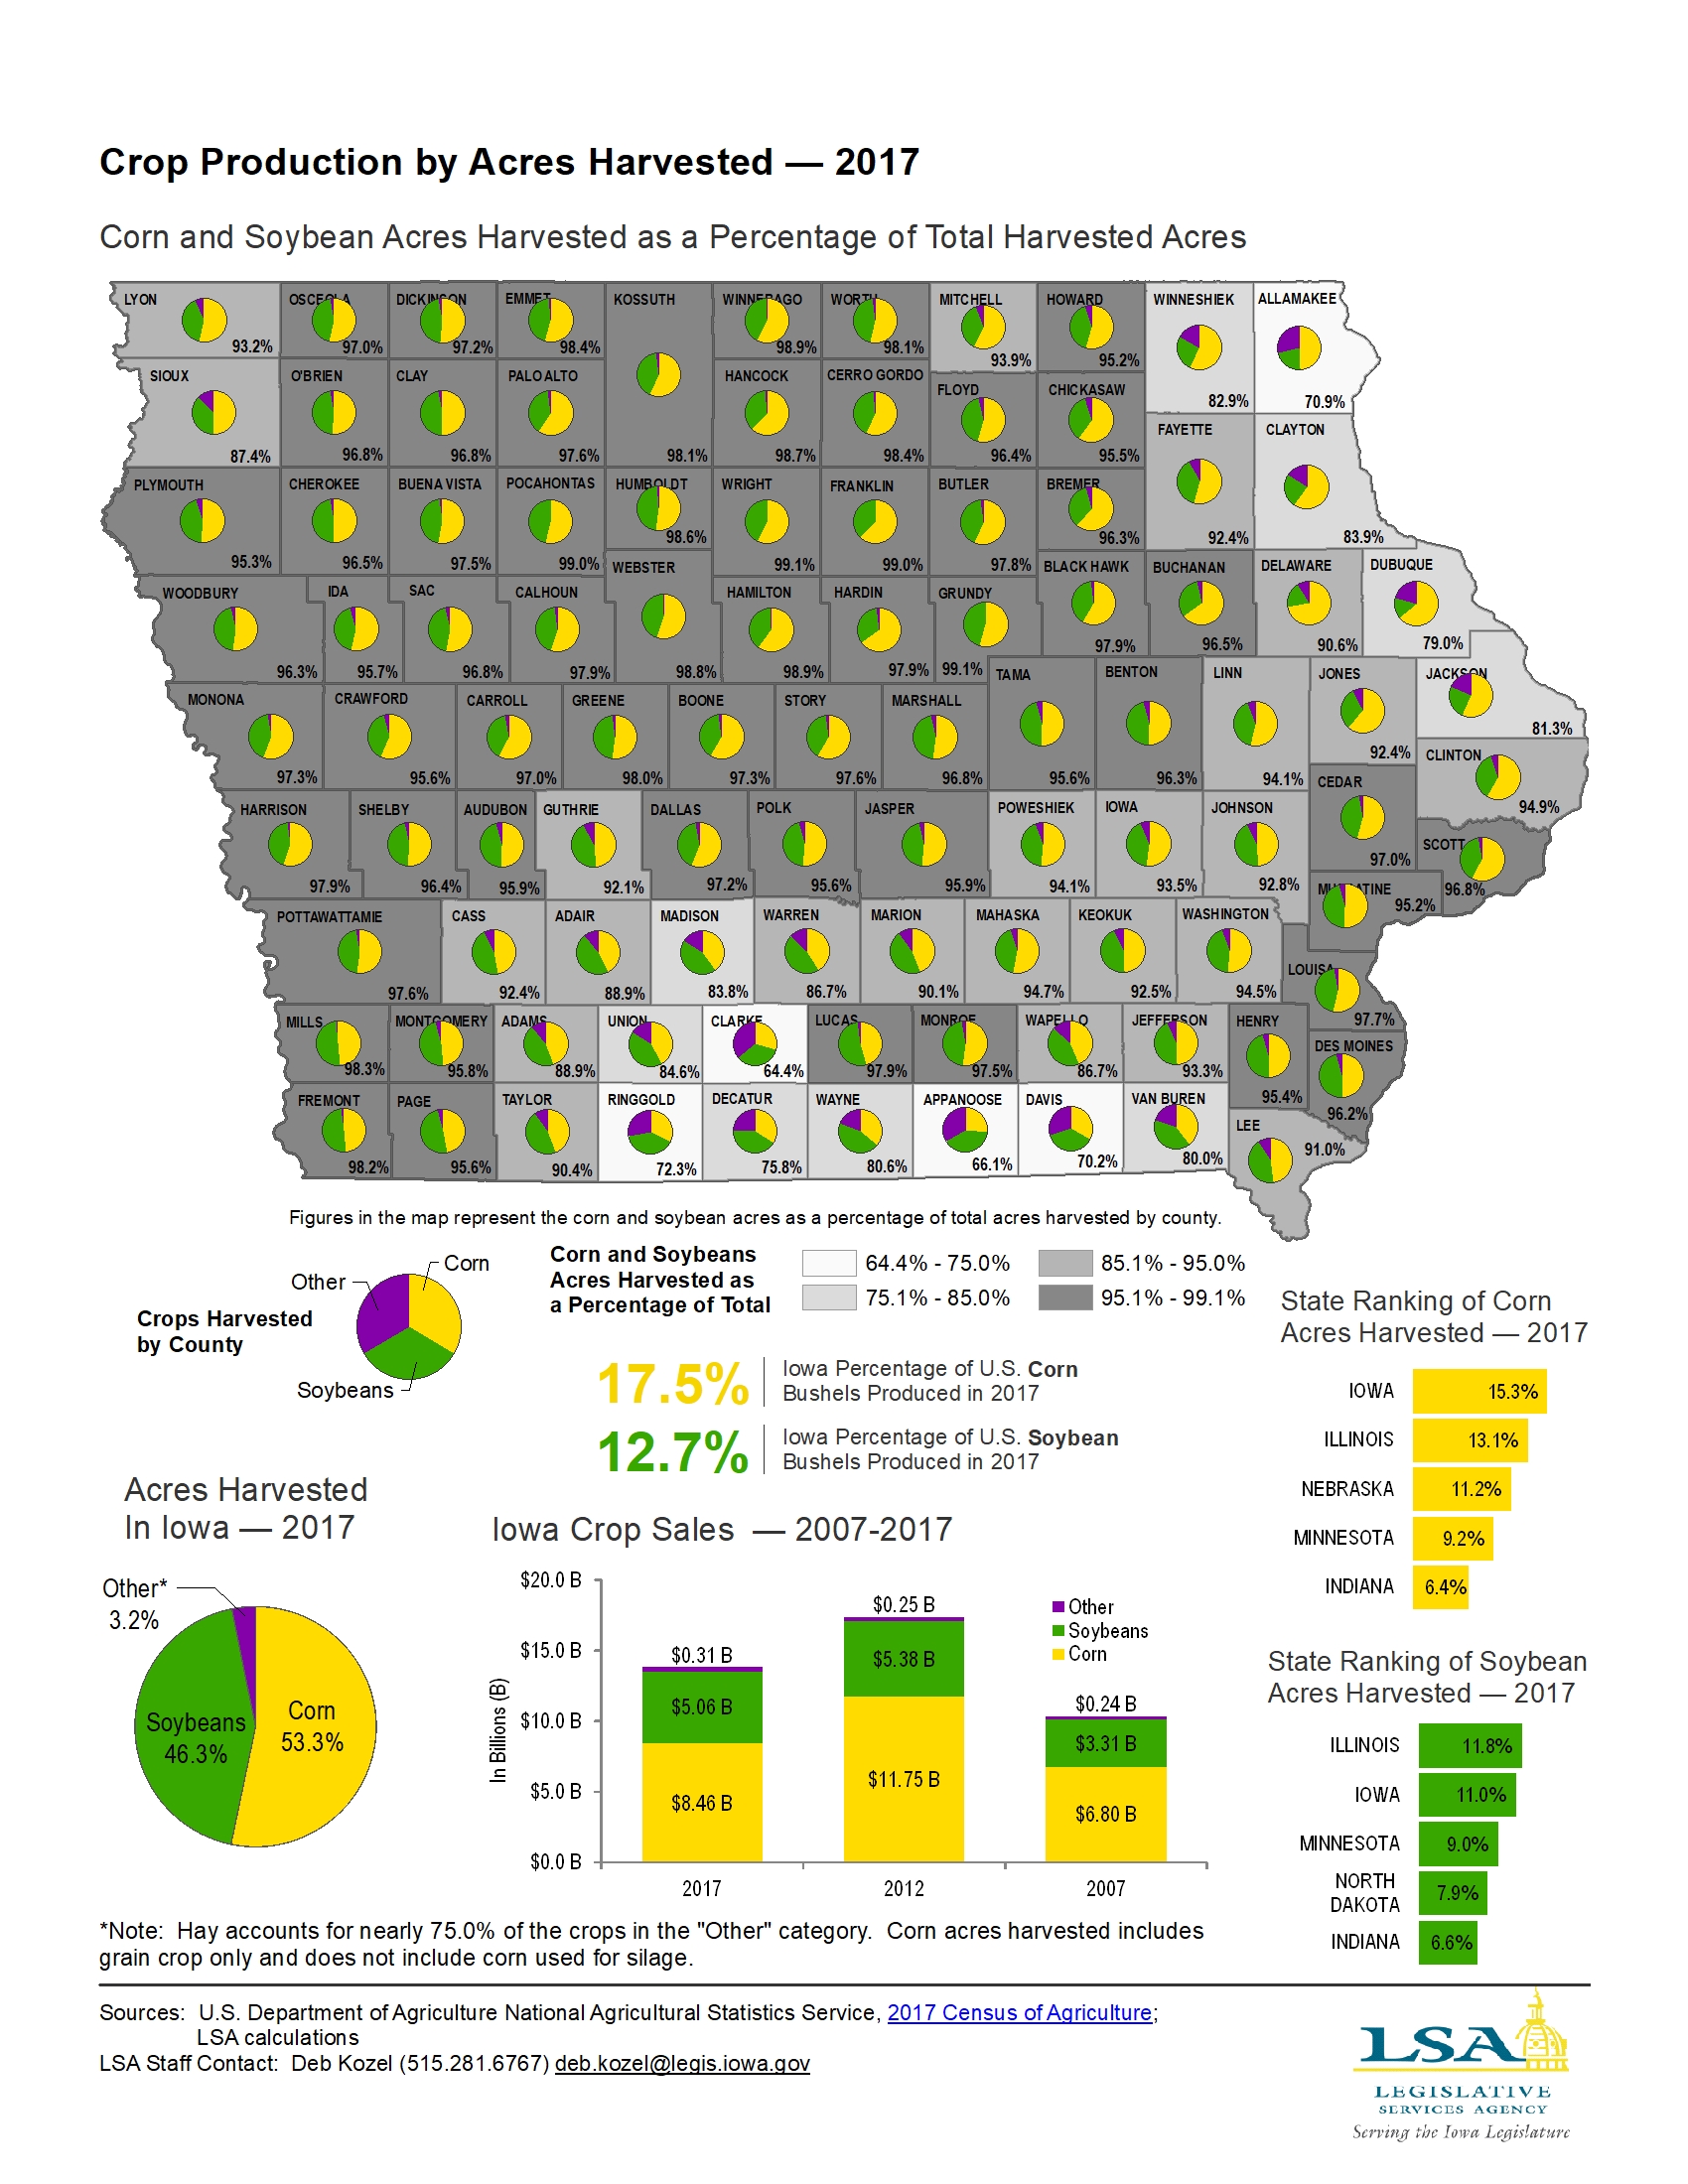
Crop Production by Acres Harvested — 2017
|
|
|
|
|
| 04/15/2019 |
Iowa Insights |
Land in Farms — 2017

|
|
|
|
|
| 04/01/2019 |
Iowa Insights |
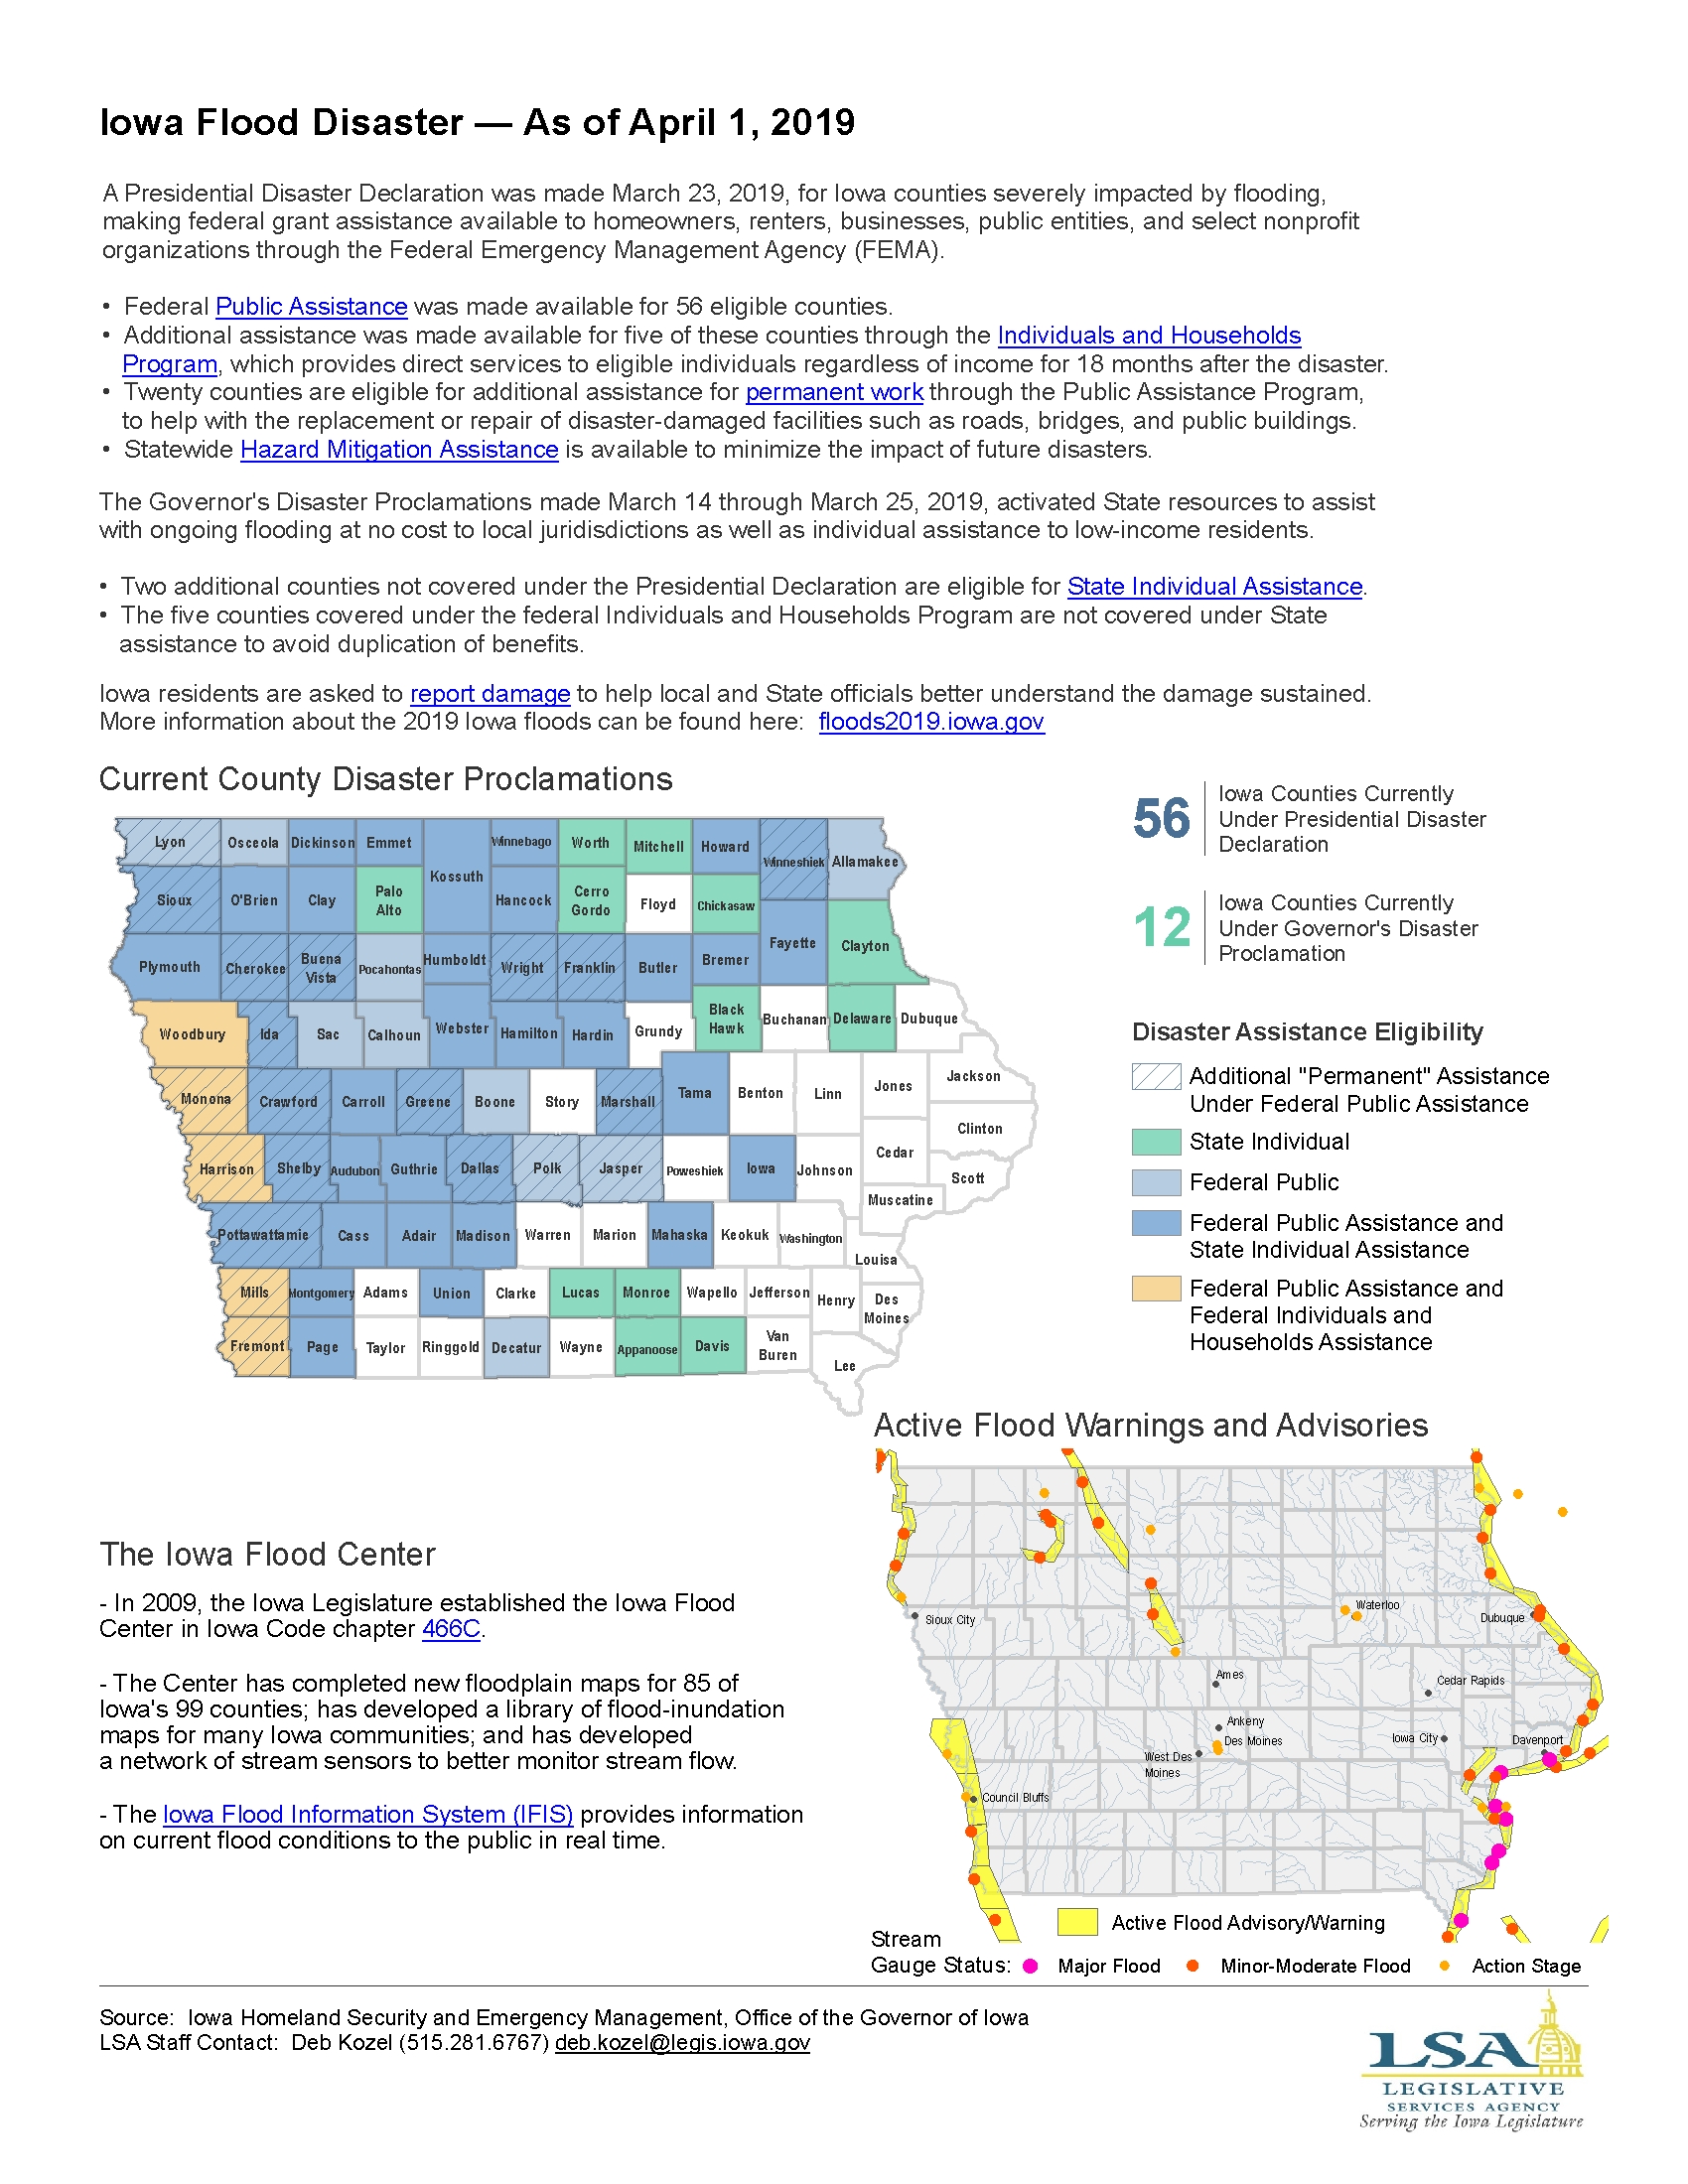
Iowa Flood Disaster — As of April 1, 2019
|
|
|
|
|
| 03/25/2019 |
Iowa Insights |
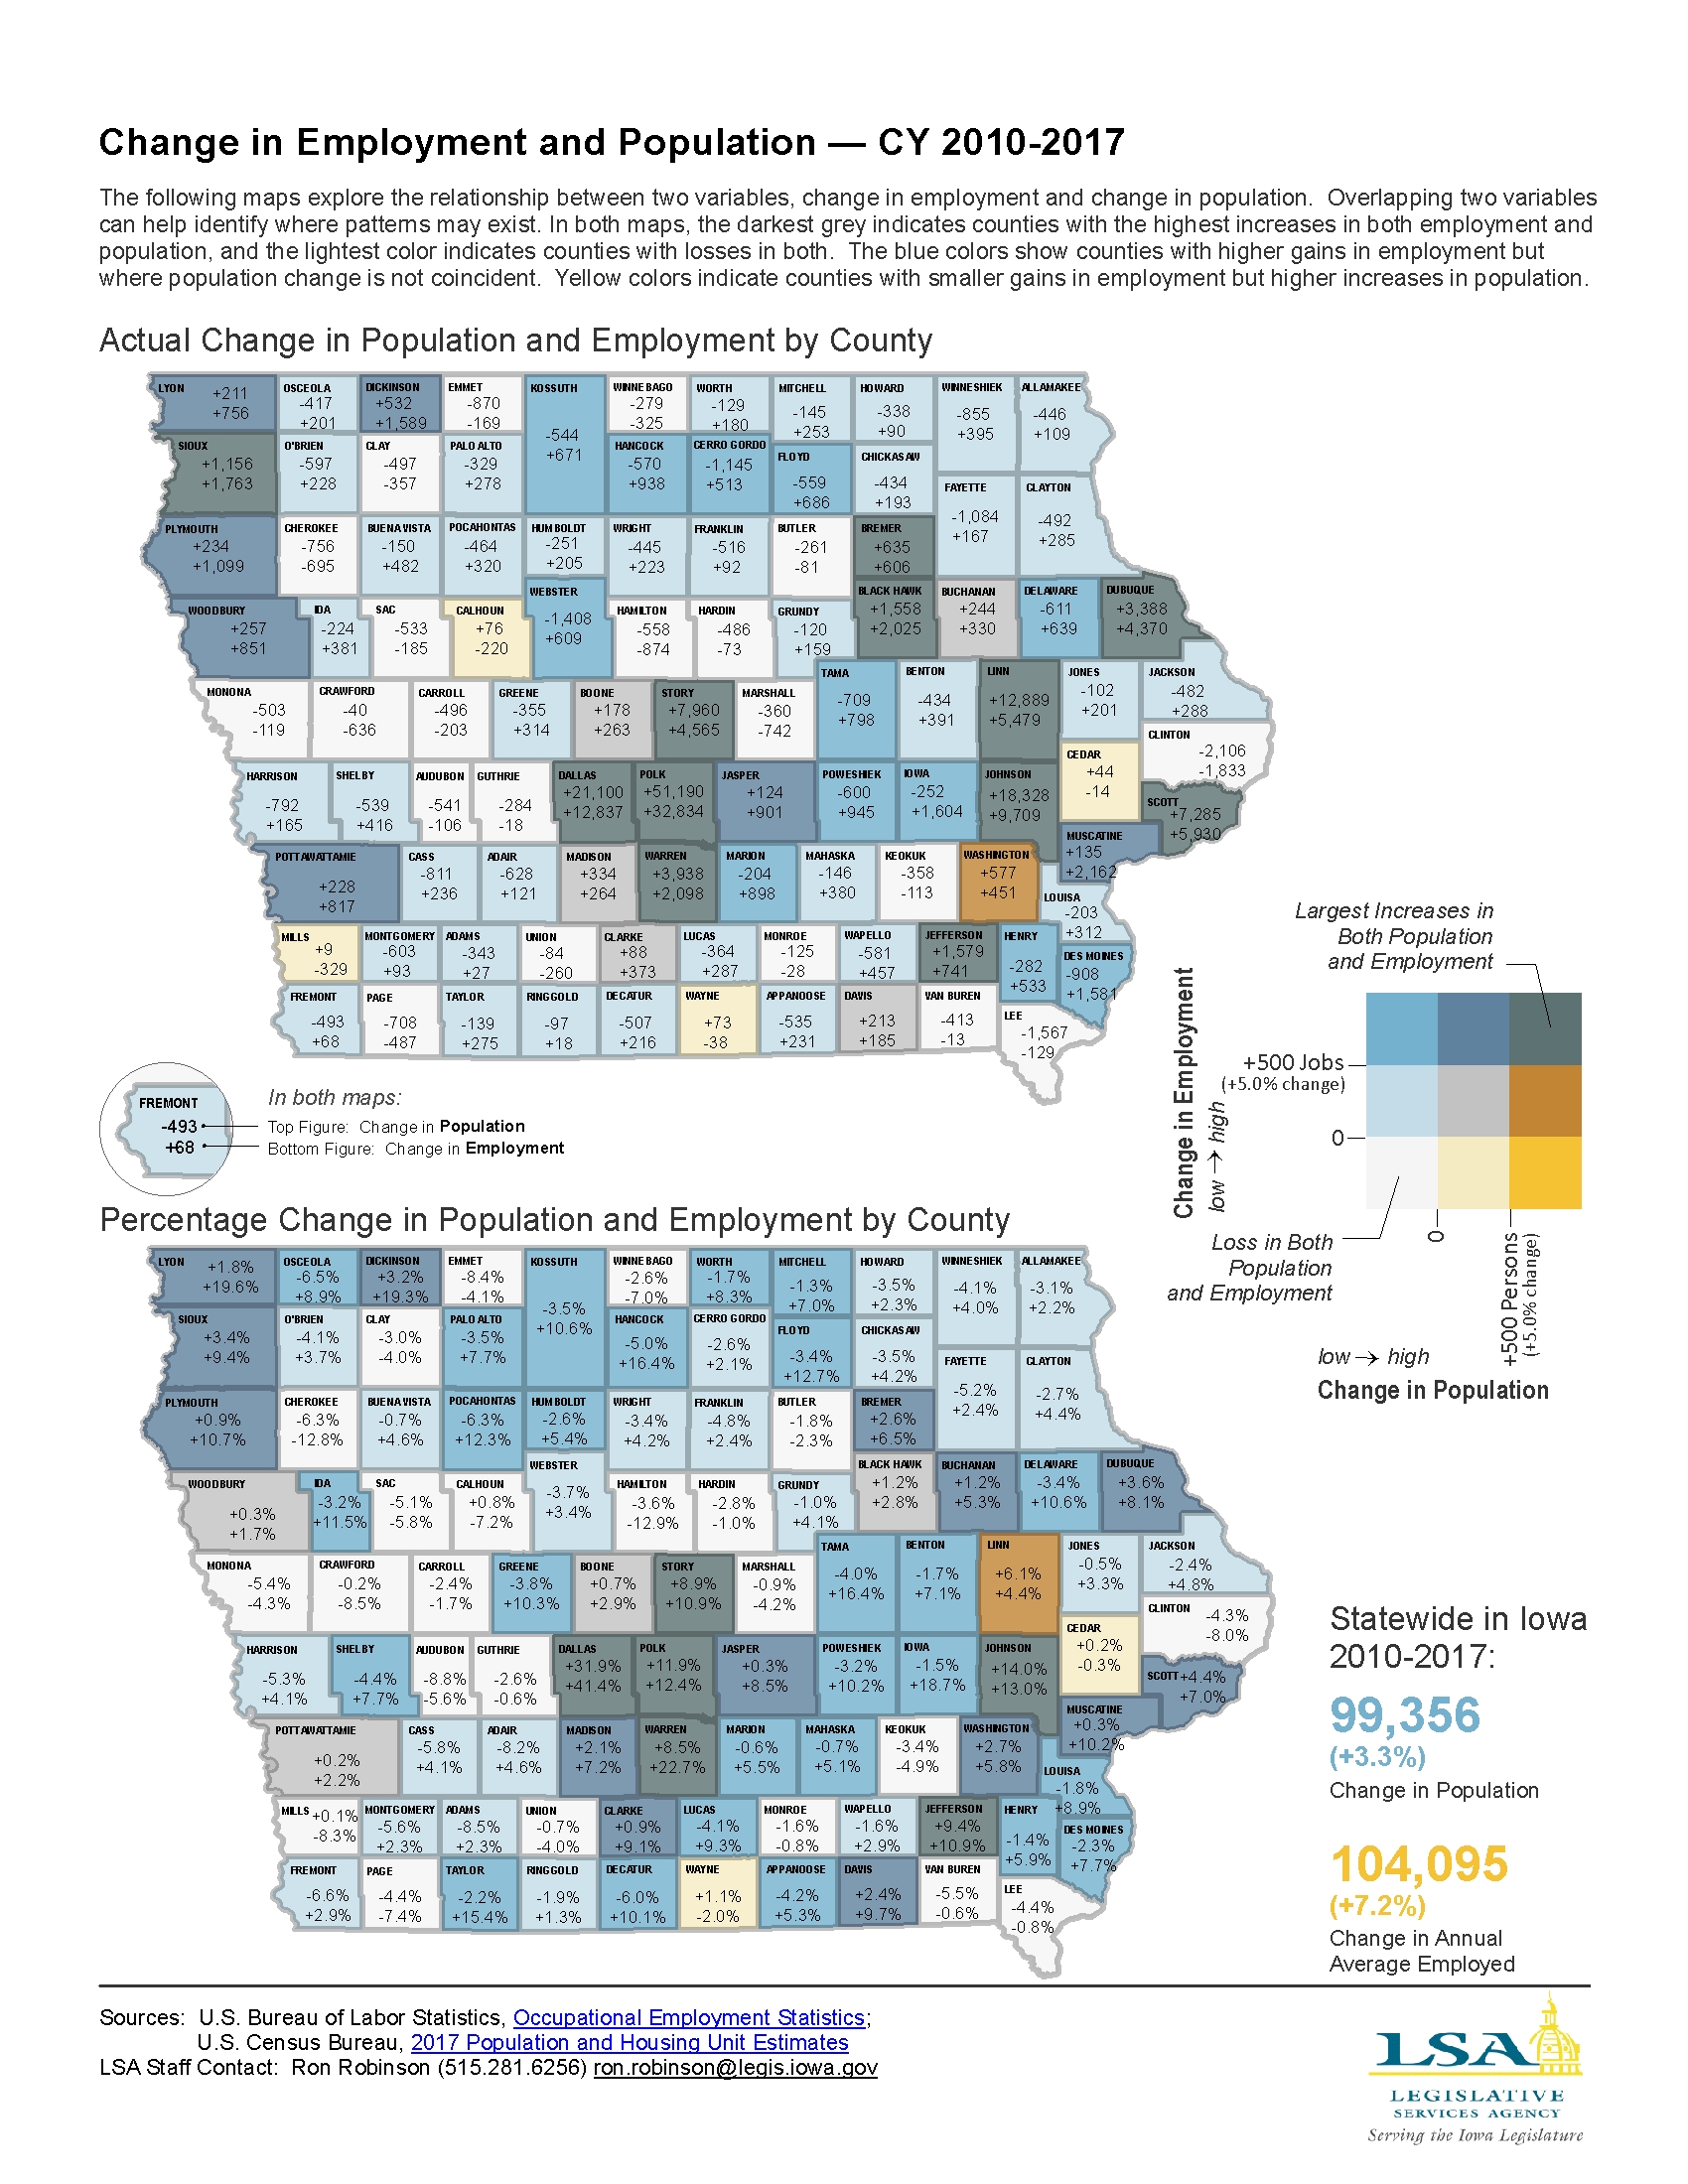
Change in Population and Employment — CY 2010-2017
|
|
|
|
|
| 03/18/2019 |
Iowa Insights |
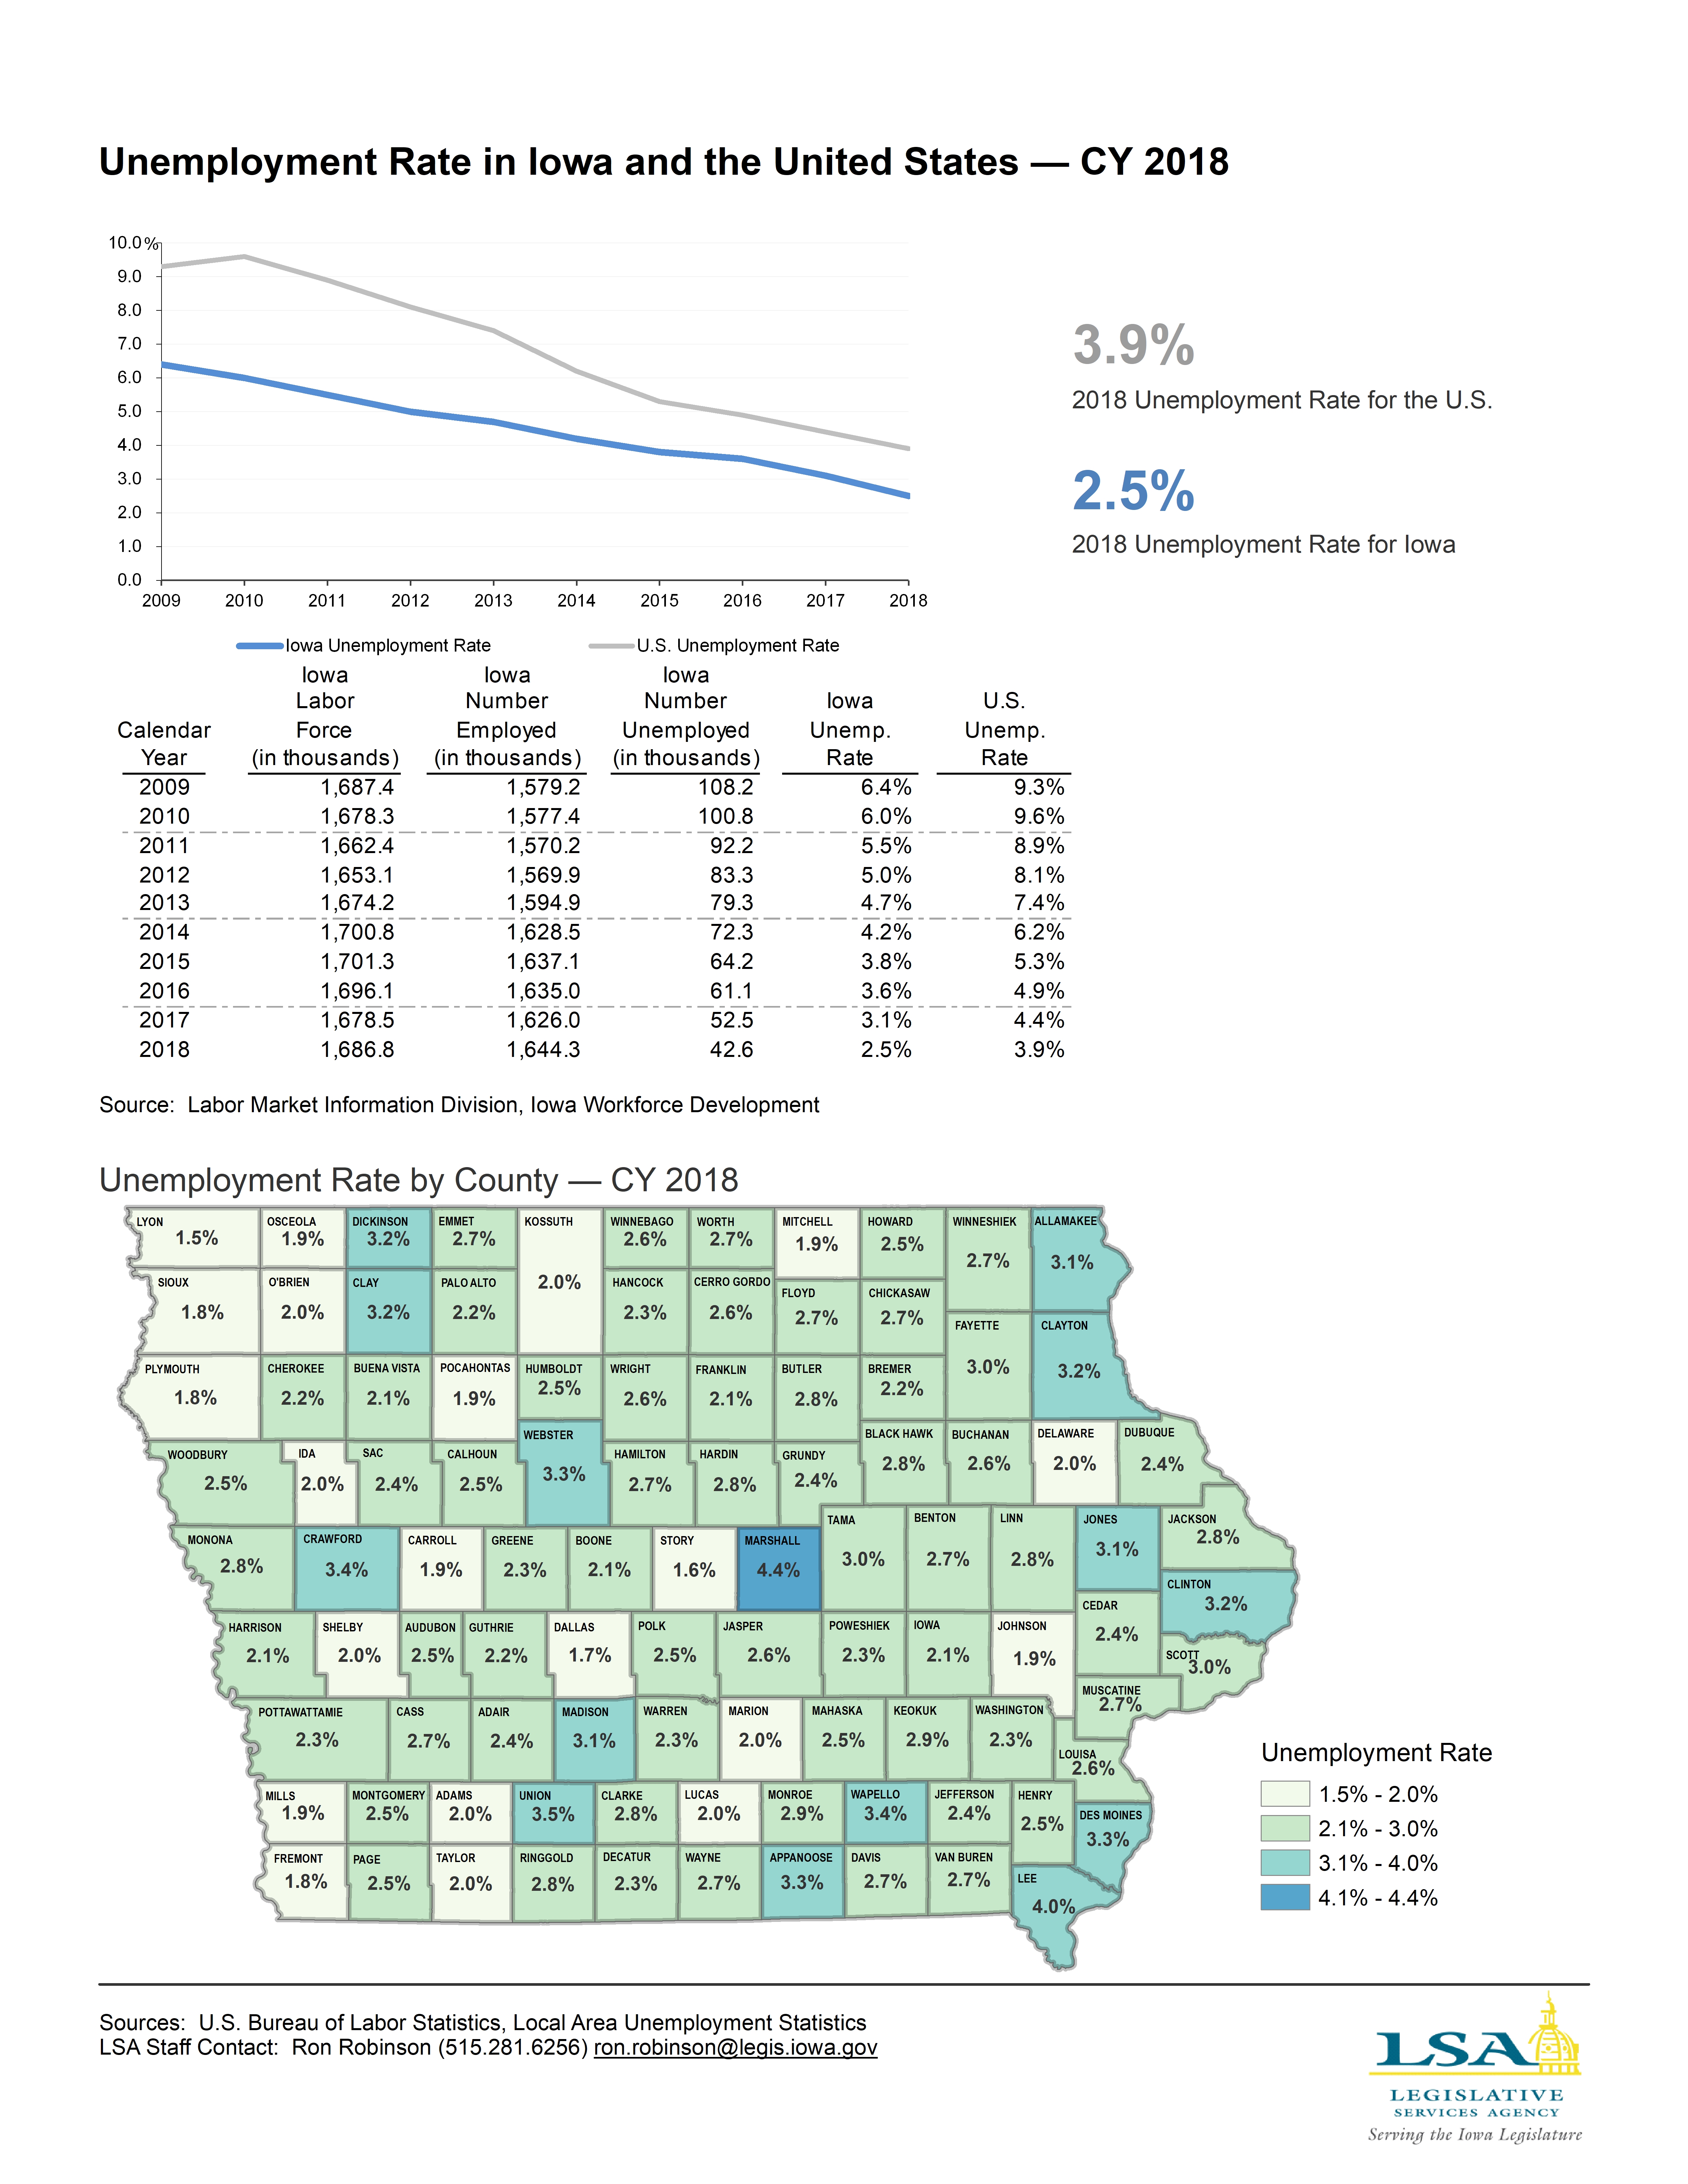
Unemployment Rate in Iowa and the Unitied States — CY 2018
|
|
|
|
|
| 03/11/2019 |
Iowa Insights |
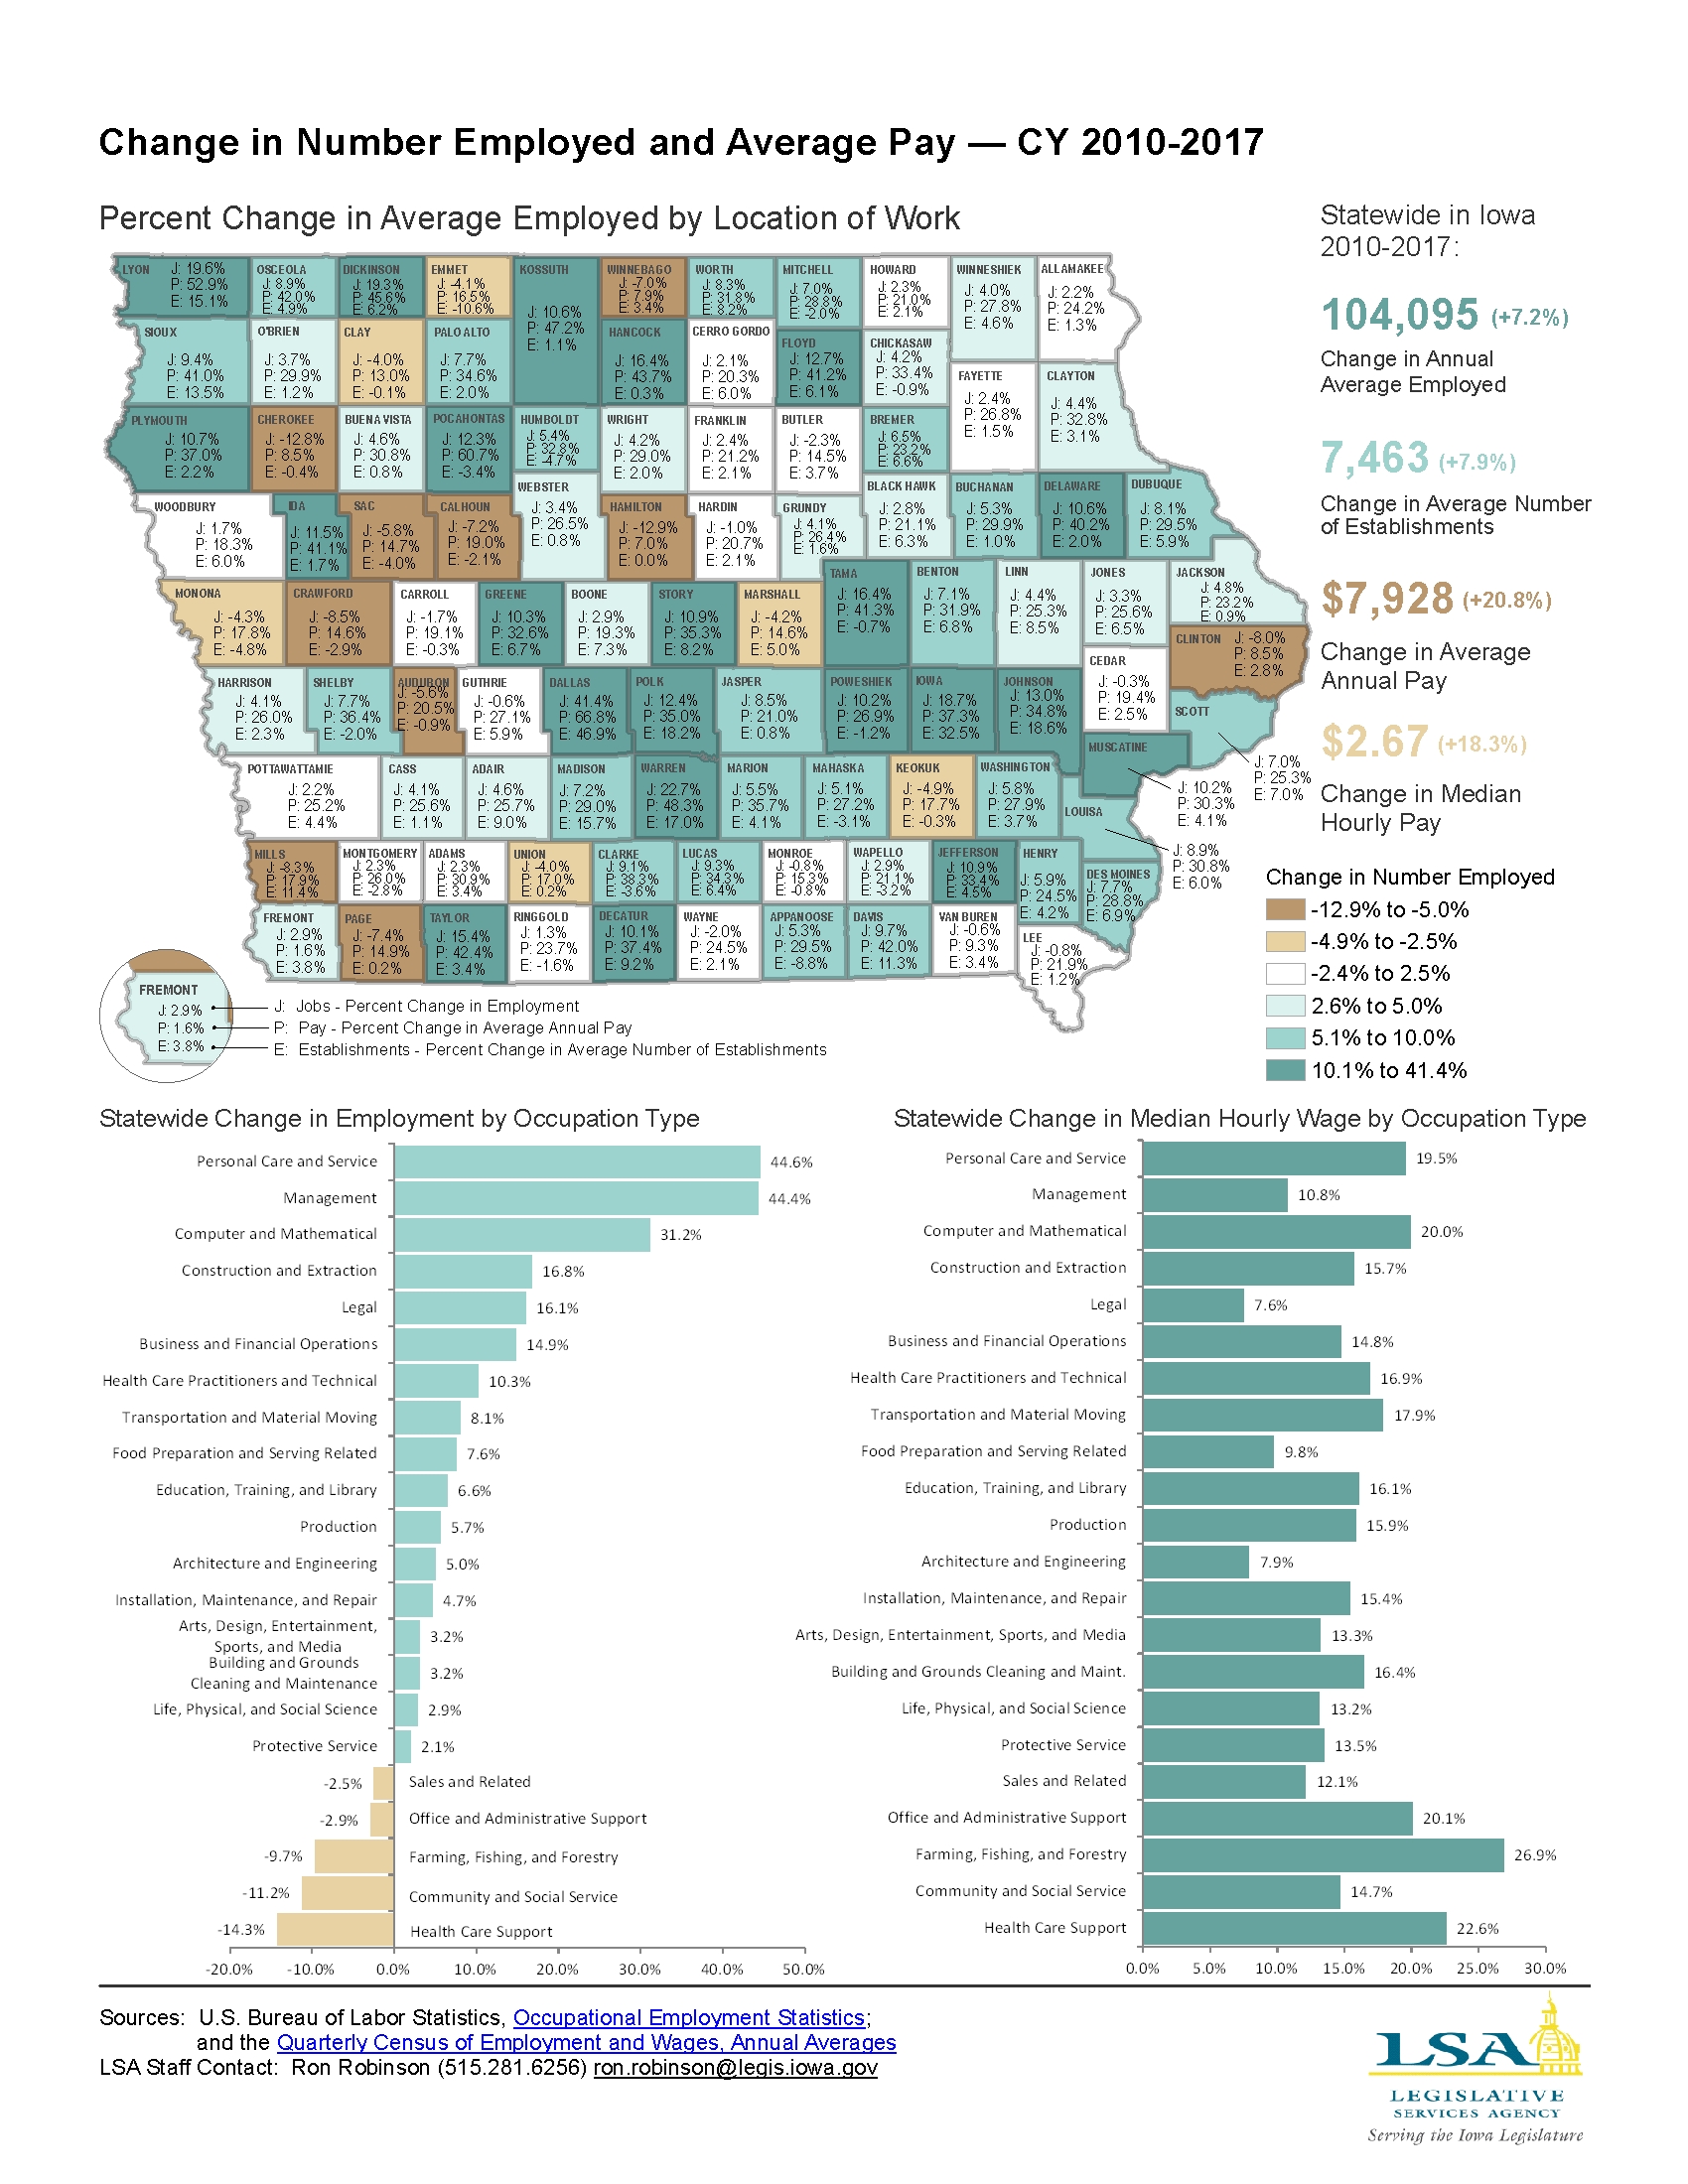
Change in Number Employed and Average Pay — CY 2010-2017
|
|
|
|
|
| 03/04/2019 |
Iowa Insights |
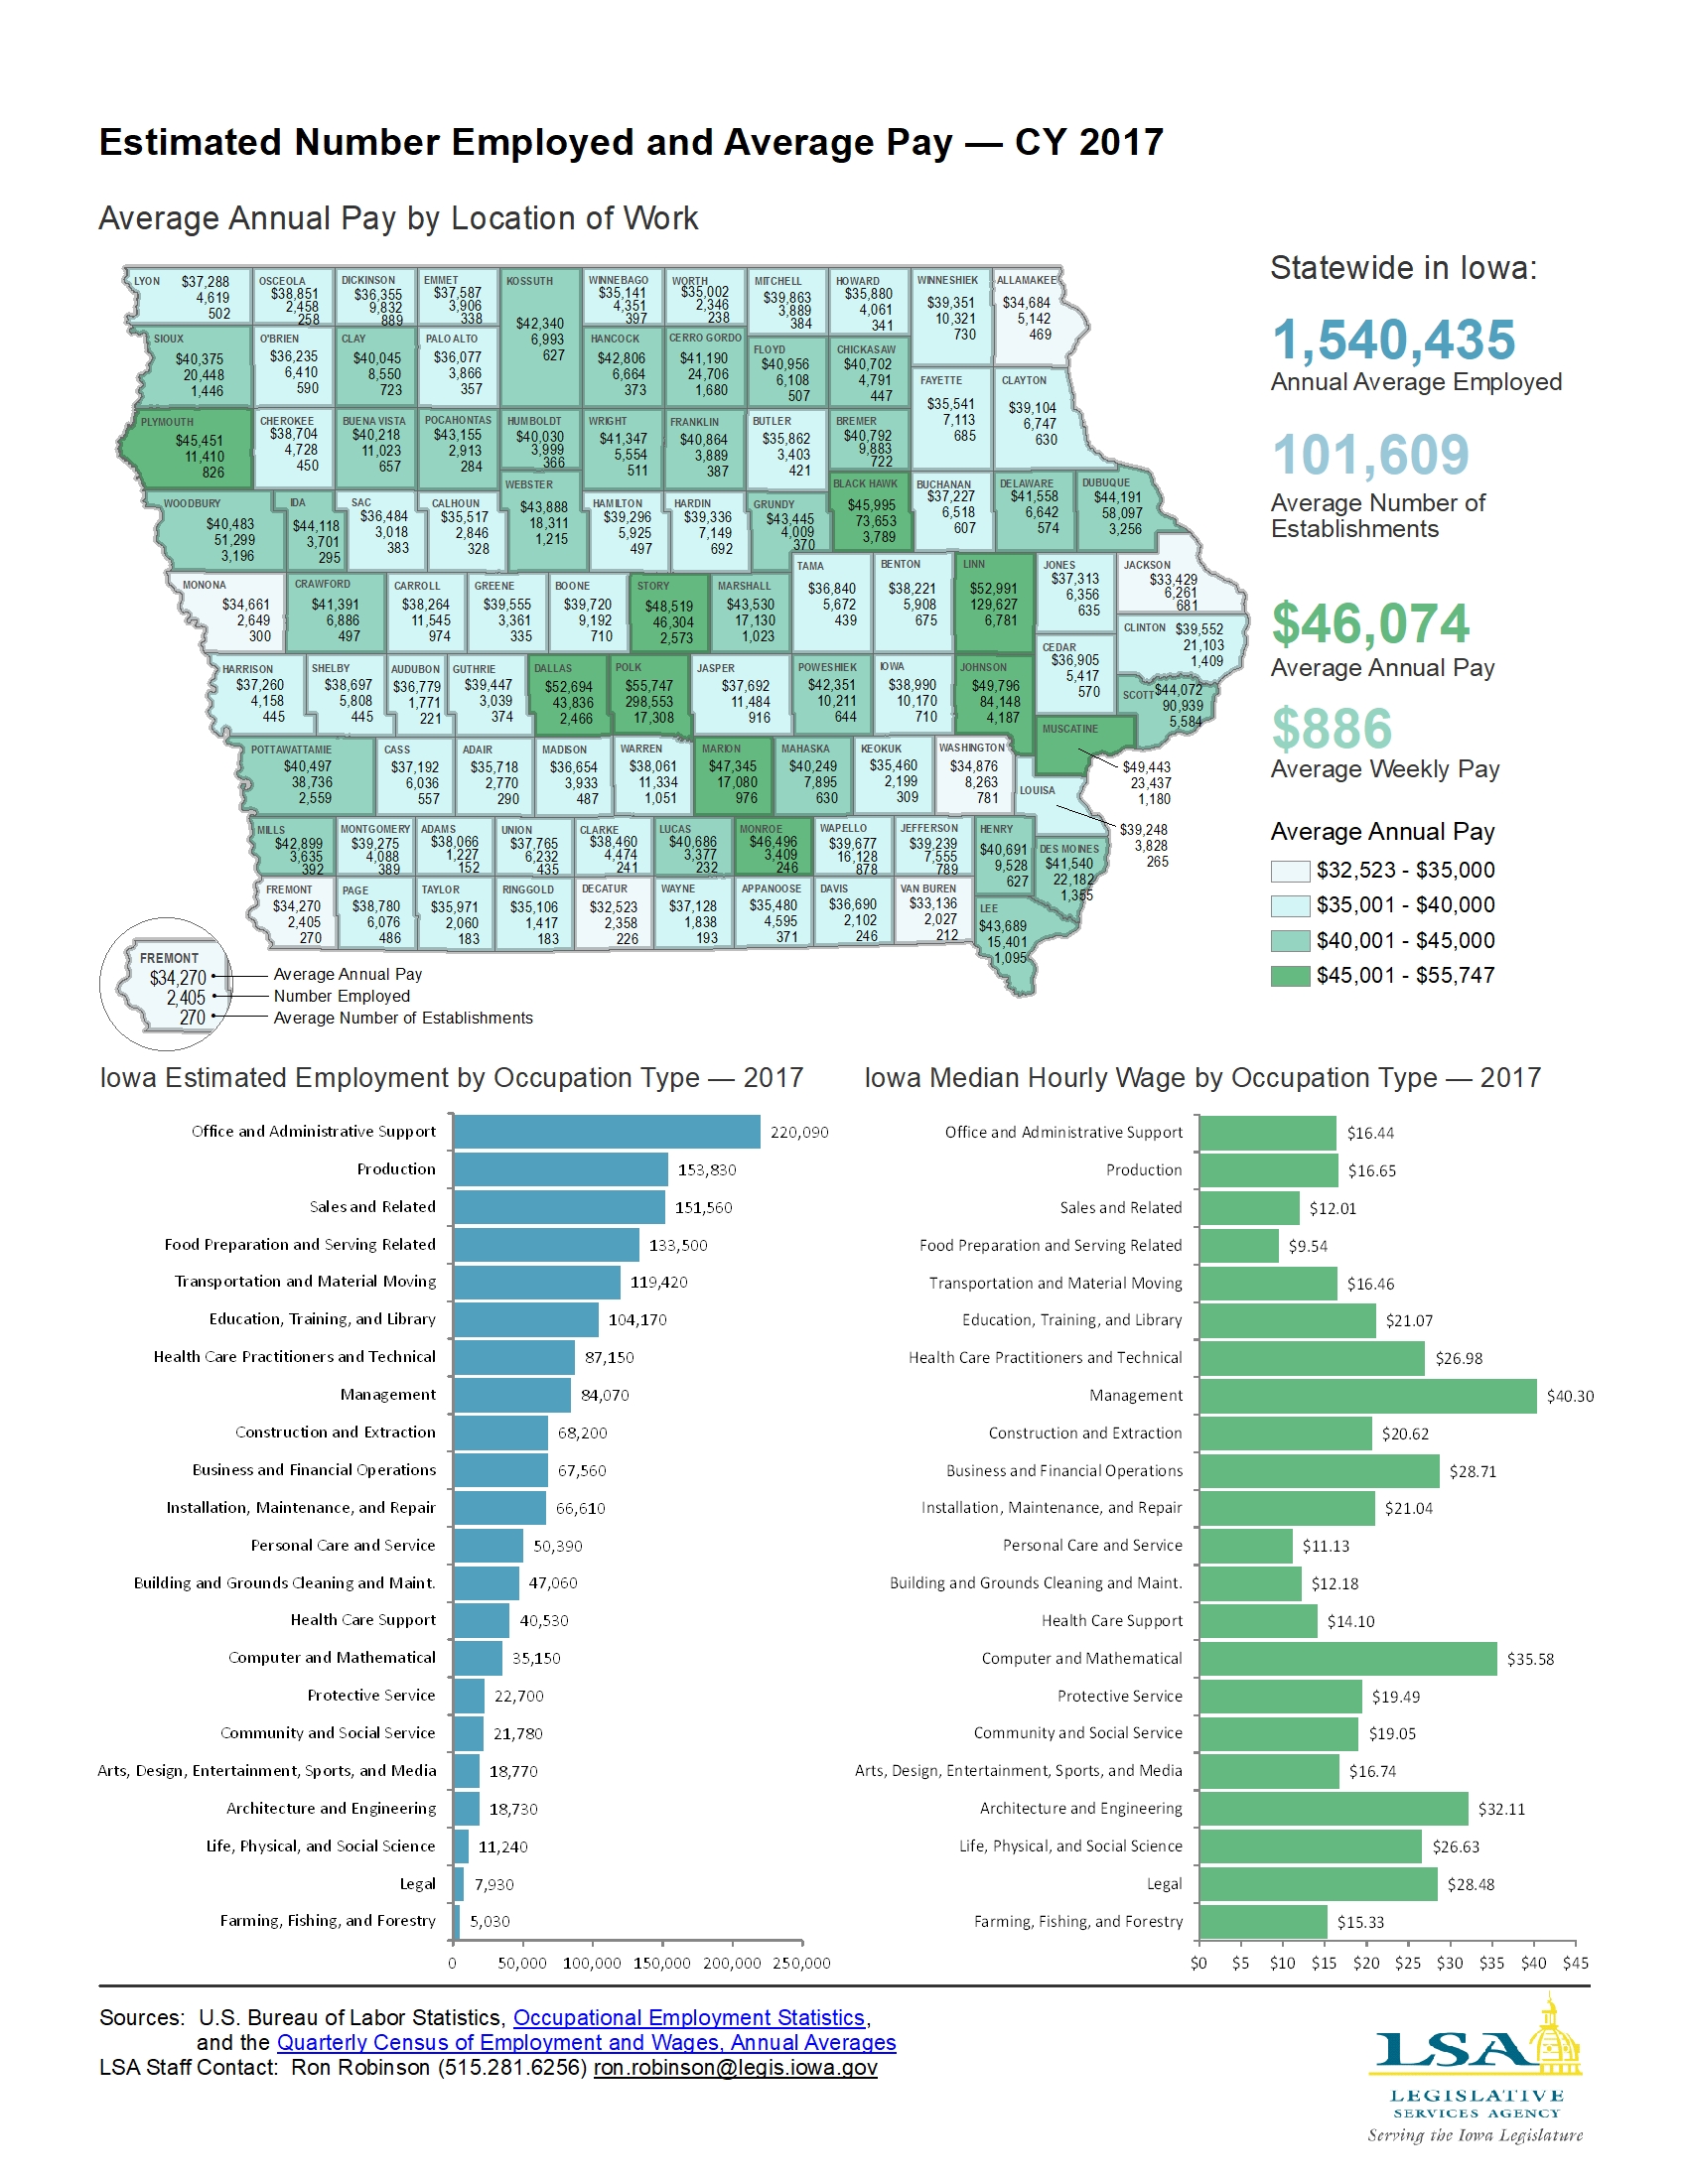
Estimated Number Employed and Average Pay — CY 2017
|
|
|
|
|
| 02/25/2019 |
Iowa Insights |
Iowa Great Places — FY 2019

|
|
|
|
|
| 02/18/2019 |
Iowa Insights |
Industrial Hemp — 2018

|
|
|
|
|
| 02/11/2019 |
Iowa Insights |
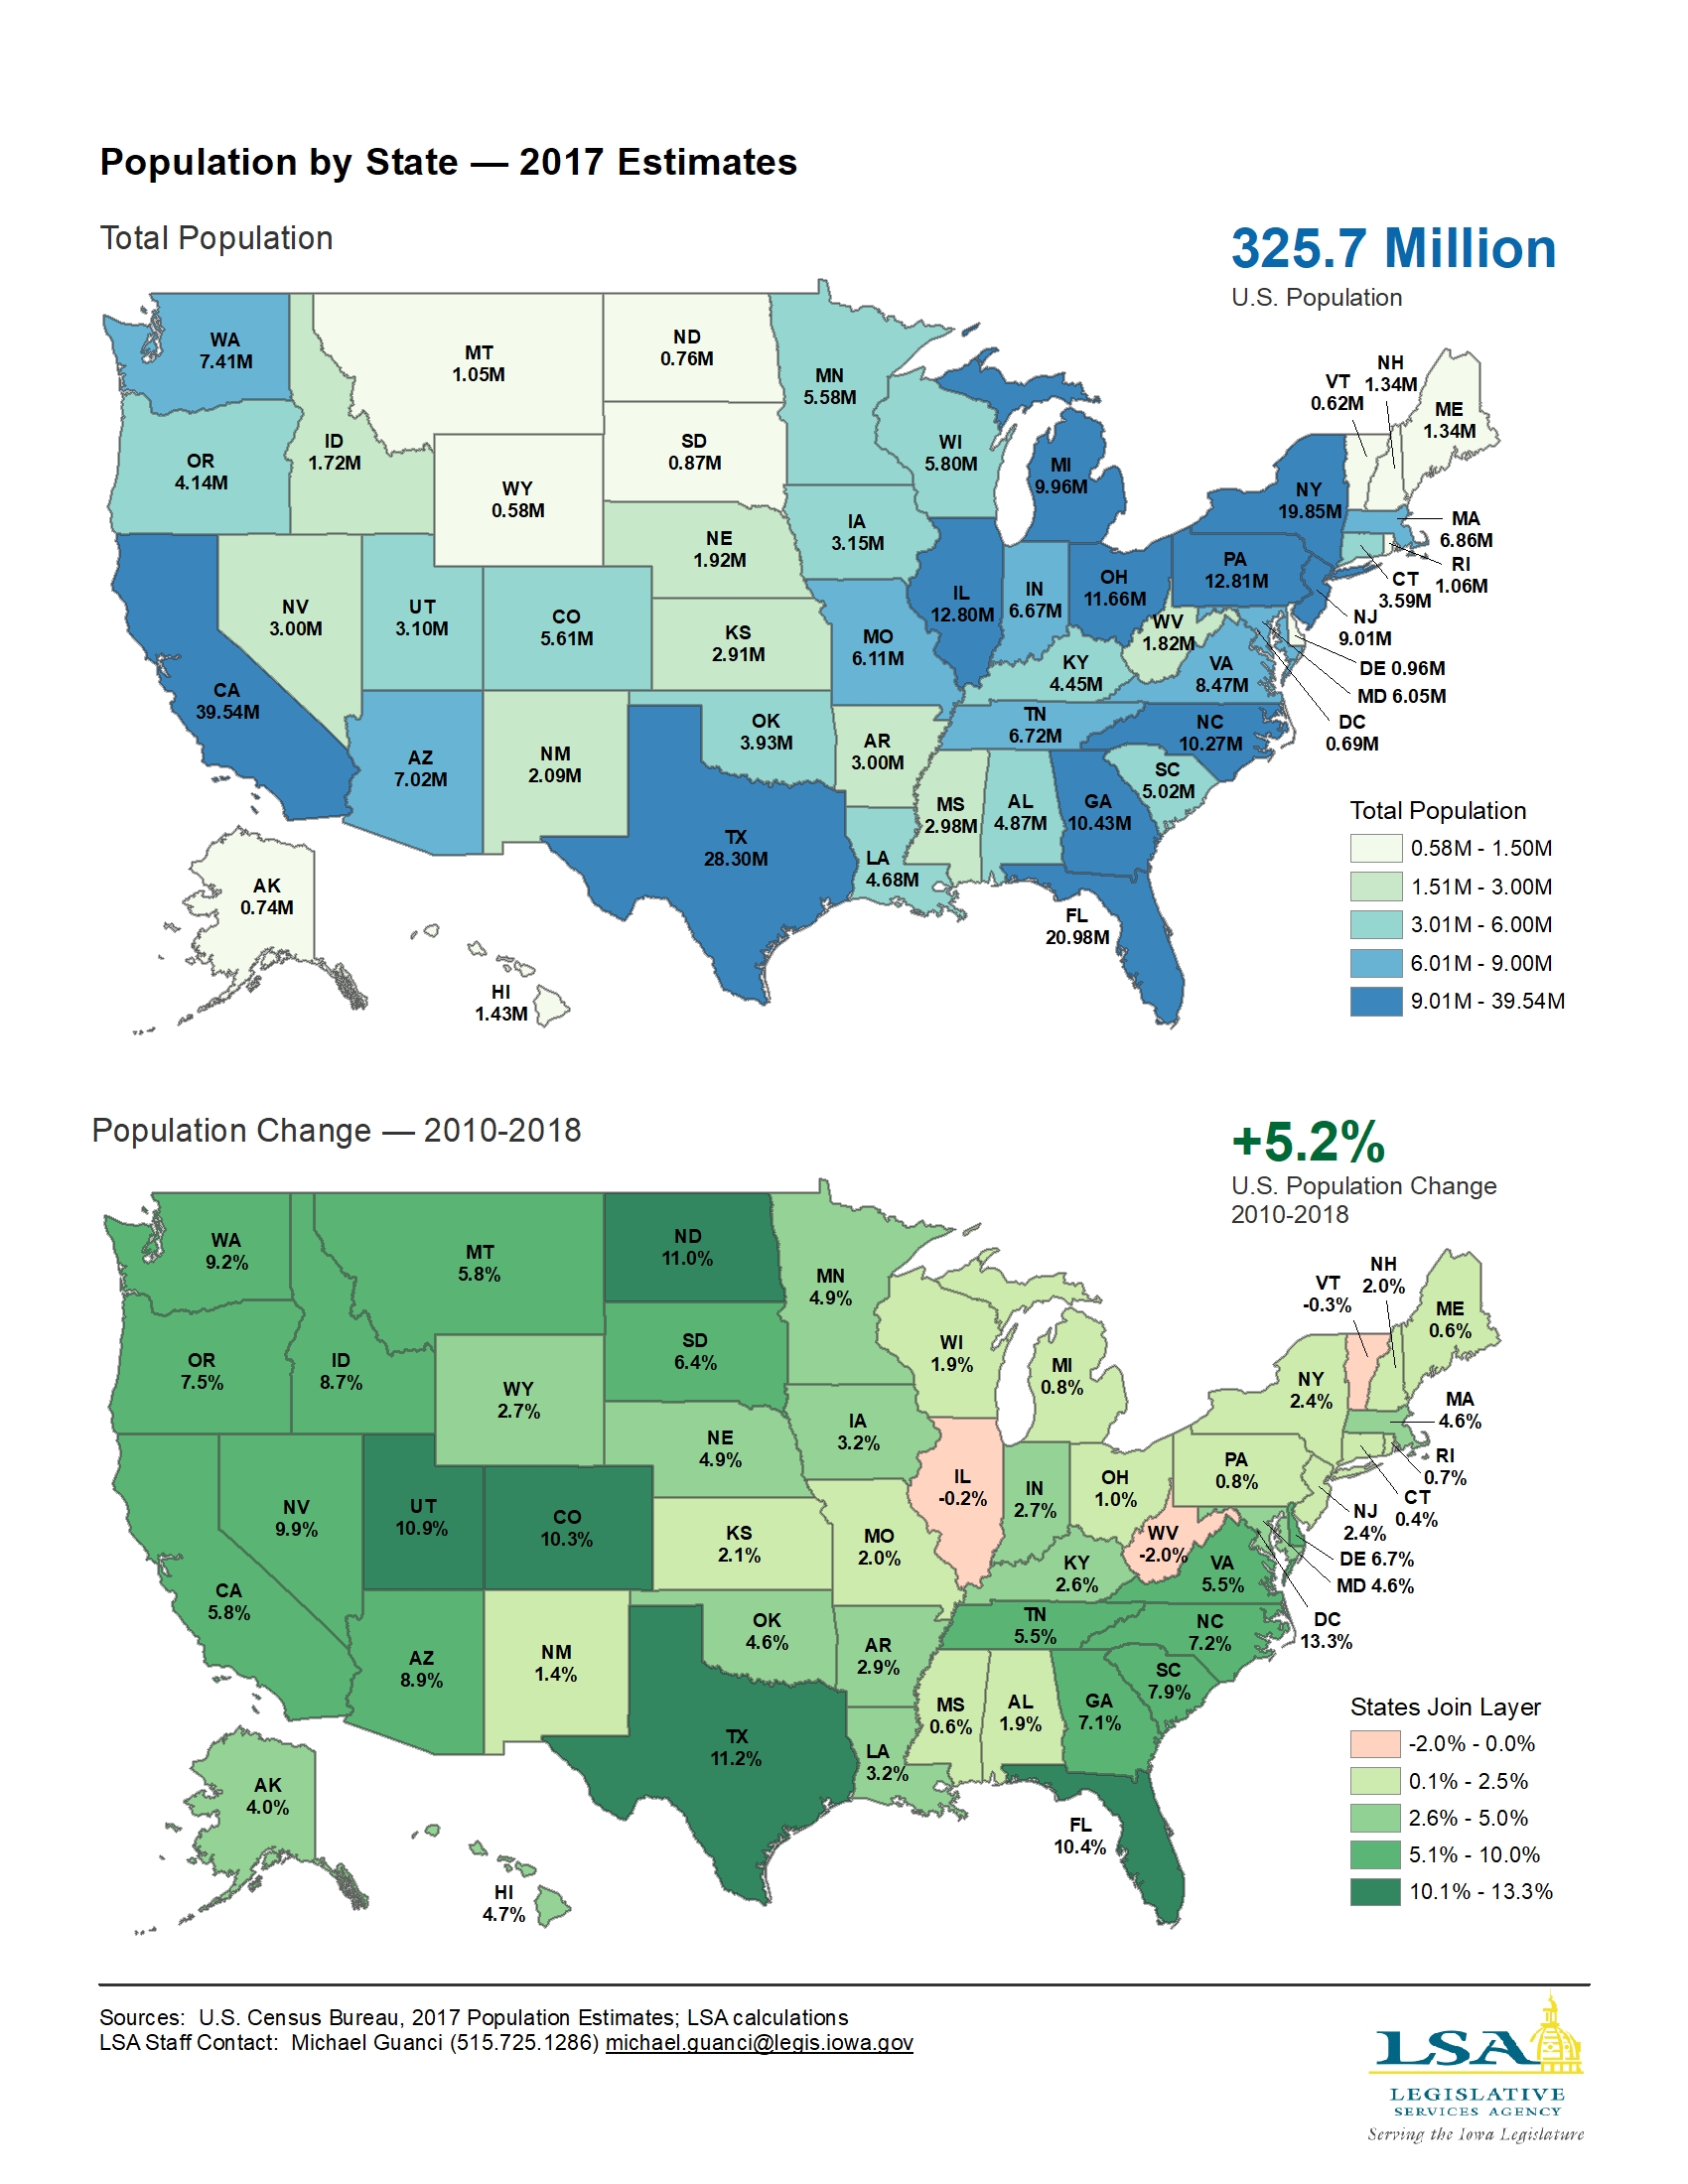
Population by State — 2017
|
|
|
|
|
| 02/04/2019 |
Iowa Insights |
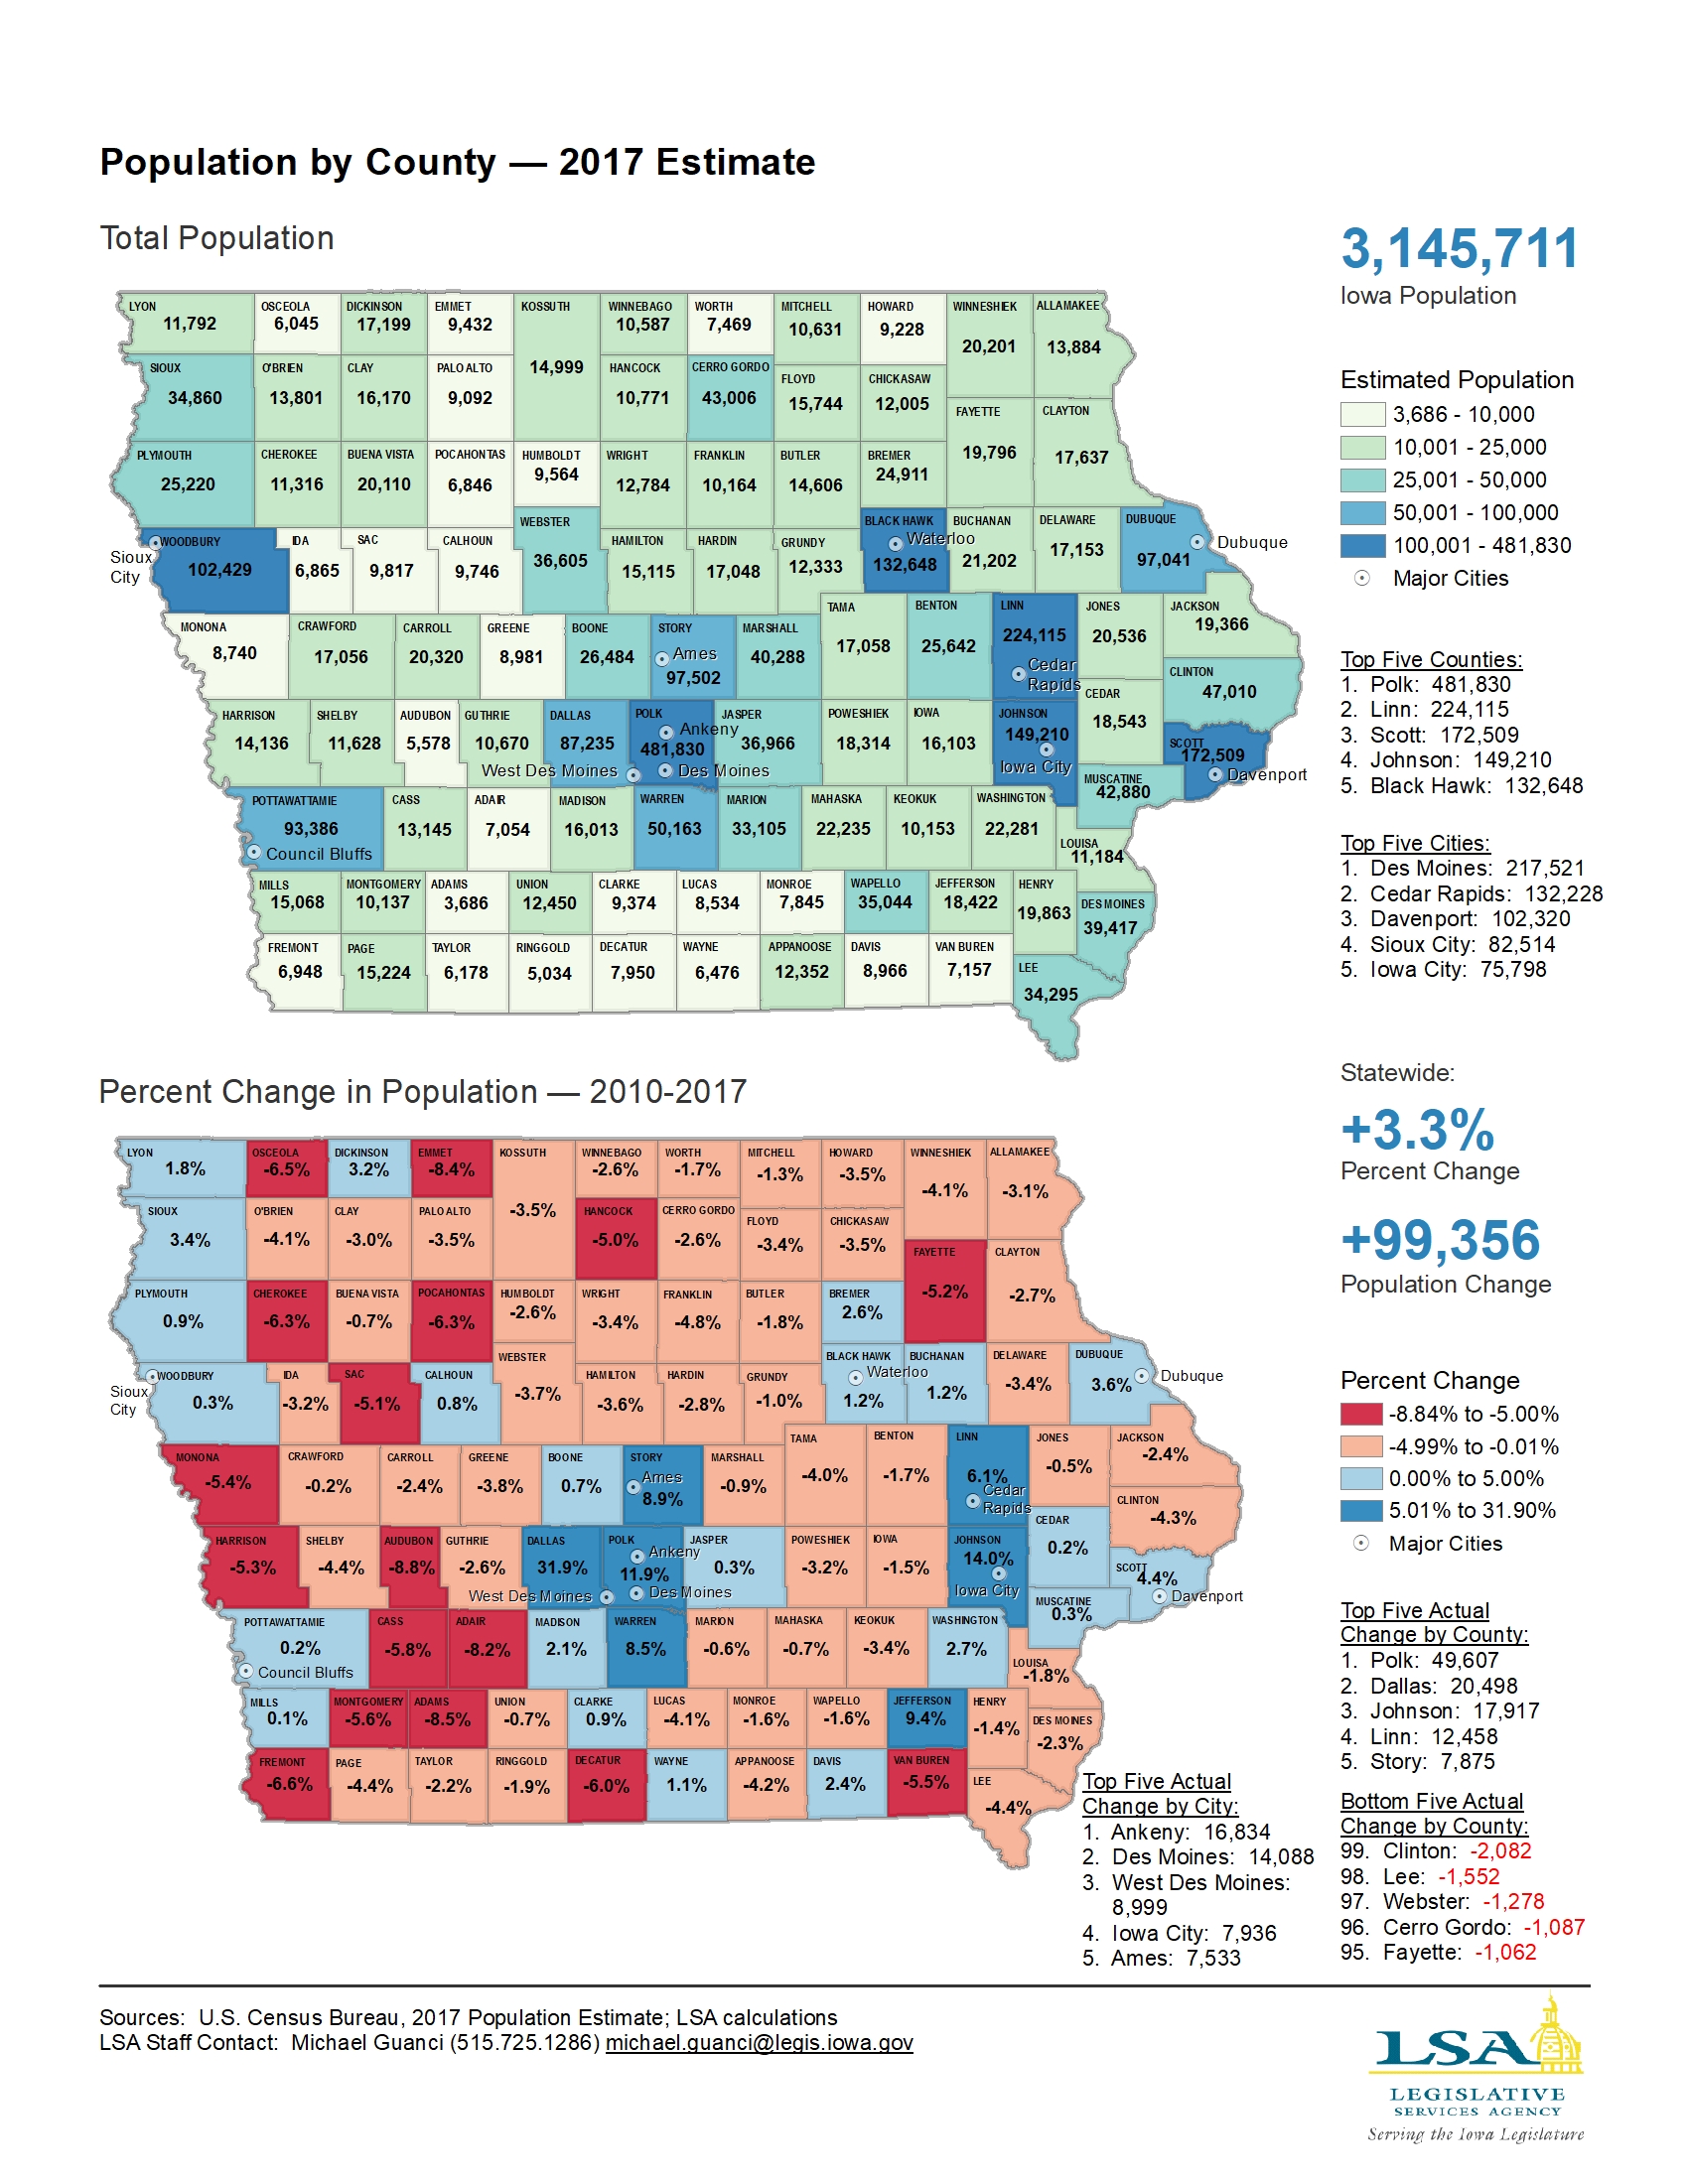
Population by County — 2017
|
|
|
|
|
| 01/28/2019 |
Iowa Insights |
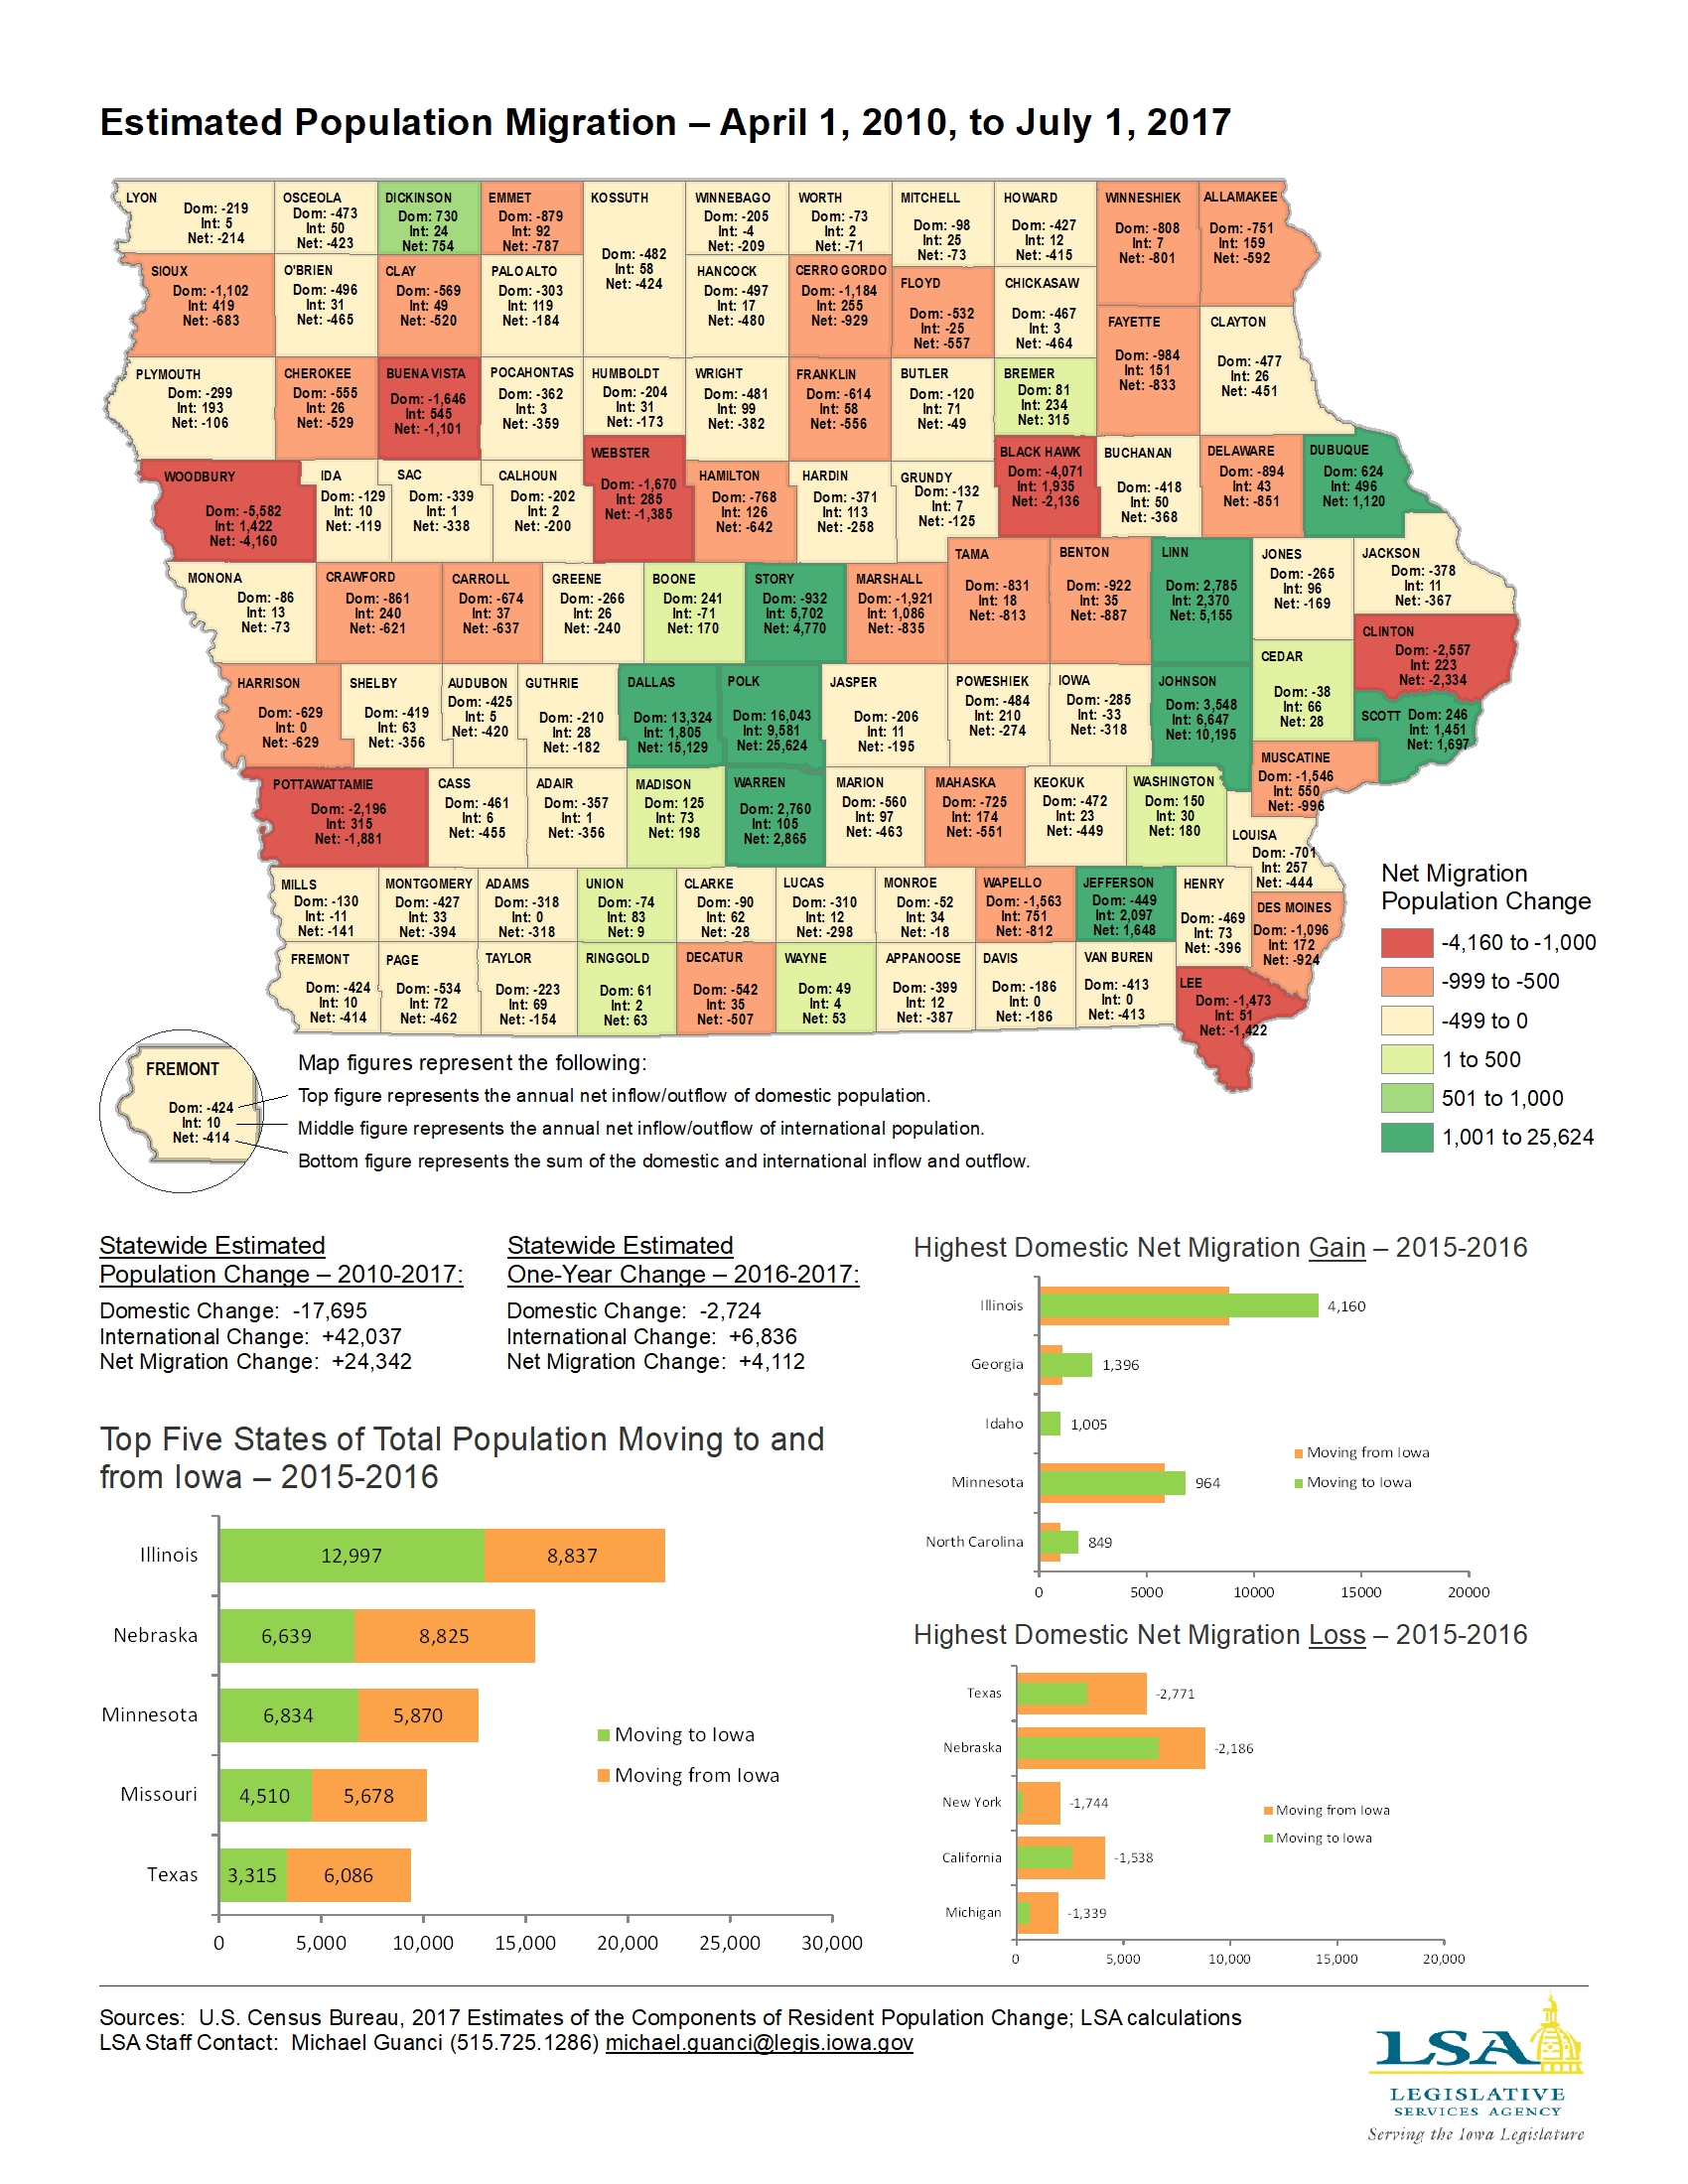
Population Migration by County — 2017
|
|
|
|
|
| 01/21/2019 |
Iowa Insights |
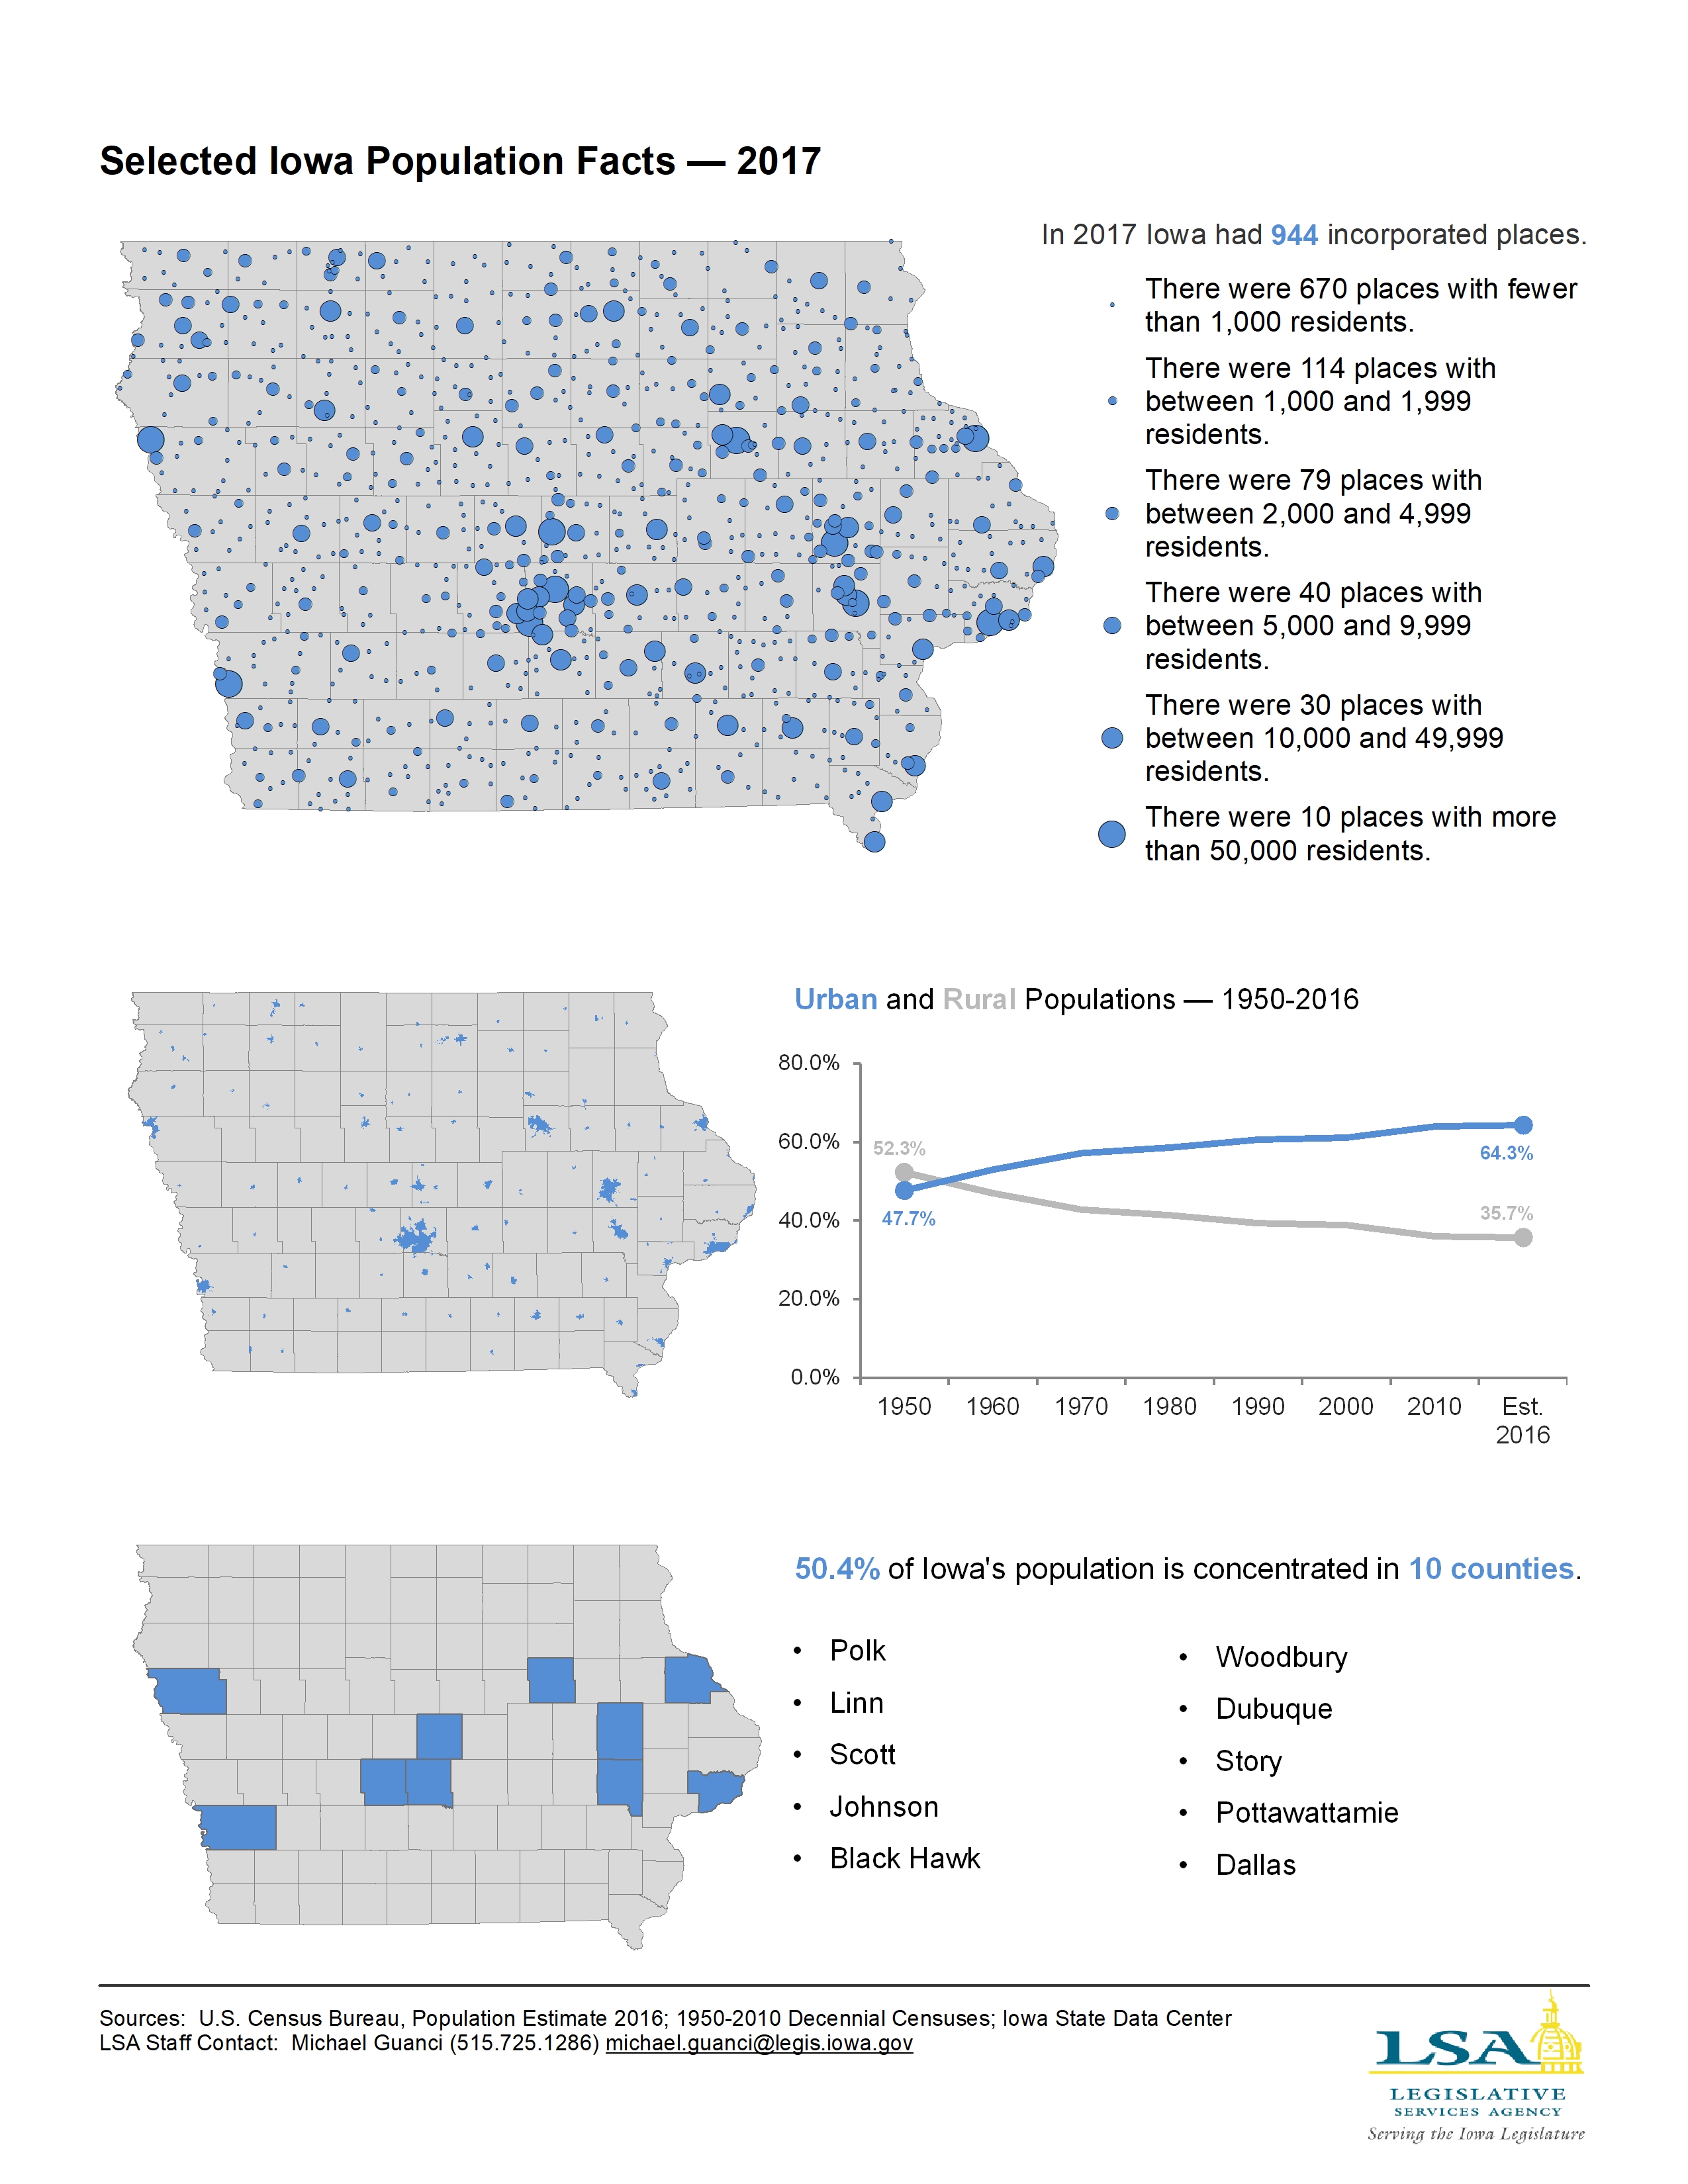
Selected Iowa Population Facts — 2017
|
|
|
|
|
| 01/07/2019 |
Iowa Insights |
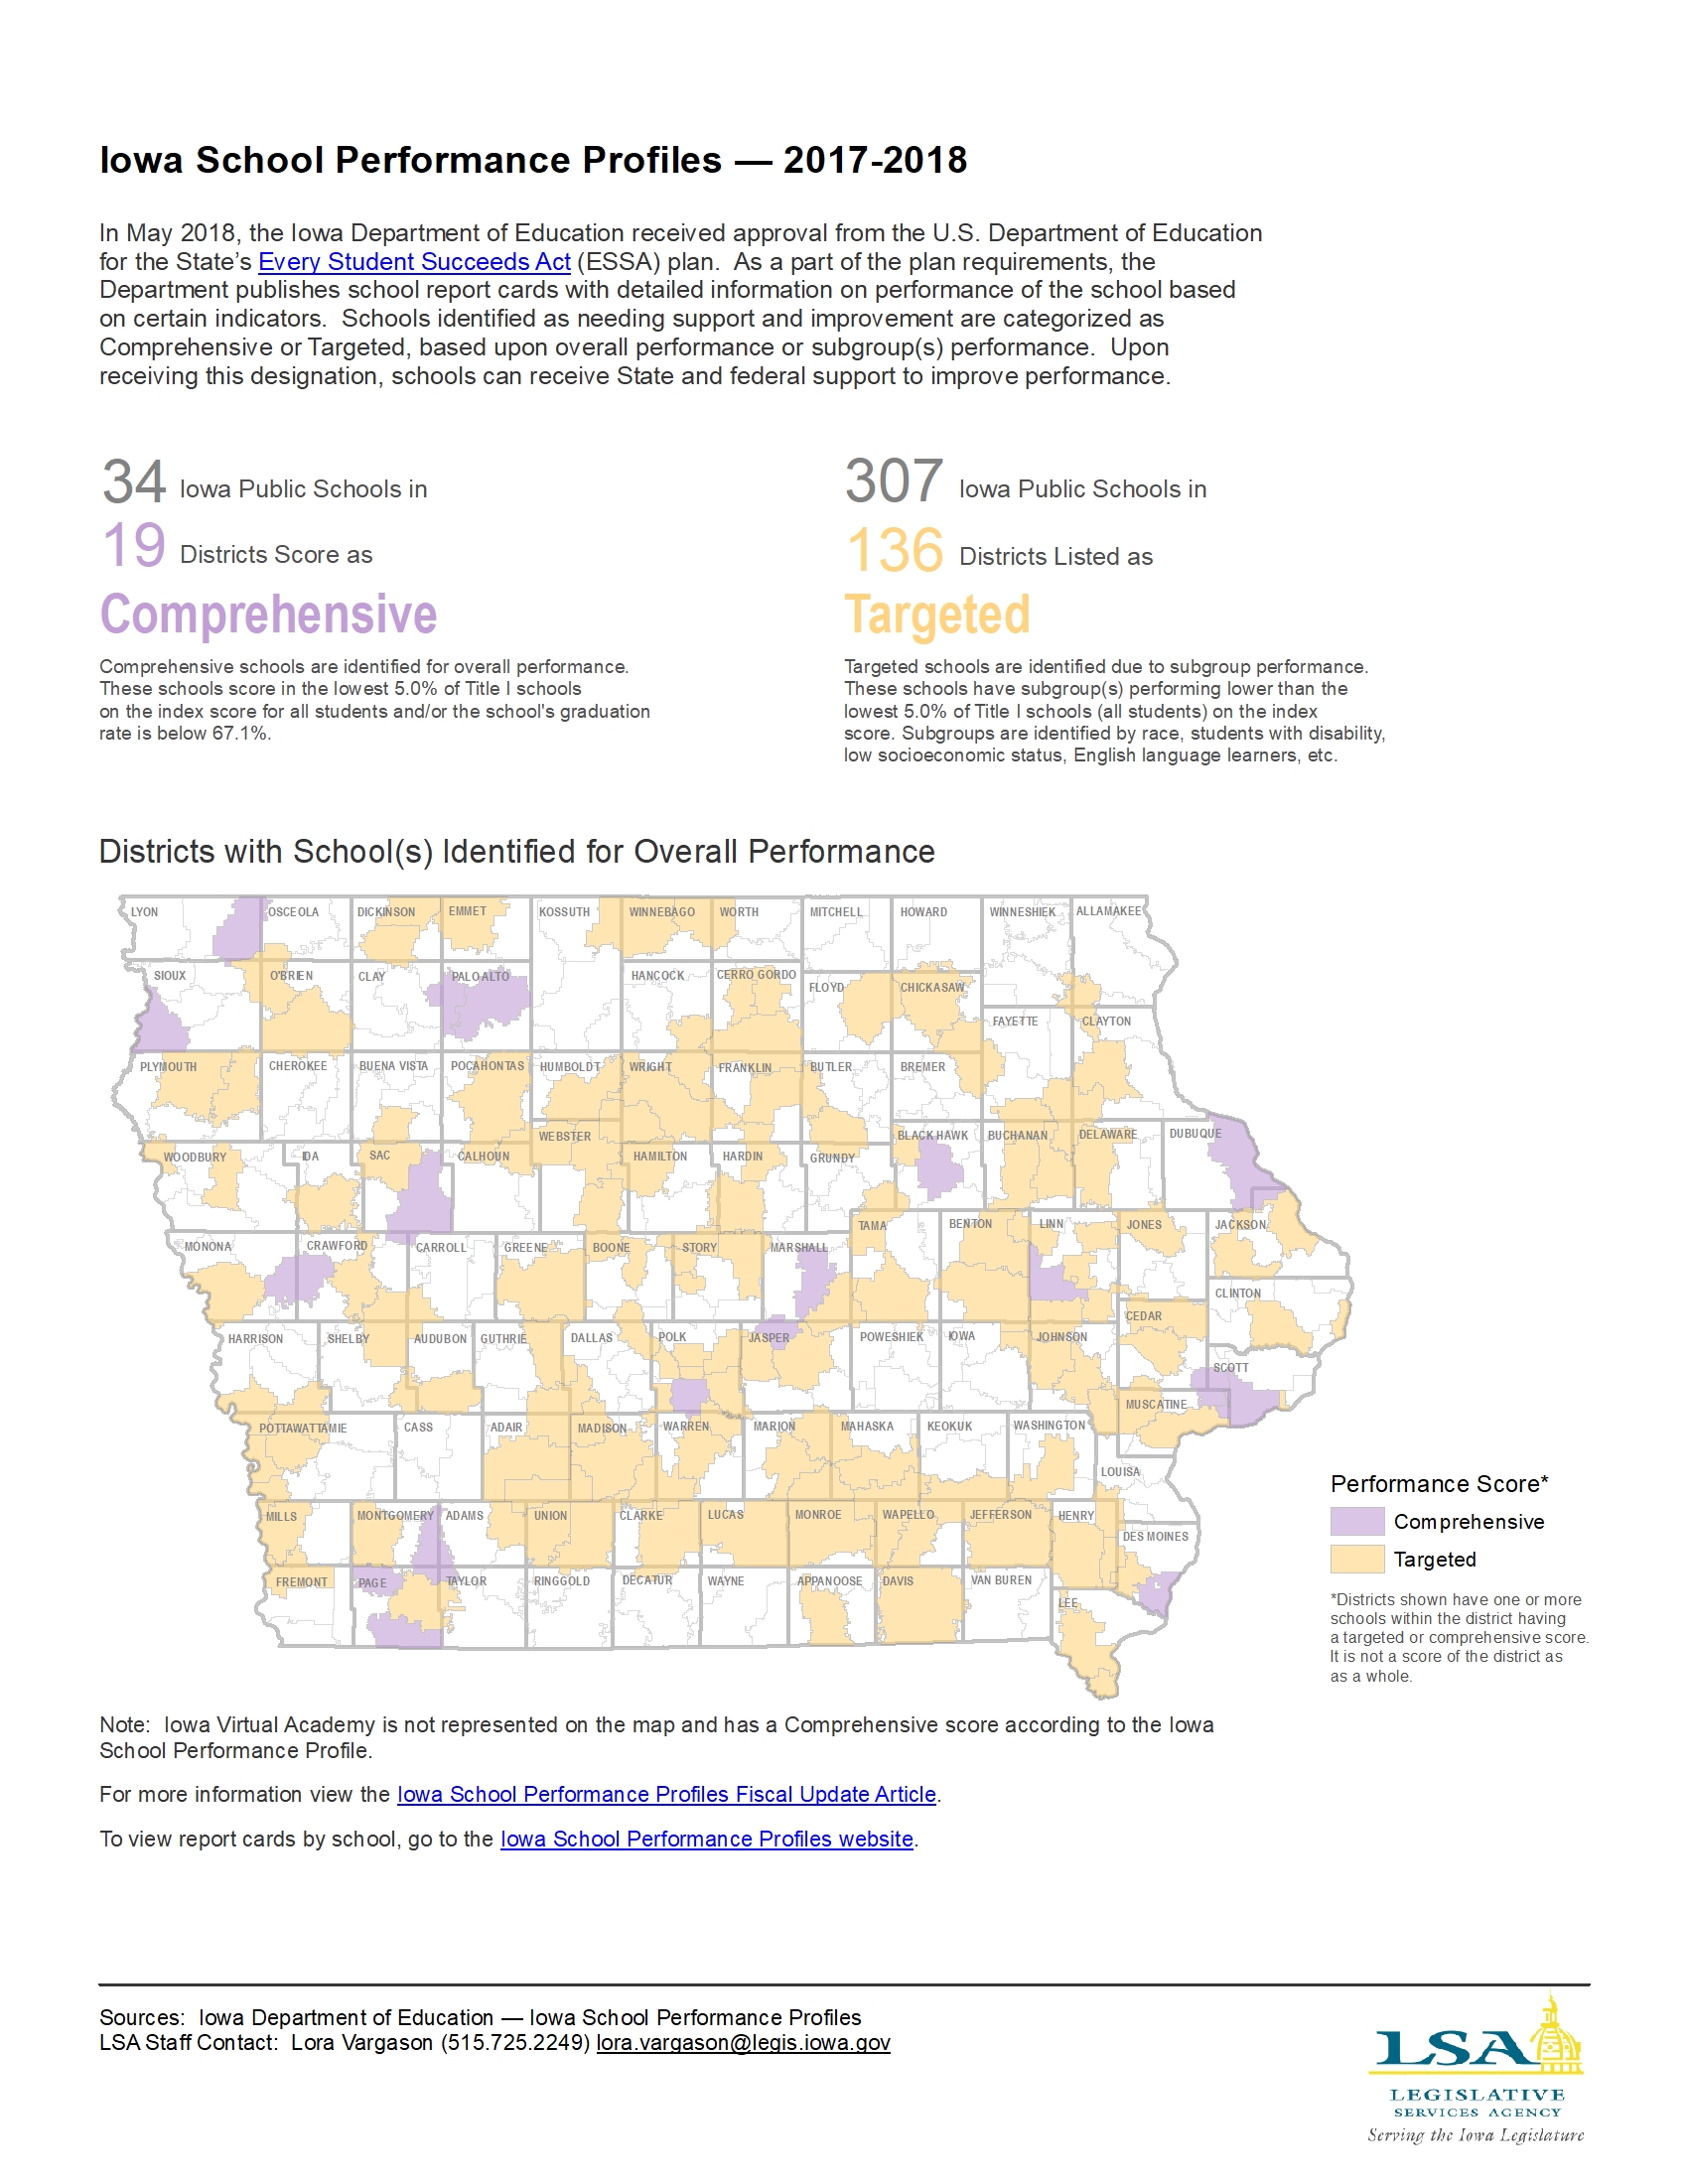
Iowa School Performance Profiles — 2017-2018
|
|
|
|
|
| 12/10/2018 |
Iowa Insights |
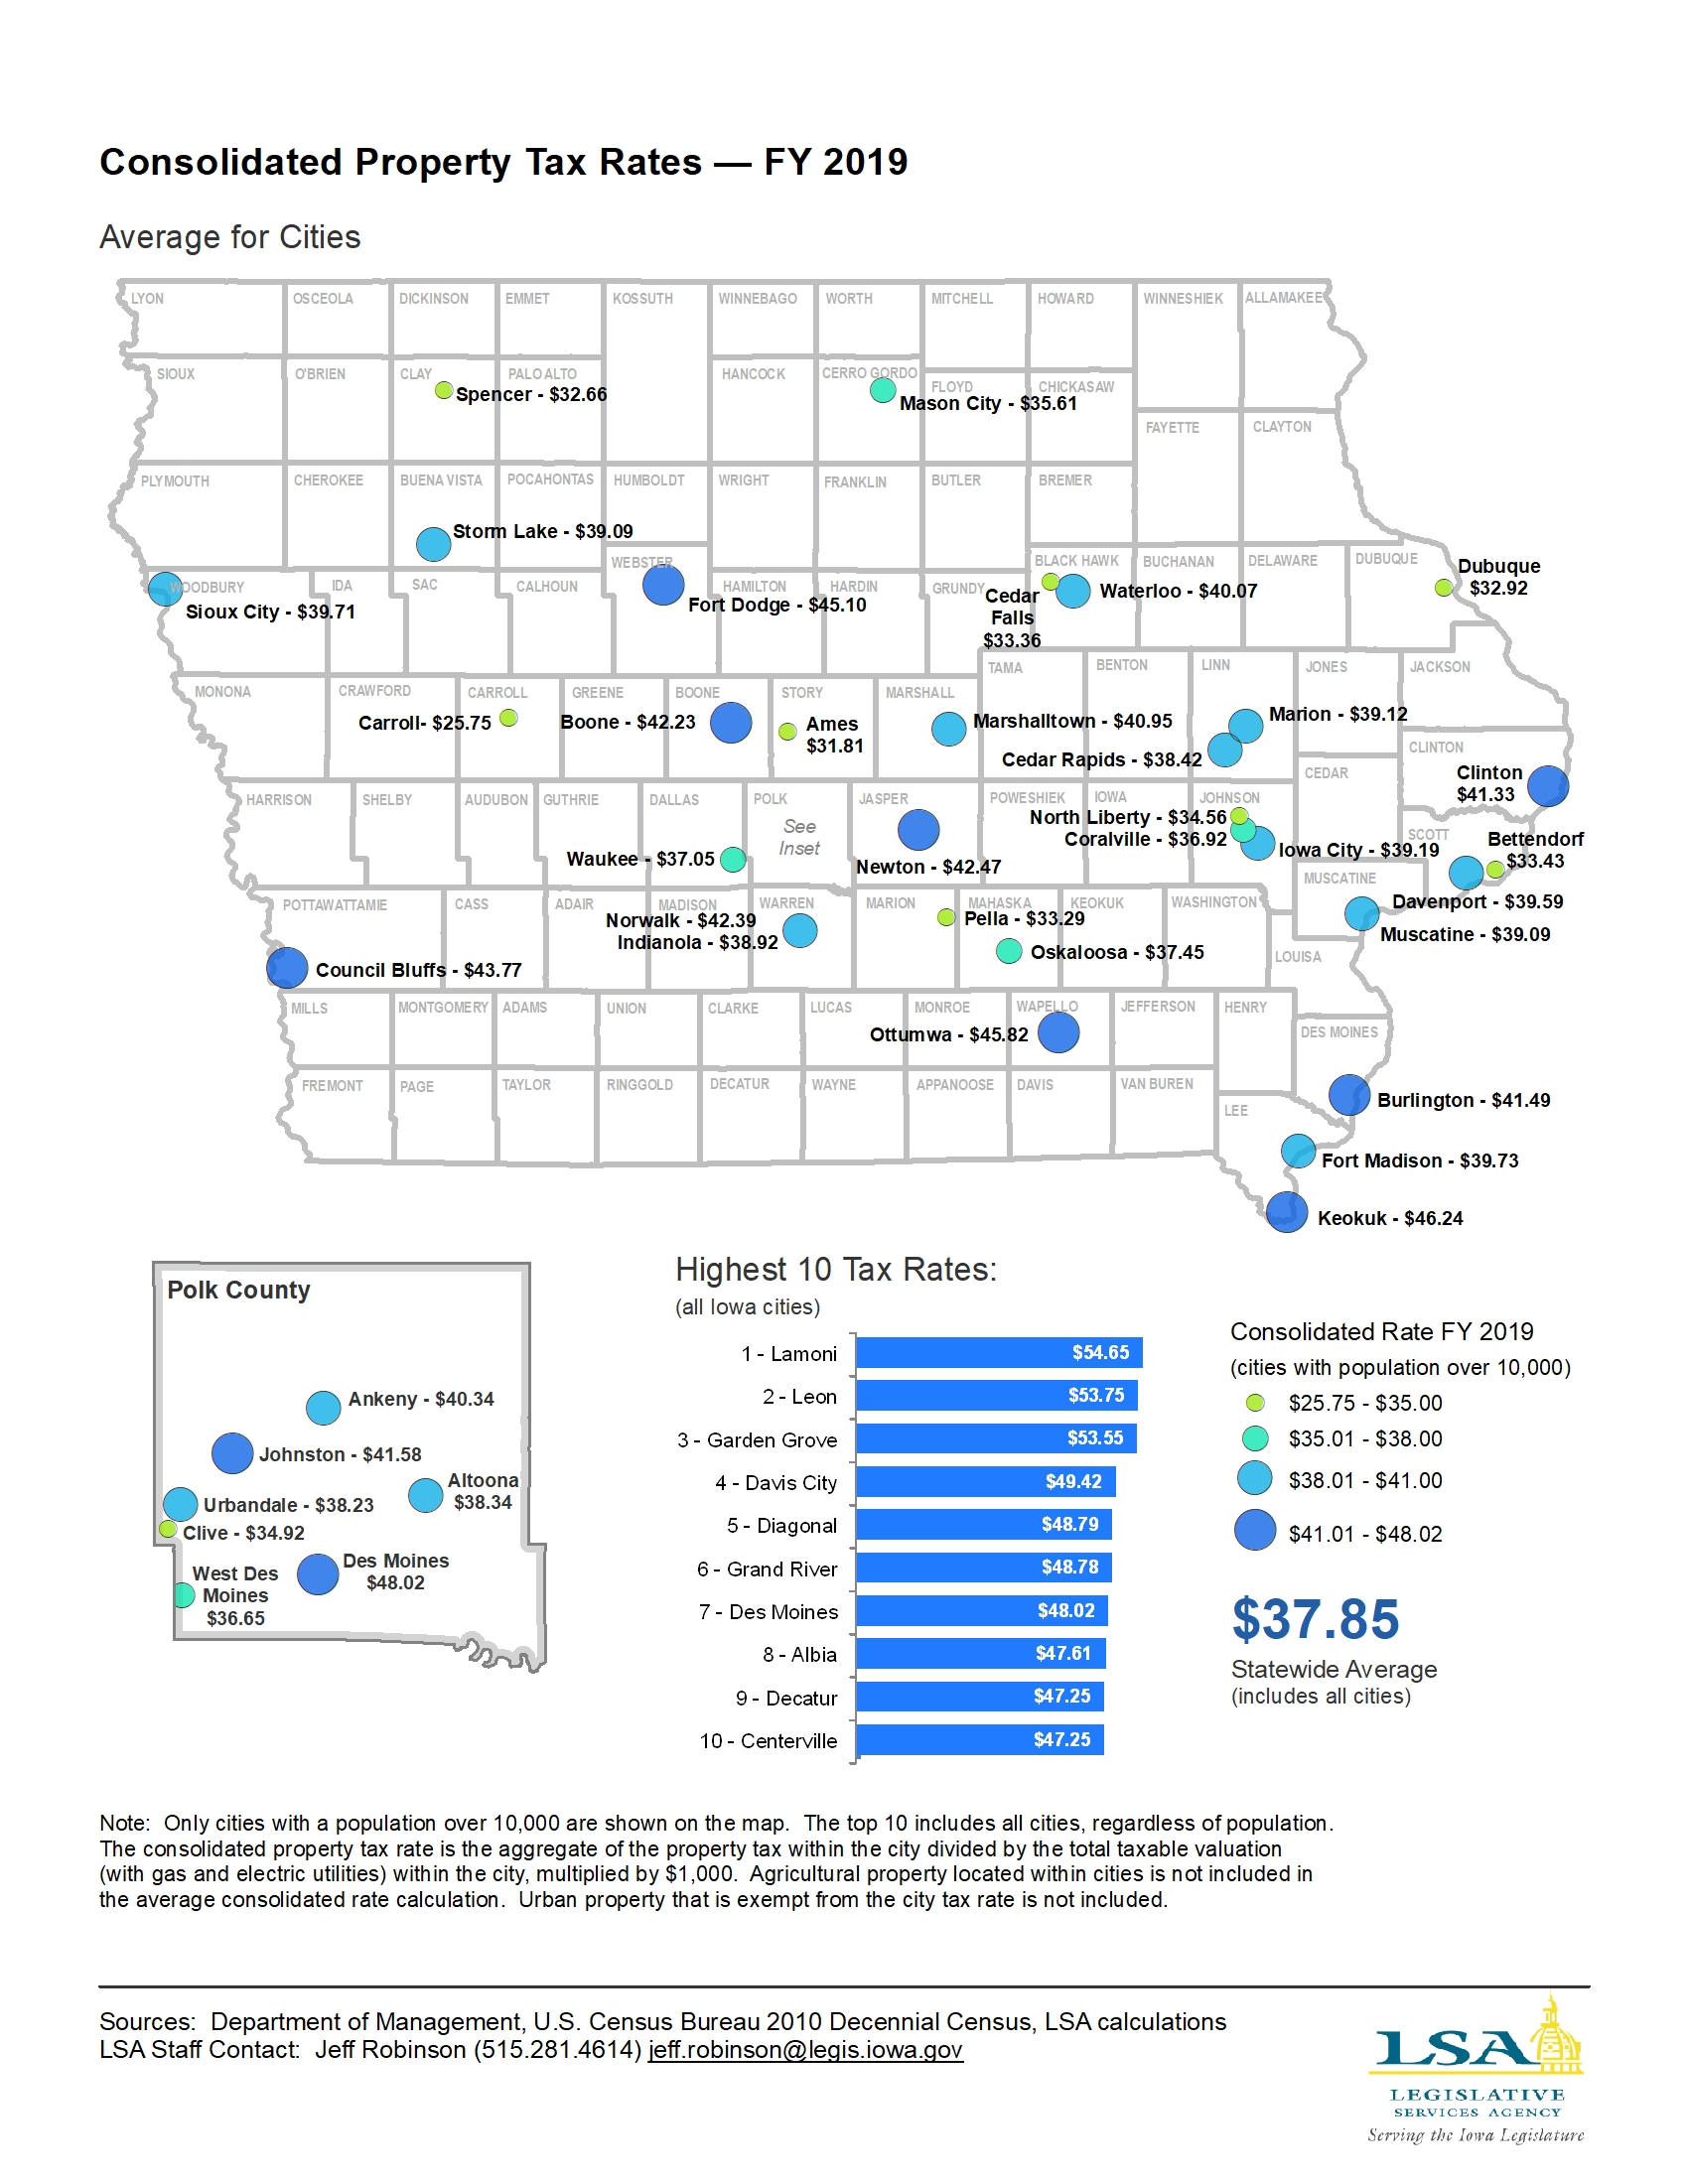
Consolidated Property Tax Rates by City — FY 2019
|
|
|
|
|
| 11/26/2018 |
Iowa Insights |
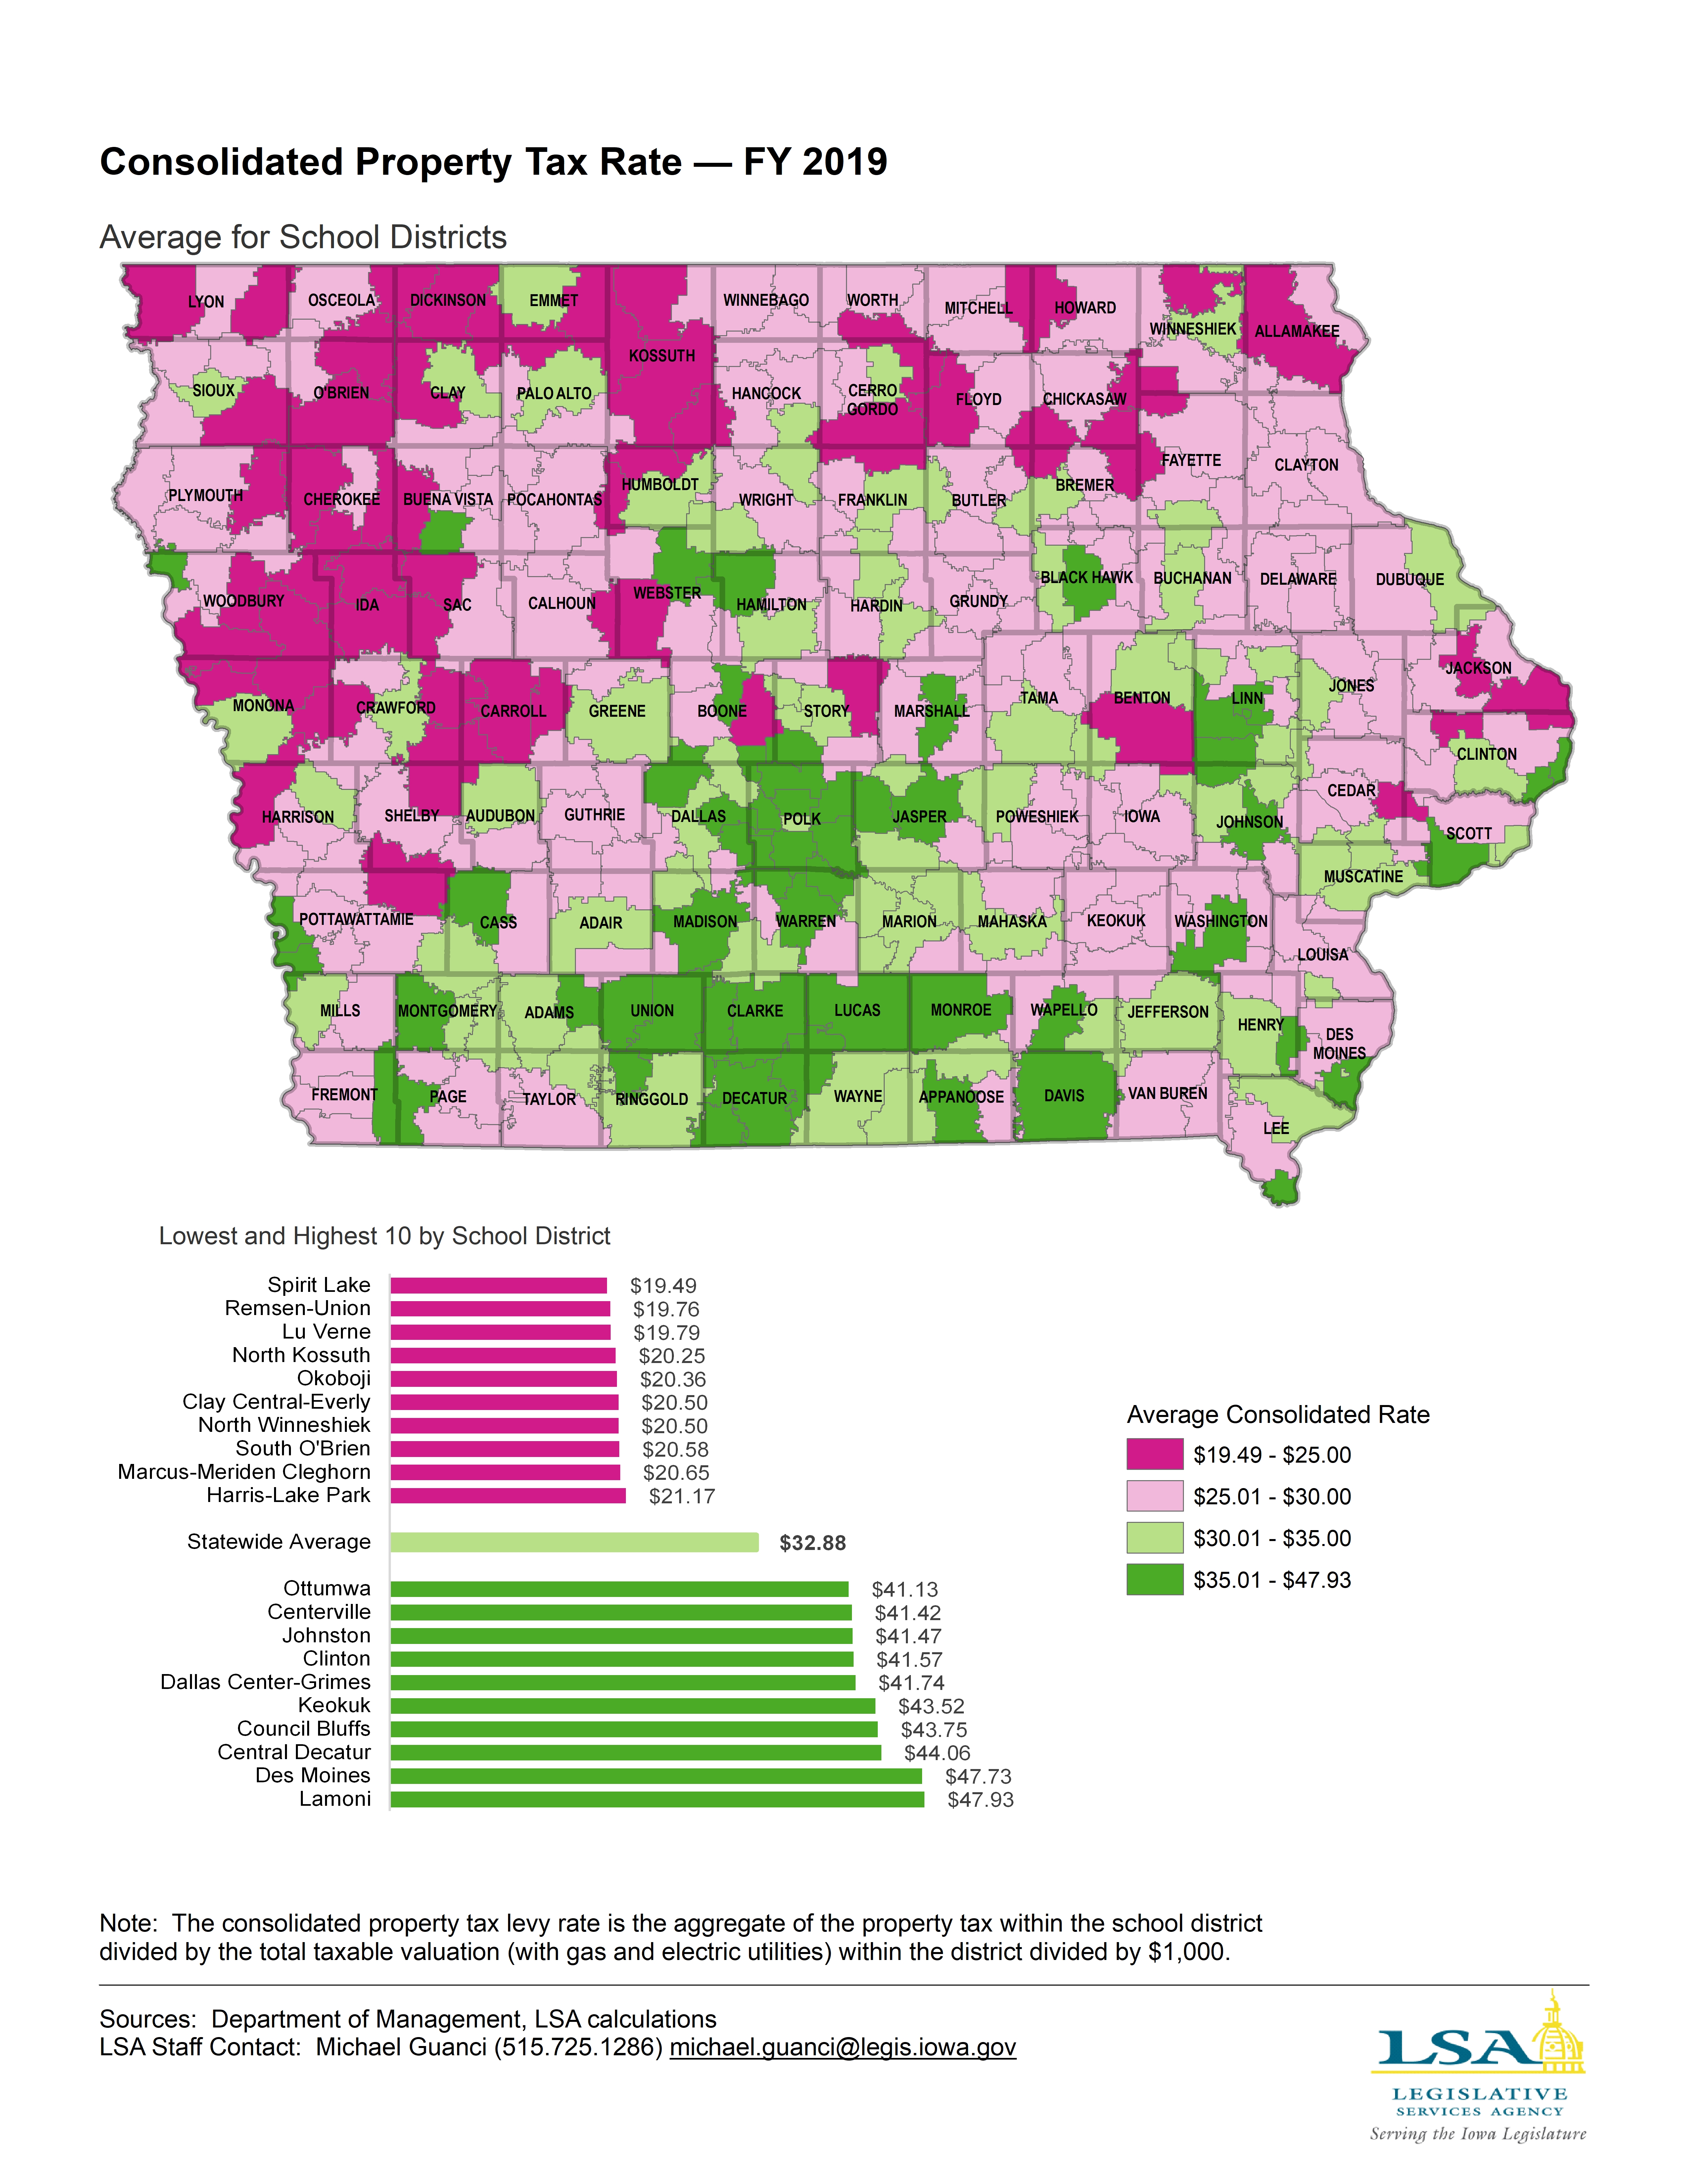
Map — Consolidated Property Tax Rates by School District
|
|
|
|
|
| 11/19/2018 |
Iowa Insights |
Map — Taxable Valuation by Property Classification by County

|
|
|
|
|
| 11/09/2018 |
Iowa Insights |
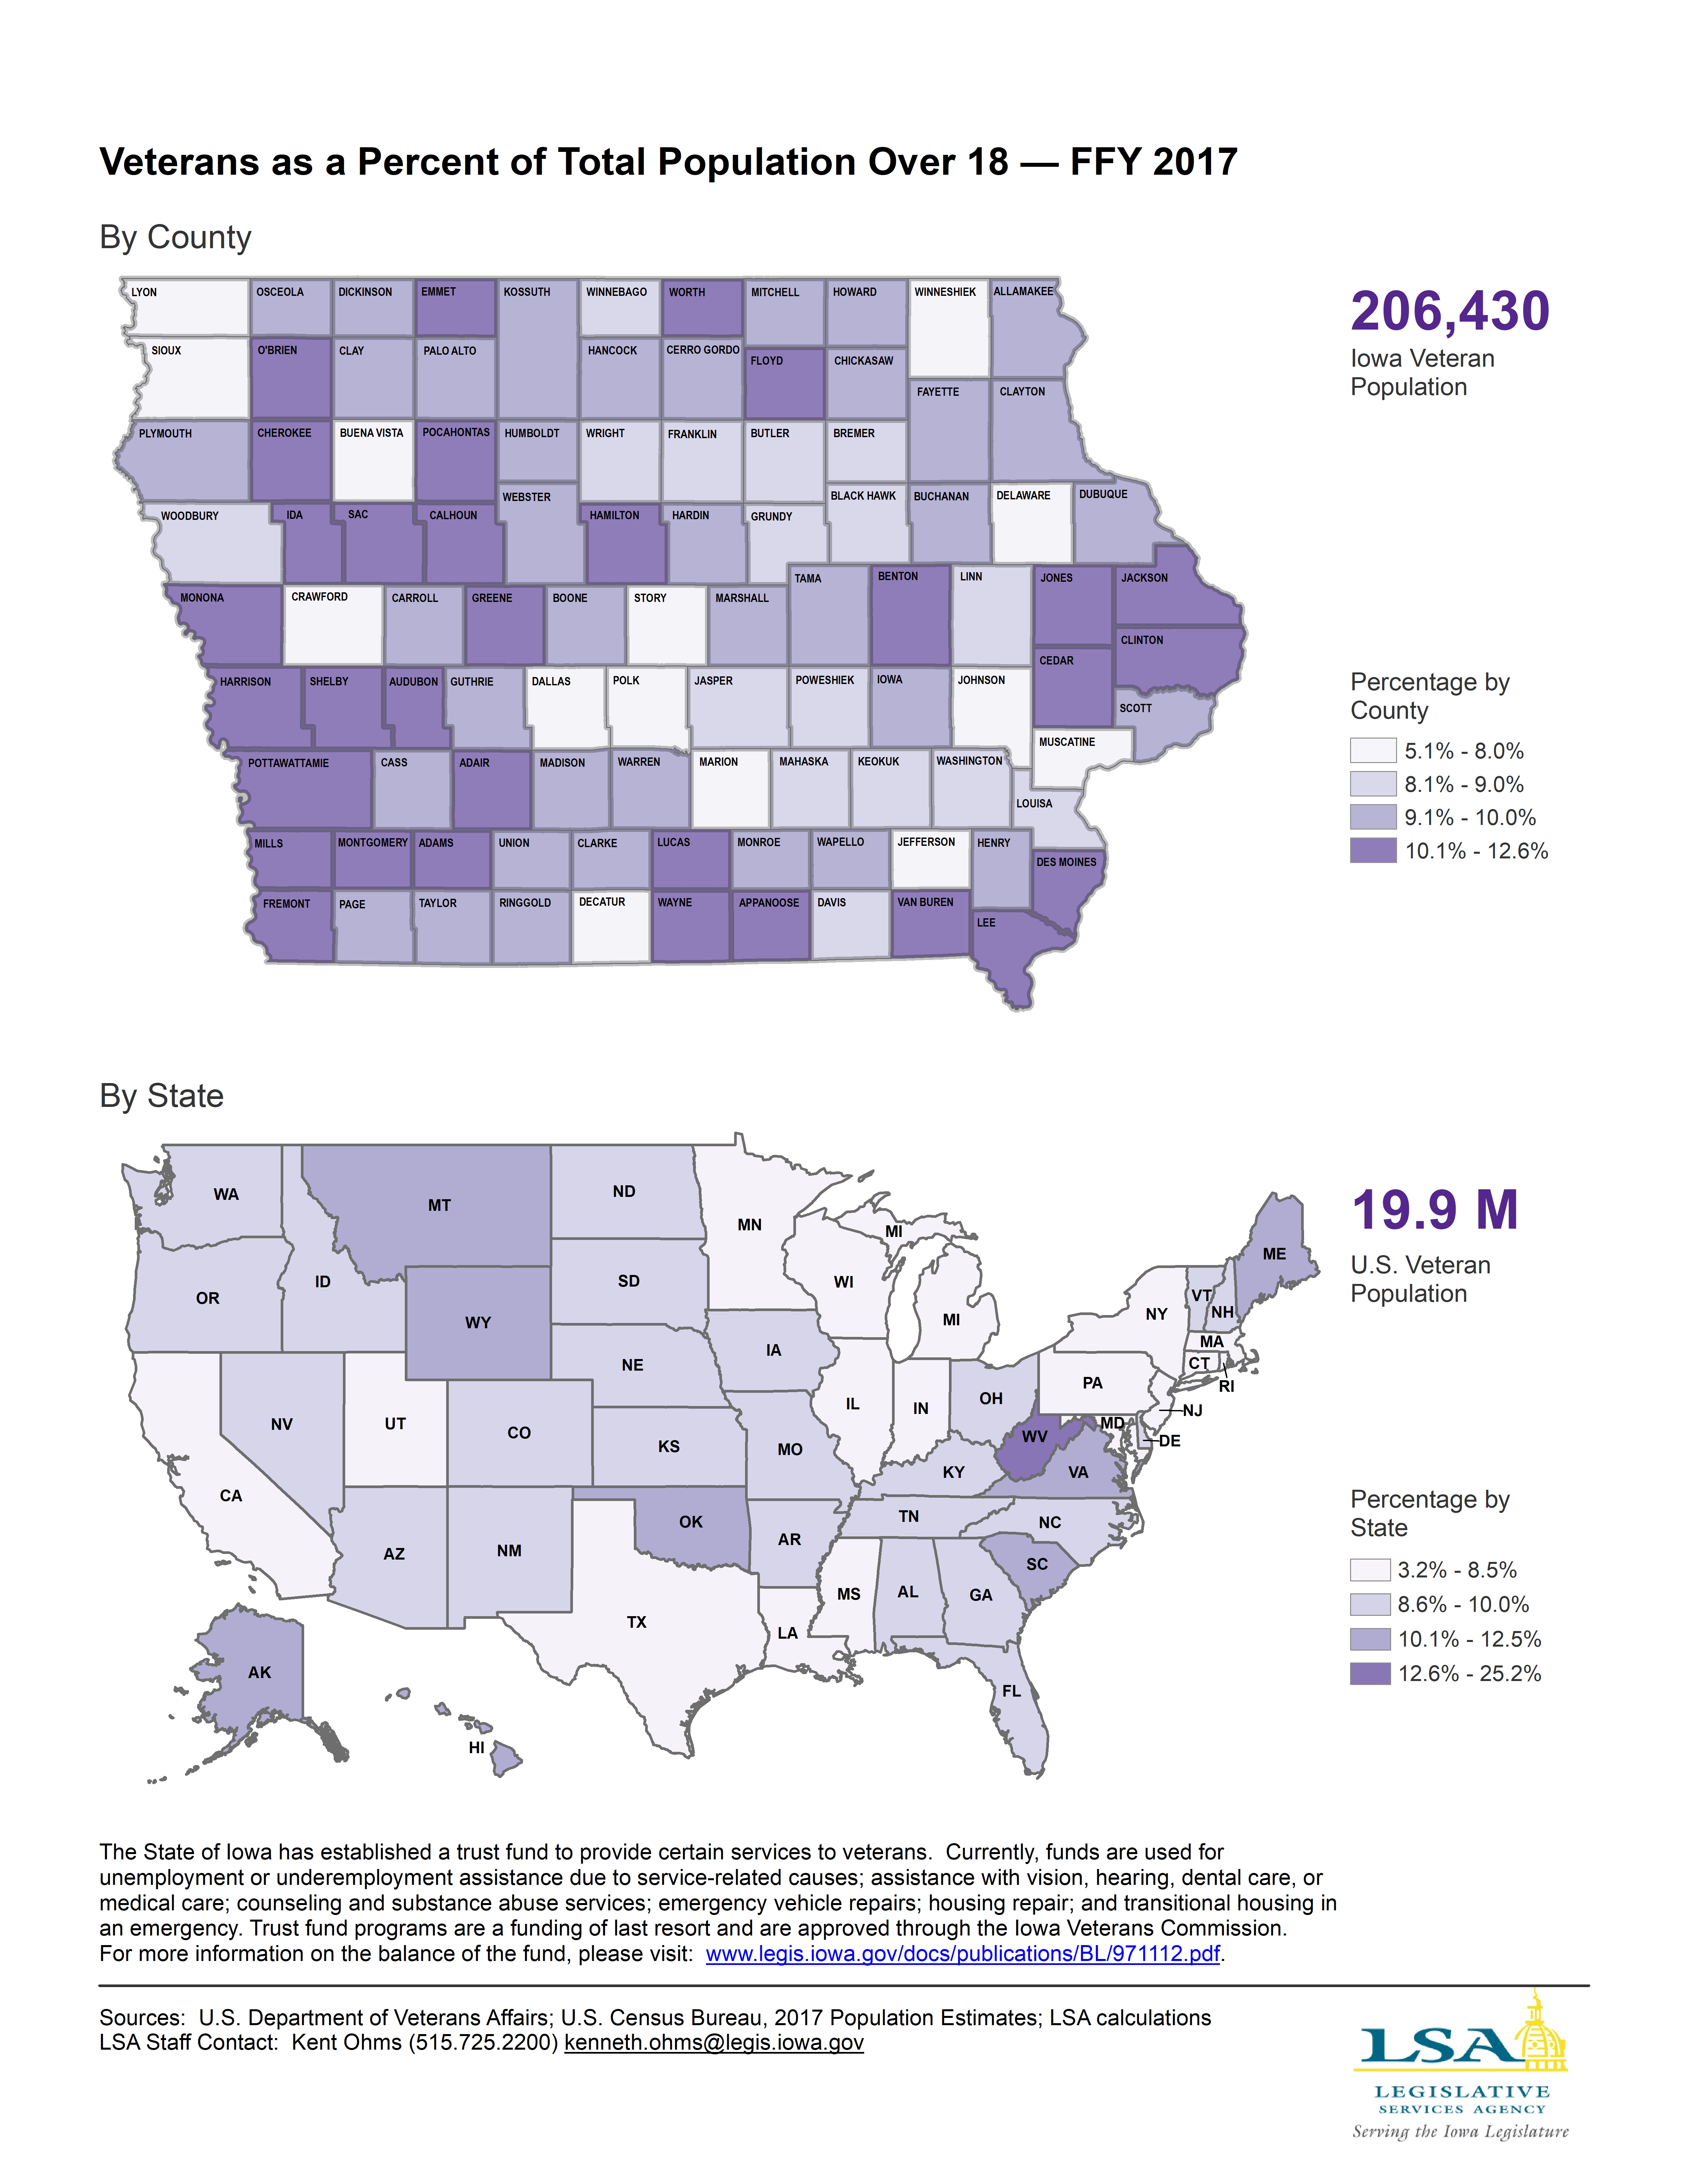
Veteran Population
|
|
|
|
|
| 11/05/2018 |
Iowa Insights |
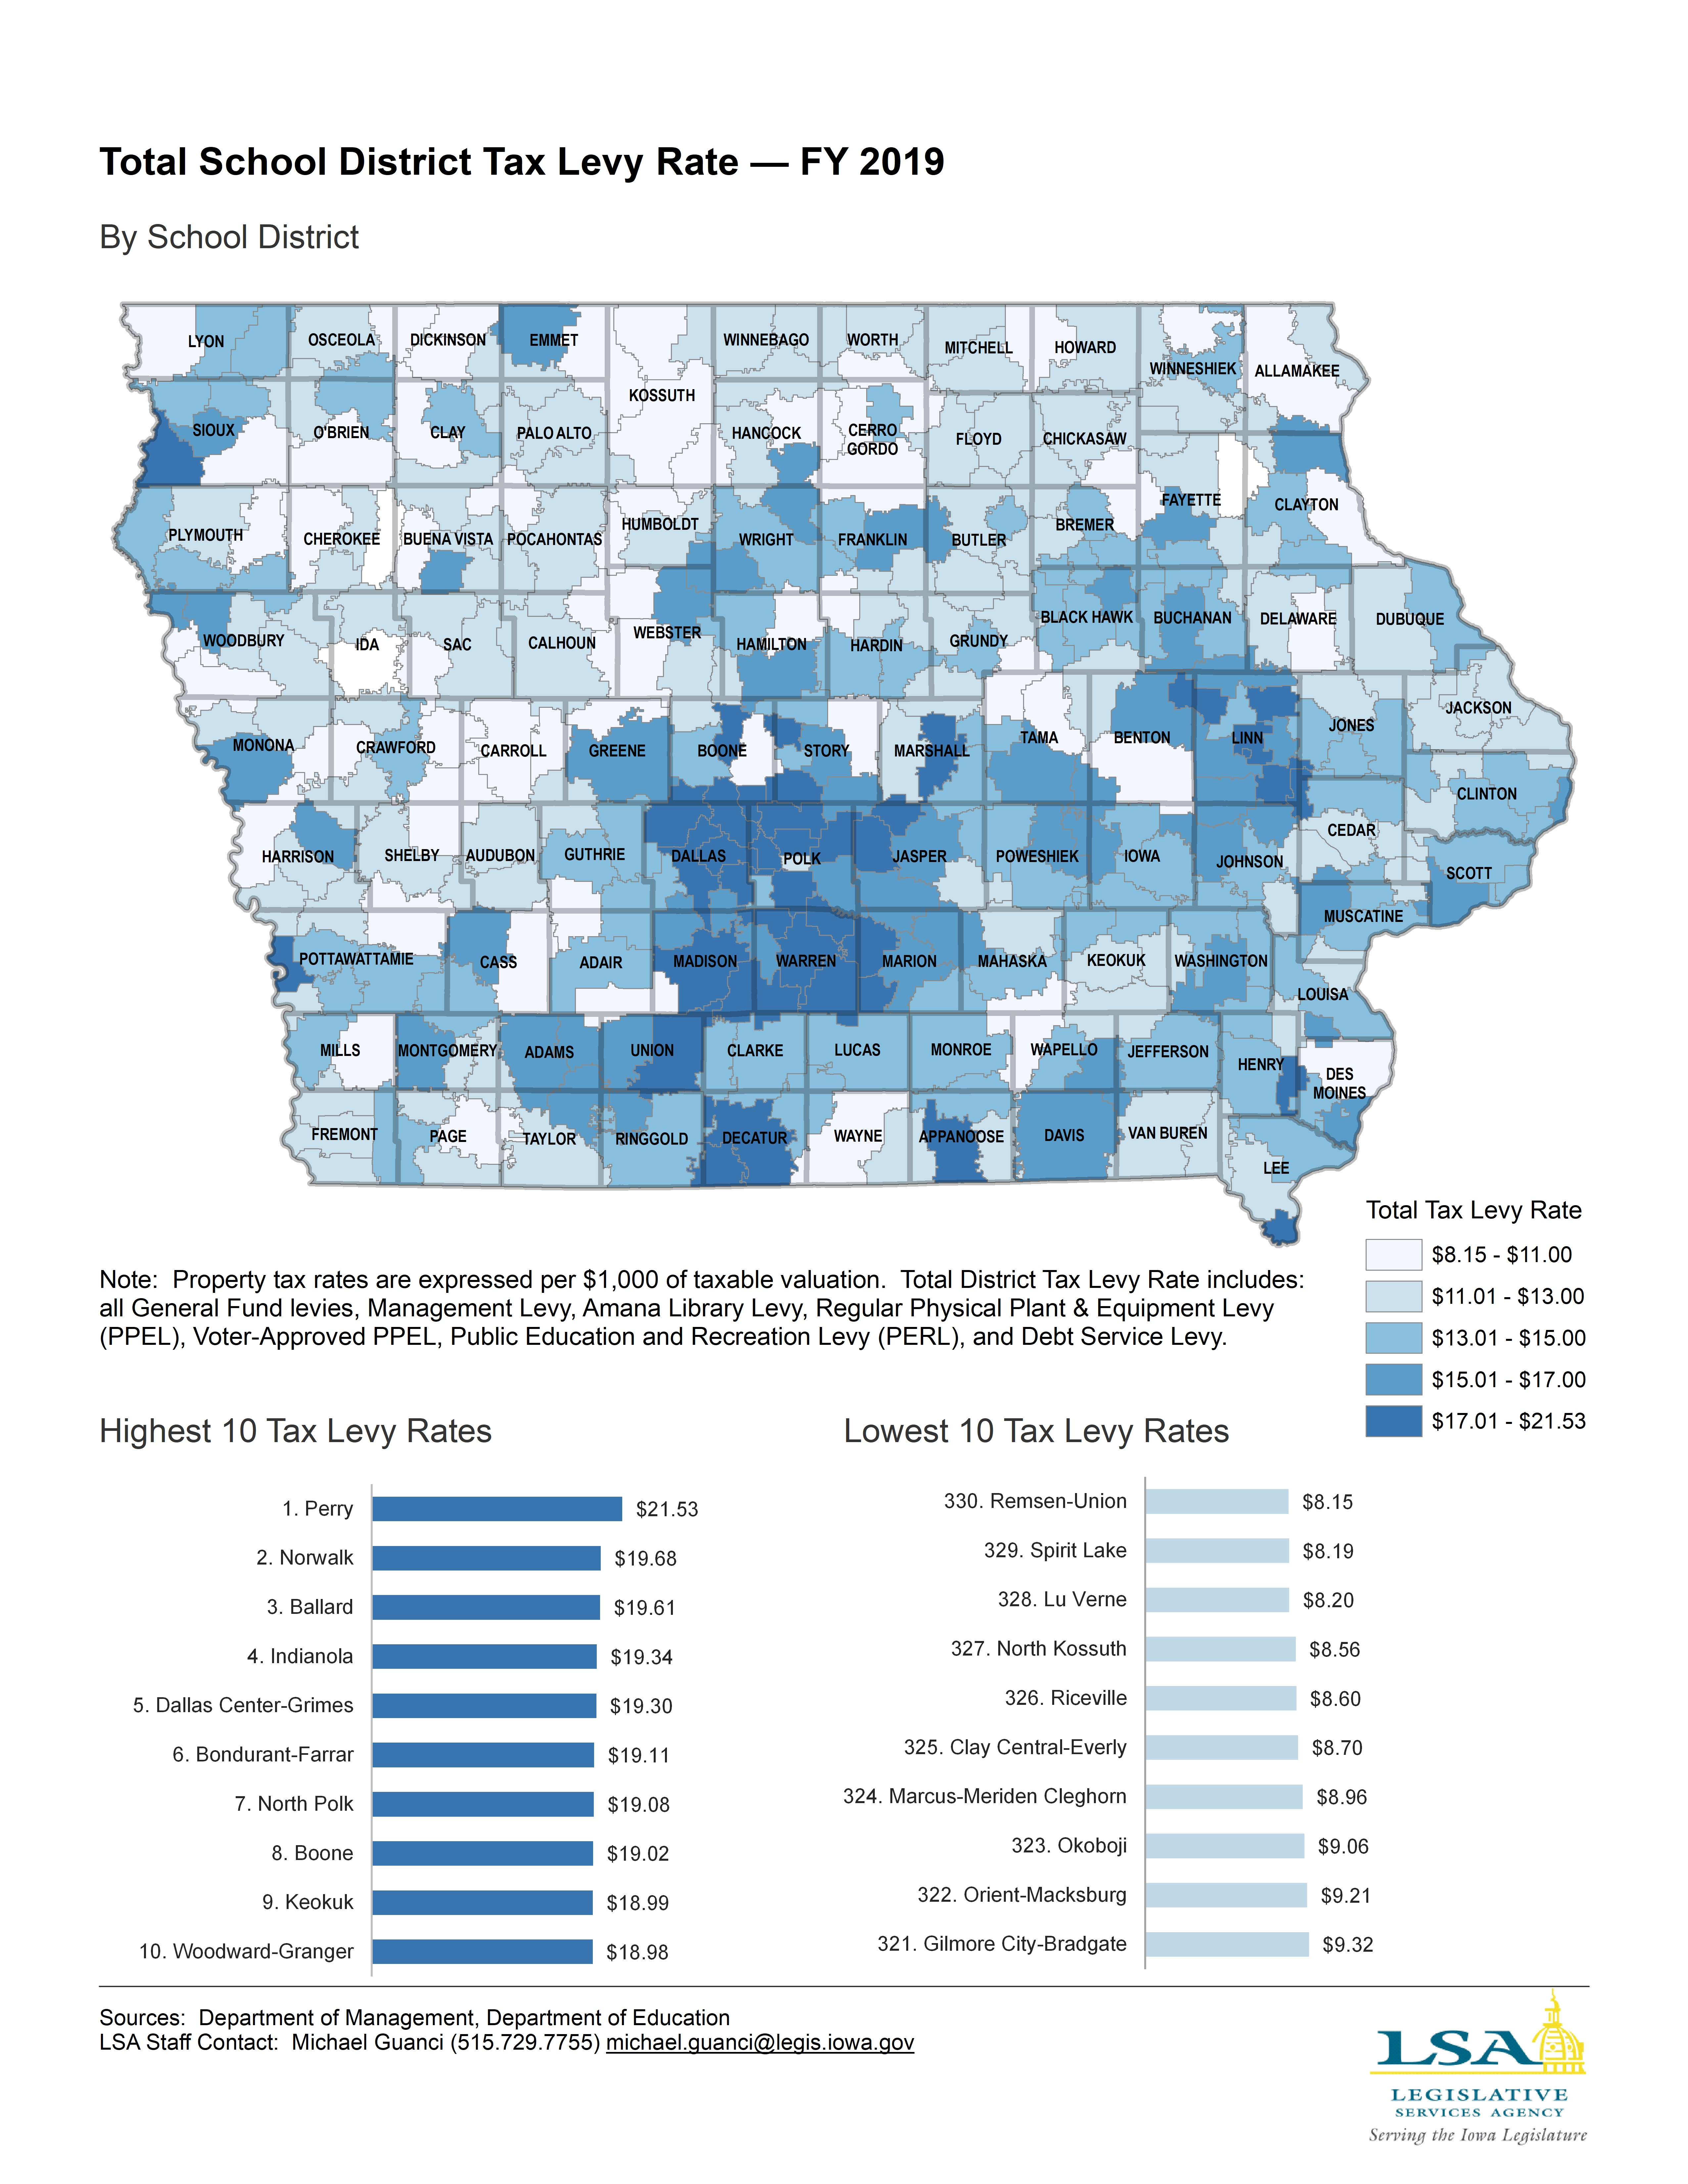
Map — School District Tax Levy Rates
|
|
|
|
|
| 10/22/2018 |
Iowa Insights |
Estimated Average Classroom Teacher Salary — 2017-2018

|
|
|
|
|
| 10/15/2018 |
Iowa Insights |
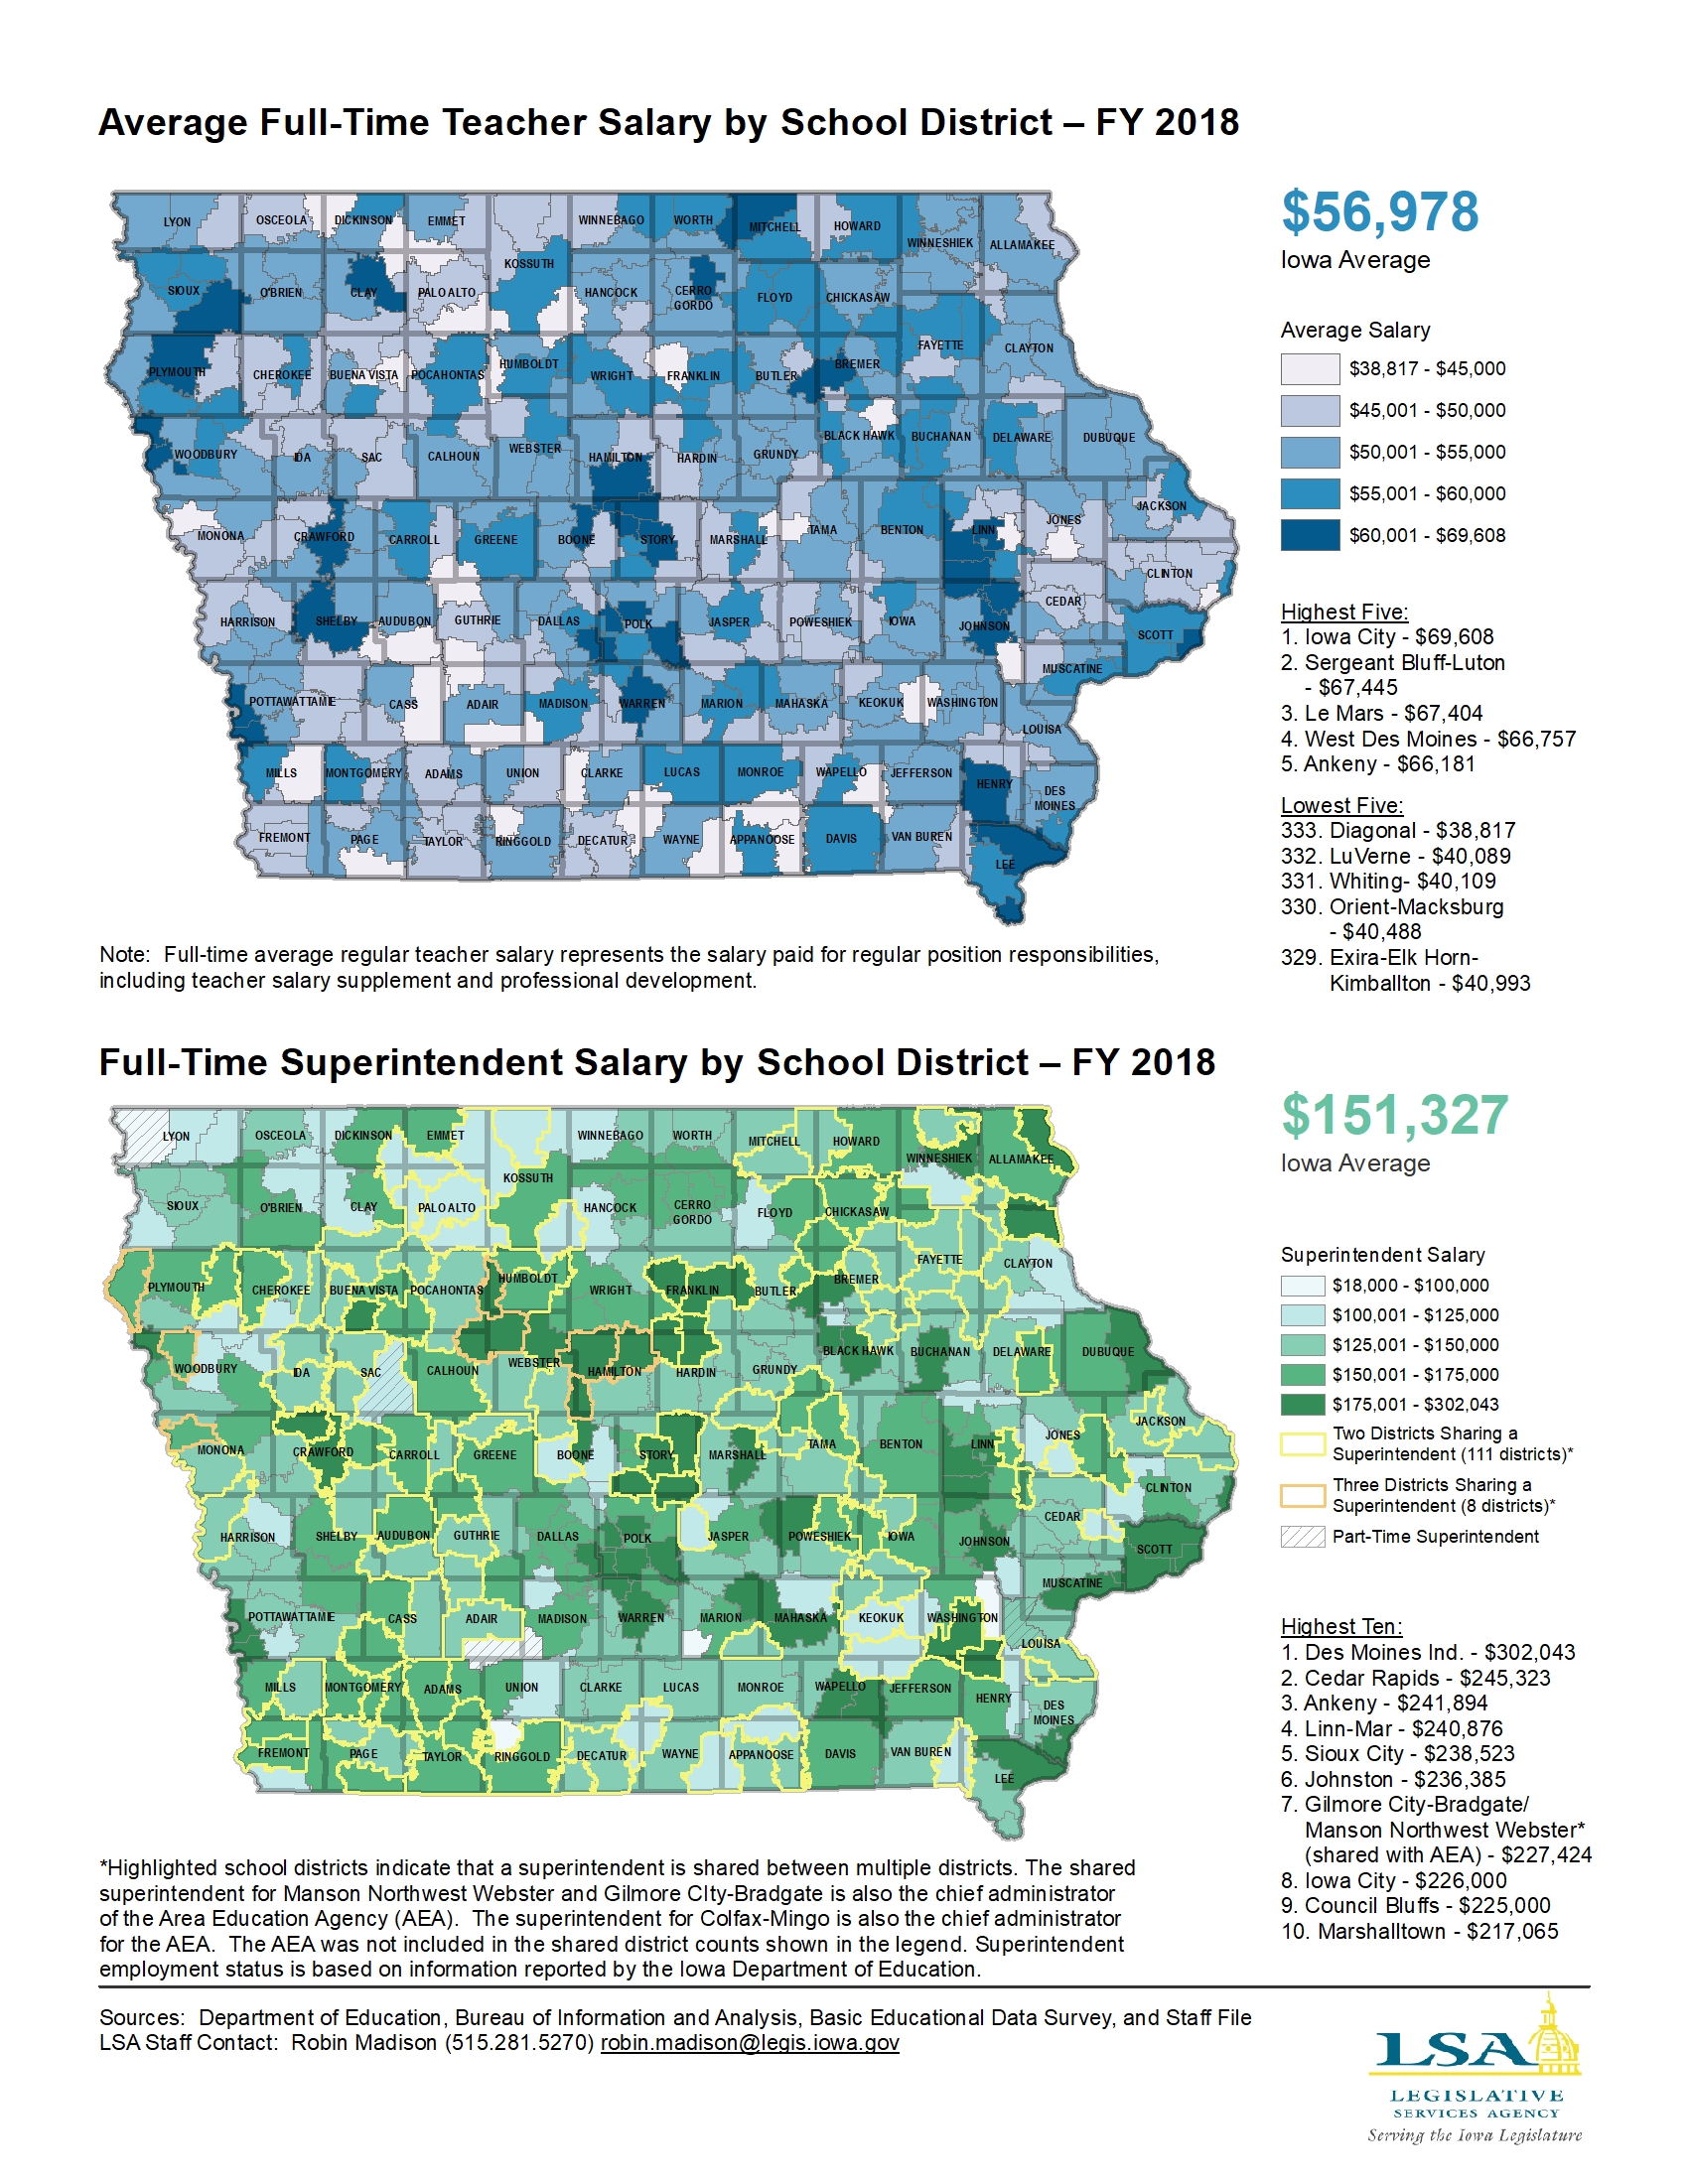
Teacher and Superintendent Salary by School District — FY 2018
|
|
|
|
|
| 10/08/2018 |
Iowa Insights |
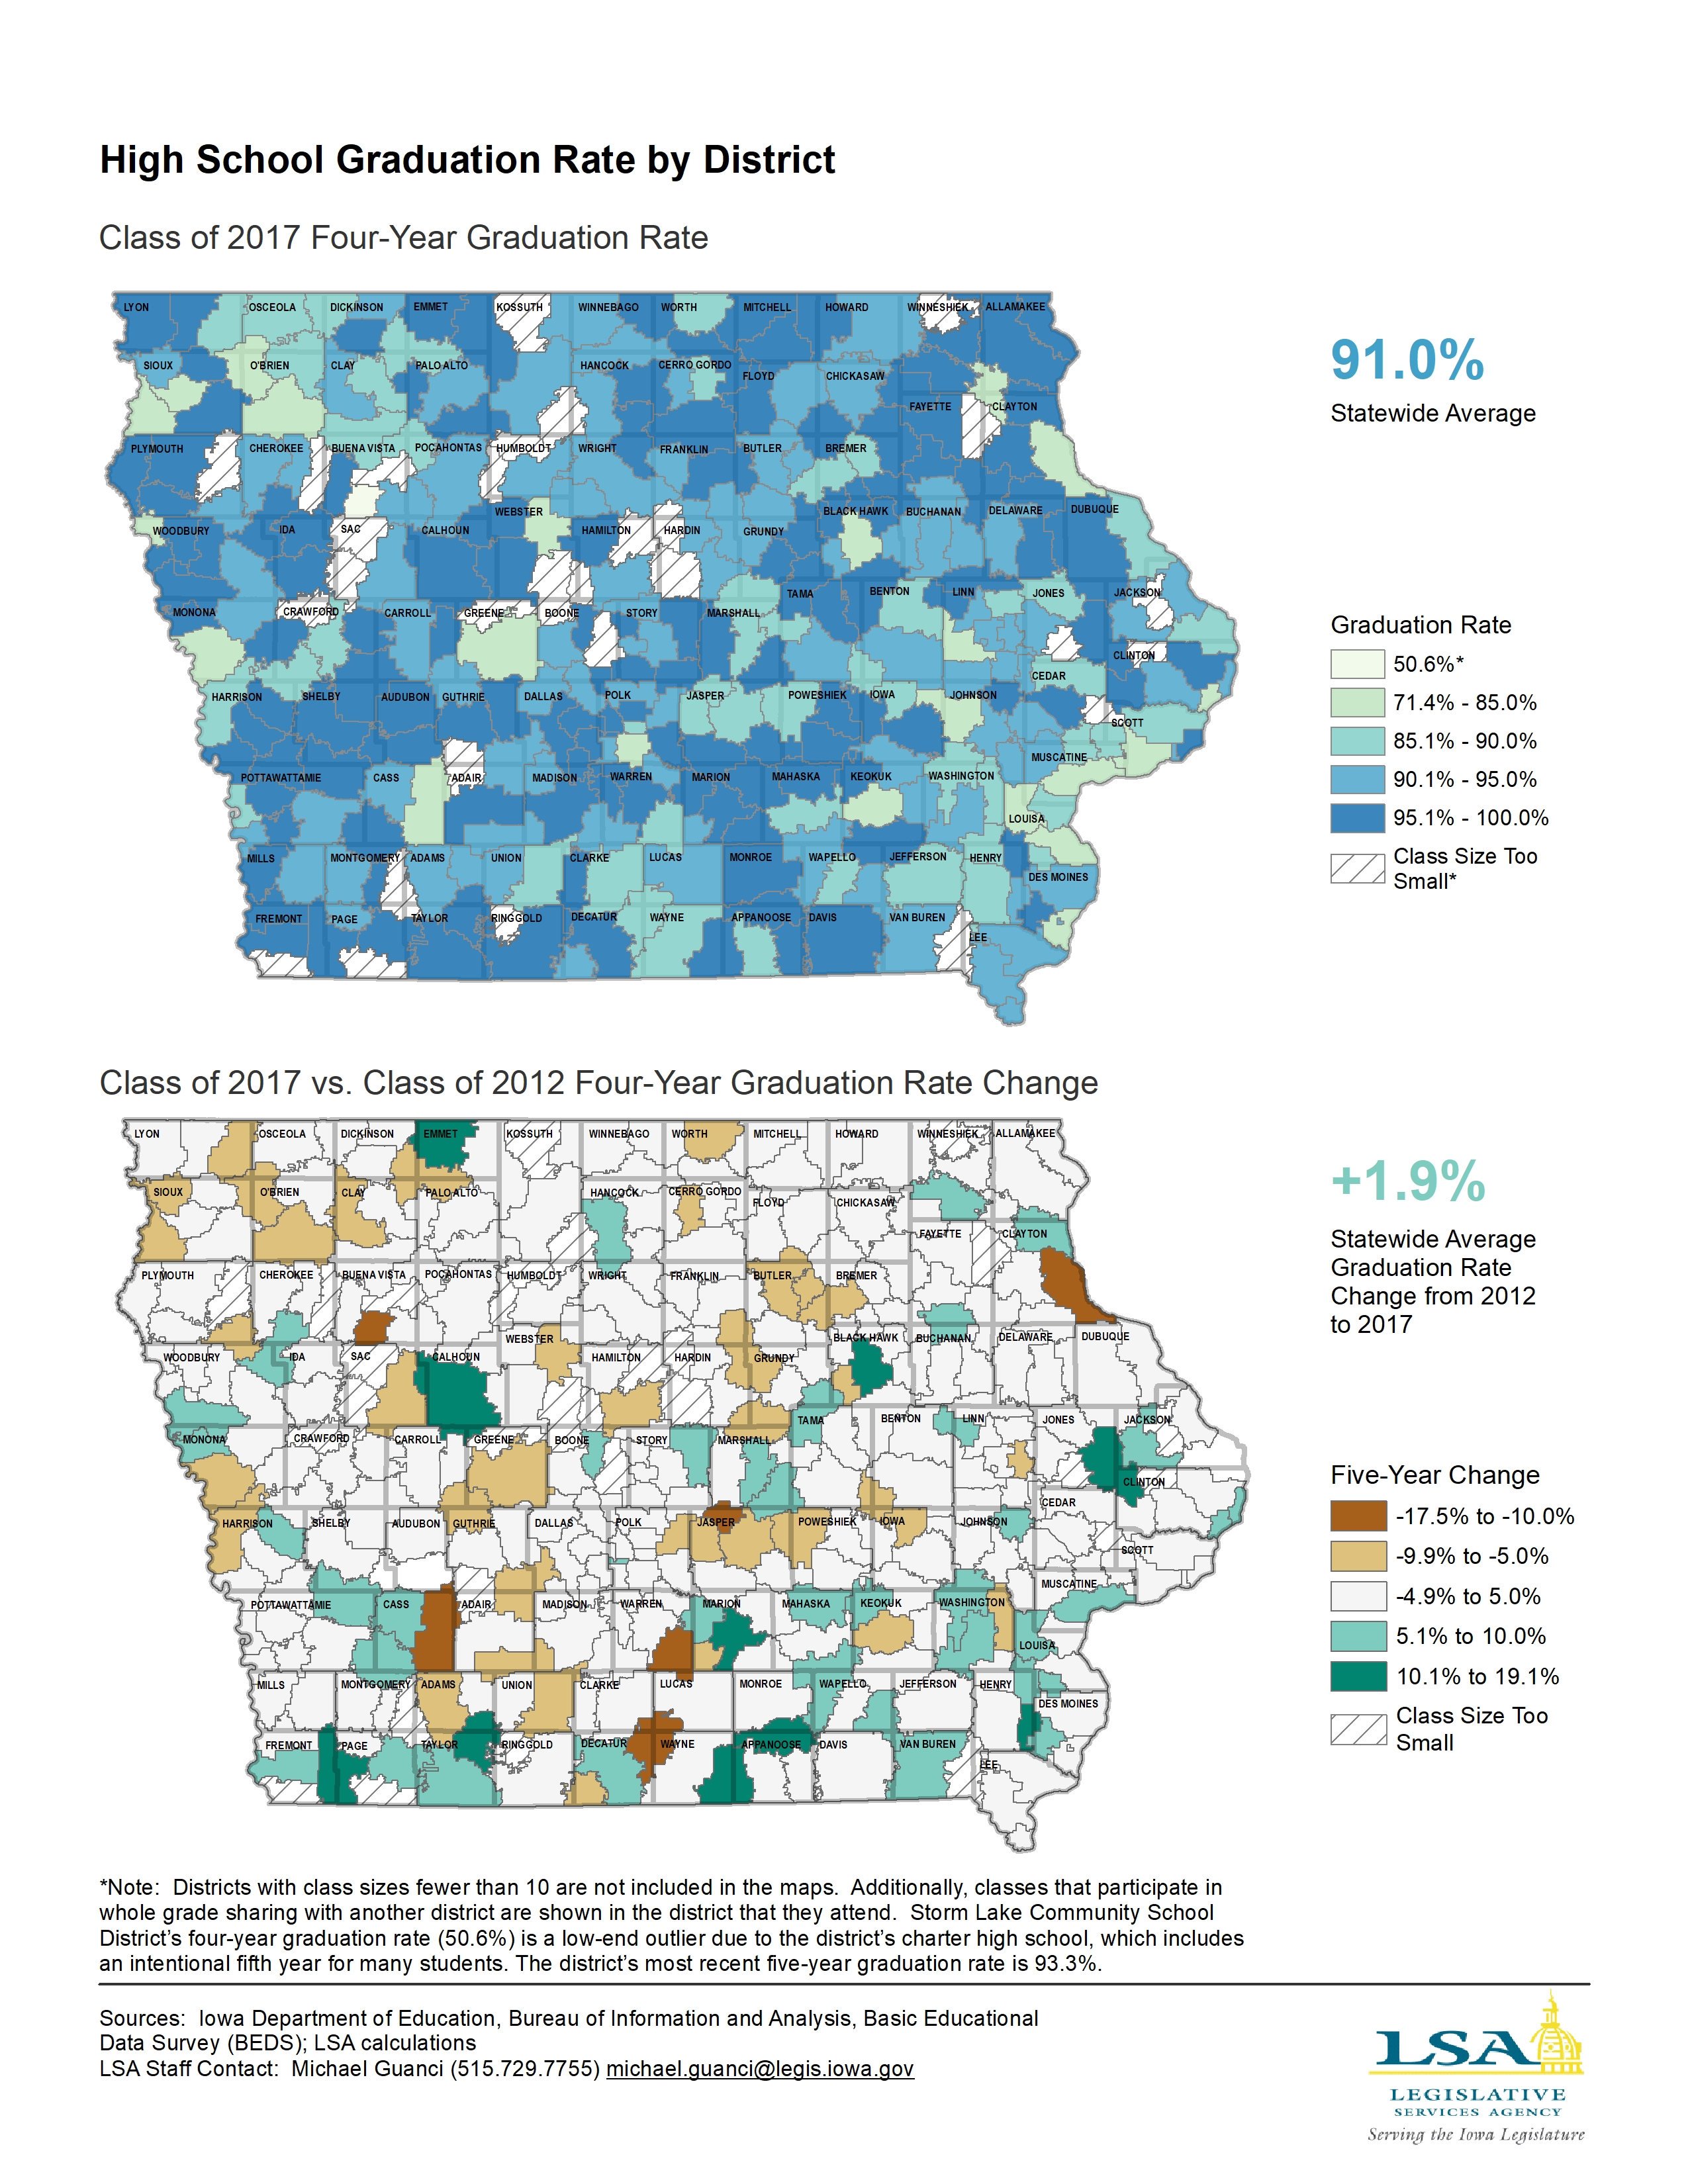
High School Graduation Rate by District — Class of 2017
|
|
|
|
|
| 10/01/2018 |
Iowa Insights |
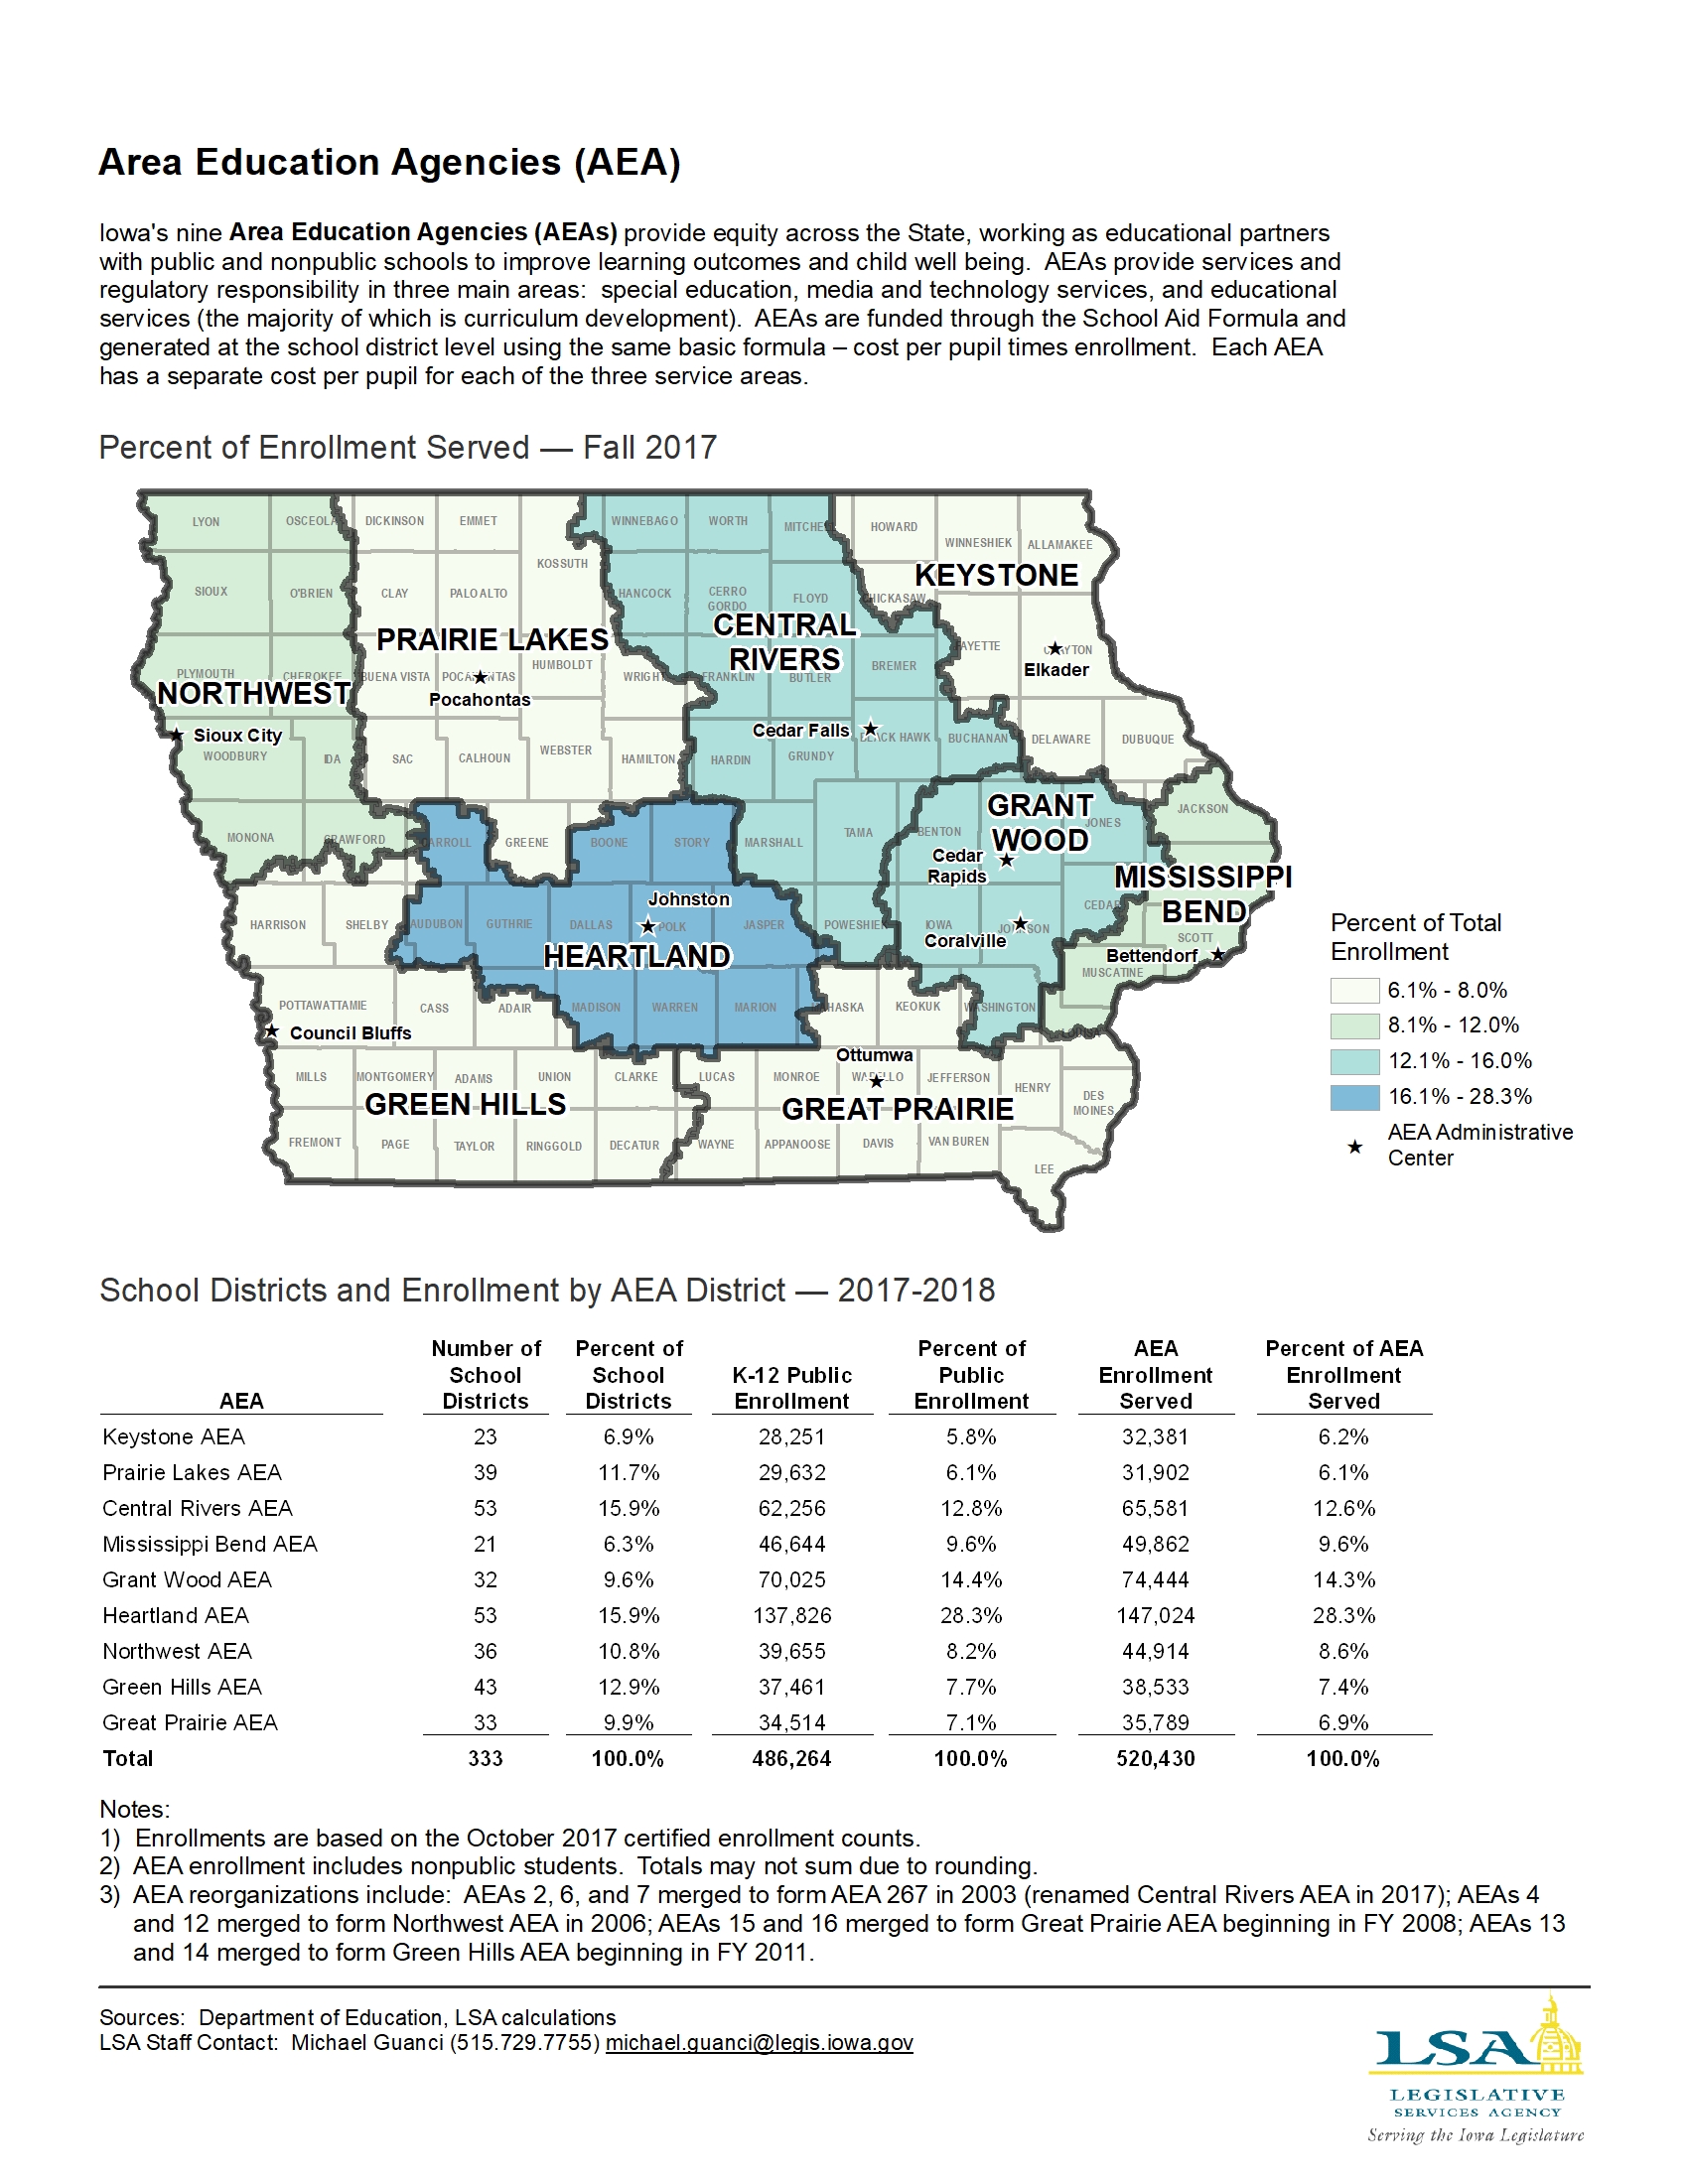
Area Education Agencies (AEA) Percent of Enrollment Served — Fall 2017
|
|
|
|
|
| 09/24/2018 |
Iowa Insights |
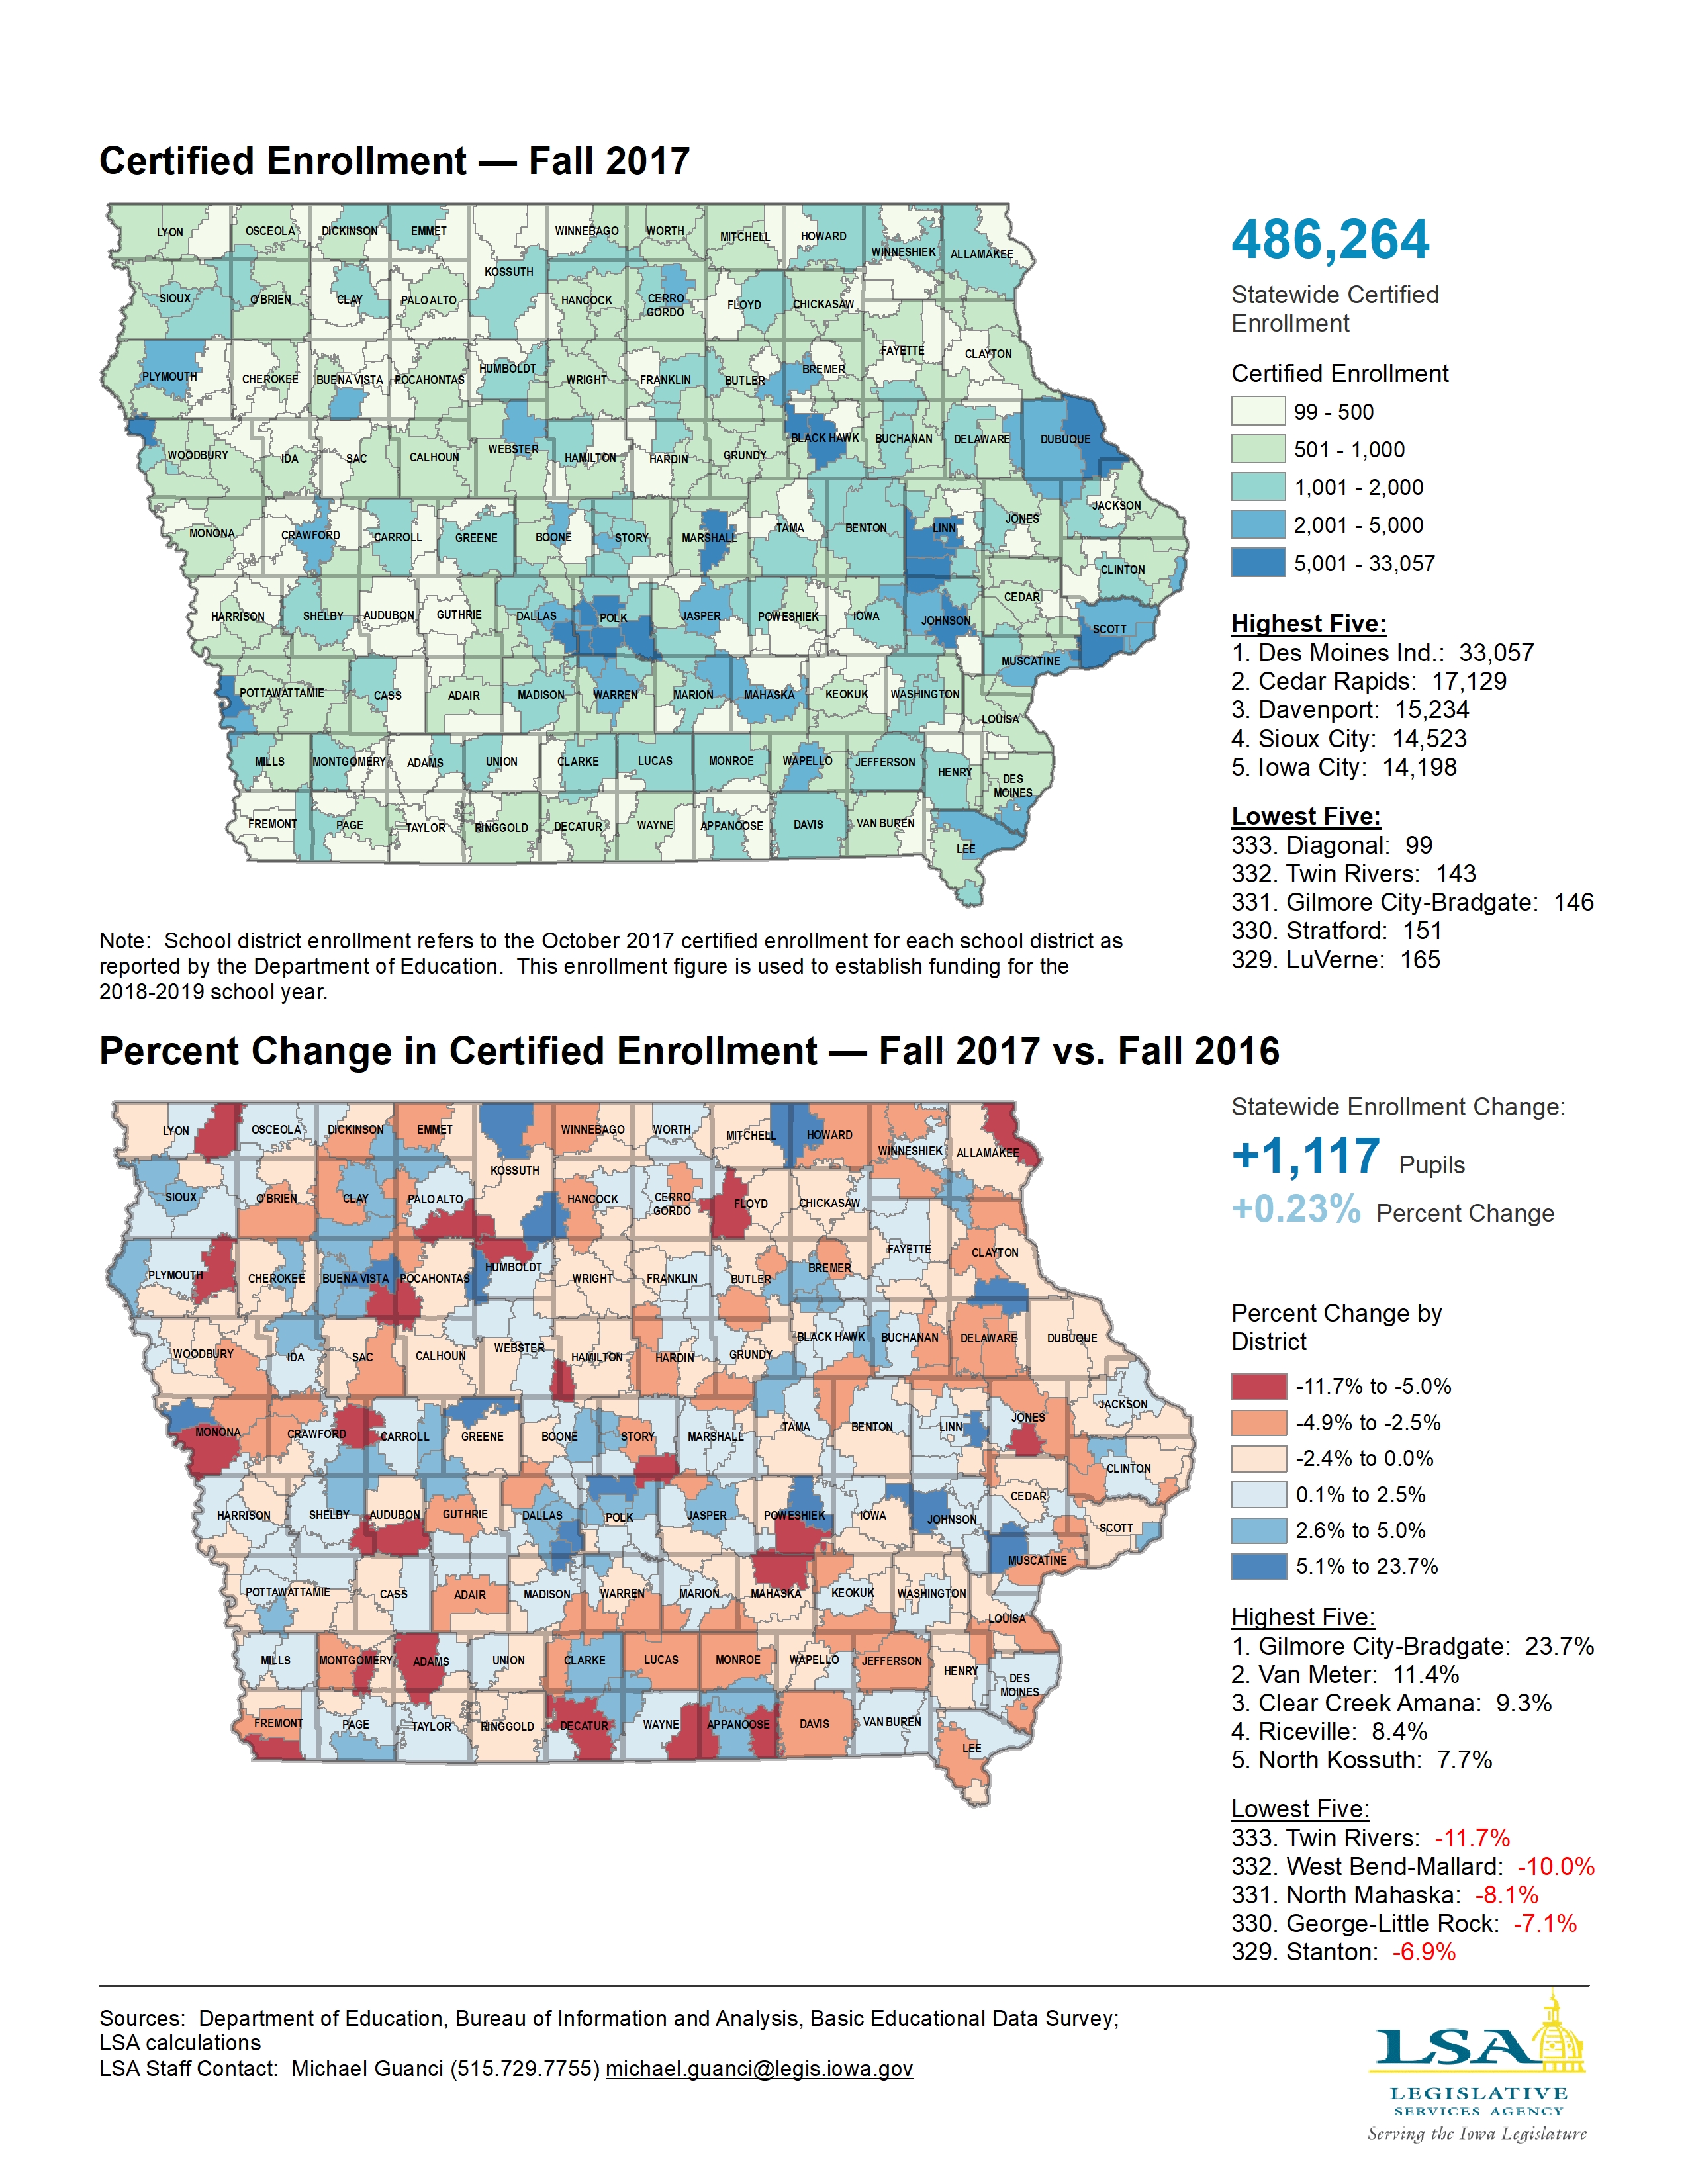
Certified Enrollment by School District — Fall 2017
|
|
|
|
|
| 09/10/2018 |
Iowa Insights |
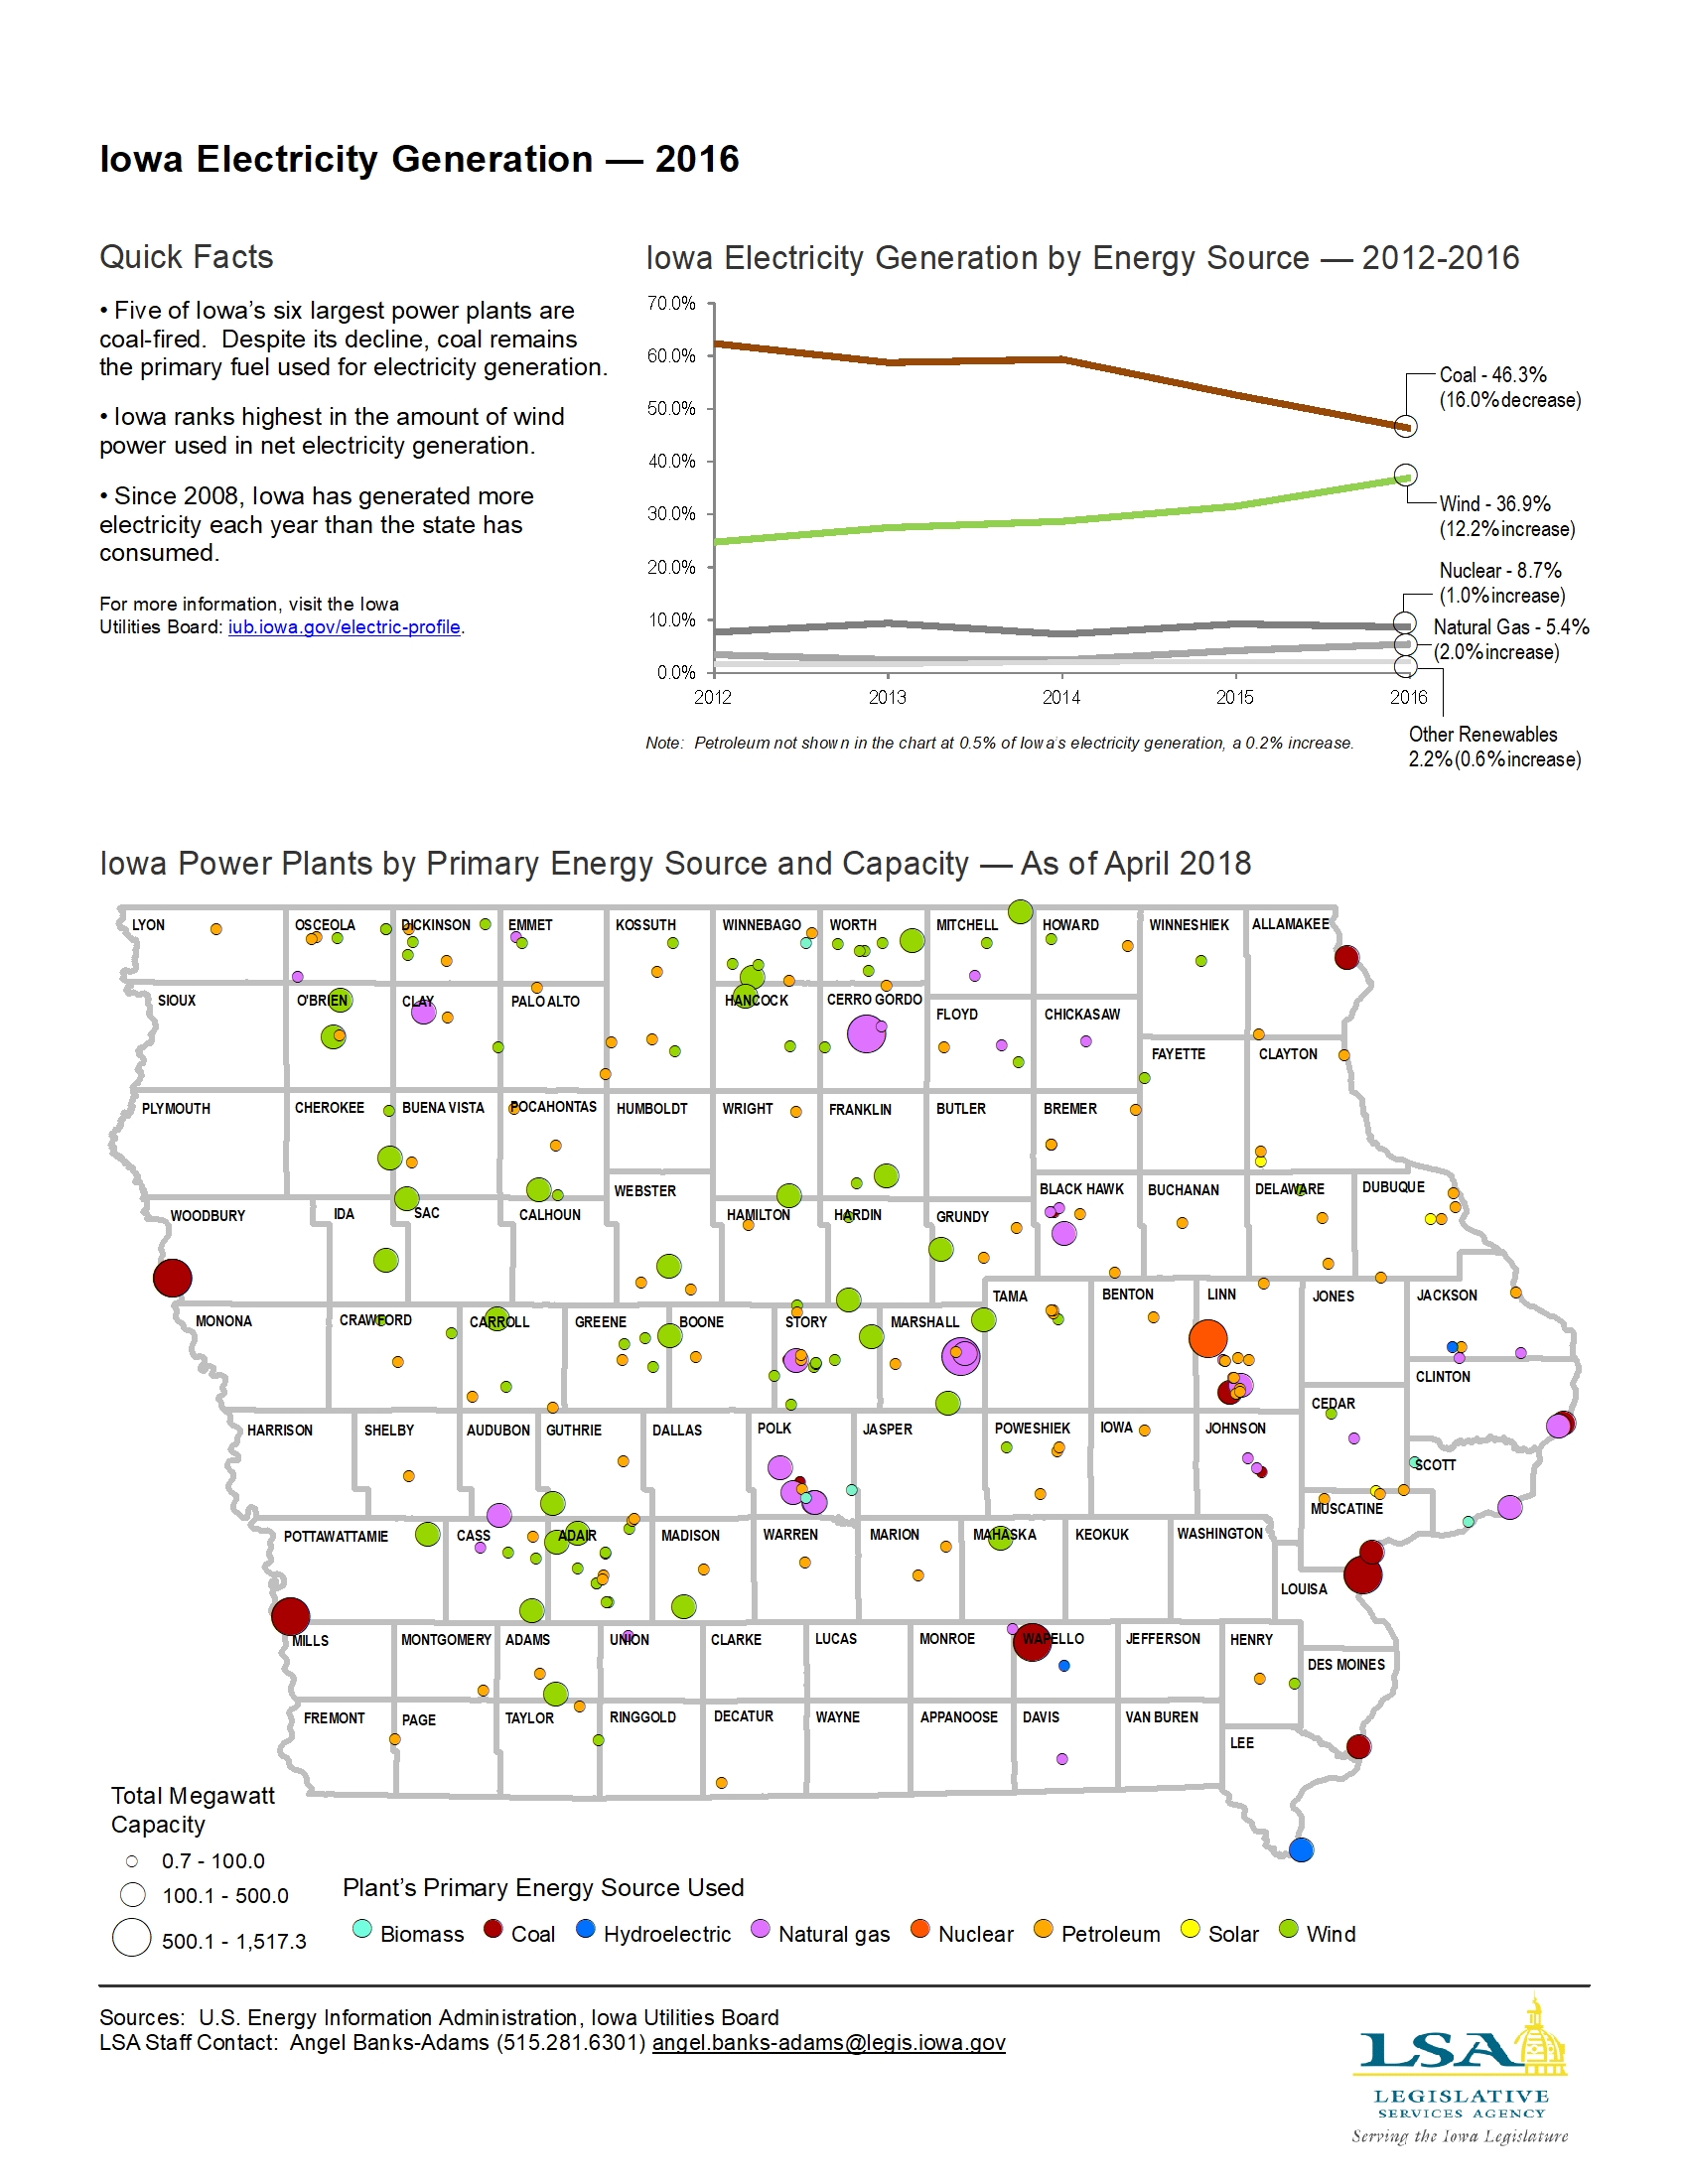
Iowa Electricity Generation — 2016
|
|
|
|
|
| 09/03/2018 |
Iowa Insights |
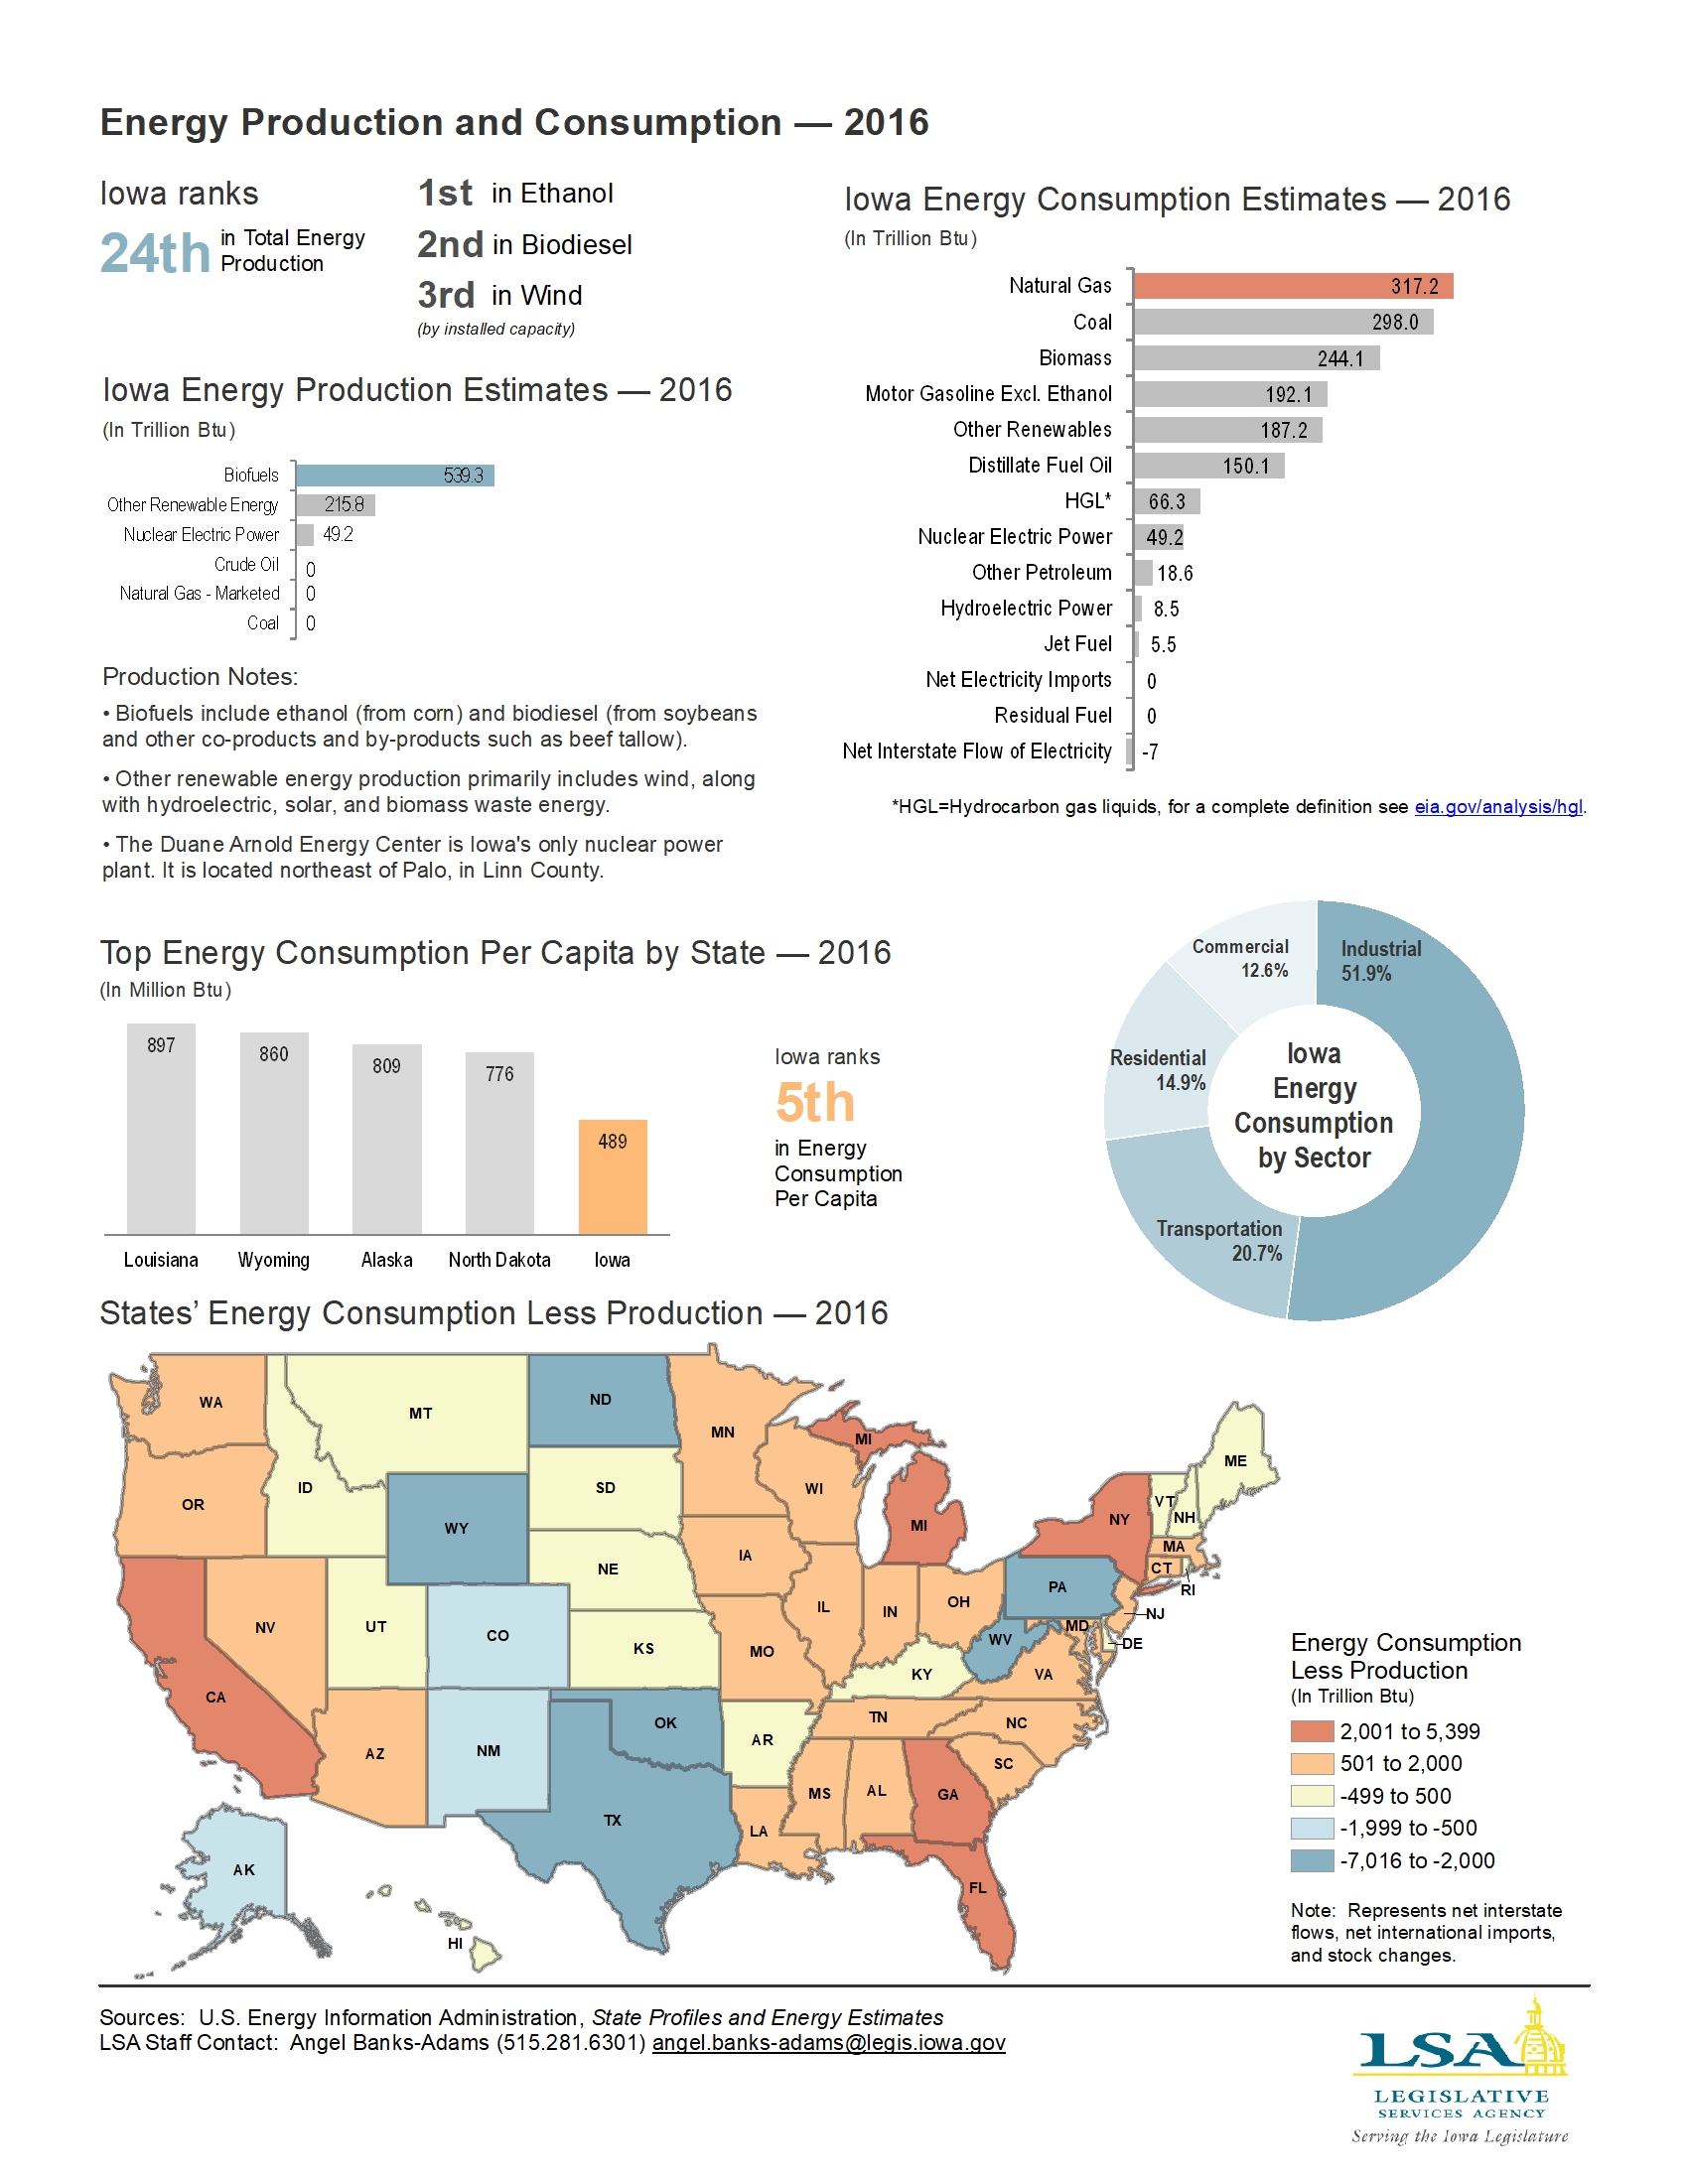
Energy Production and Consumption — 2016
|
|
|
|
|
| 08/27/2018 |
Iowa Insights |
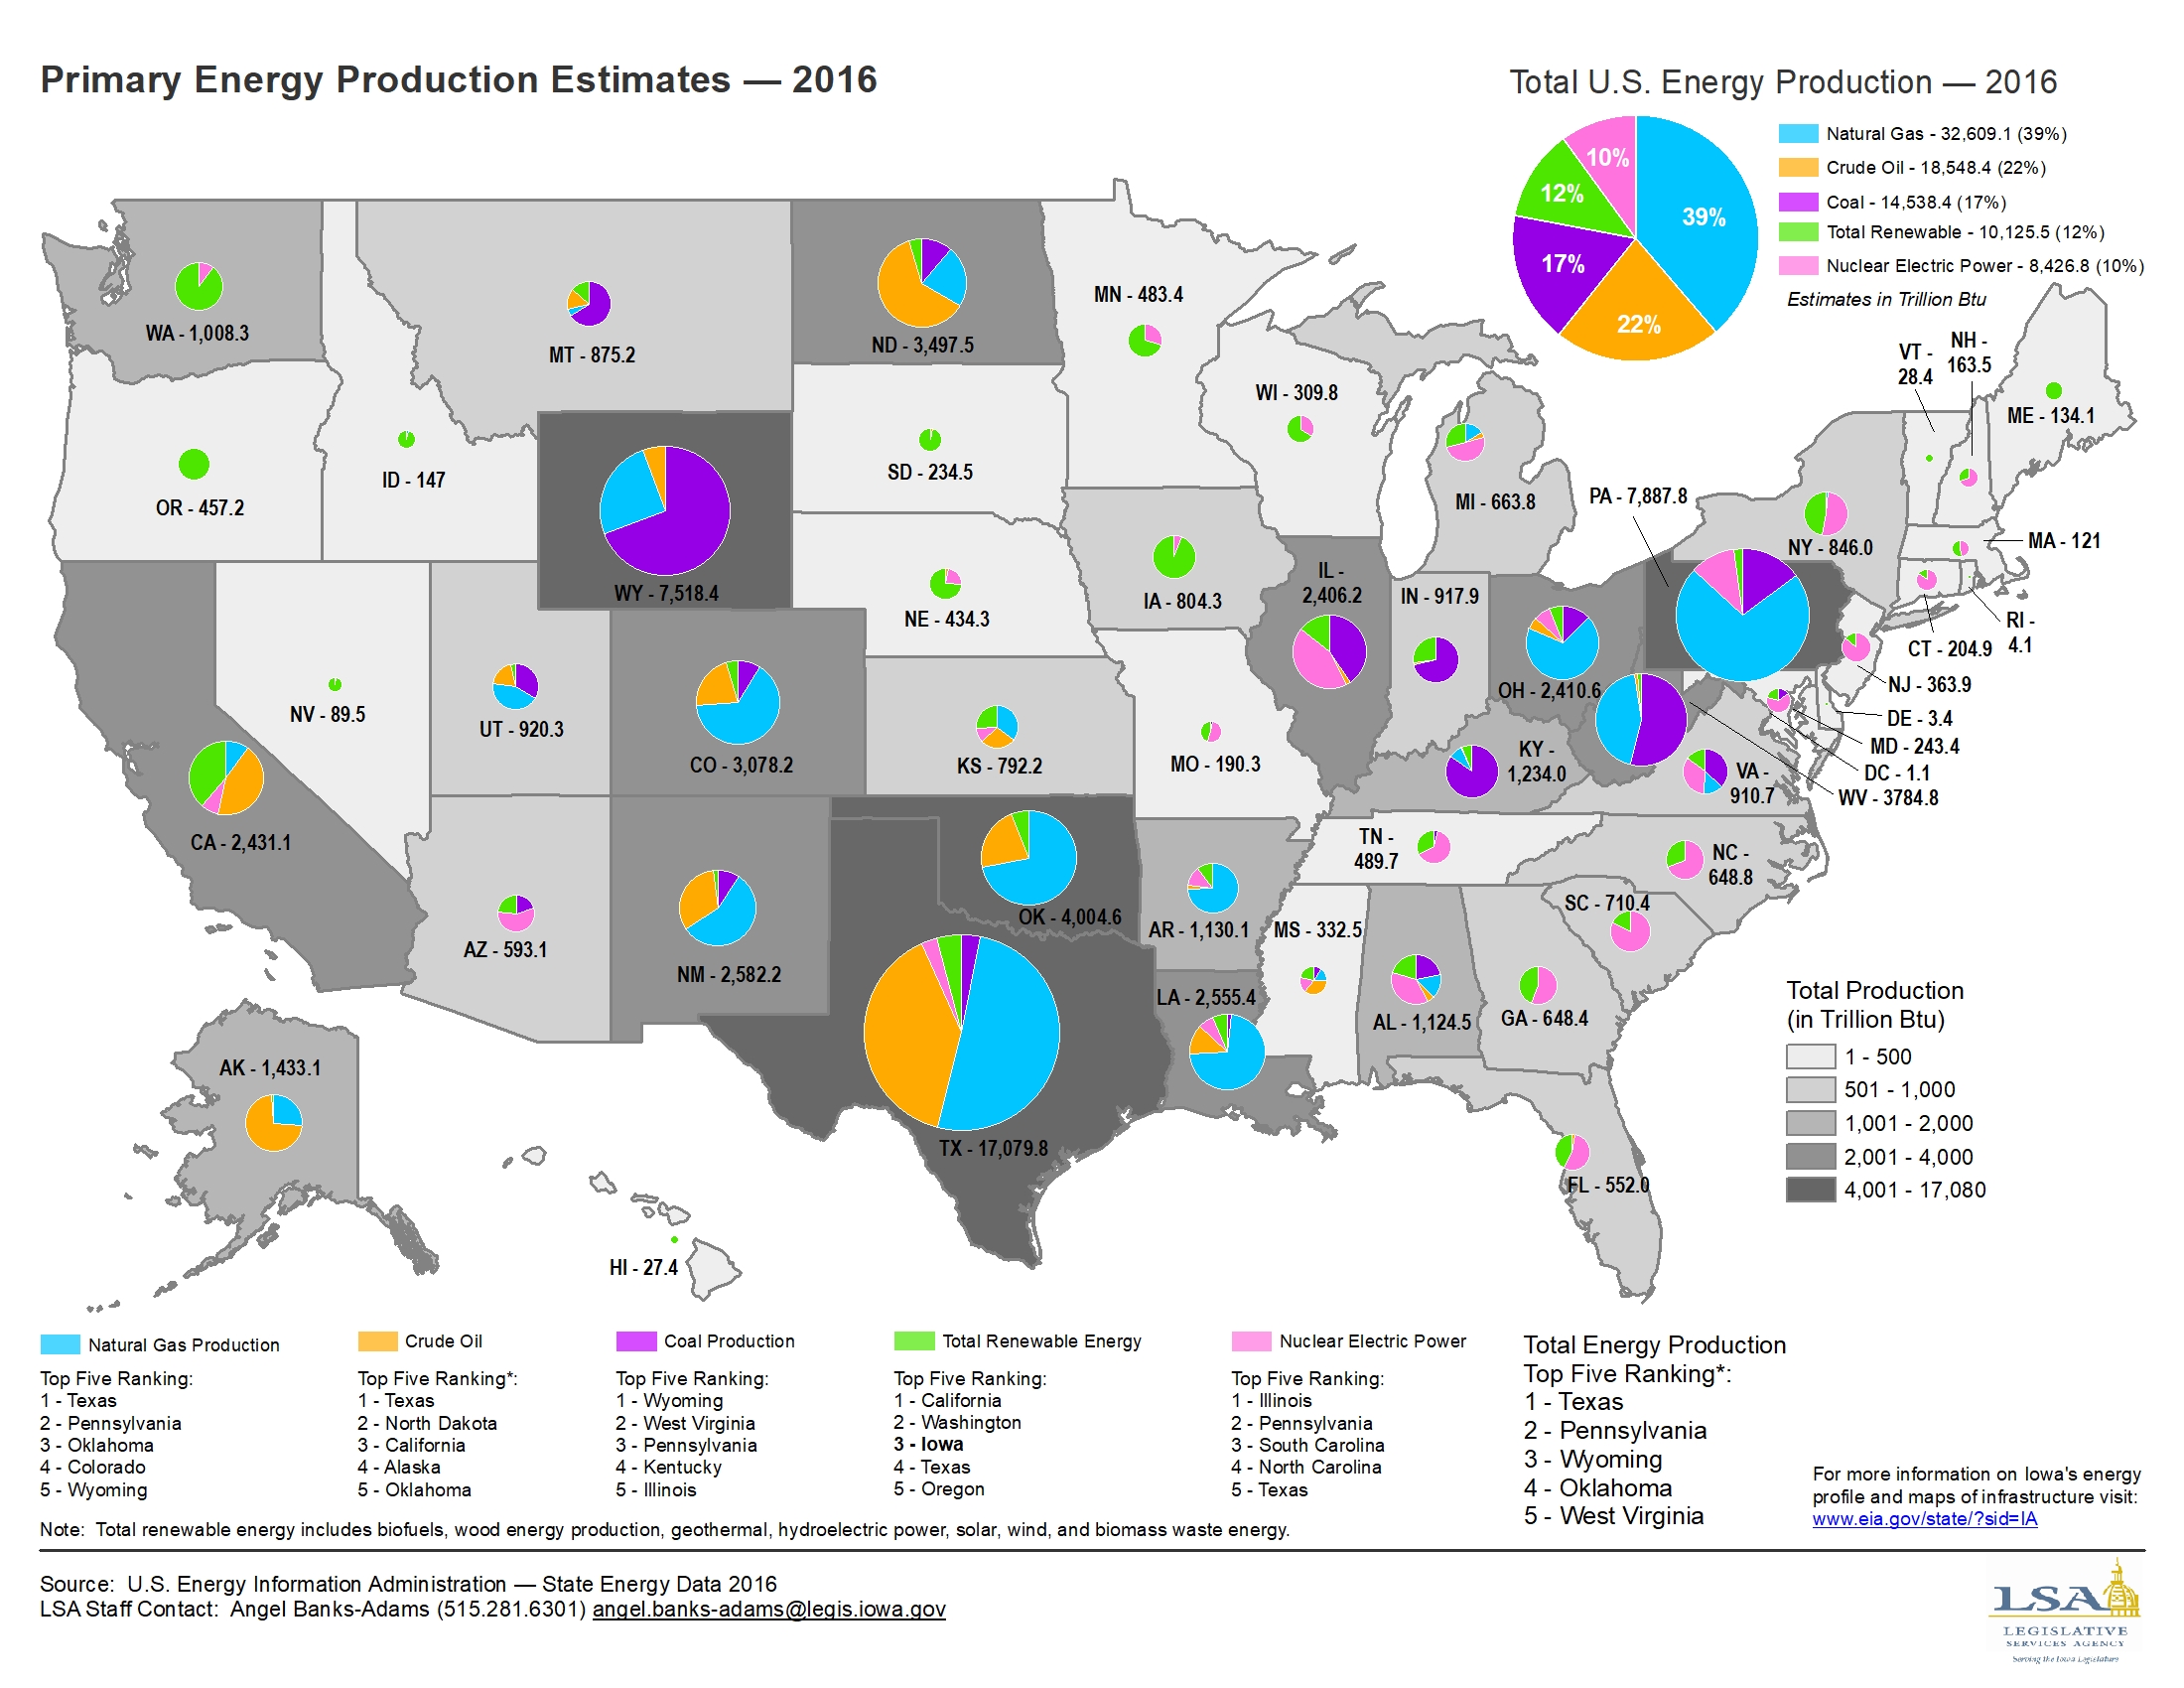
Primary Energy Production Estimates — 2016
|
|
|
|
|
| 08/20/2018 |
Iowa Insights |
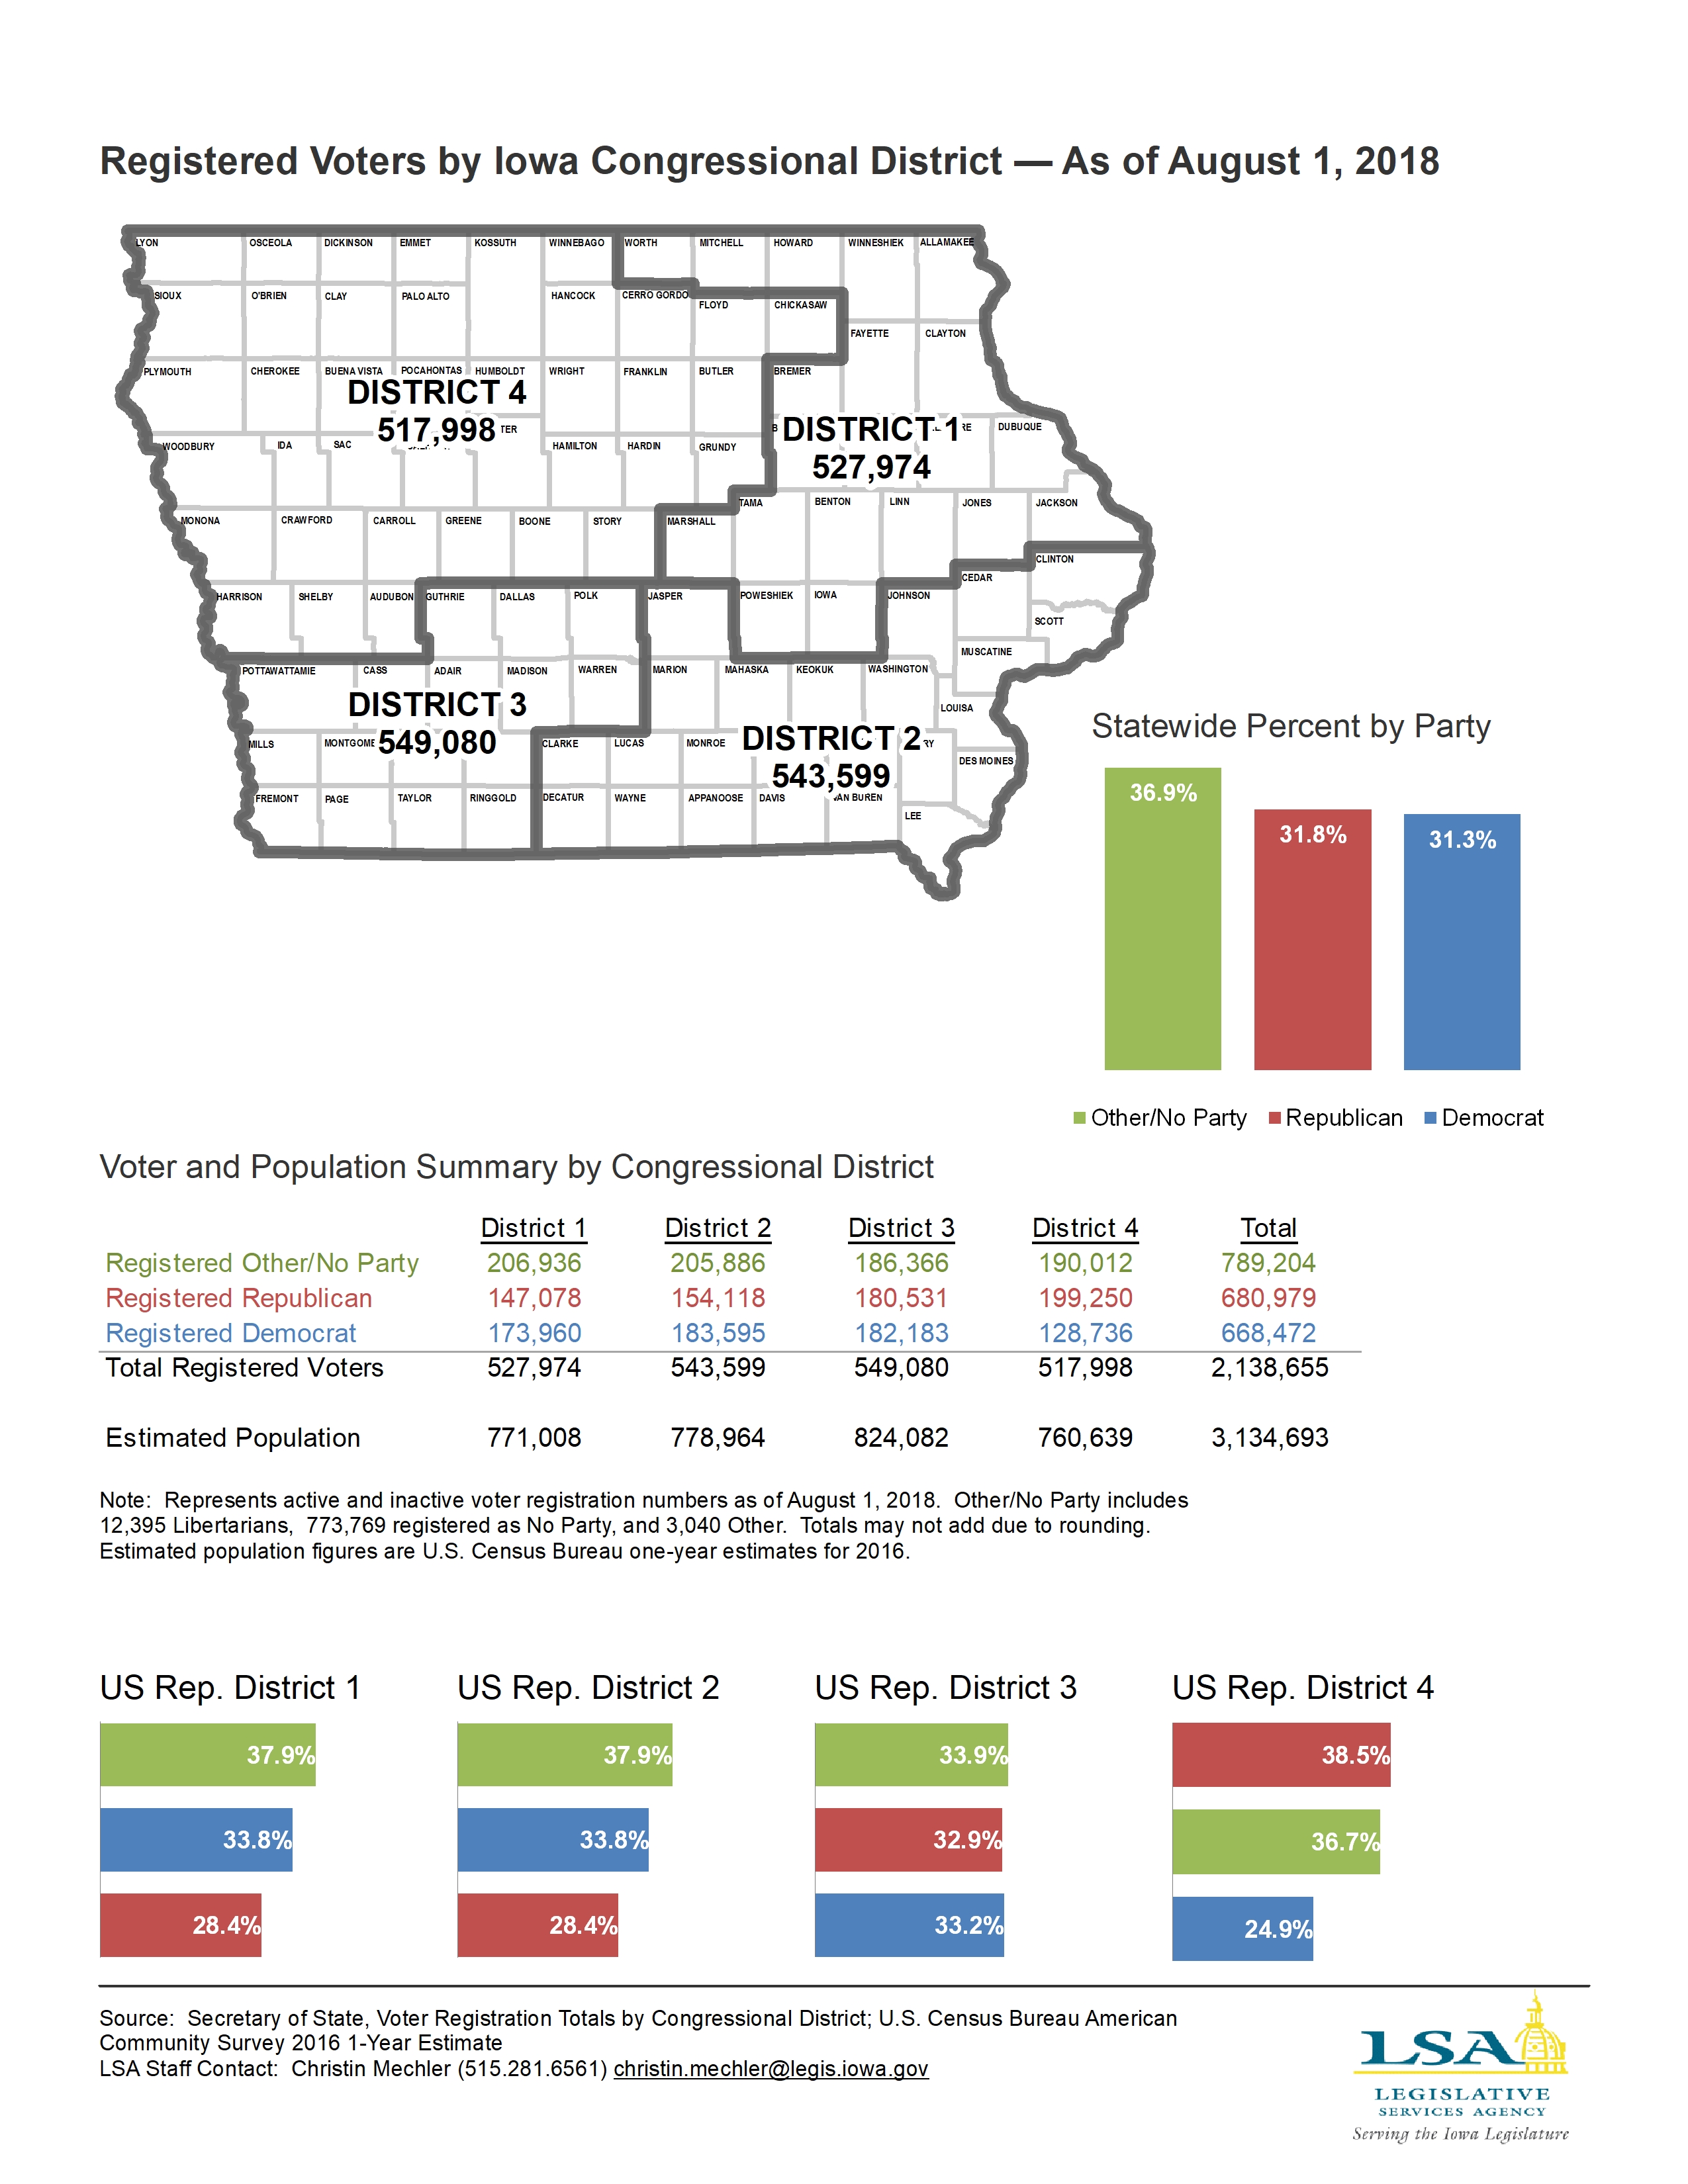
Registered Voters by Iowa Congressional District — As of August 1, 2018
|
|
|
|
|
| 08/13/2018 |
Iowa Insights |
Registered Voters by Party — As of August 1, 2018

|
|
|
|
|
| 08/06/2018 |
Iowa Insights |
FY 2019 Estimated General Fund Appropriations

|
|
|
|
|
| 07/30/2018 |
Iowa Insights |
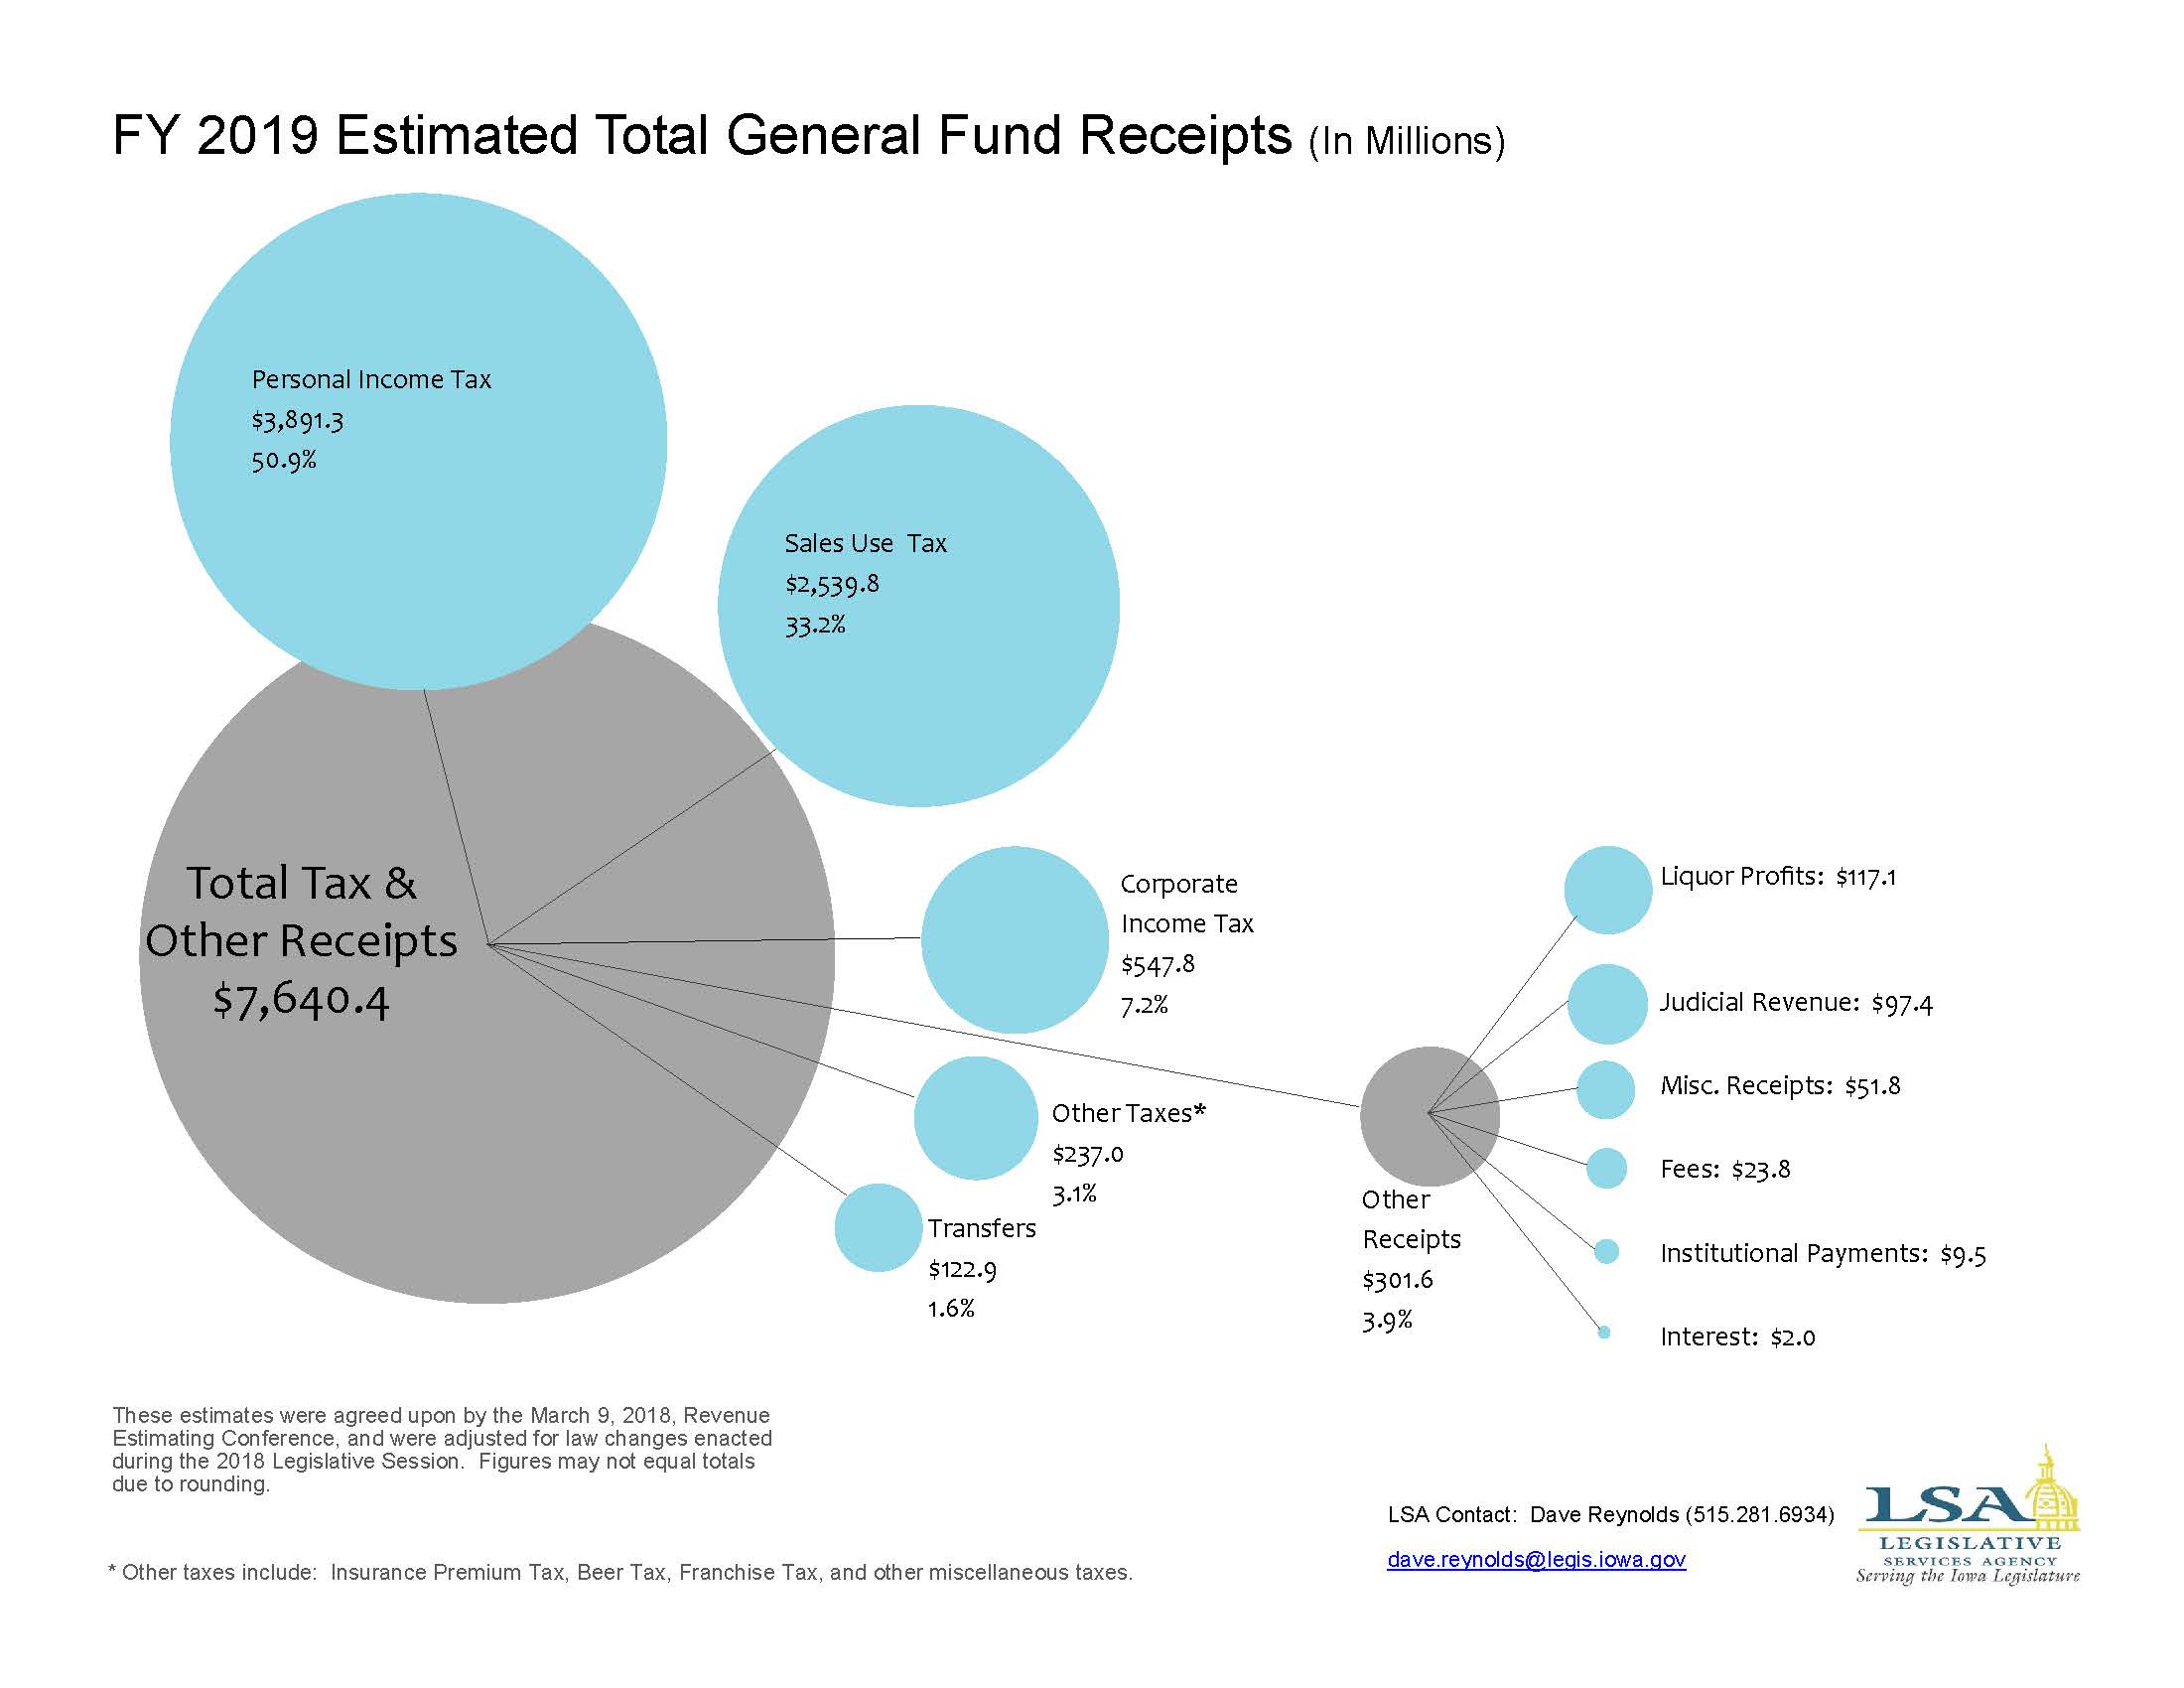
FY 2019 Estimated Total General Fund Receipts
|
|
|
|
|
| 07/23/2018 |
Iowa Insights |
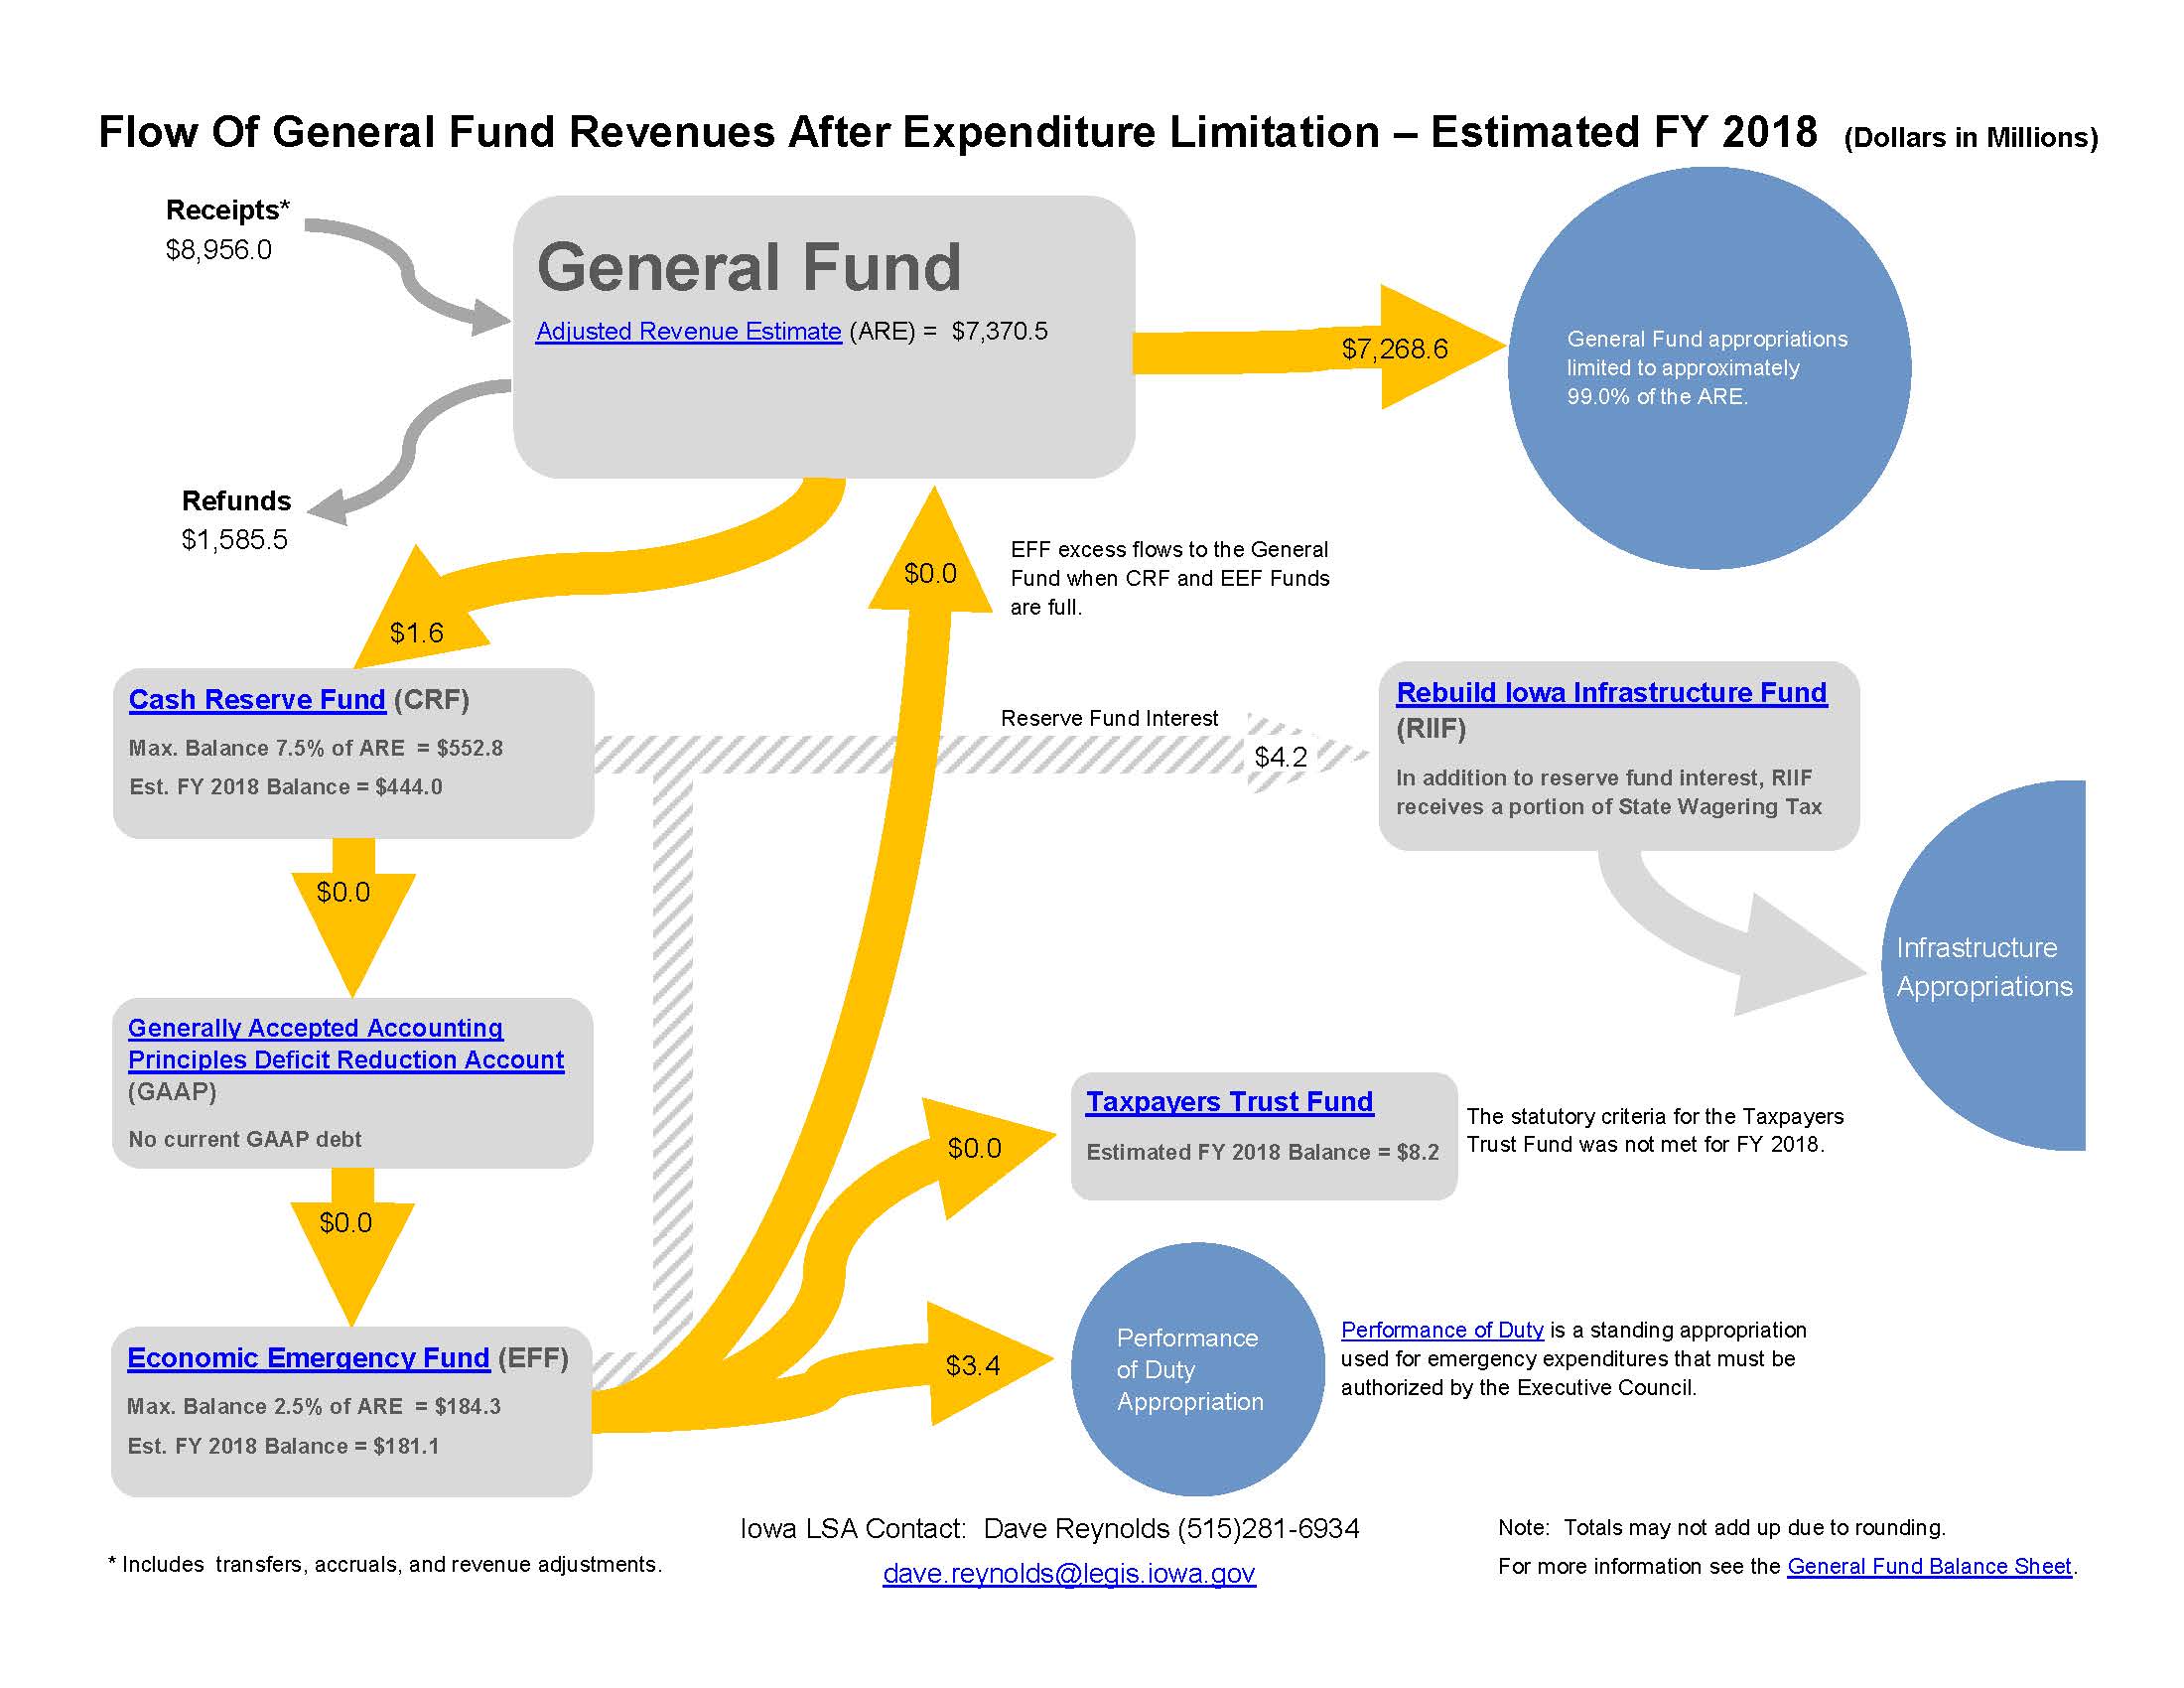
Flow of General Fund Revenues After Expenditure Limitation — Estimated FY 2019

|
|
|
|
|
| 07/16/2018 |
Iowa Insights |
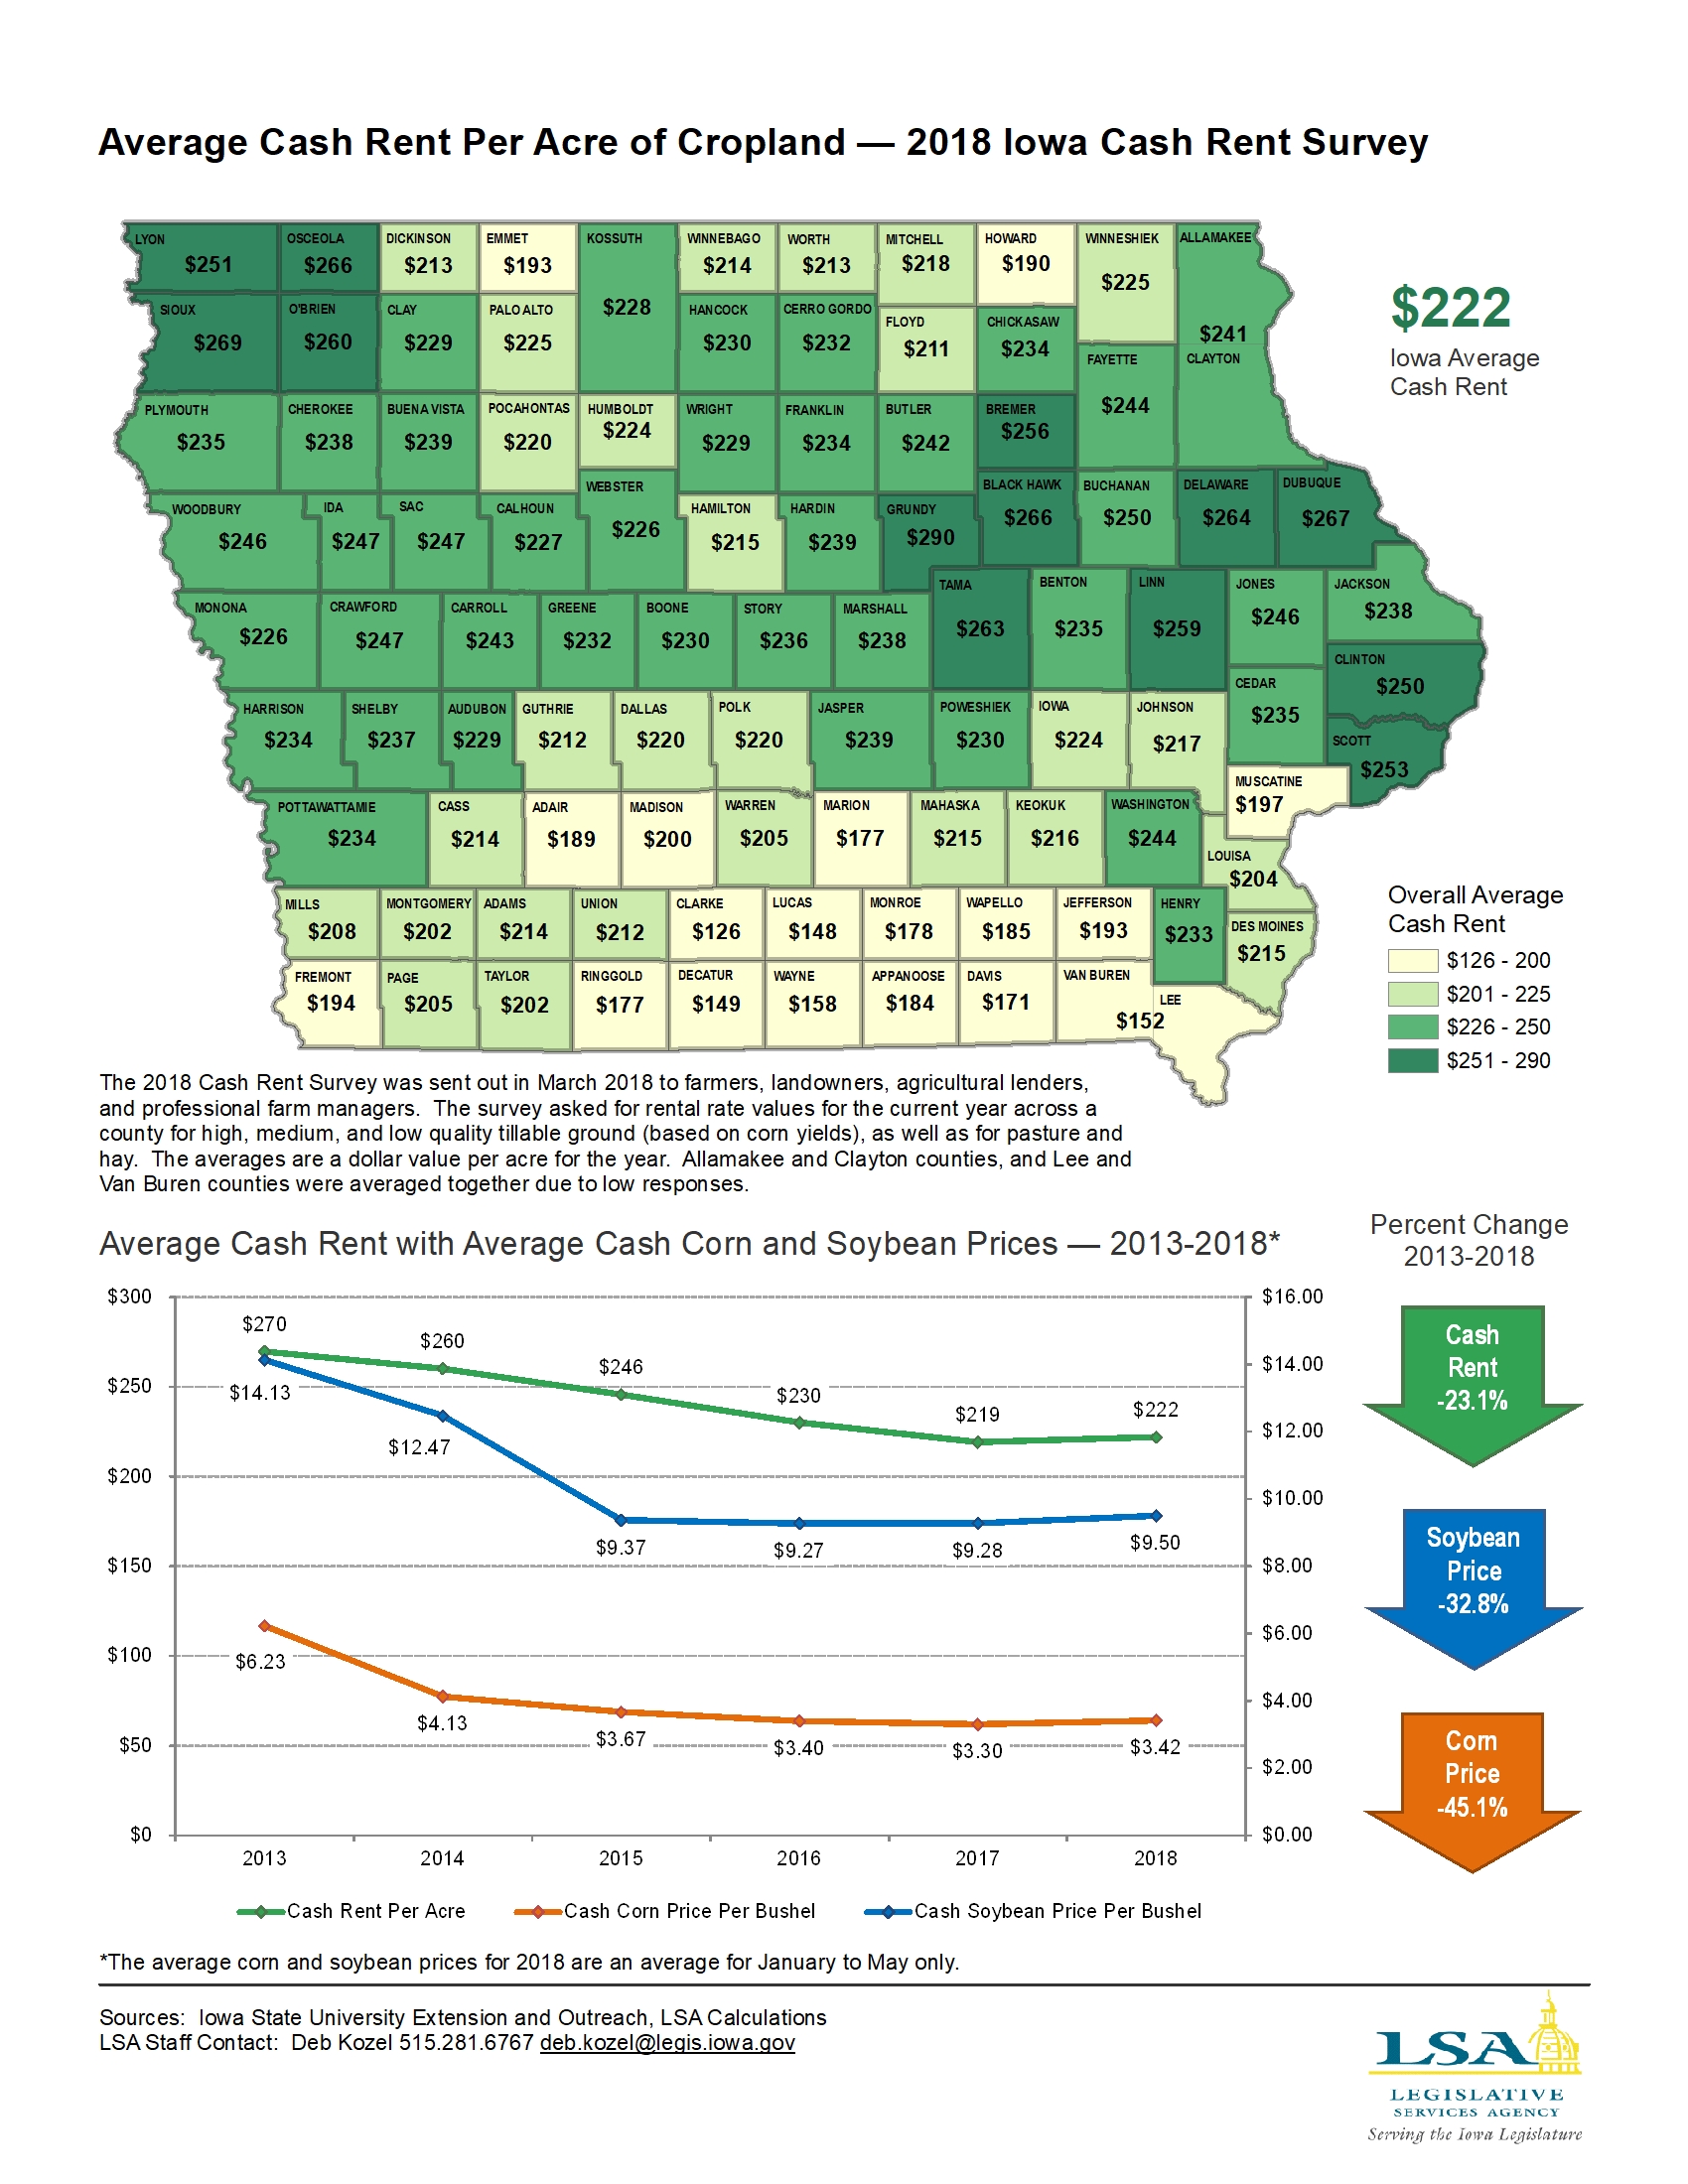
Average Cash Rent Per Acre of Cropland — 2018 Iowa Cash Rent Survey
|
|
|
|
|
| 07/09/2018 |
Iowa Insights |
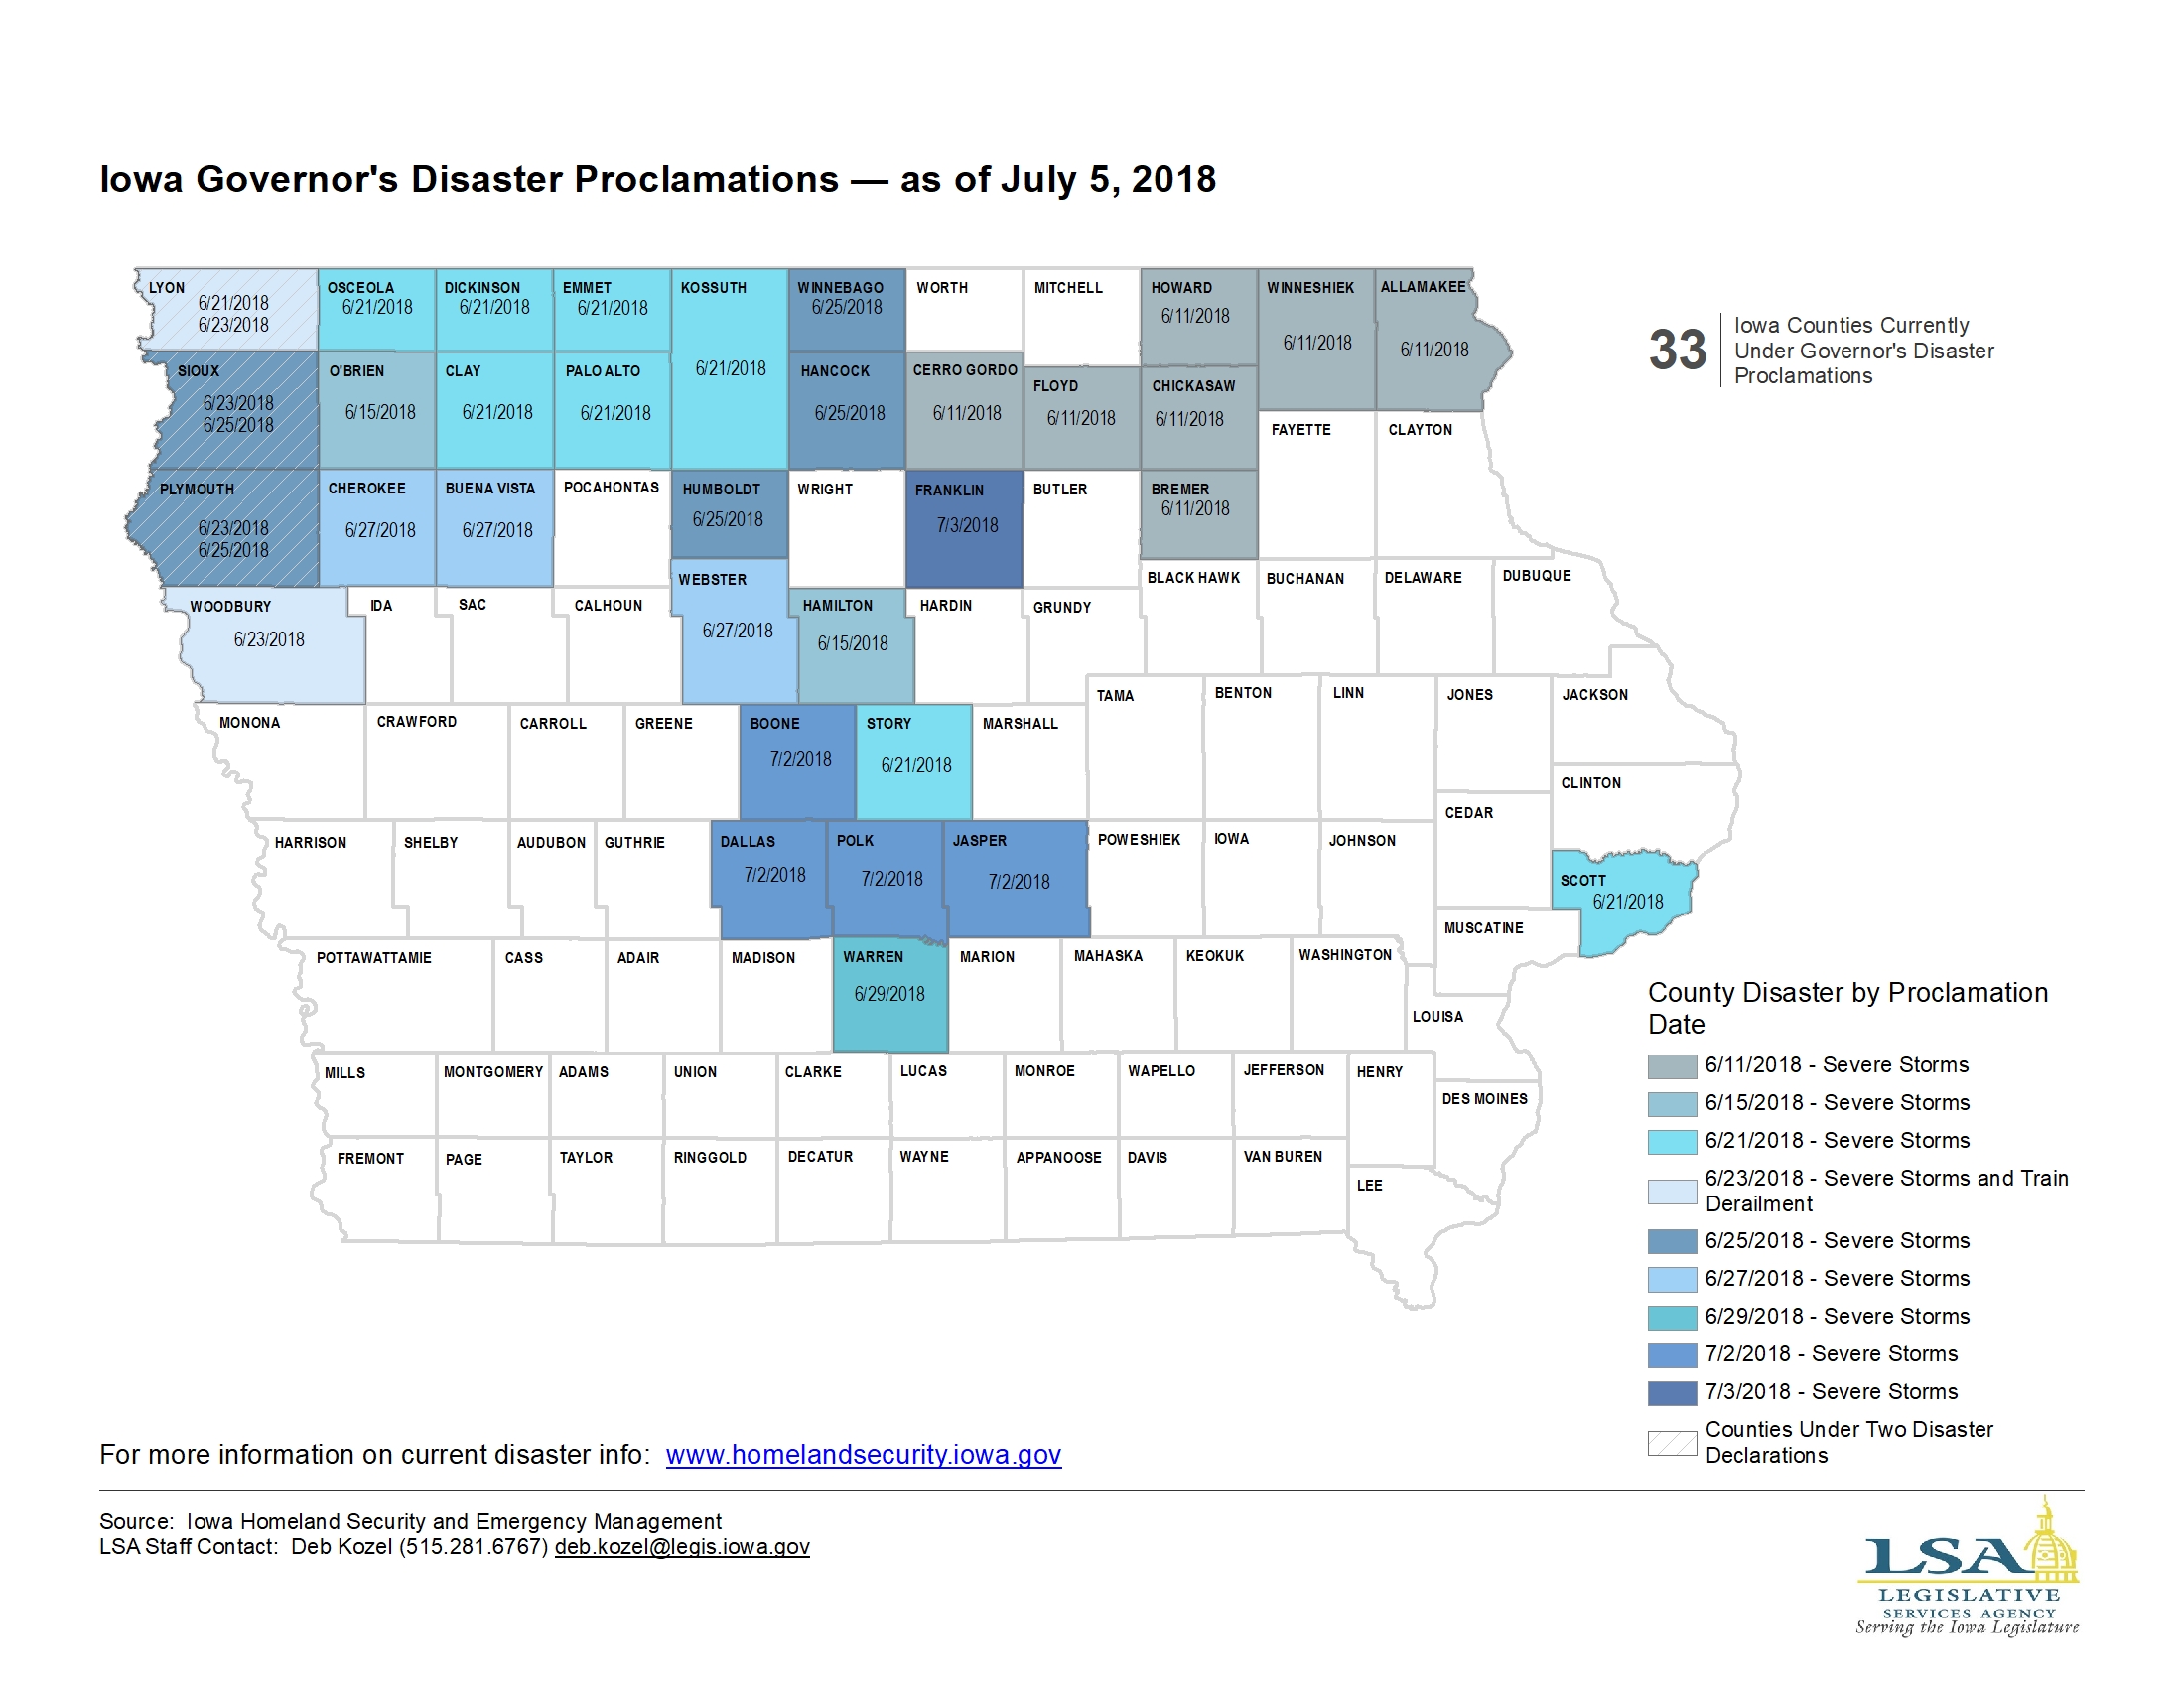
Iowa Governor's Disaster Proclamations — as of July 5, 2018
|
|
|
|
|
| 07/02/2018 |
Iowa Insights |
Iowa Governor's Disaster Proclamations — as of June 29, 2018

|
|
|
|
|
| 06/25/2018 |
Iowa Insights |
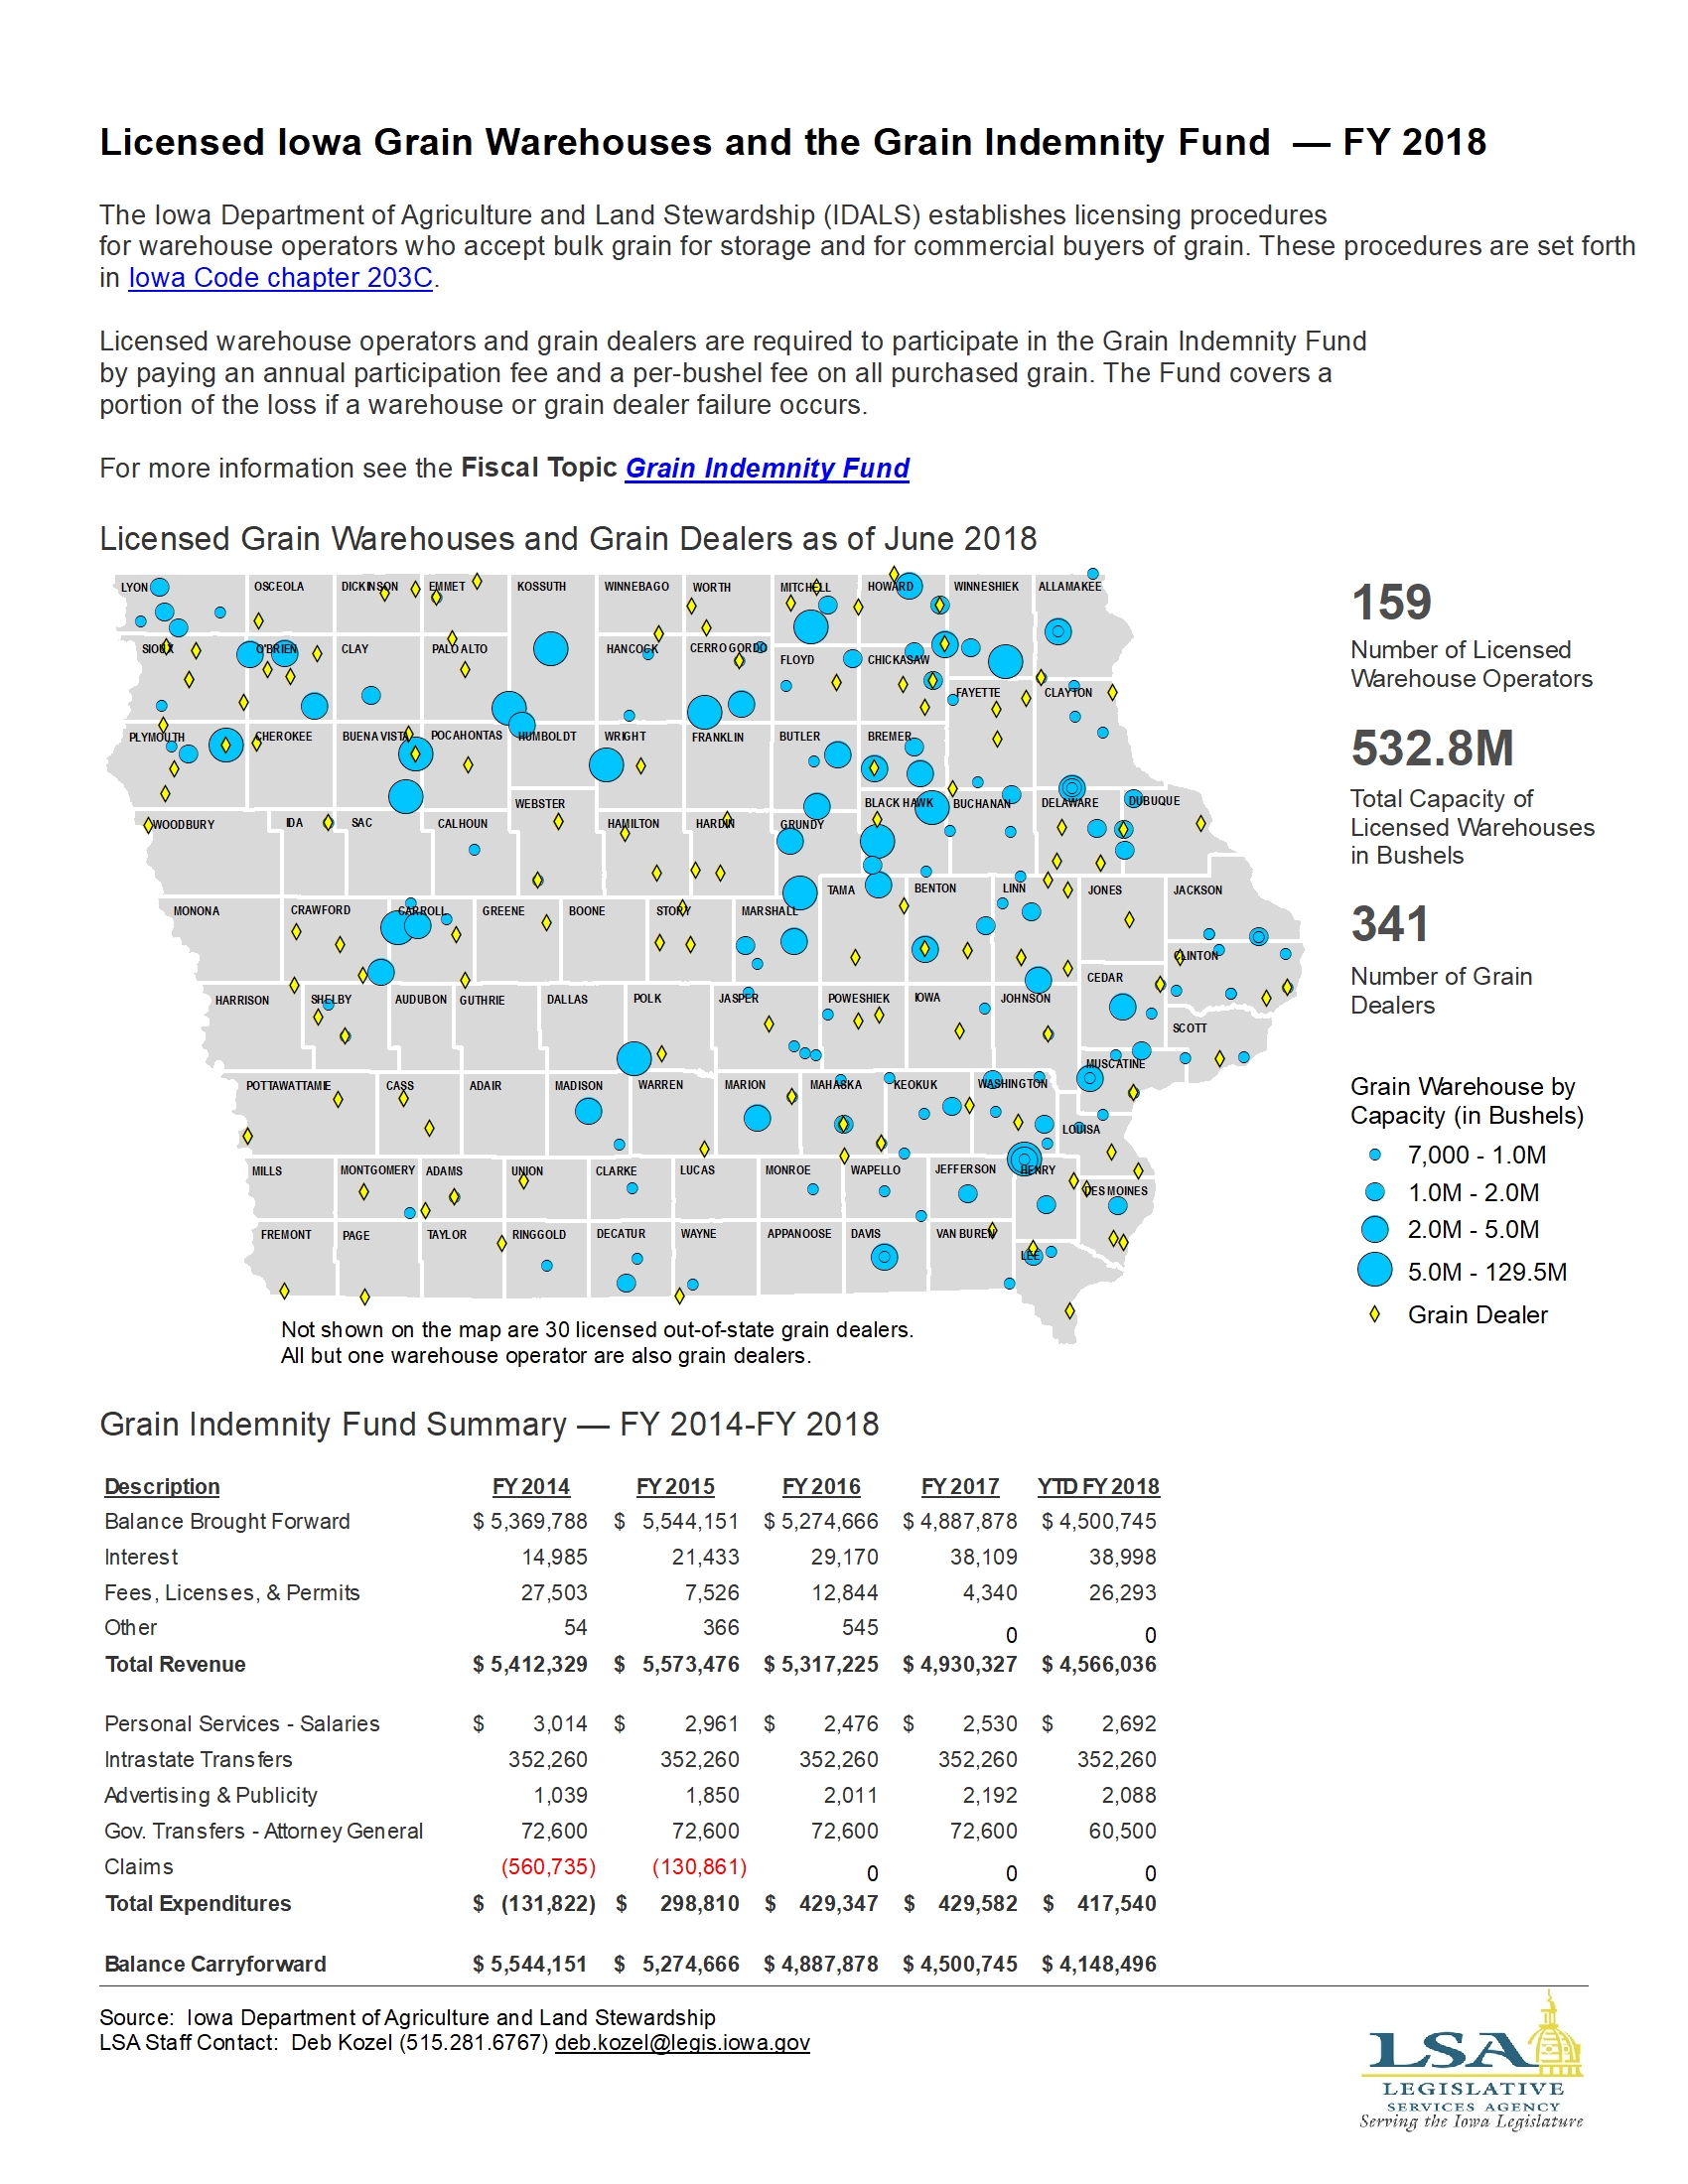
Licensed Grain Warehouses and the Grain Indemnity Fund — FY 2018
|
|
|
|
|
| 06/11/2018 |
Iowa Insights |
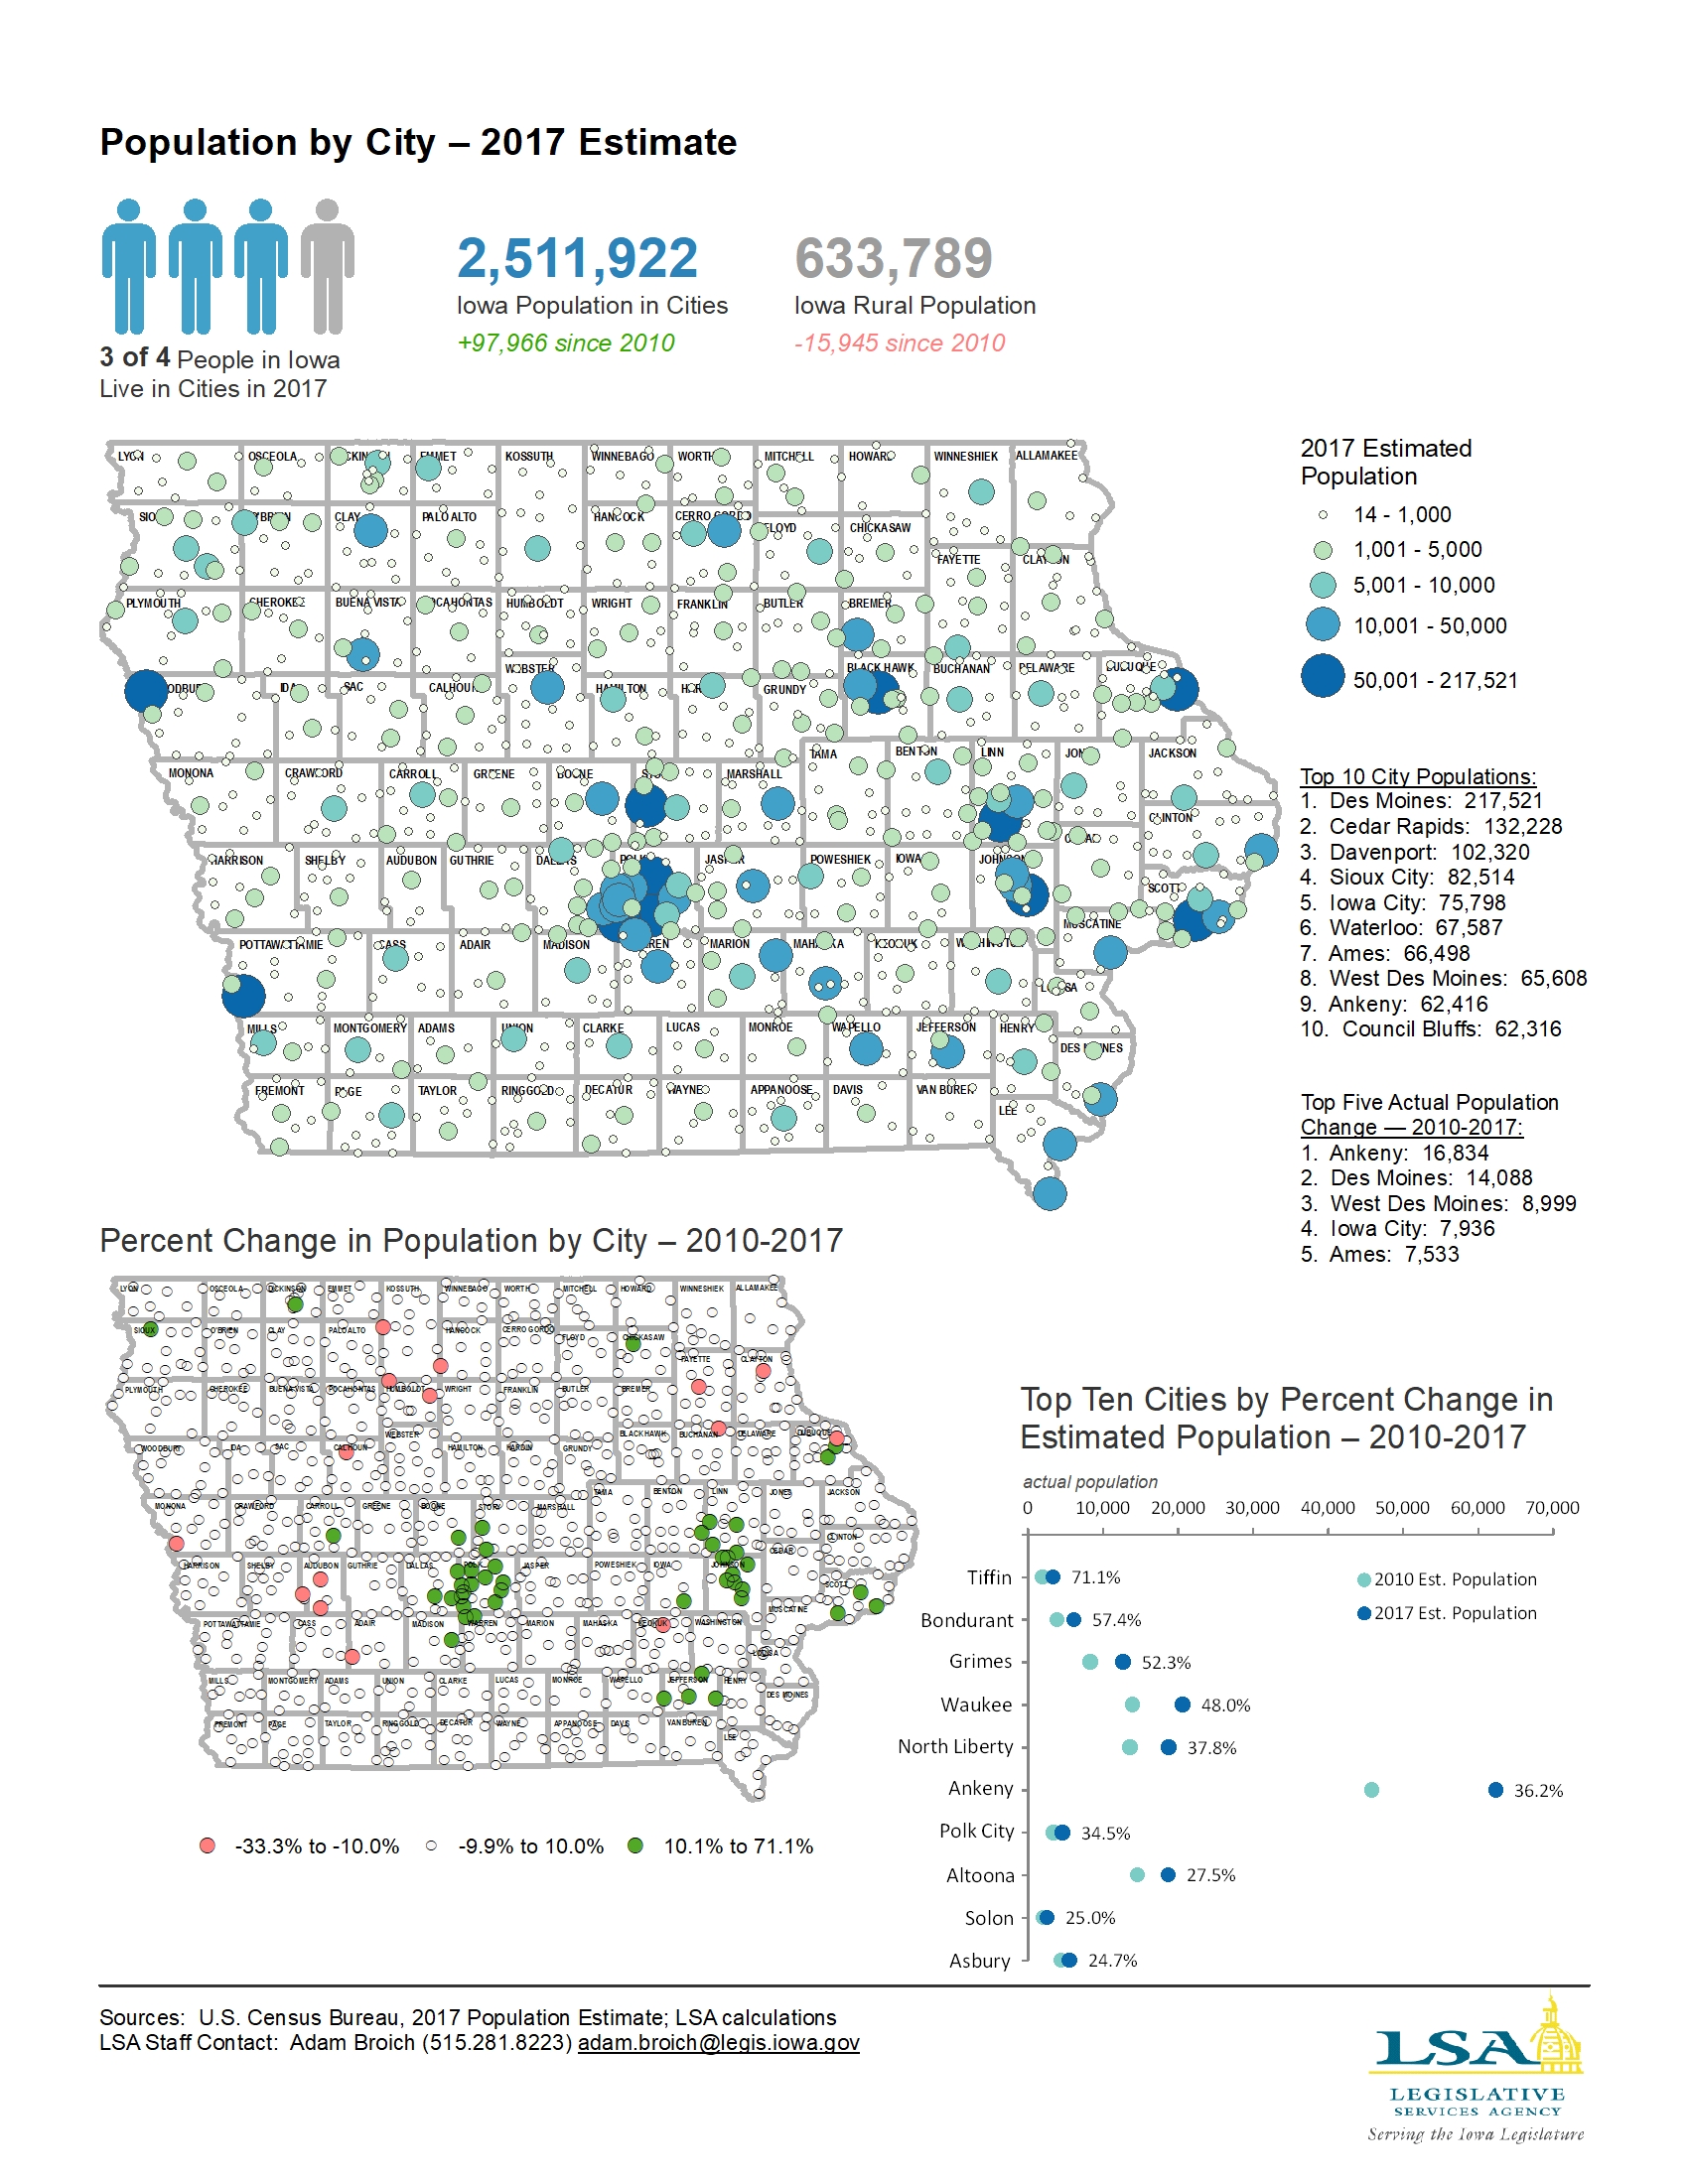
Population by City — 2017 Estimate
|
|
|
|
|
| 06/04/2018 |
Iowa Insights |
State Aviation Program — Vertical Infrastructure
|
|
|
|
|
| 05/28/2018 |
Iowa Insights |
State Aviation Program — Airport Improvement Program
|
|
|
|
|
| 05/21/2018 |
Iowa Insights |
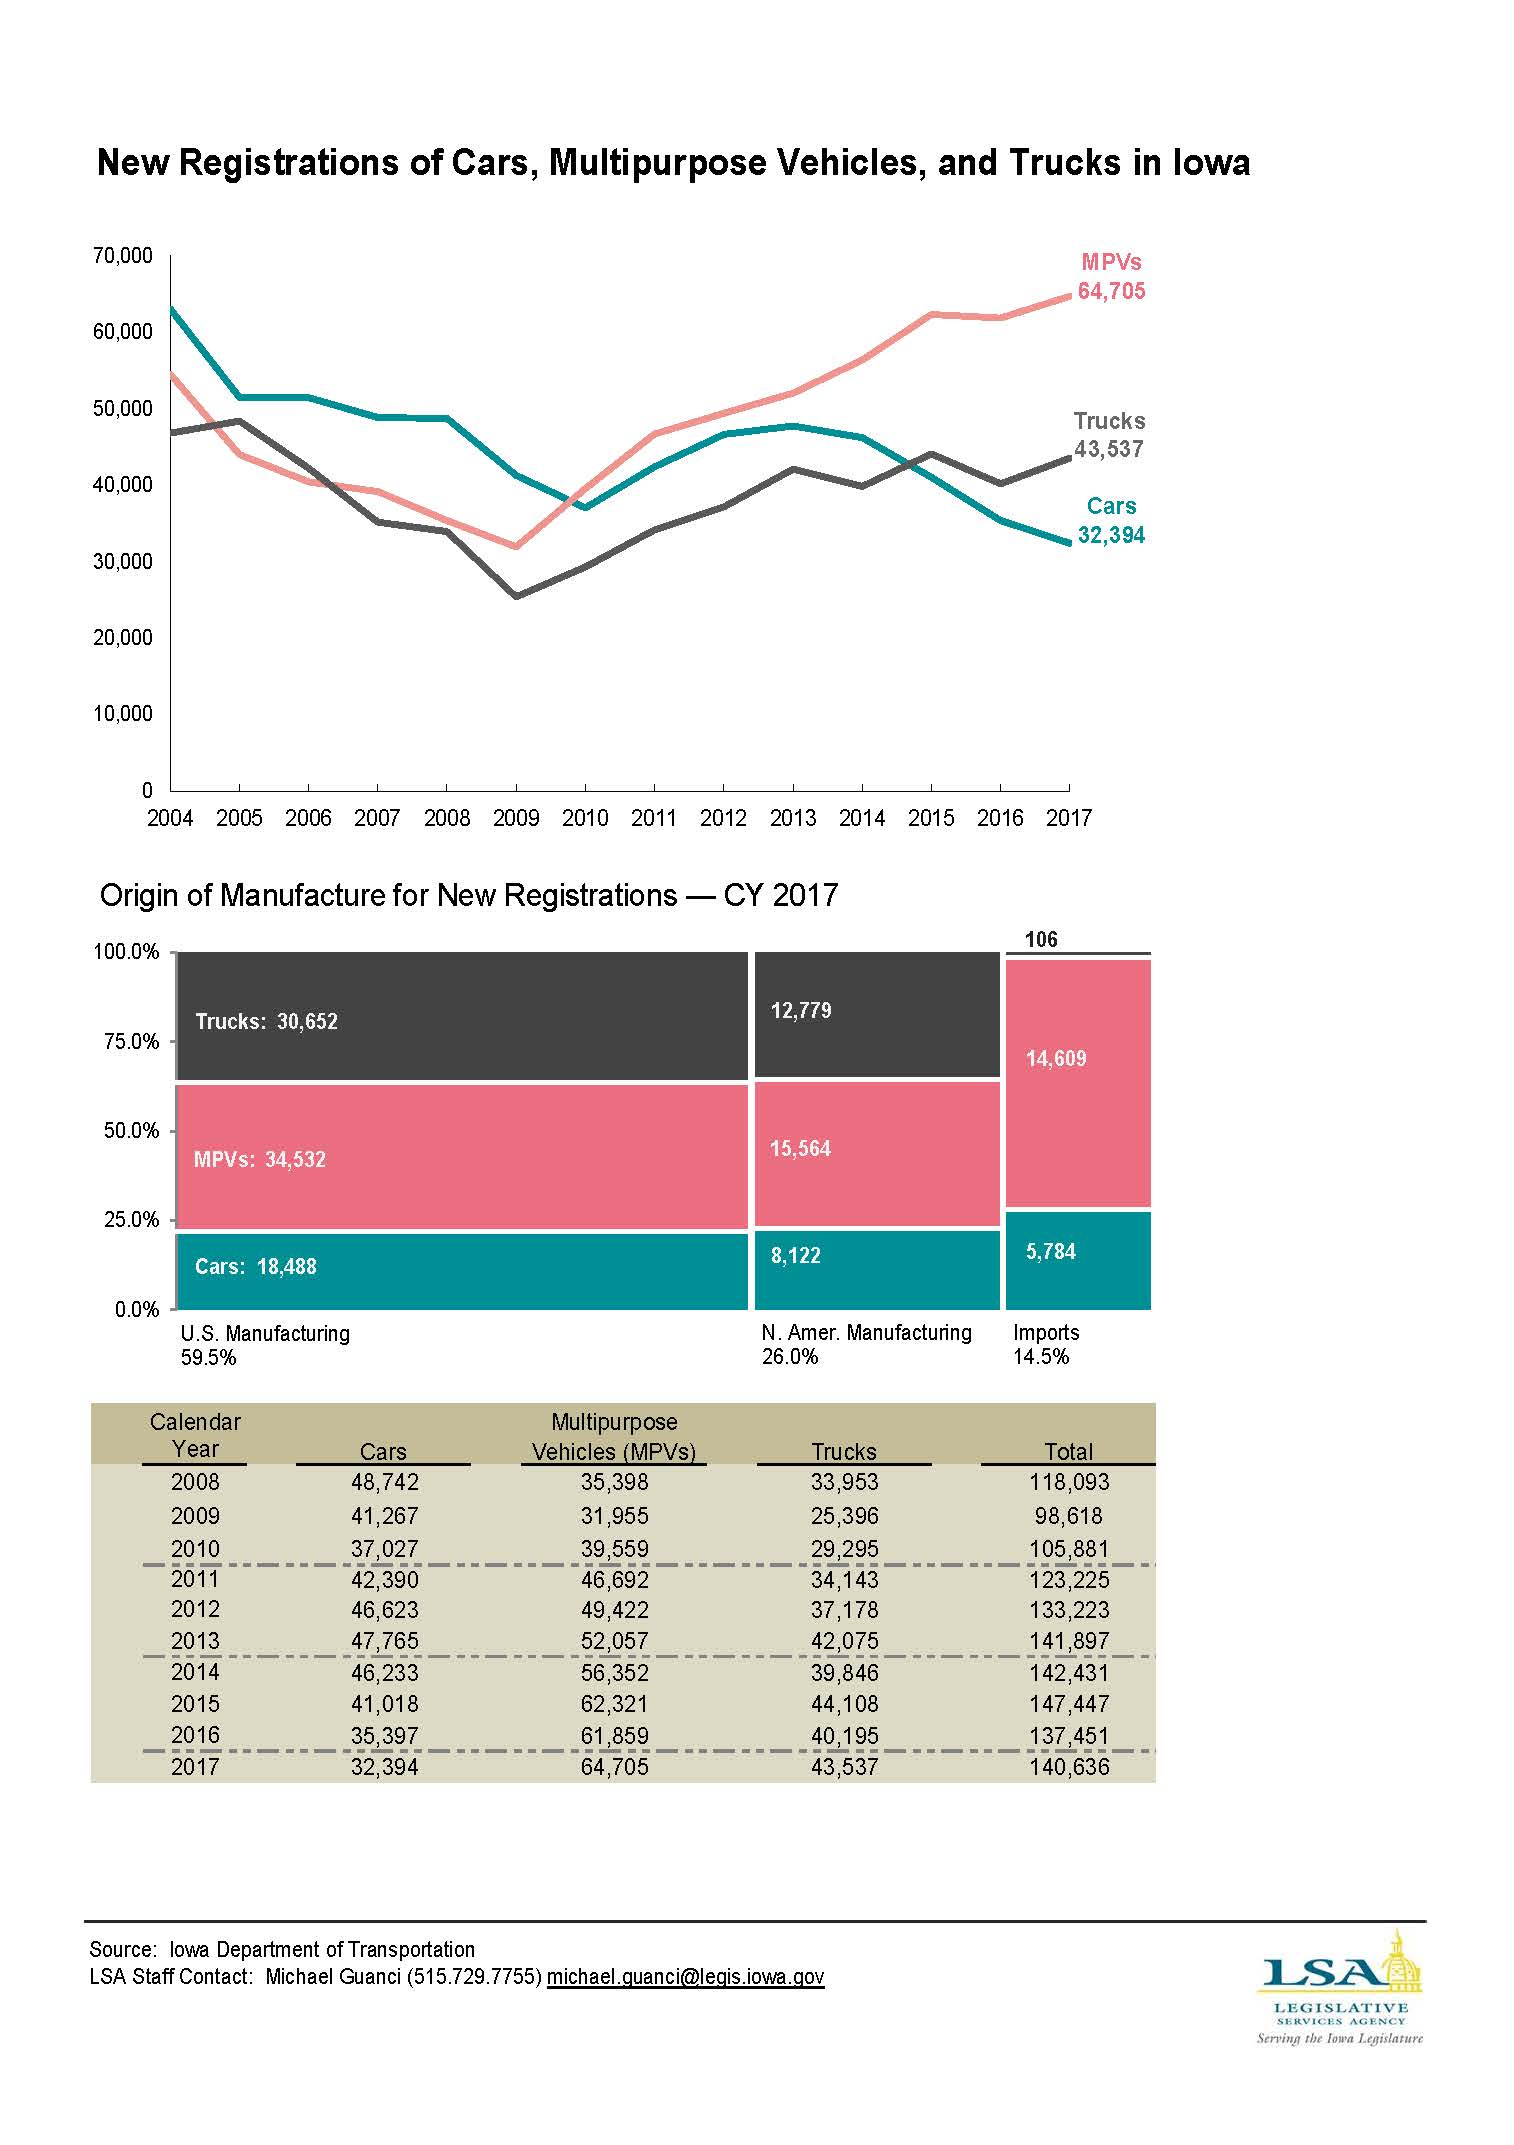
New Registrations of Cars, Multipurpose Vehicles, and Trucks in Iowa
|
|
|
|
|
| 05/14/2018 |
Iowa Insights |
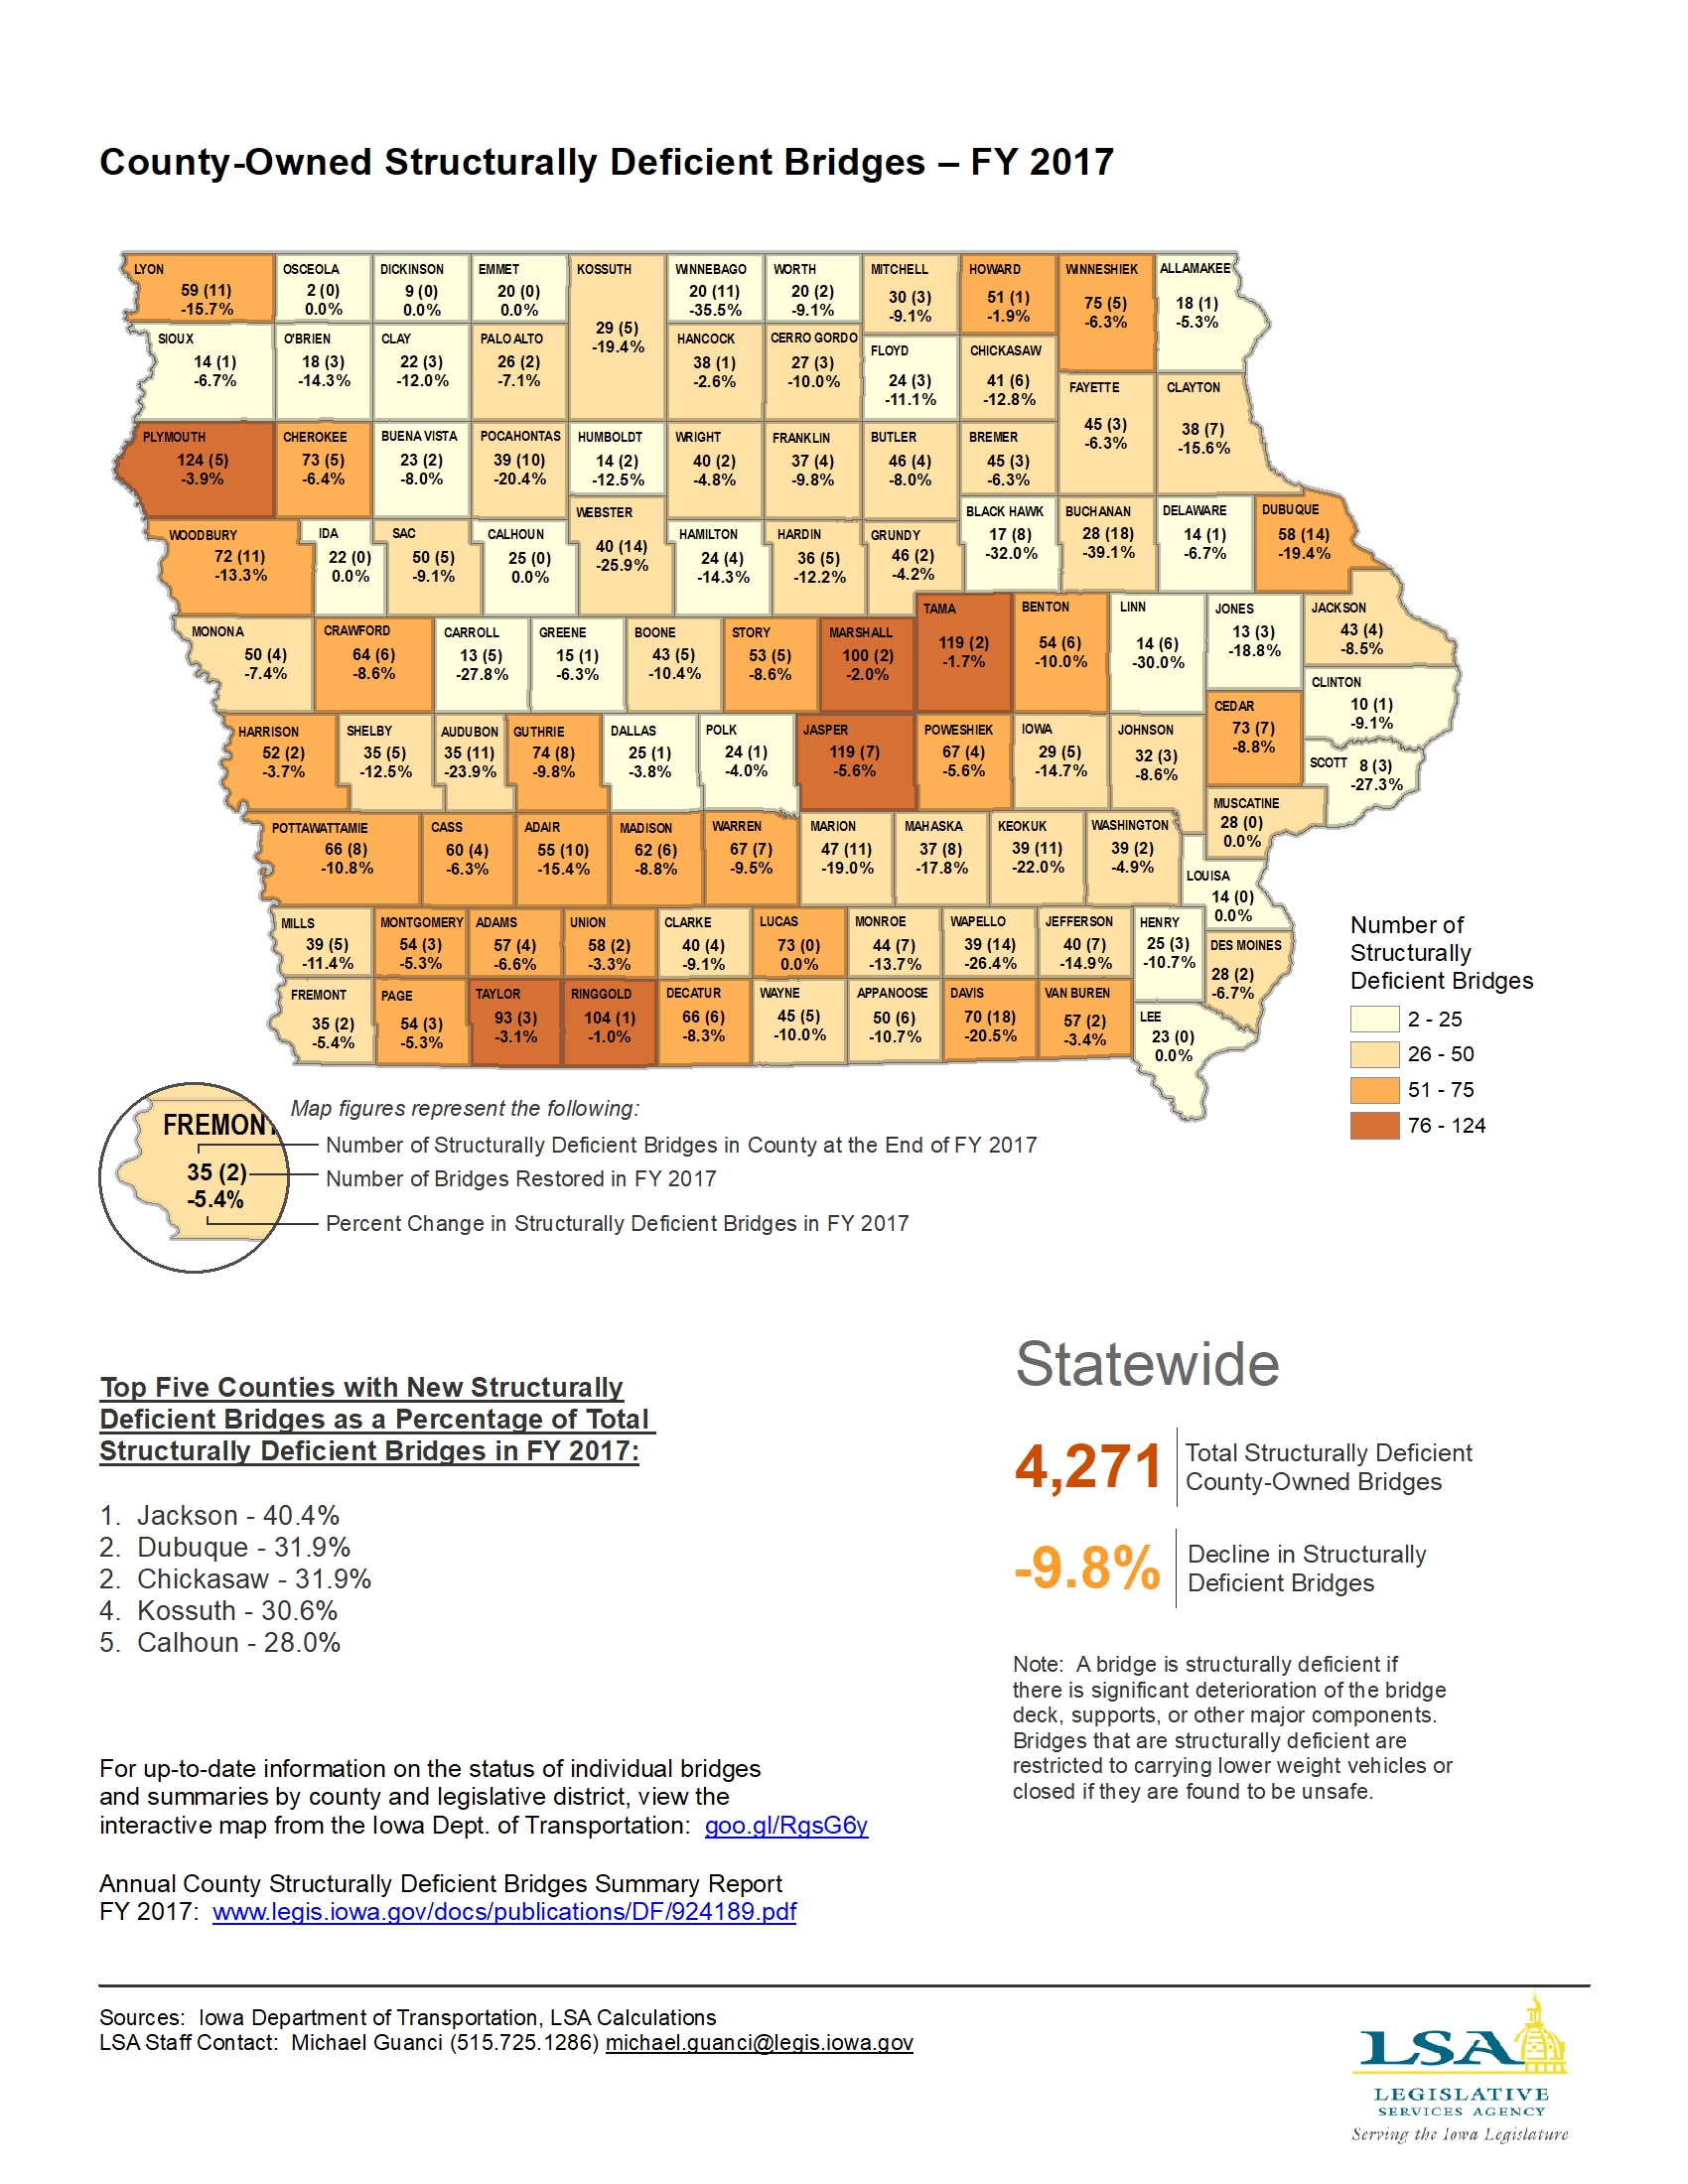
County-Owned Structurally Deficient Bridges — FY 2017
|
|
|
|
|
| 05/07/2018 |
Iowa Insights |
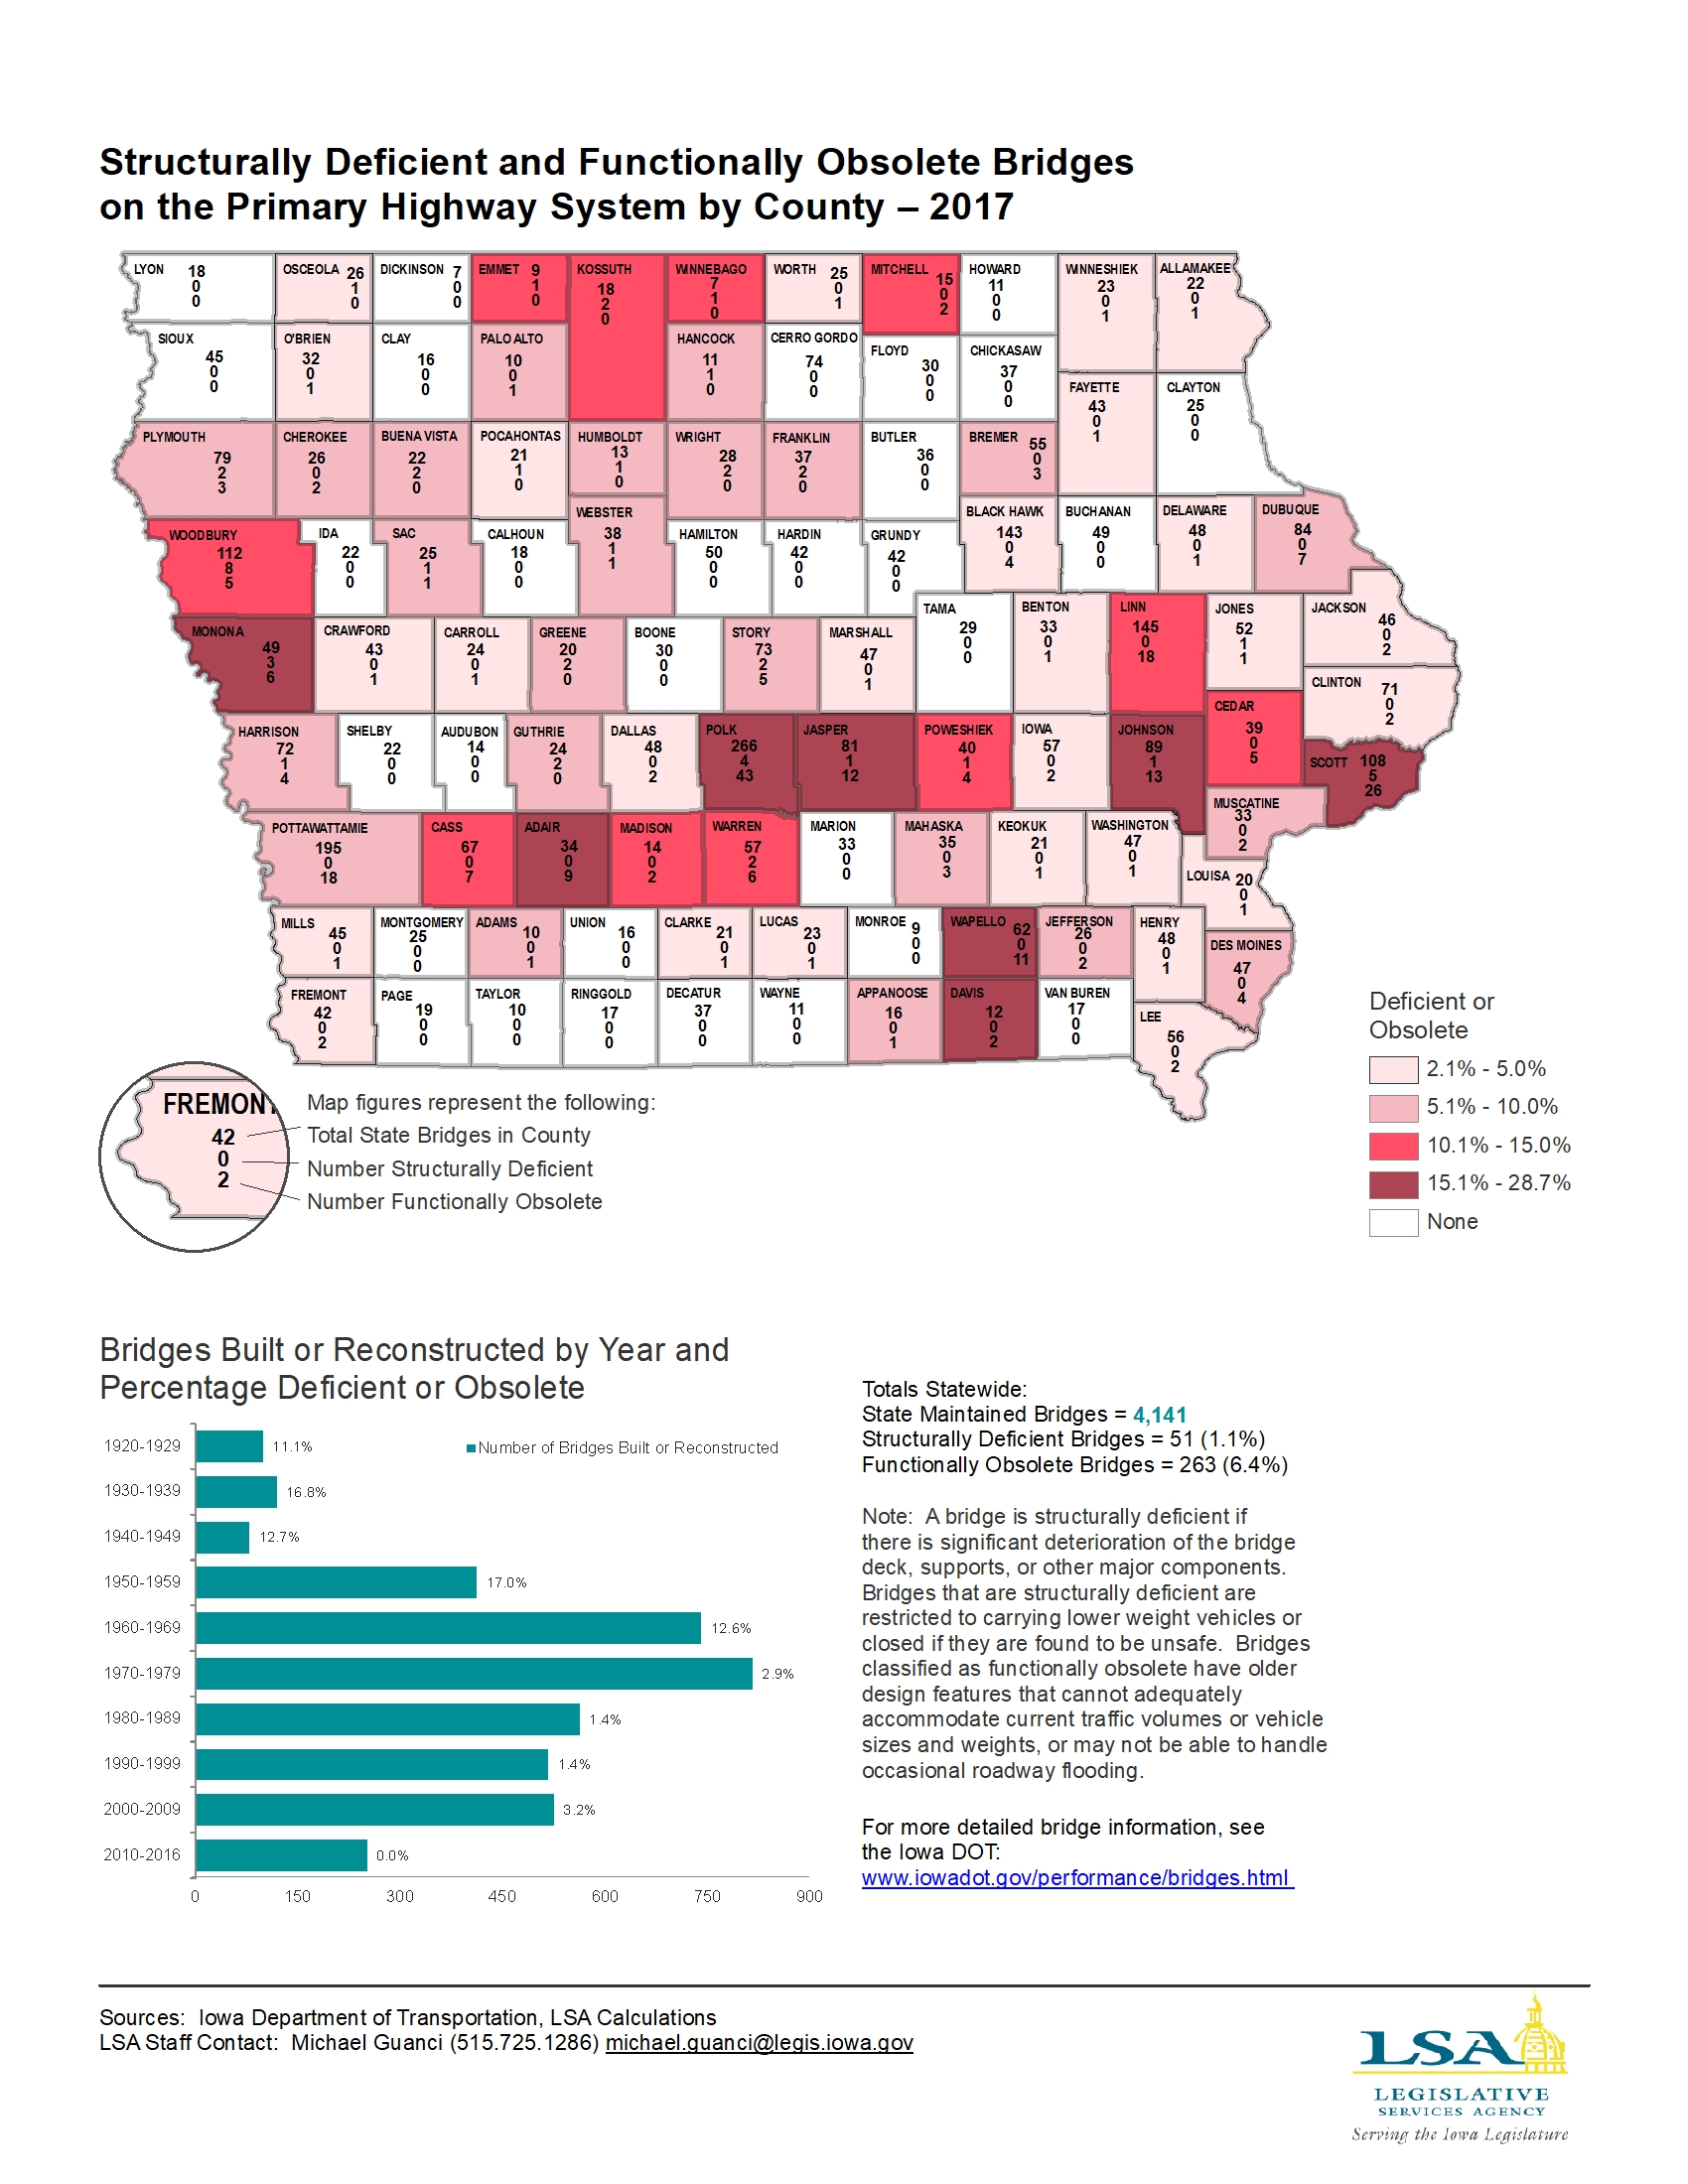
Structurally Deficient and Functionally Obsolete Bridges by County — 2017
|
|
|
|
|
| 04/30/2018 |
Iowa Insights |
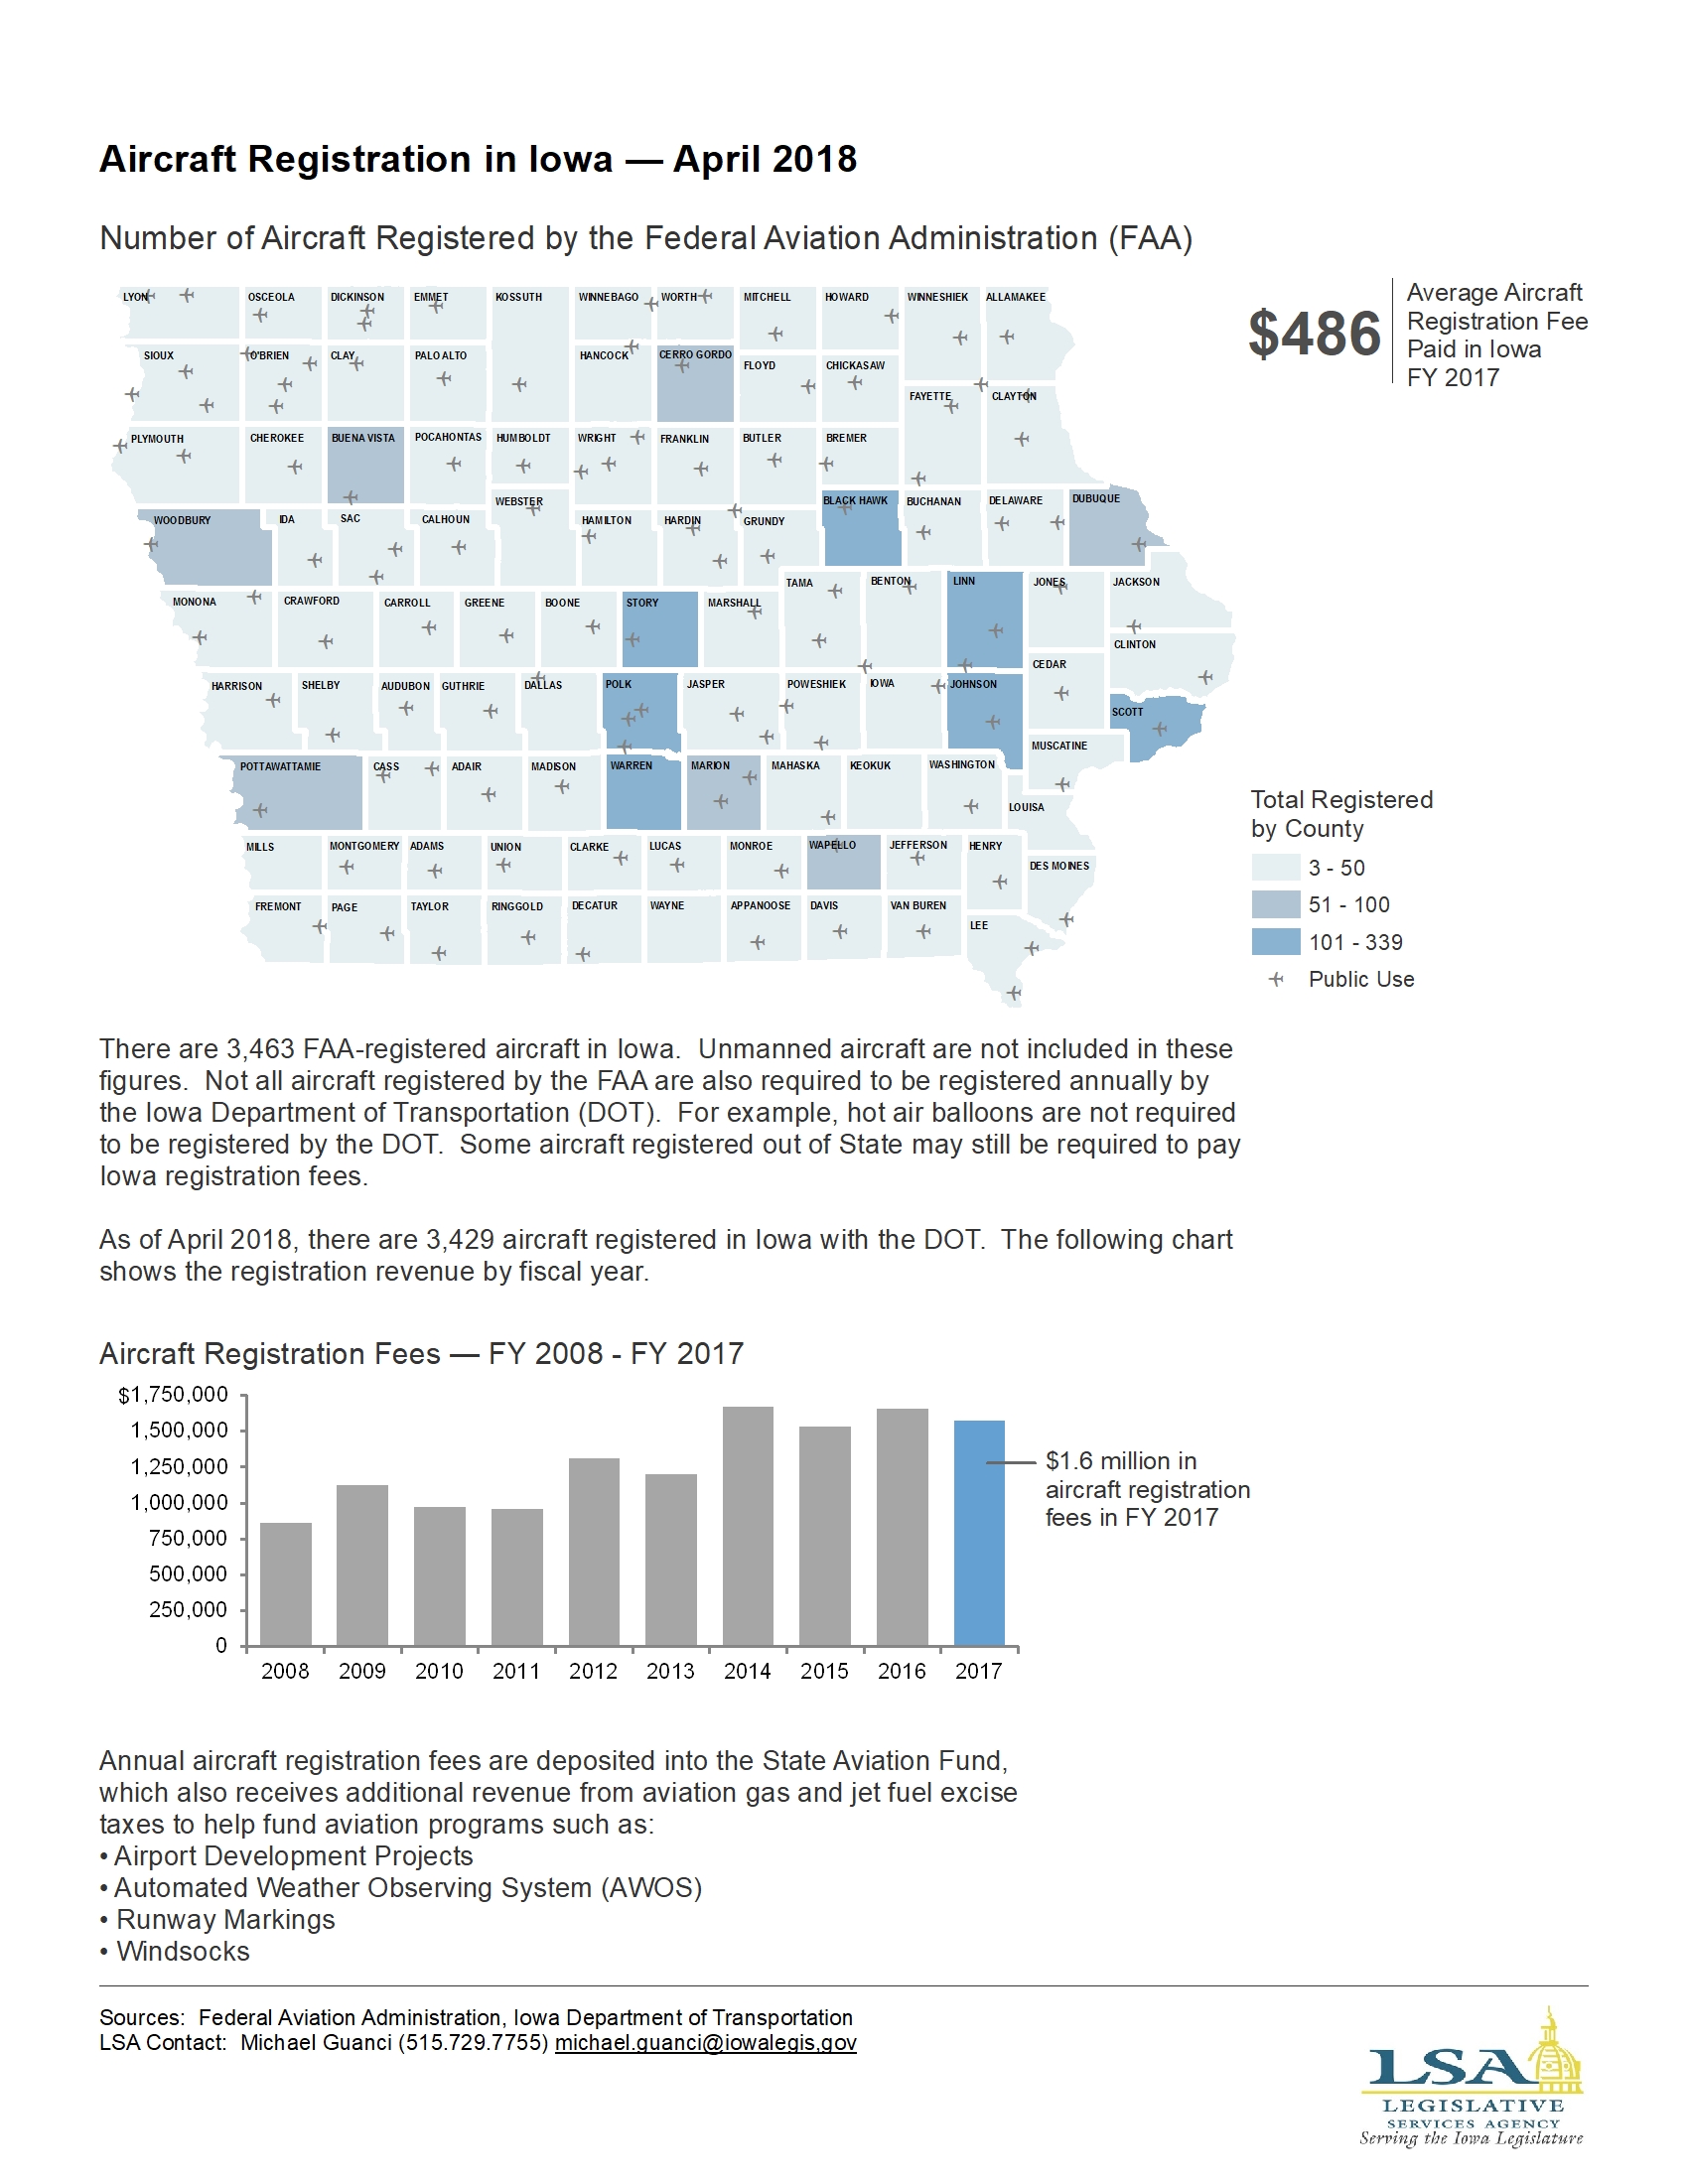
Aircraft Registration in Iowa
|
|
|
|
|
| 04/23/2018 |
Iowa Insights |
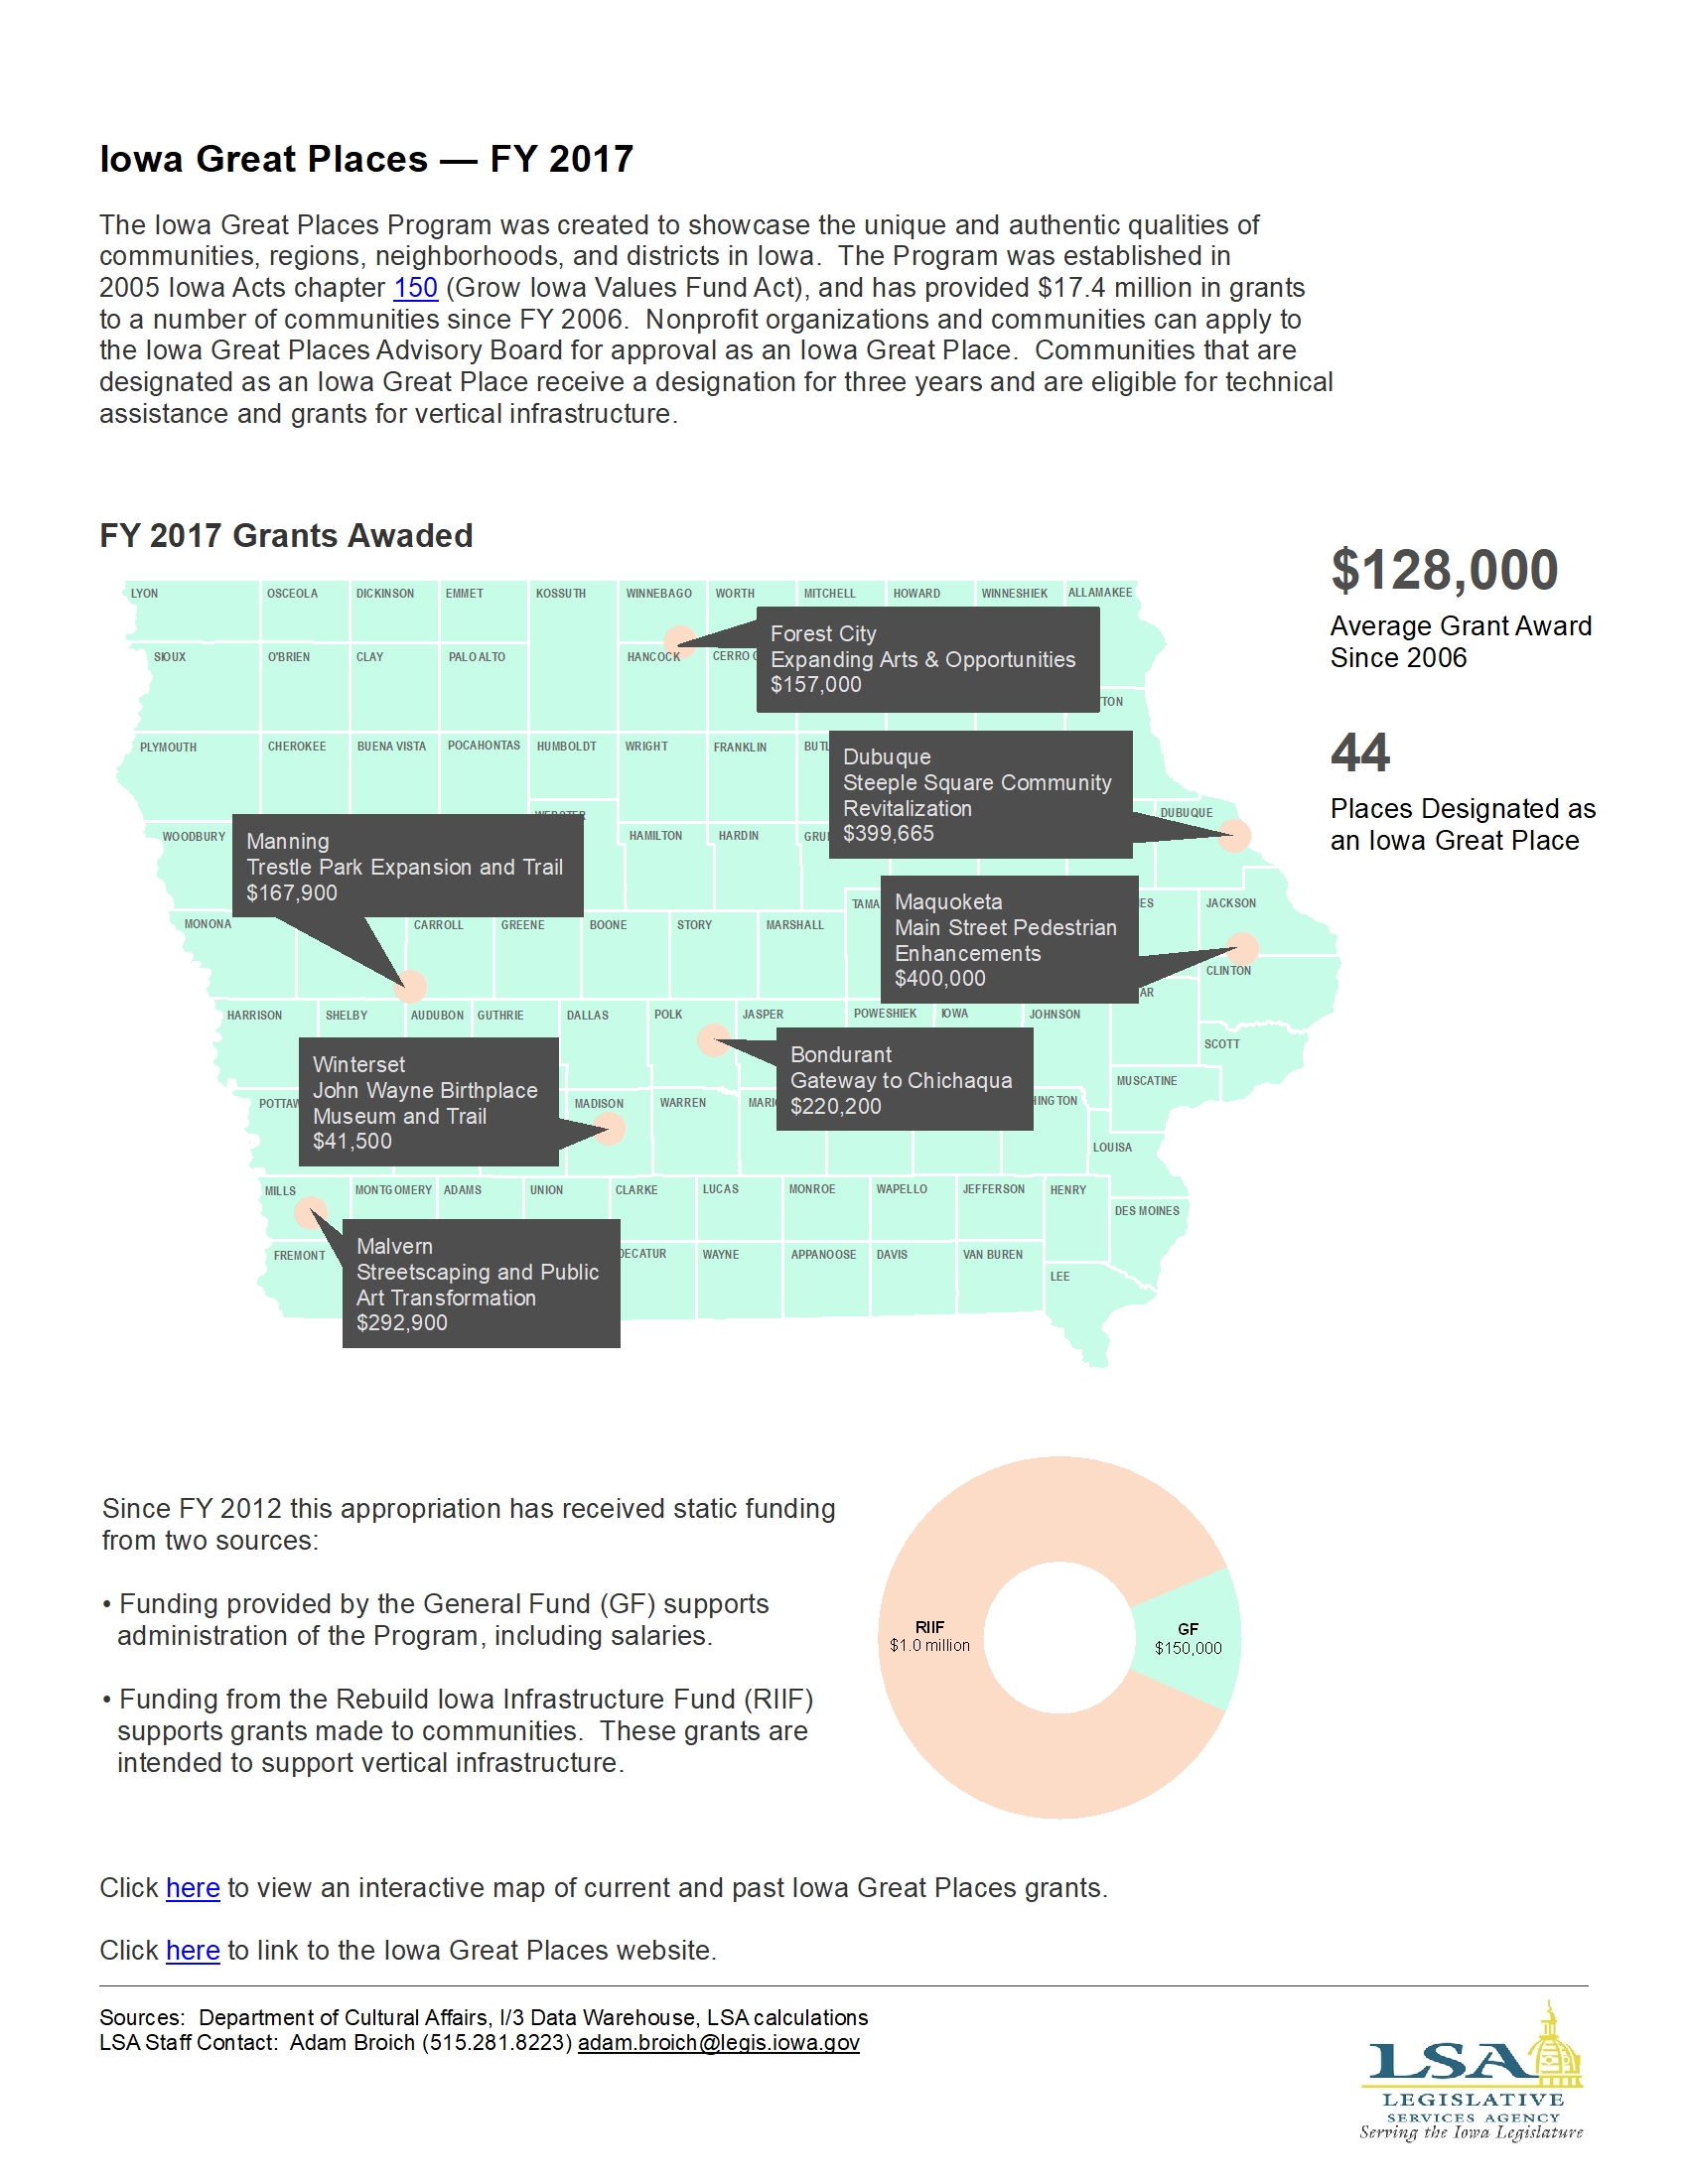
Iowa Great Places — FY 2017
|
|
|
|
|
| 04/16/2018 |
Iowa Insights |
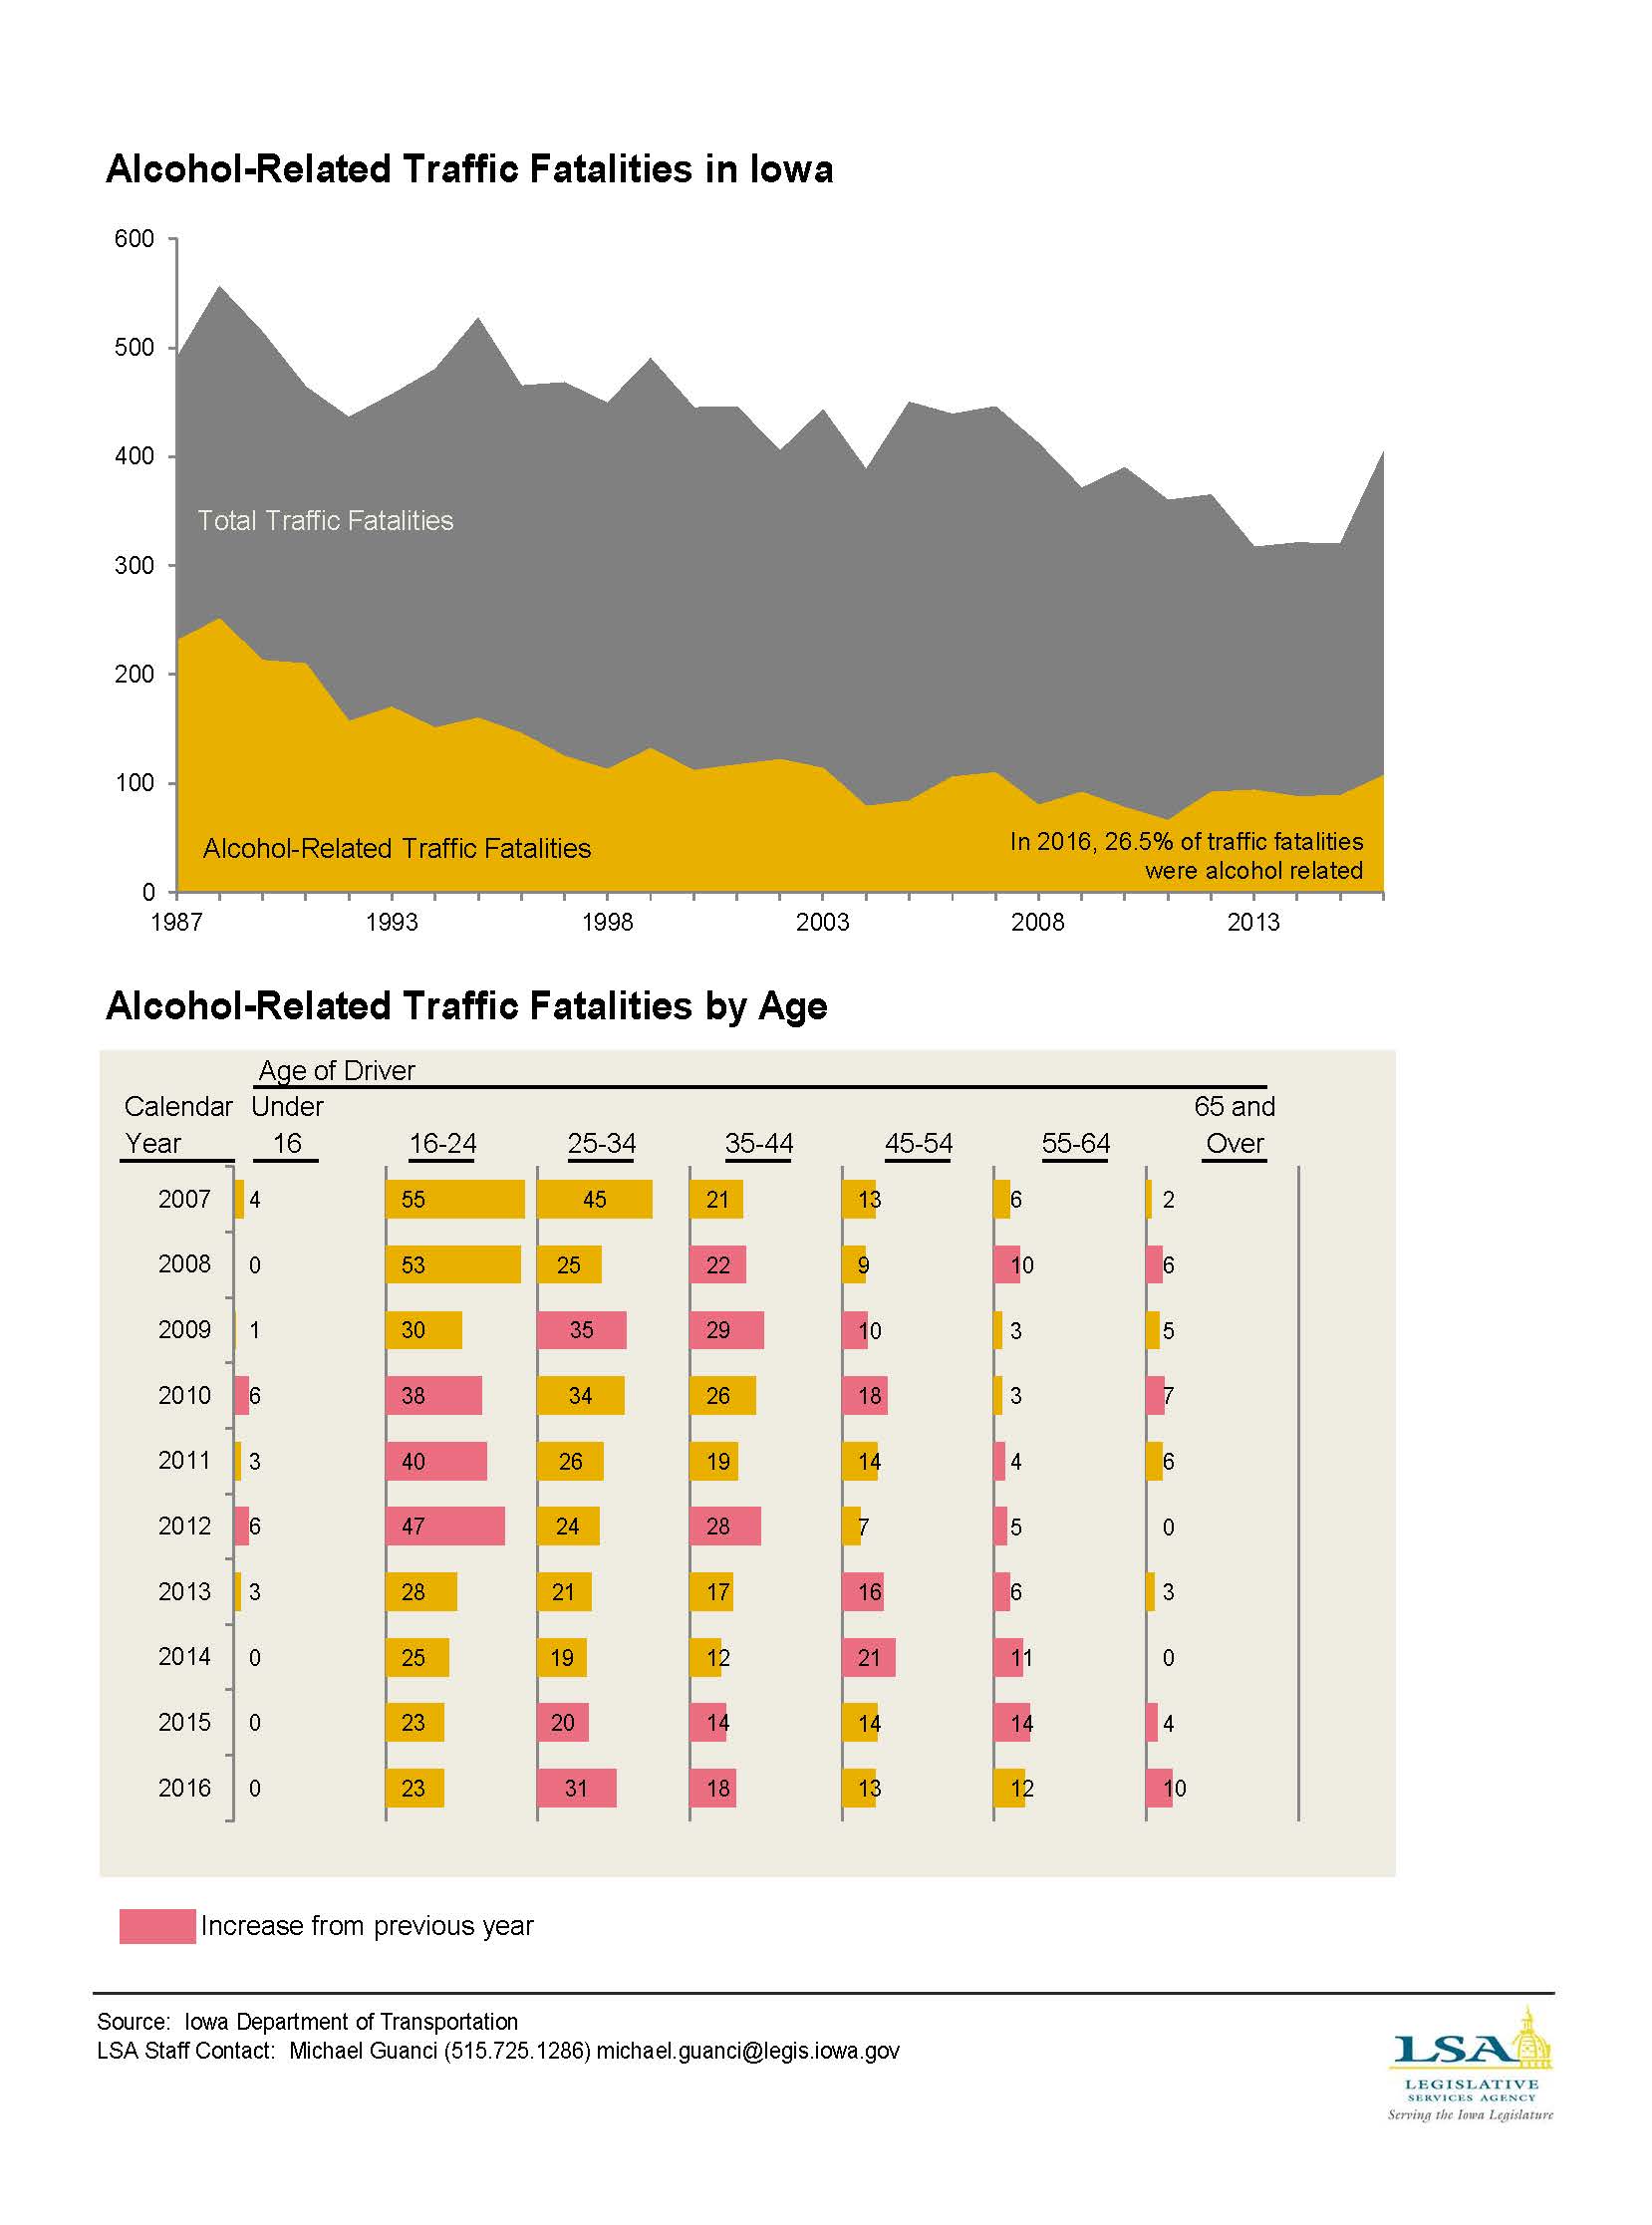
Alcohol-Related Traffic Fatalities — 2016
|
|
|
|
|
| 04/09/2018 |
Iowa Insights |
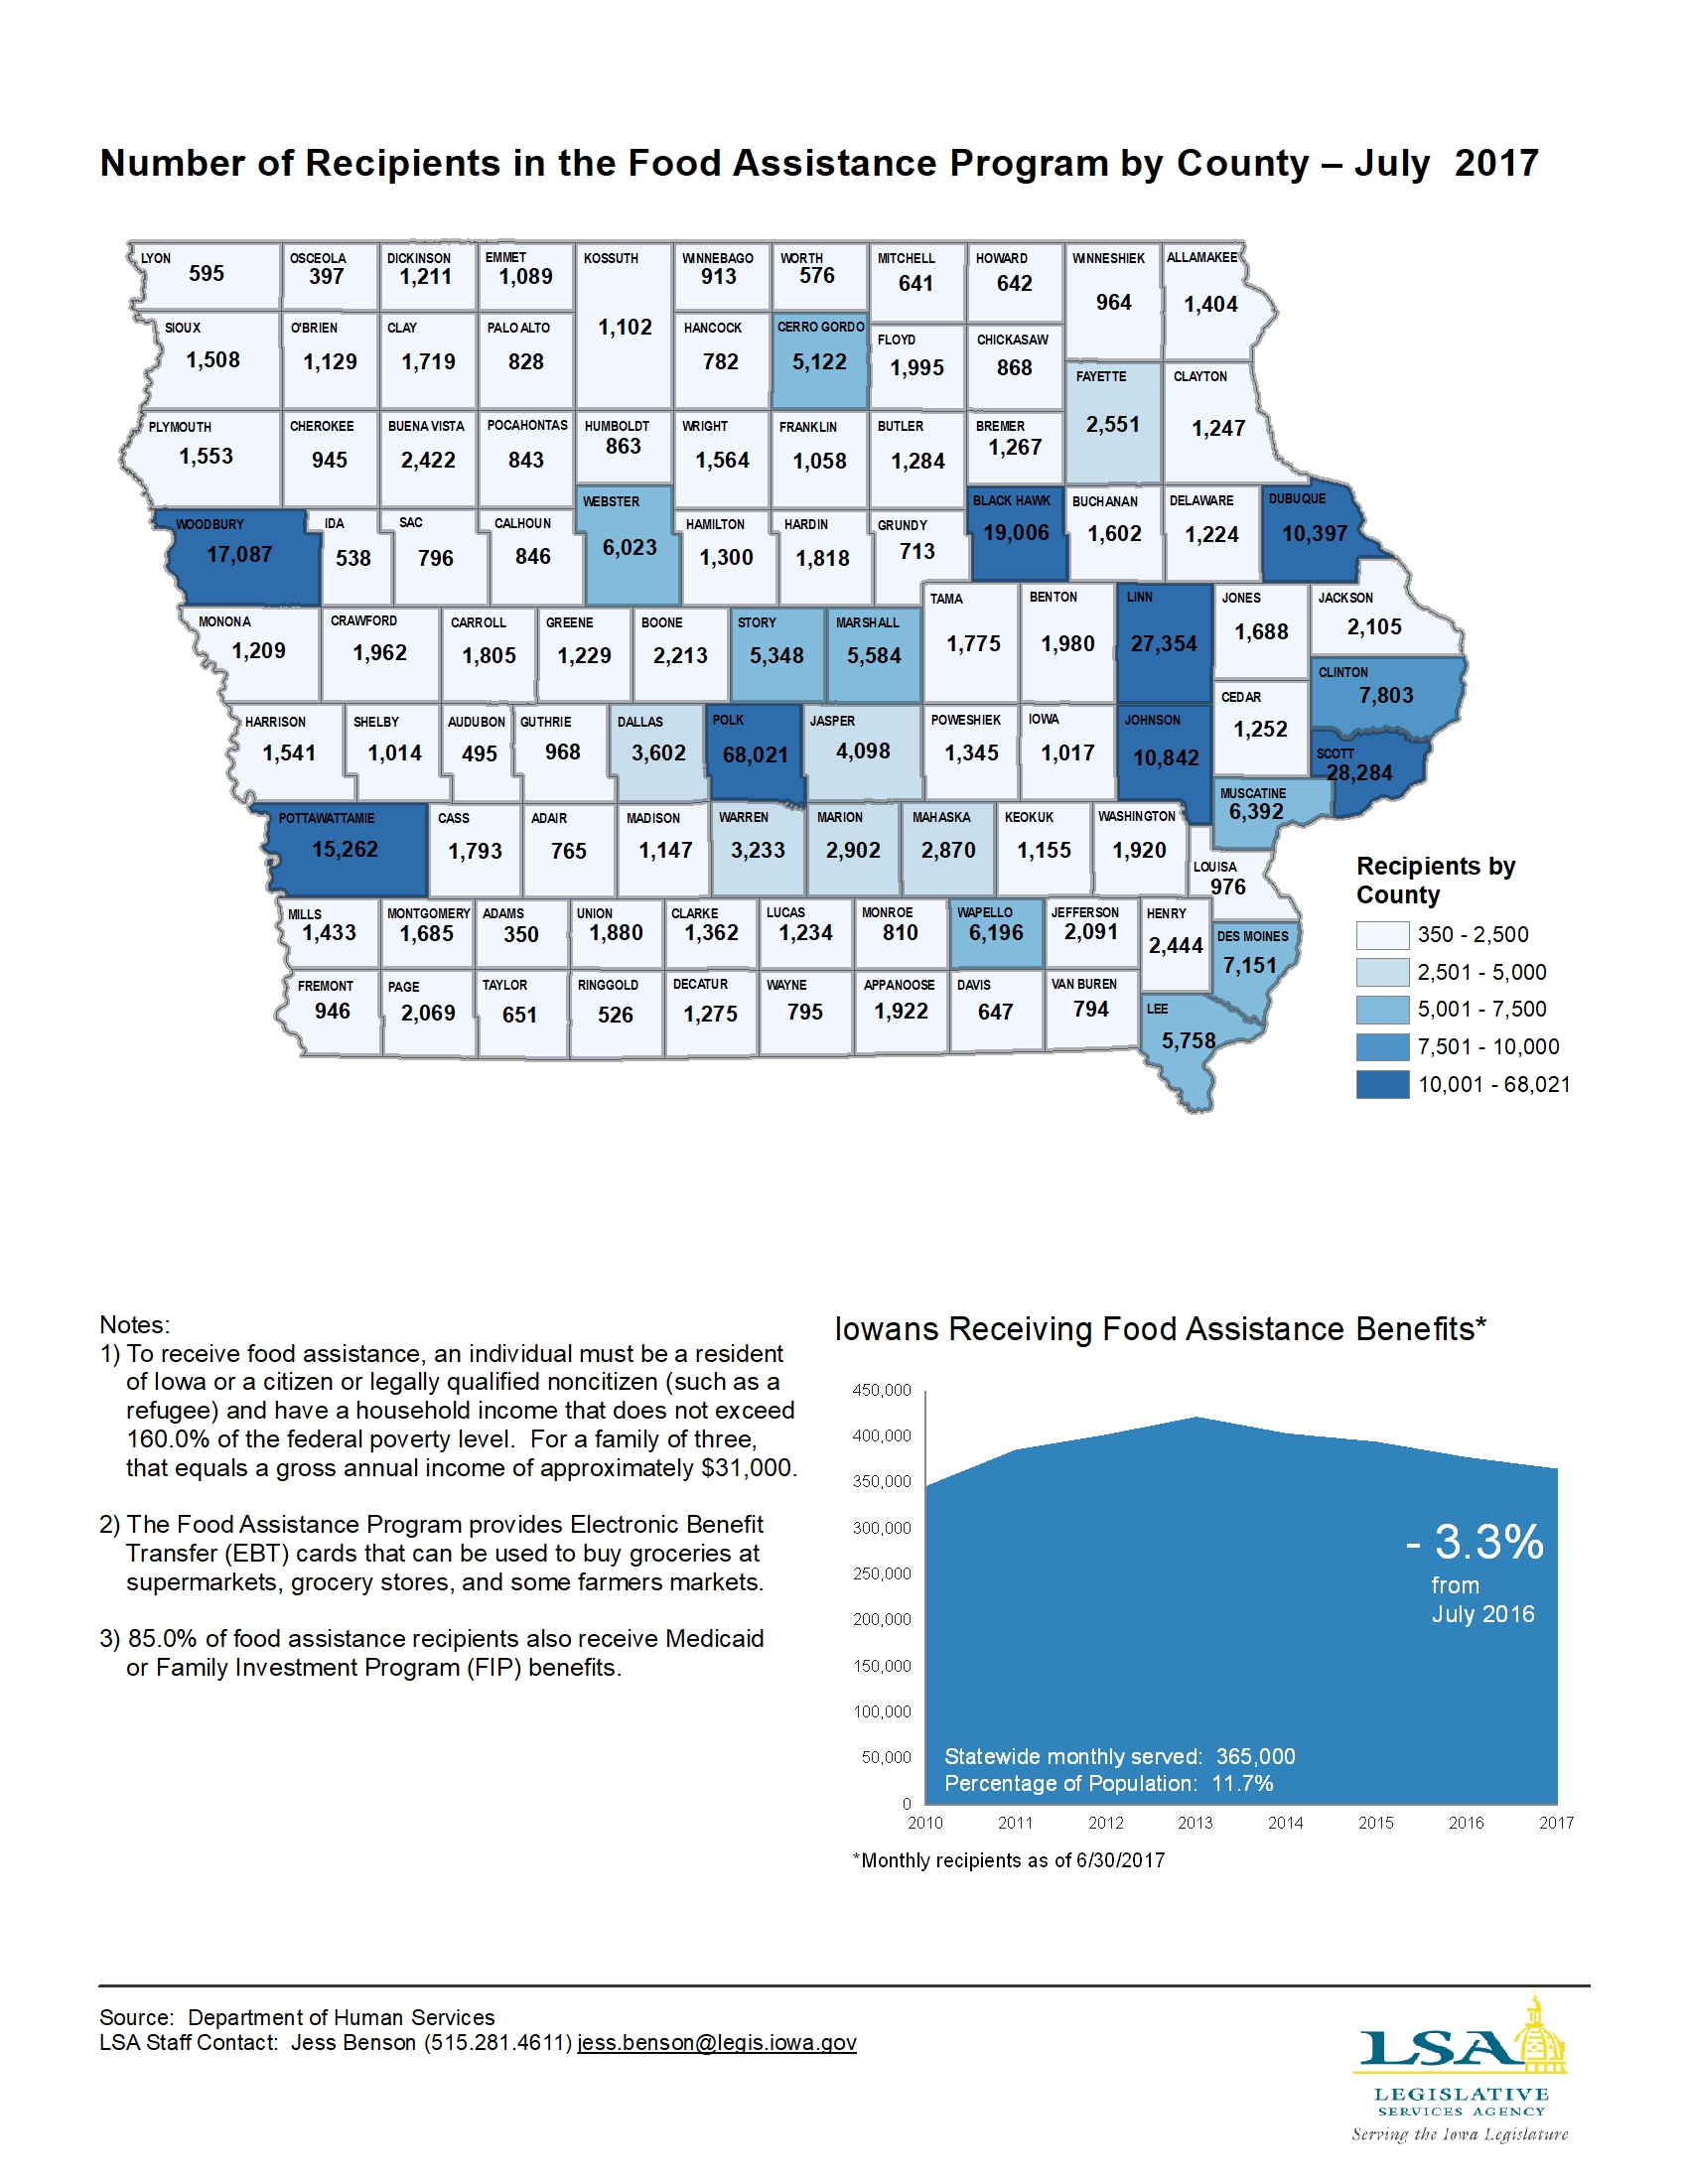
Number of Recipients in the Food Assistance Program — July 2017
|
|
|
|
|
| 04/02/2018 |
Iowa Insights |
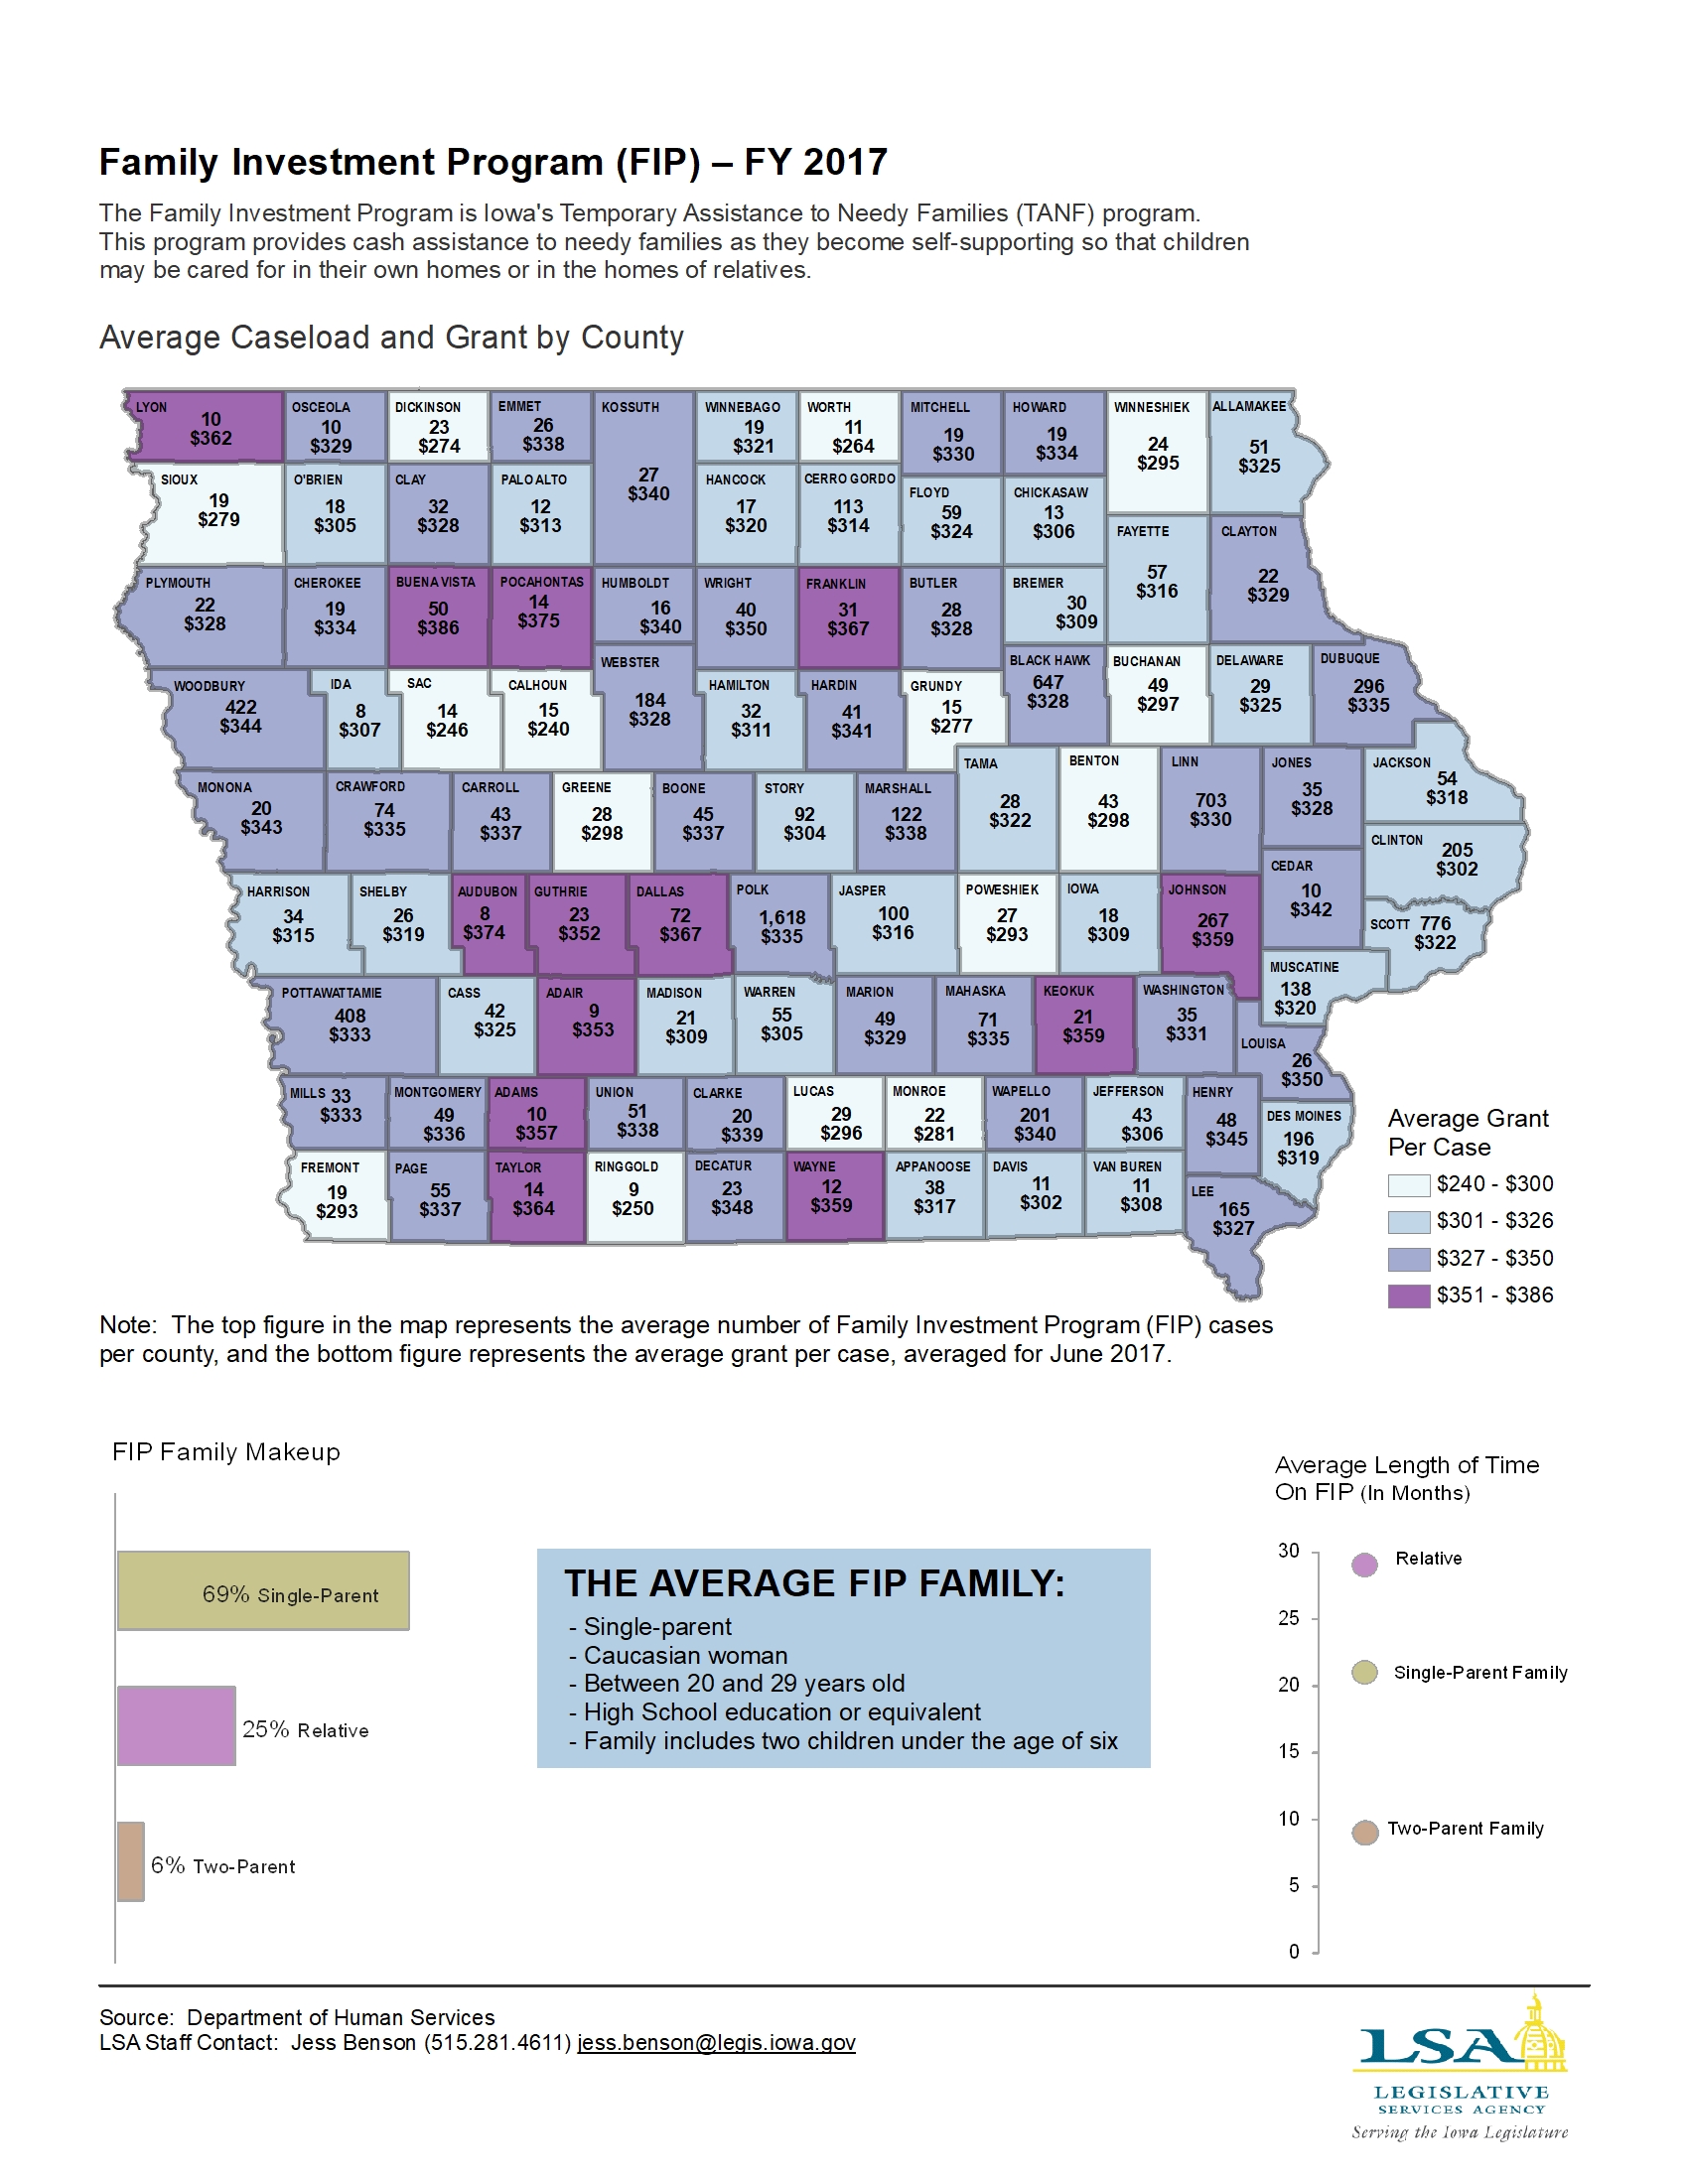
Family Investment Program (FIP) — FY 2017
|
|
|
|
|
| 03/26/2018 |
Iowa Insights |
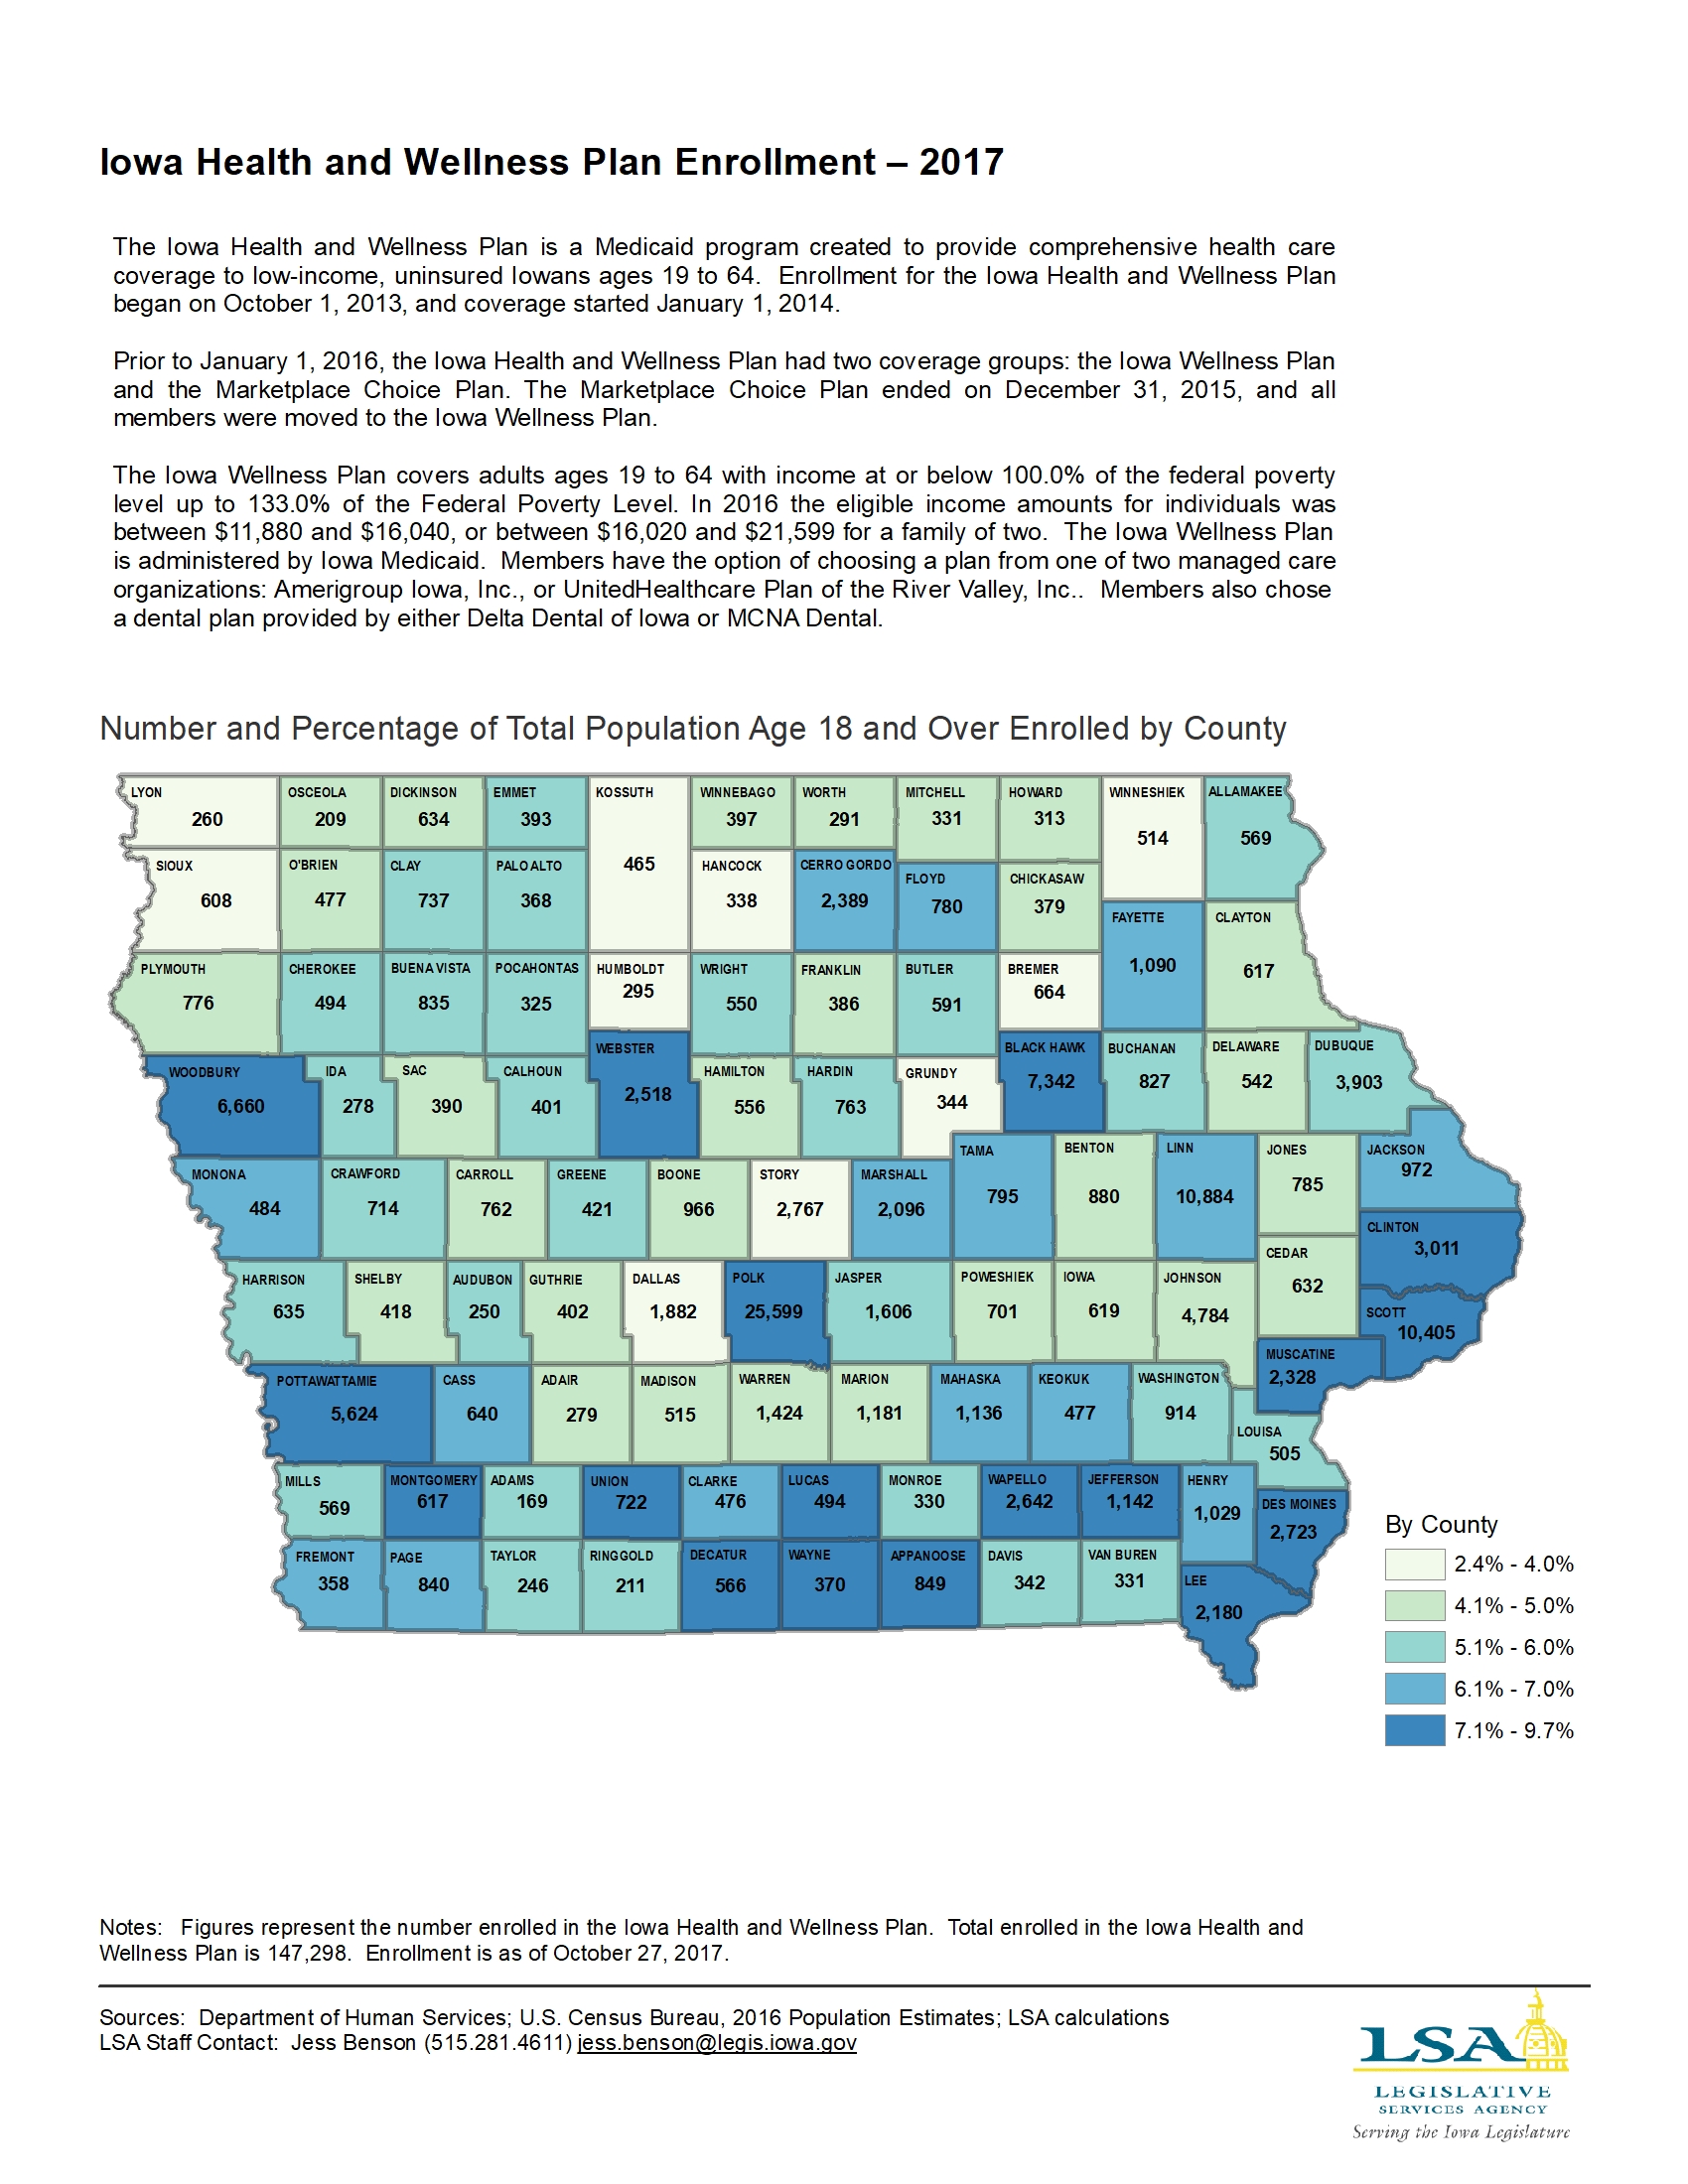
Iowa Health and Wellness Plan Enrollment — 2017
|
|
|
|
|
| 03/19/2018 |
Iowa Insights |
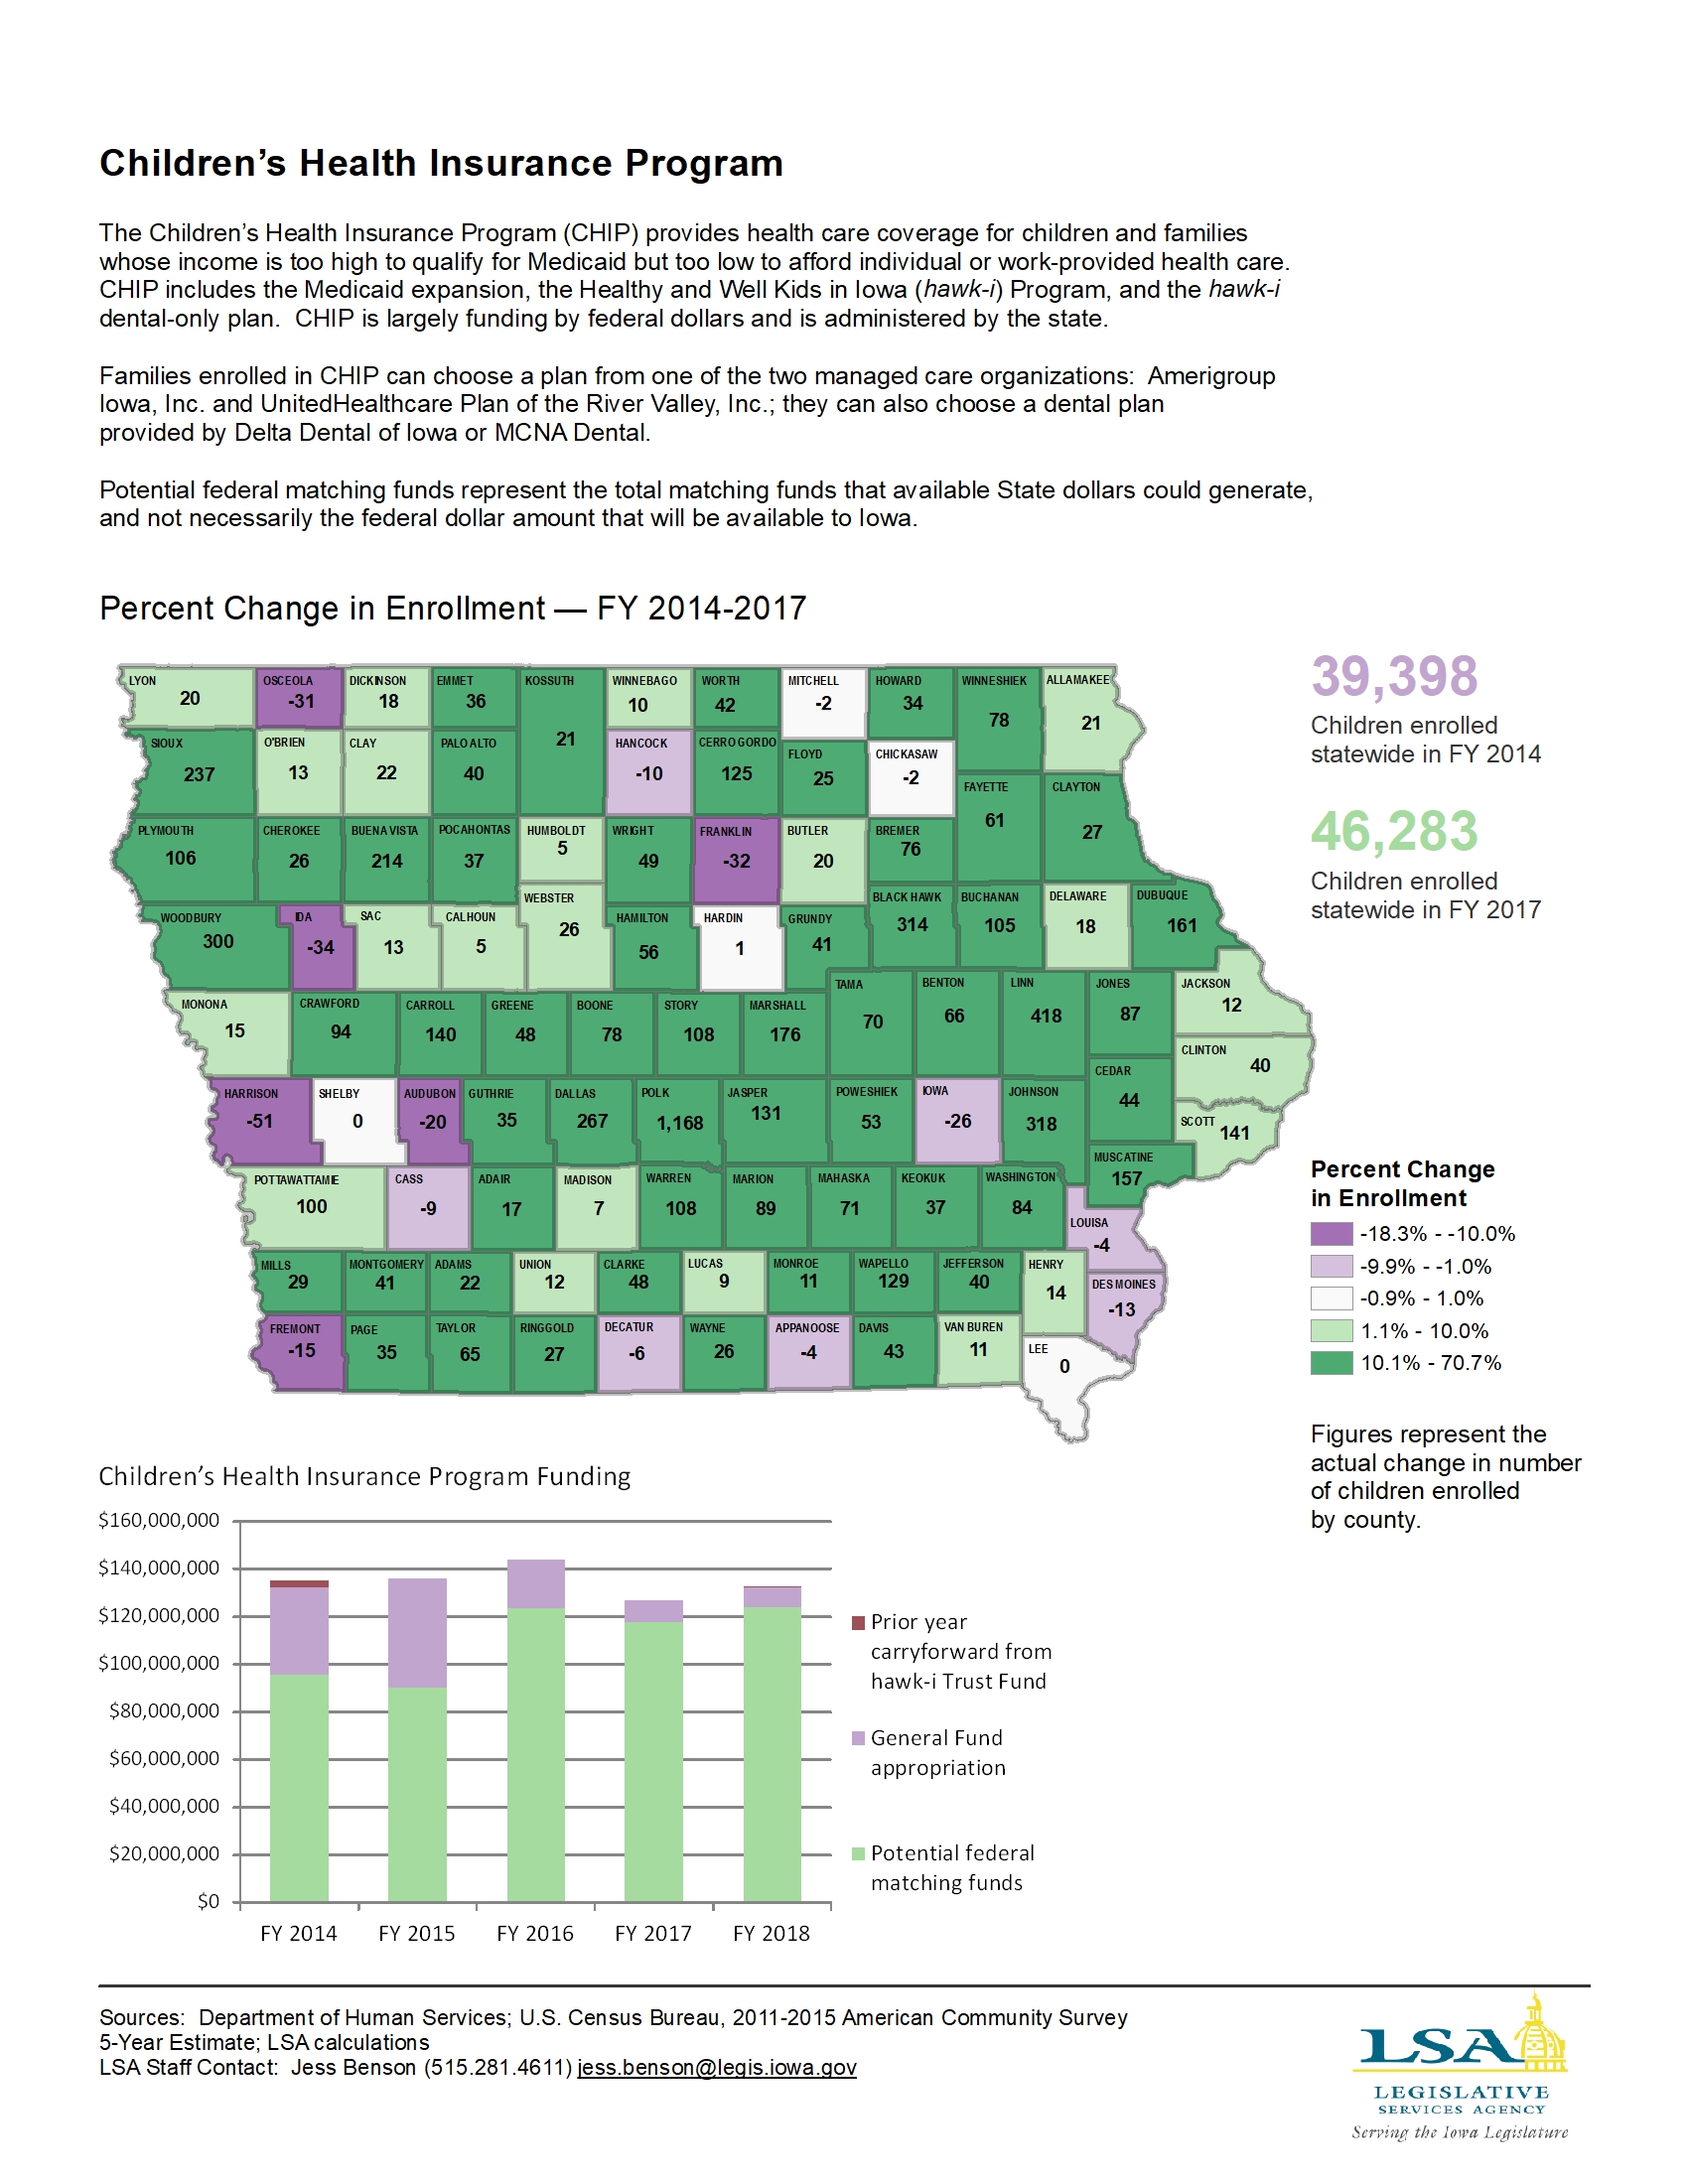
Children's Health Insurance Program - Change in Enrollment and Funding — FY 2014-2017
|
|
|
|
|
| 03/12/2018 |
Iowa Insights |
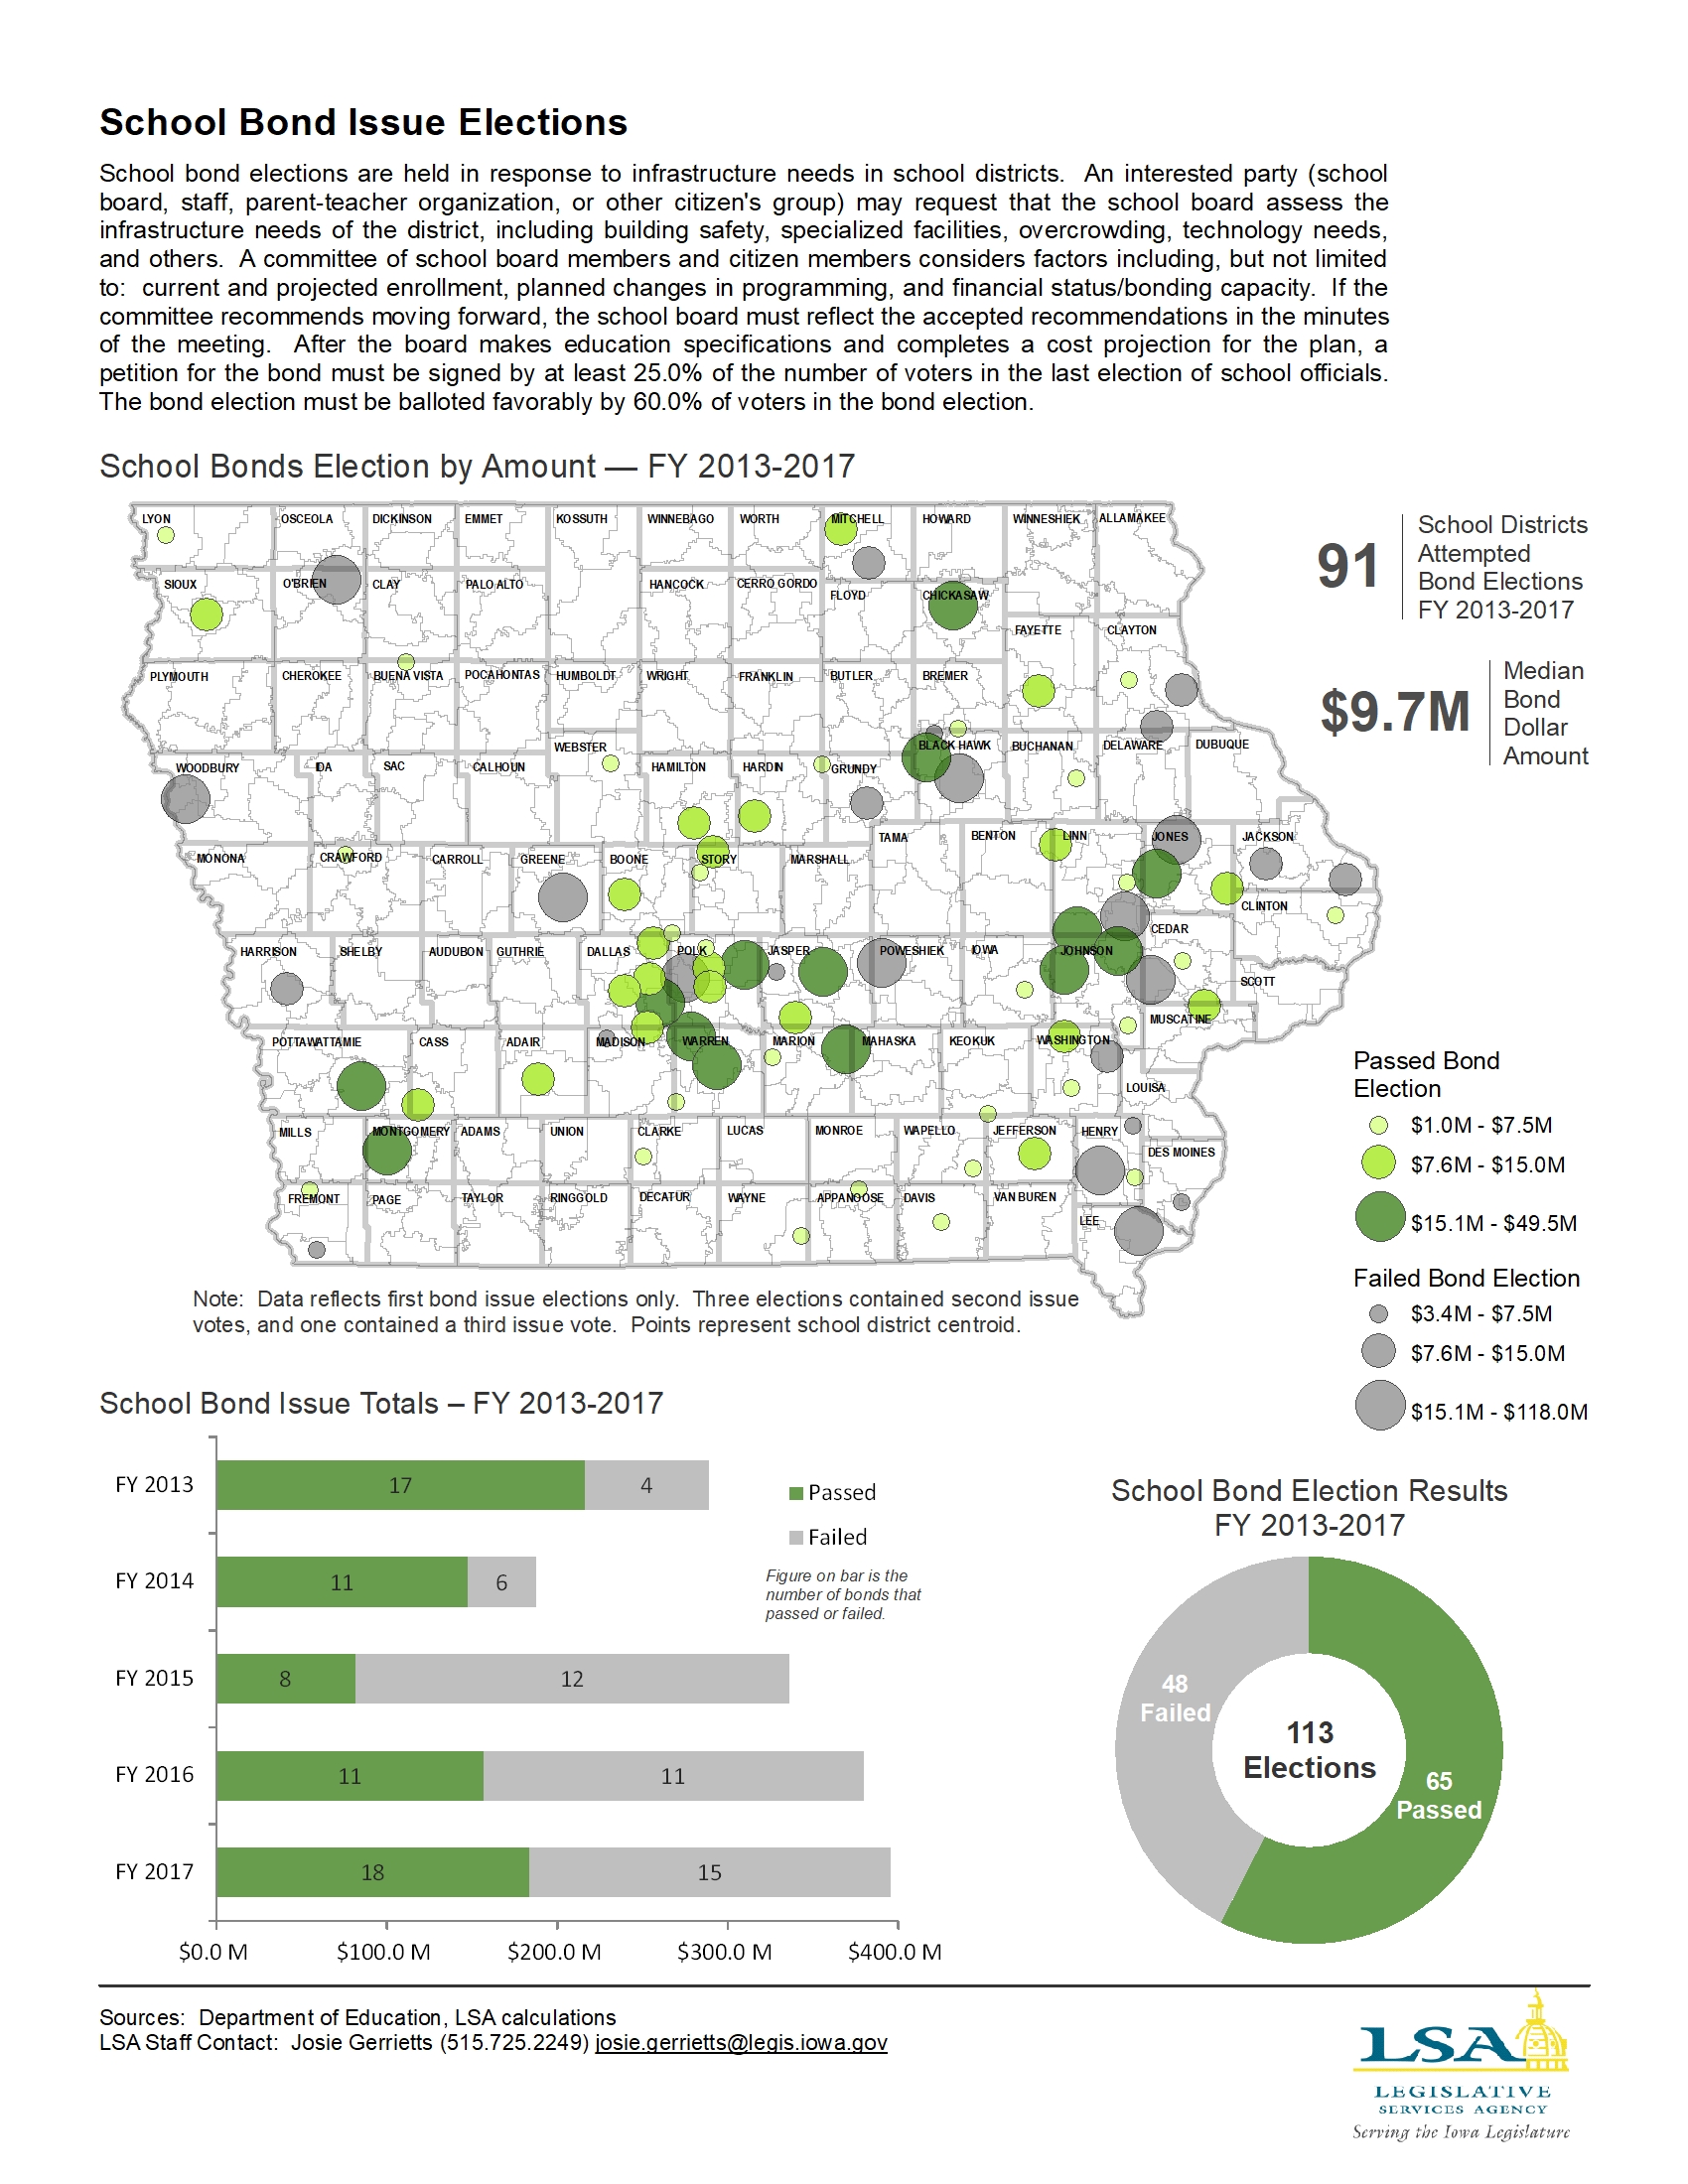
School Bond Issue Elections — FY 2013-2017
|
|
|
|
|
| 03/05/2018 |
Iowa Insights |
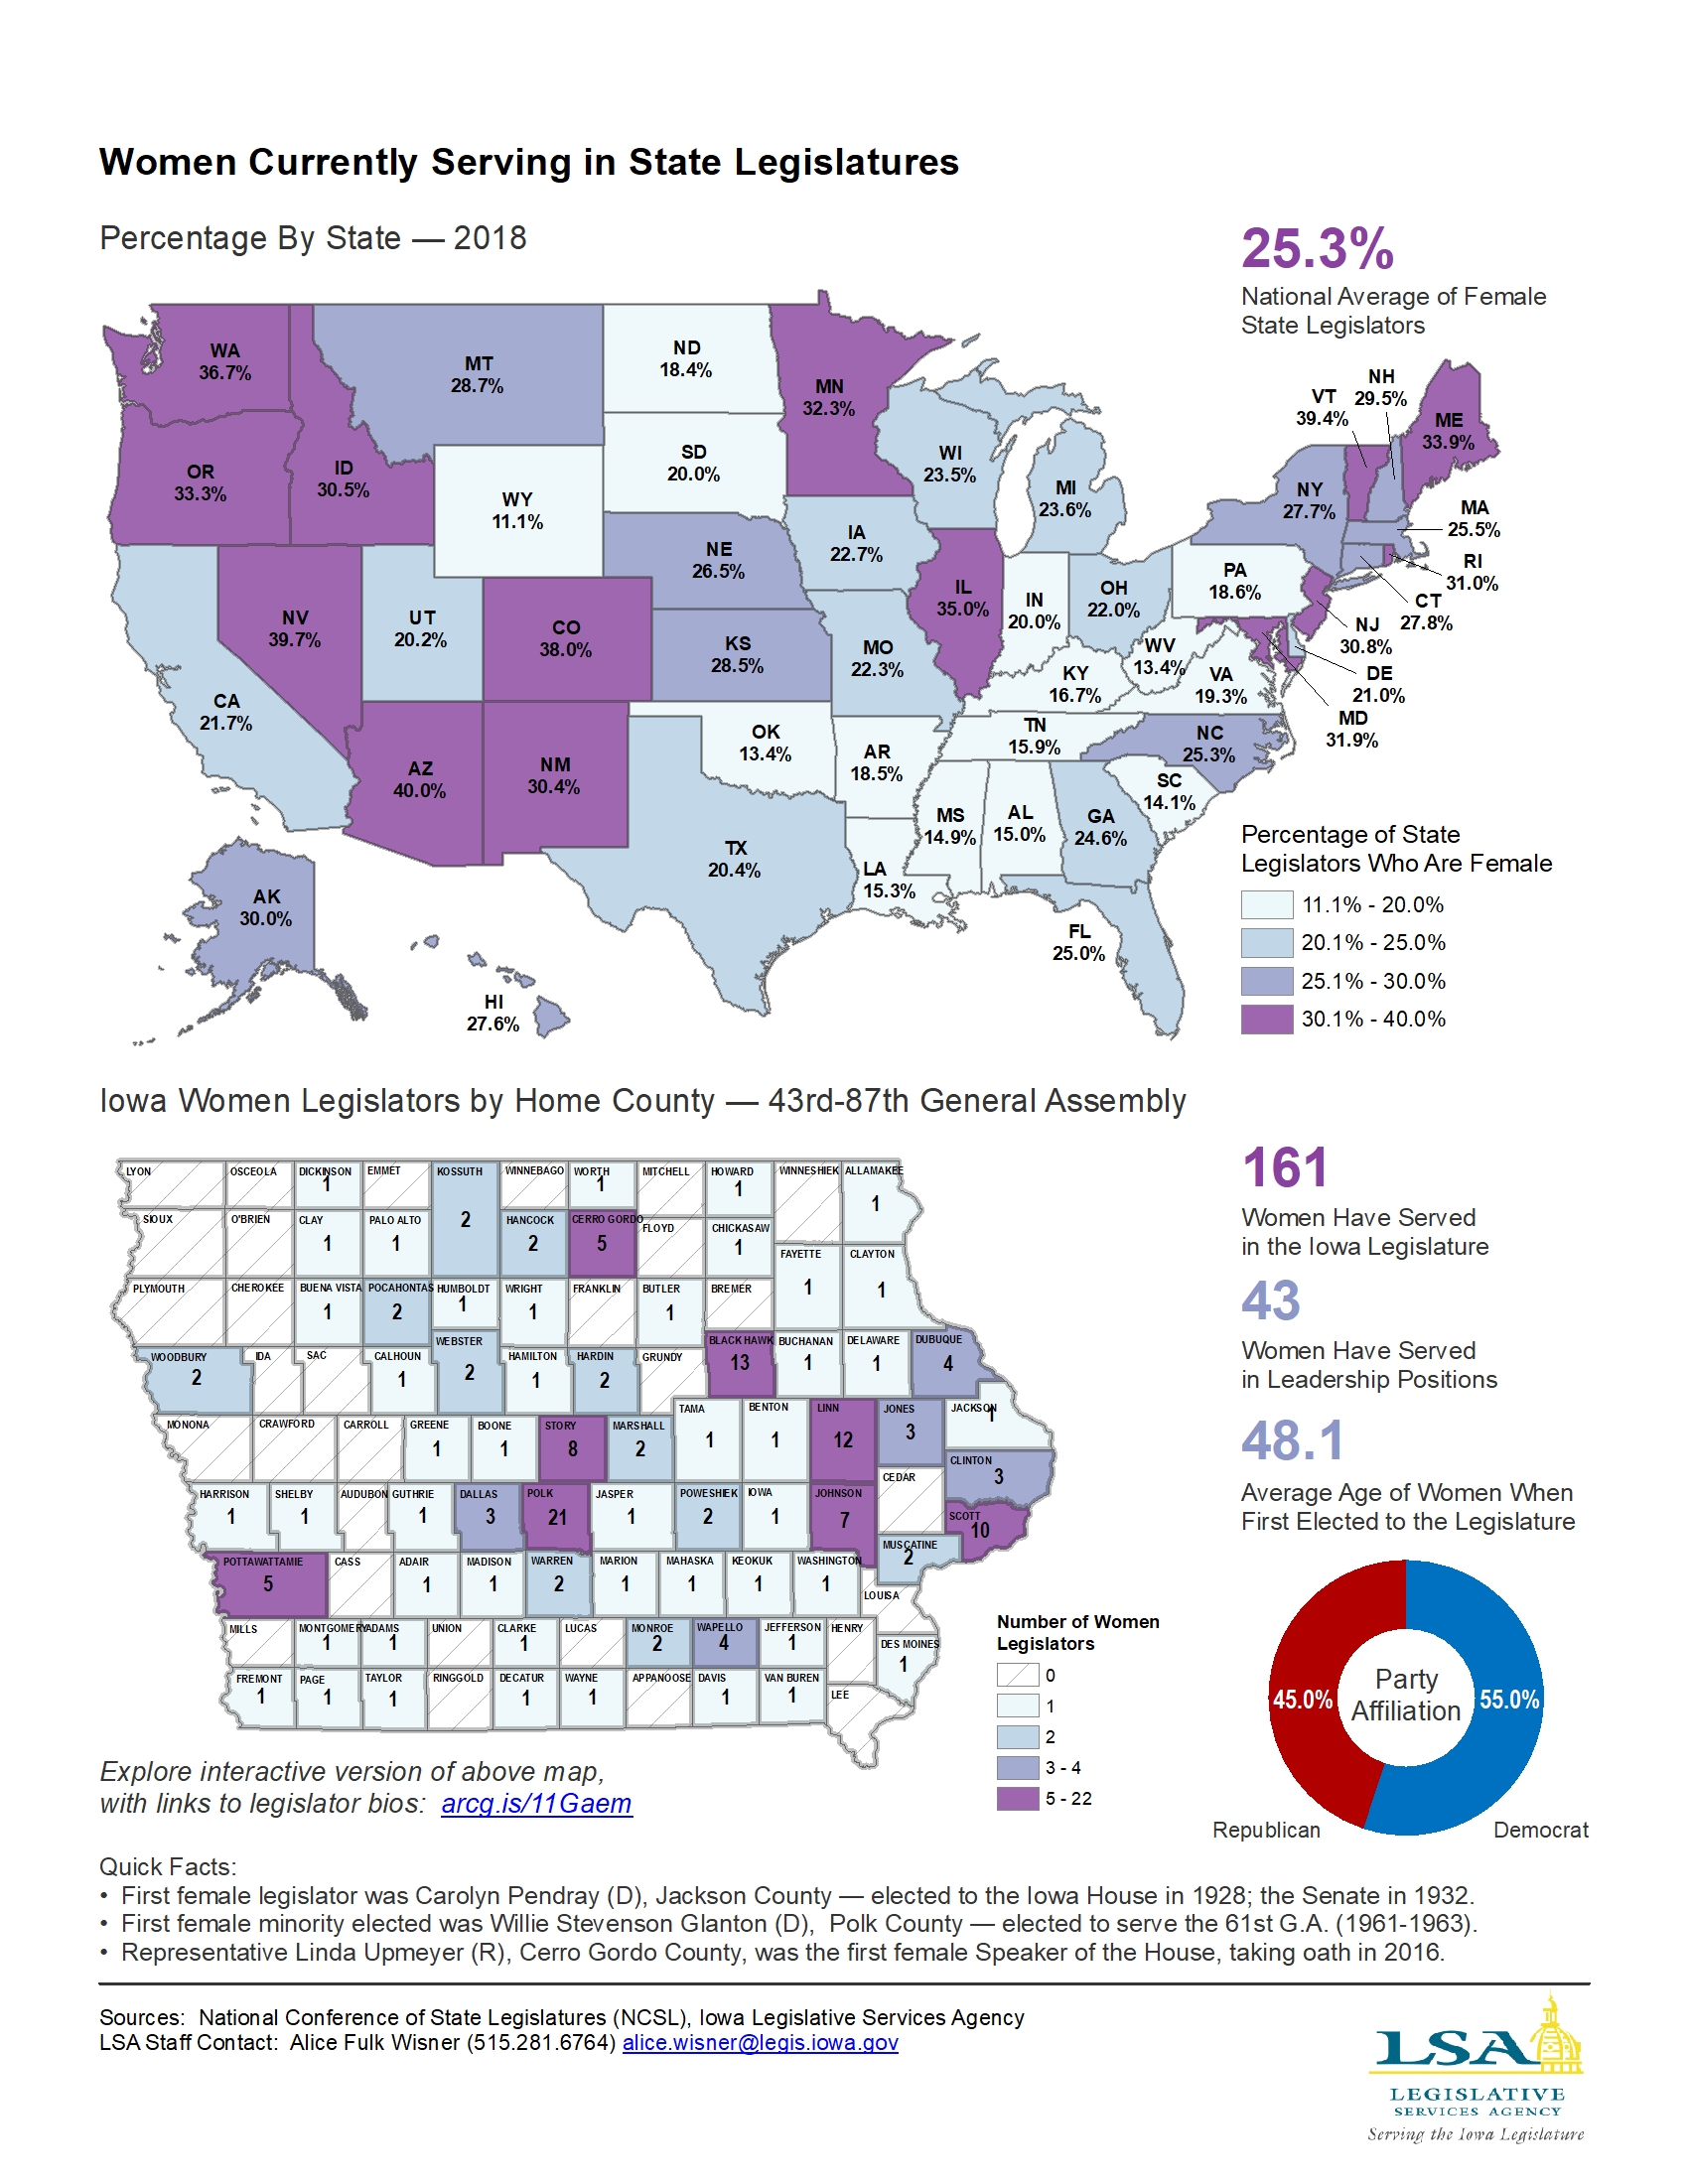
Women in State Legislatures — 2018 and Historical Women Legislators in Iowa
|
|
|
|
|
| 02/26/2018 |
Iowa Insights |
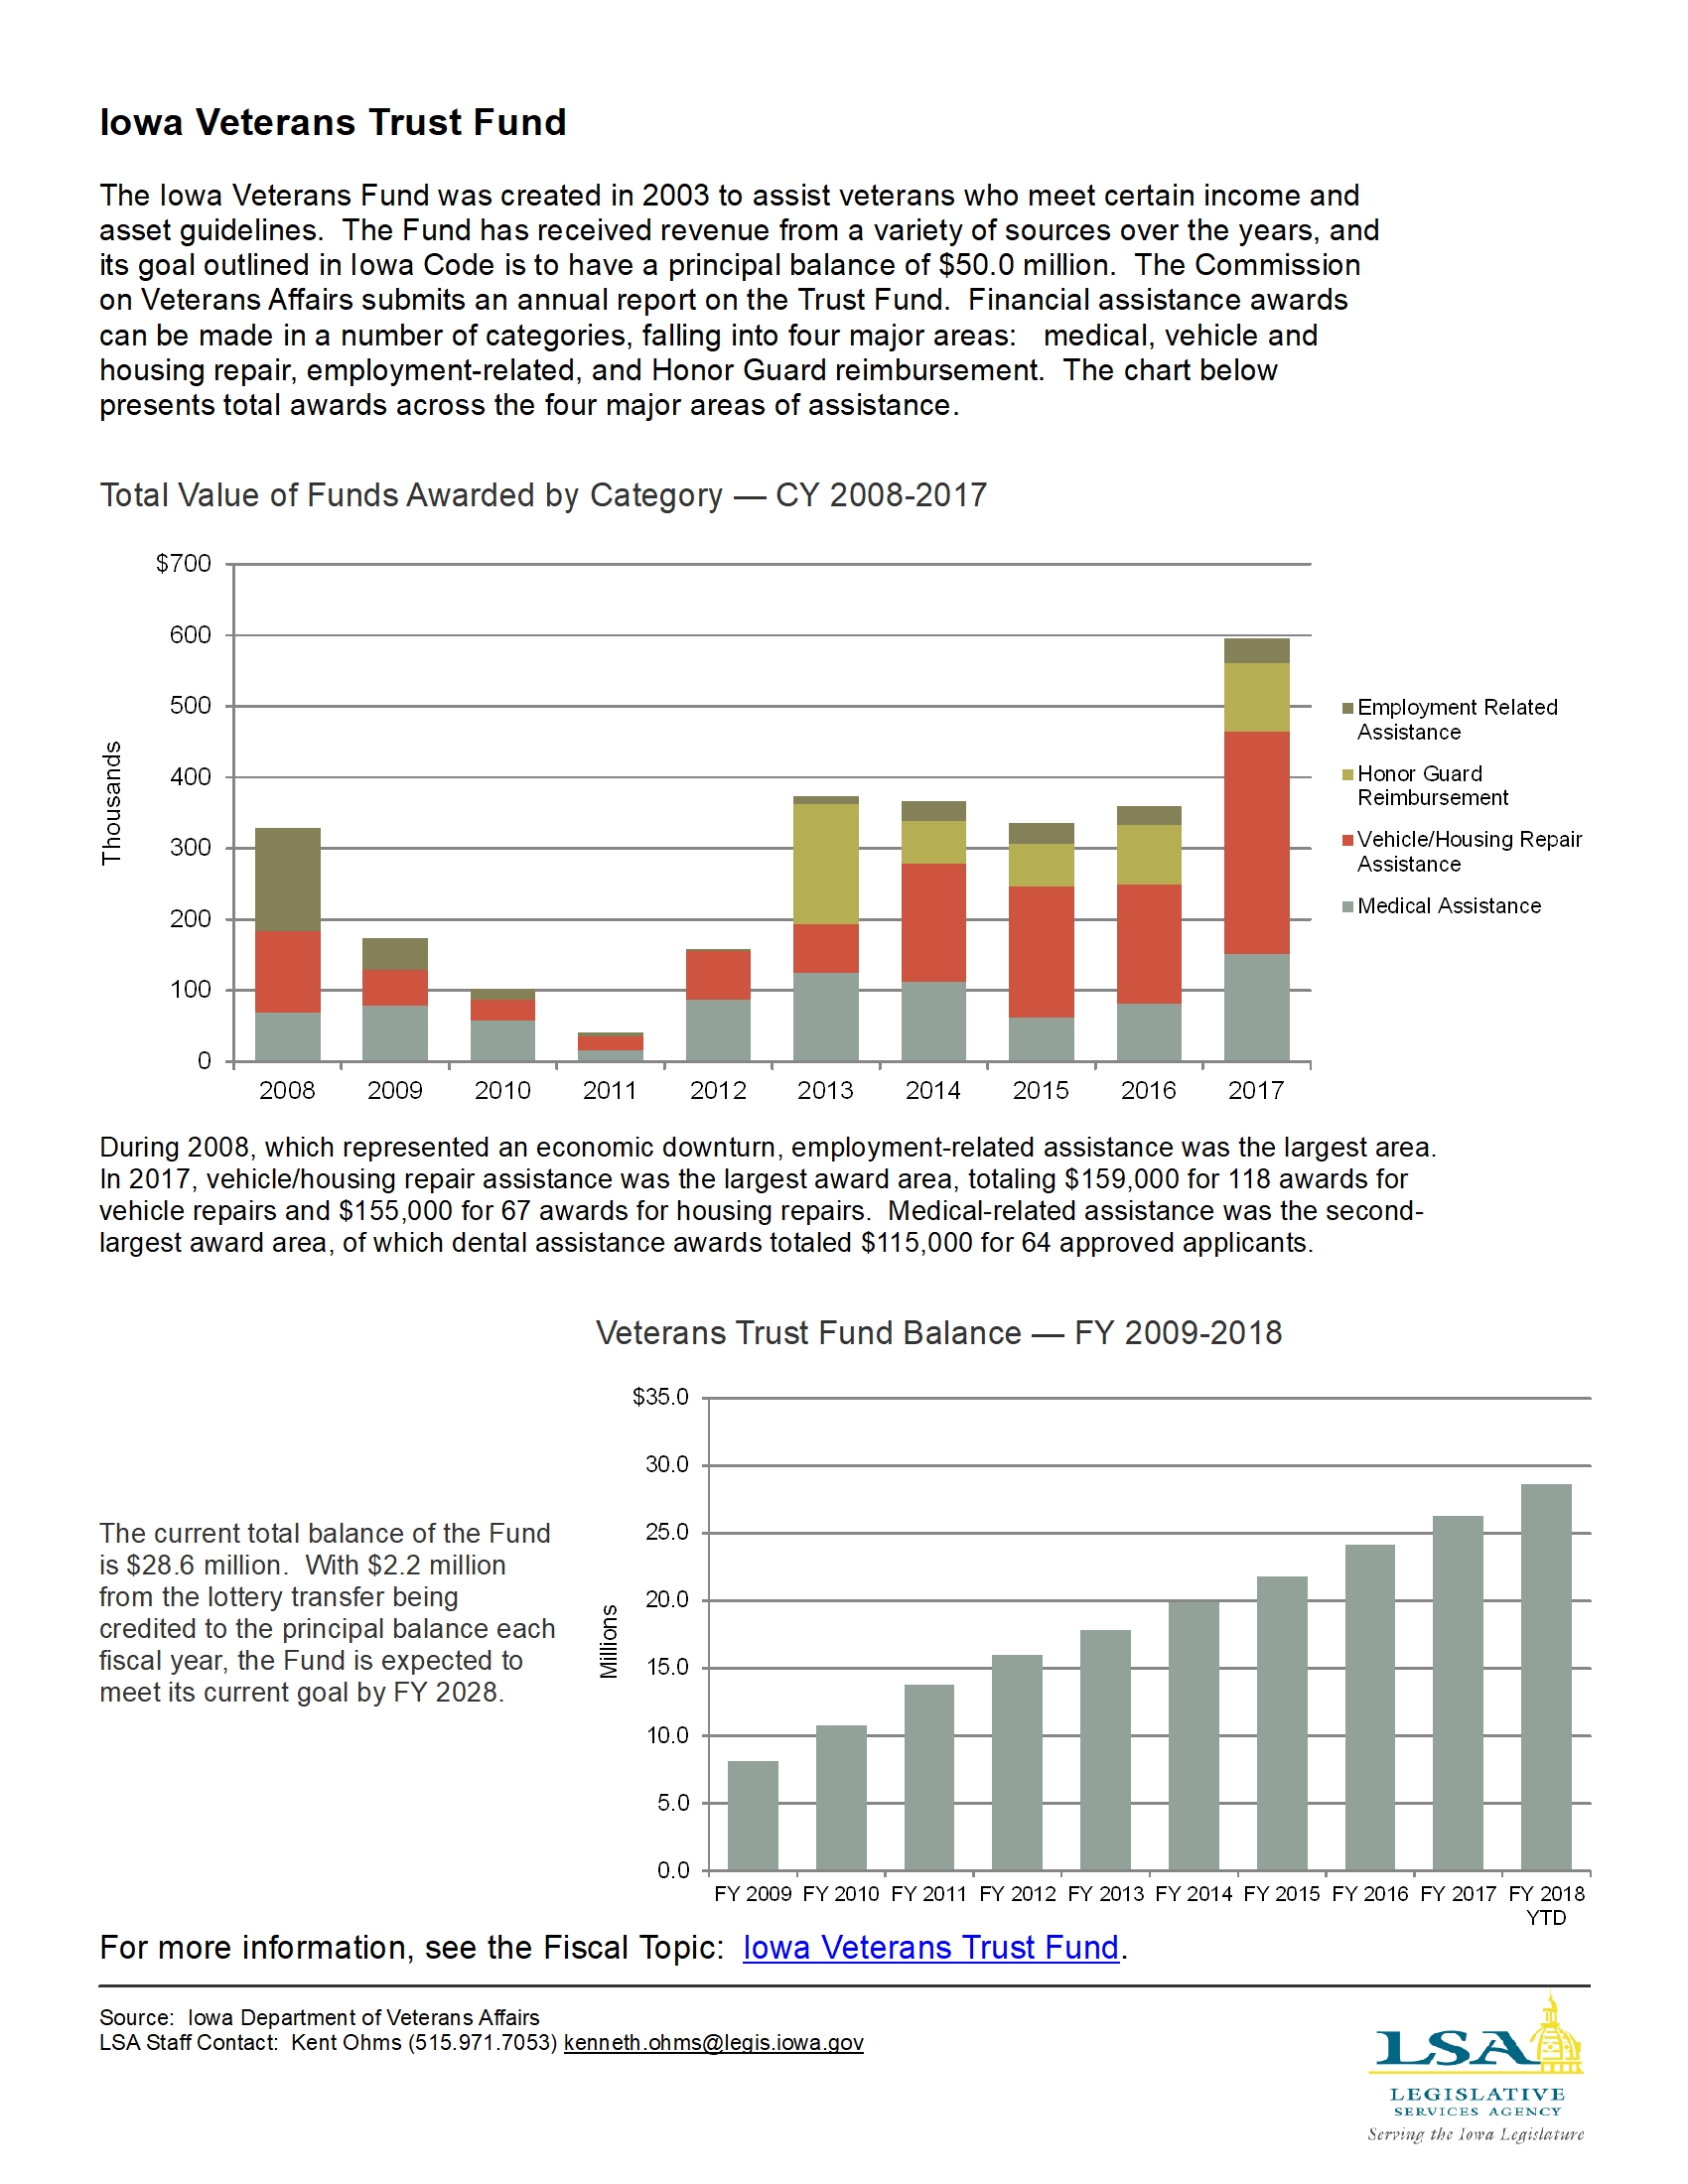
Iowa Veterans Trust Fund
|
|
|
|
|
| 02/19/2018 |
Iowa Insights |
Iowa Veteran Population — FFY 2016

|
|
|
|
|
| 02/12/2018 |
Iowa Insights |
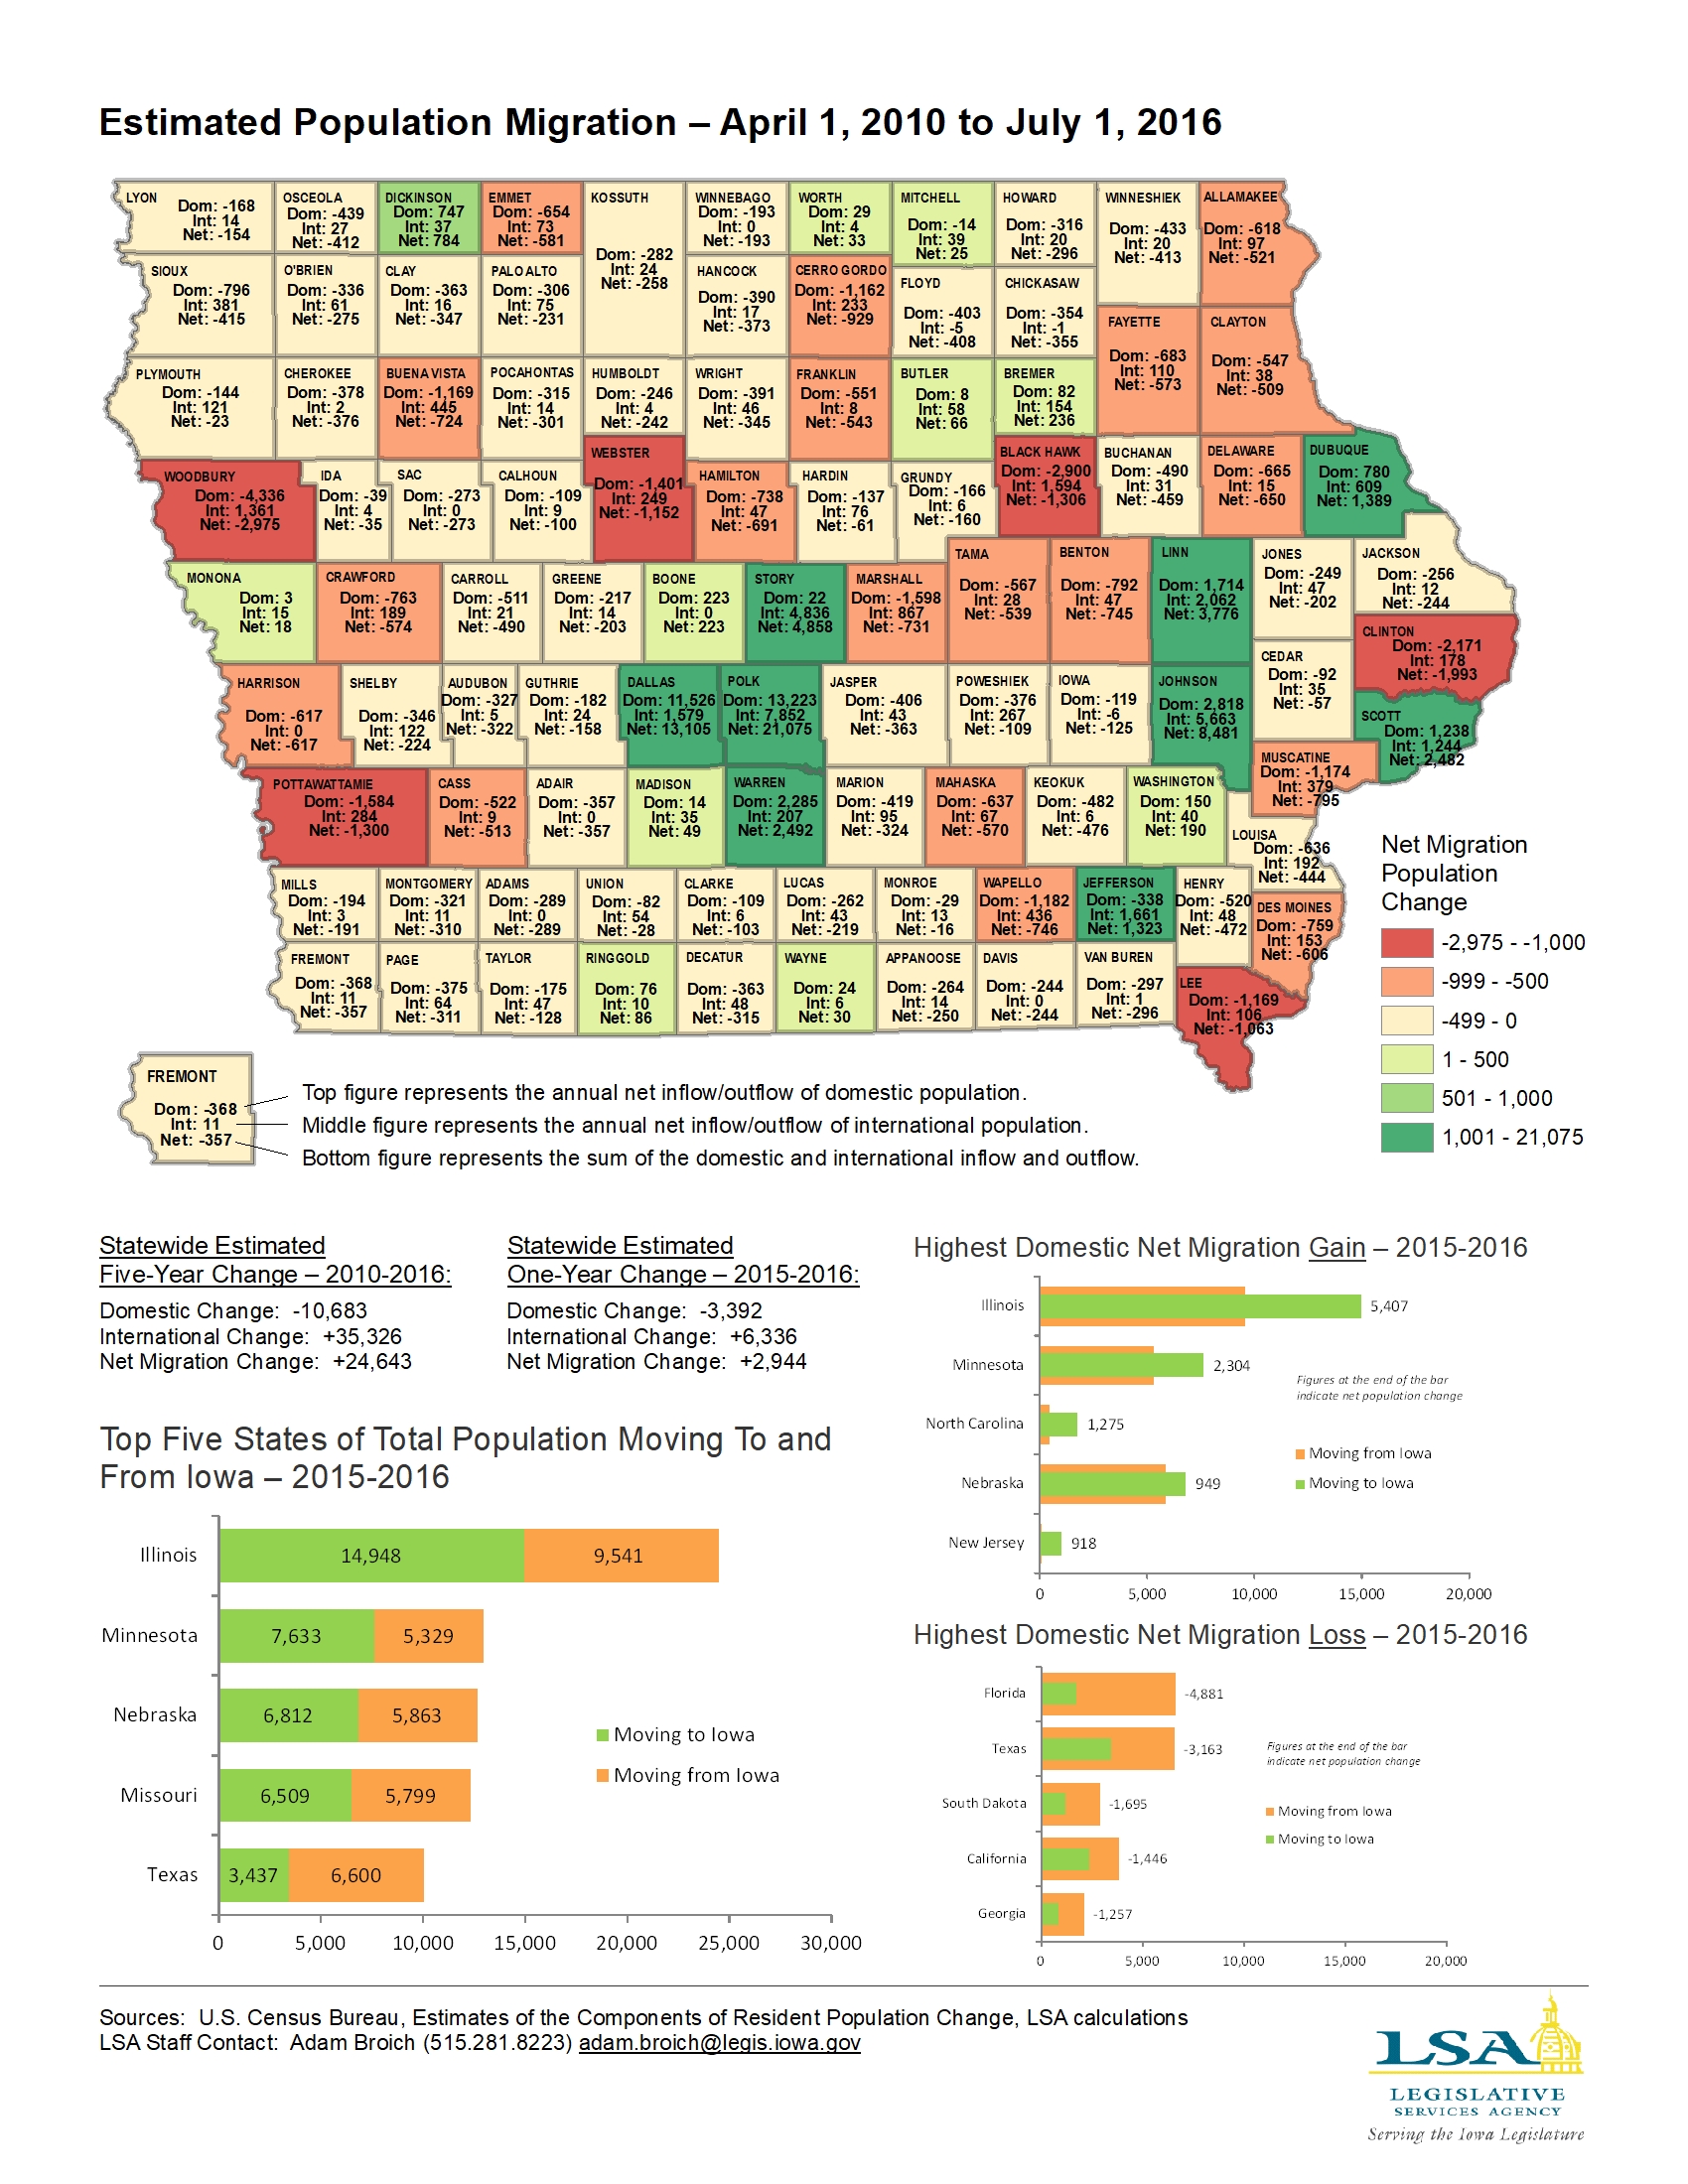
Estimated Population Migration — April 1, 2010 to July 1, 2016
|
|
|
|
|
| 02/05/2018 |
Iowa Insights |
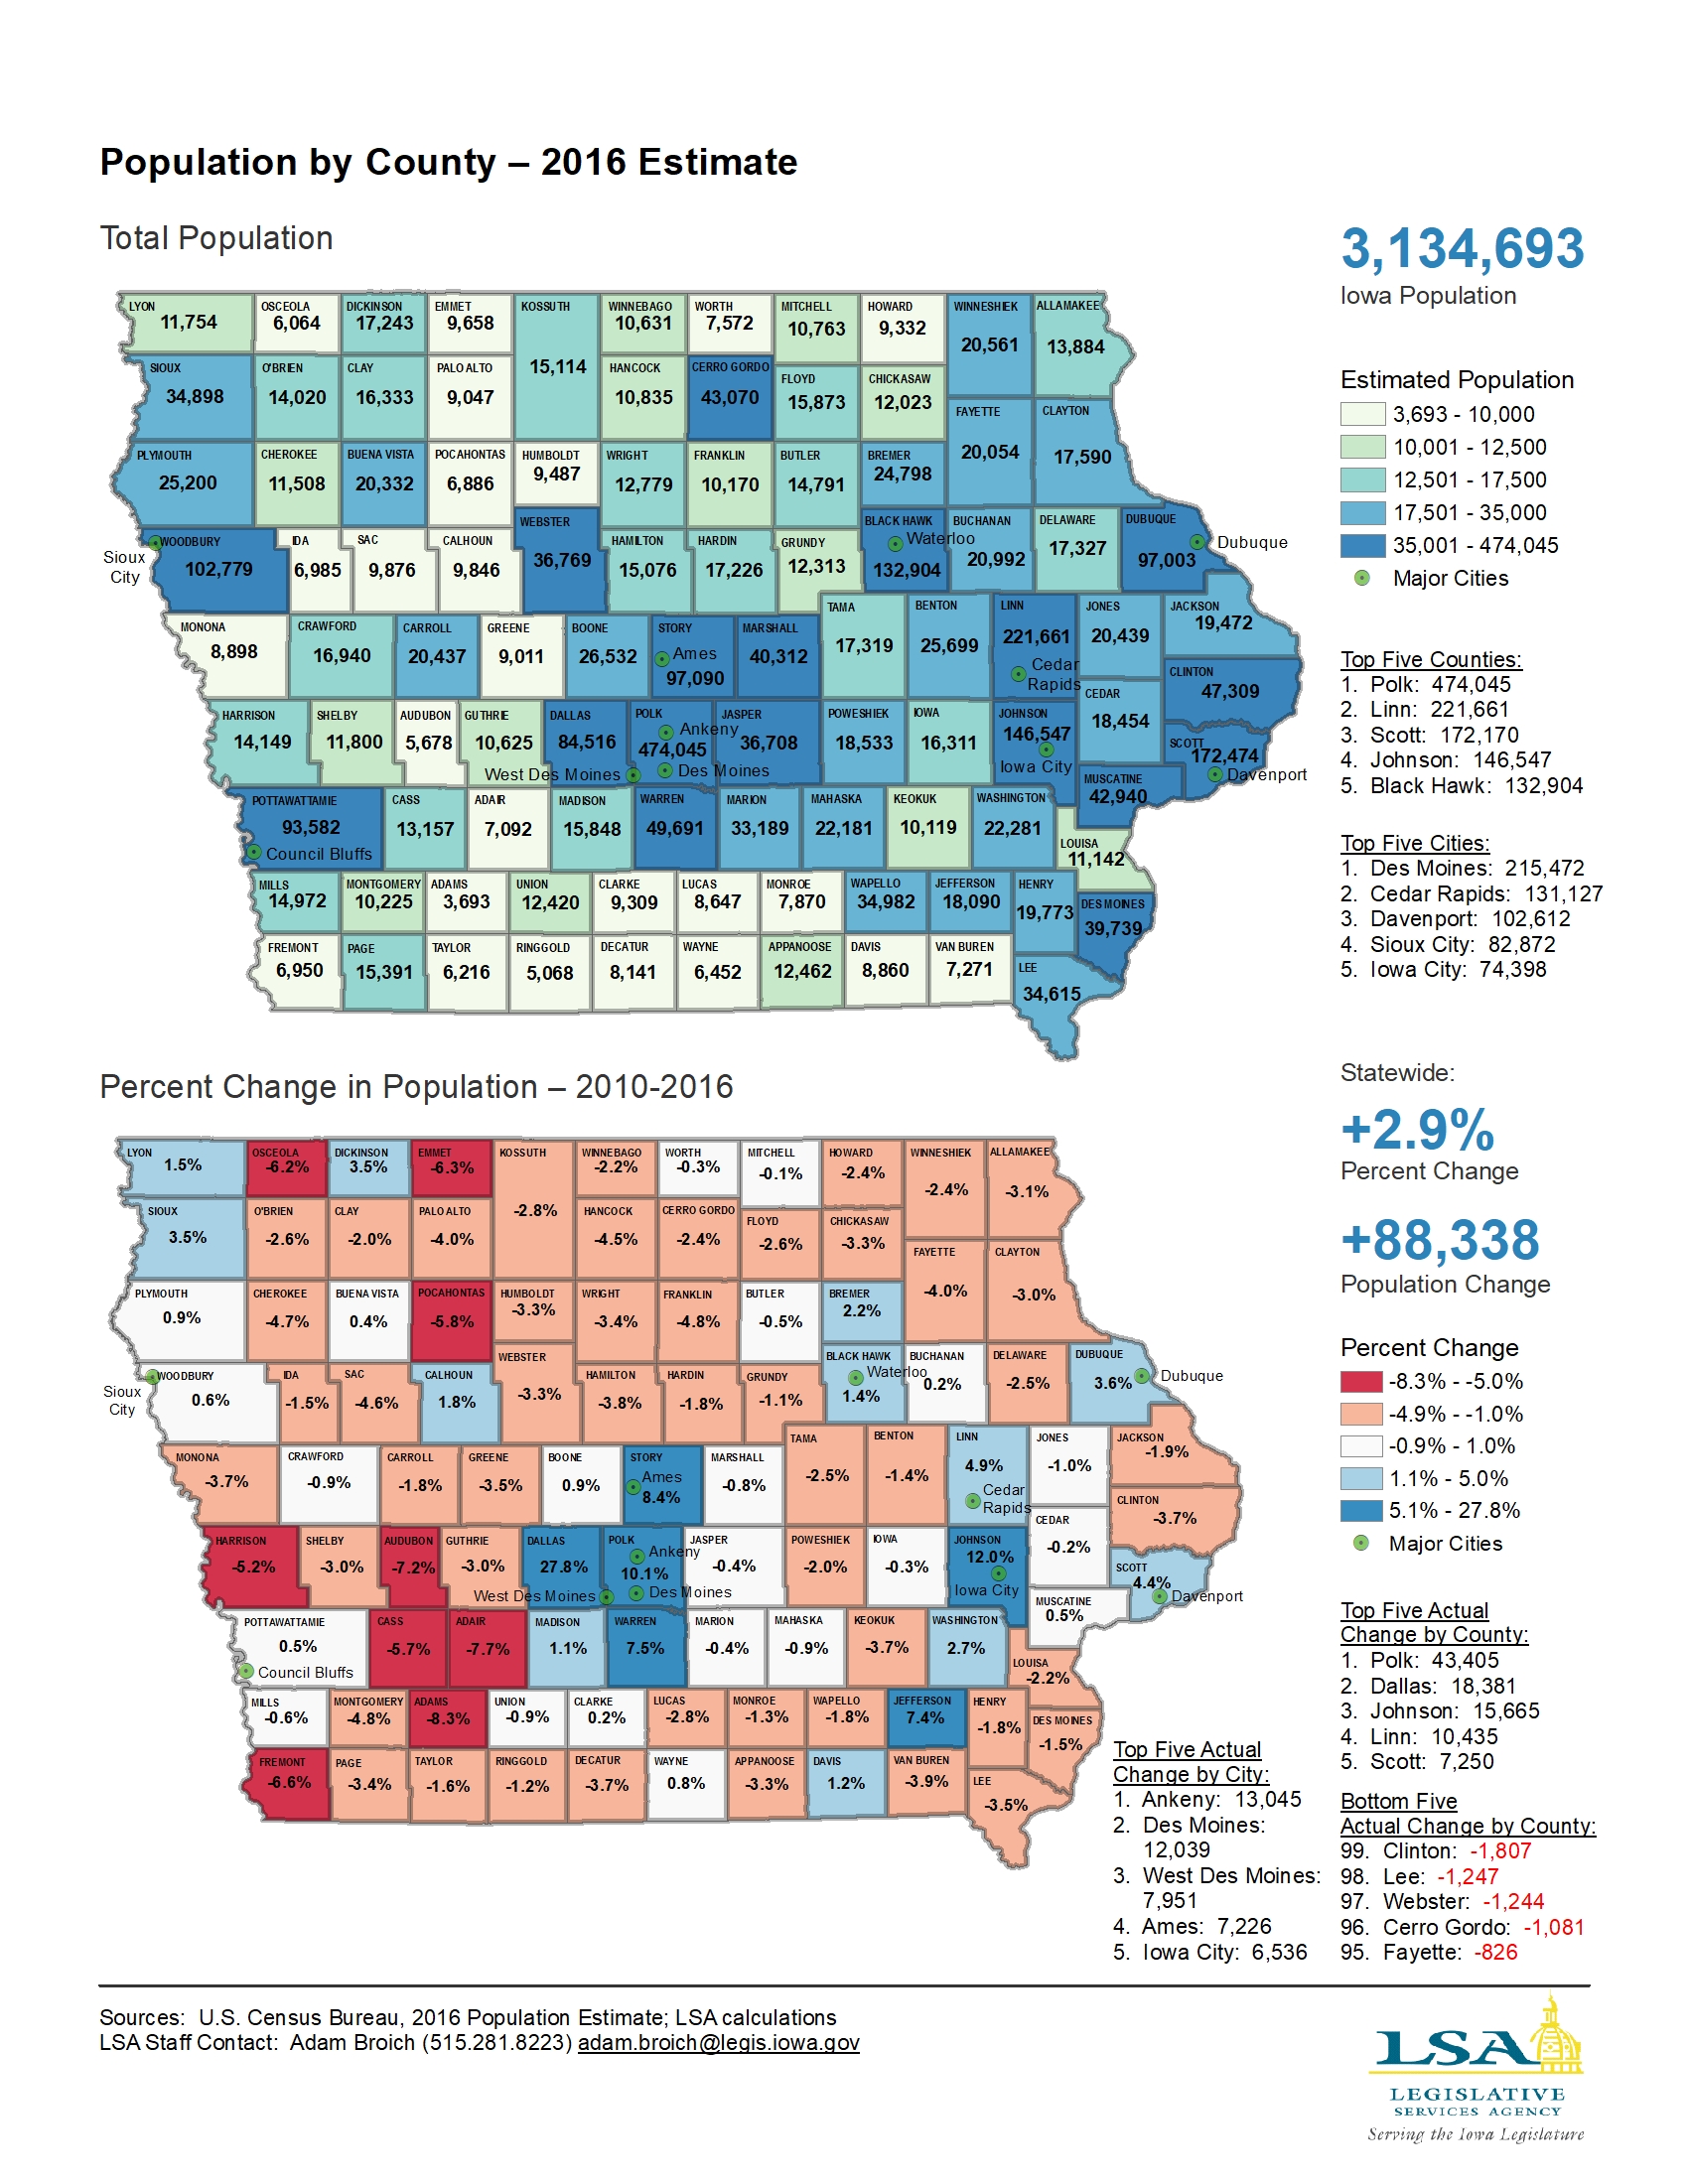
Population by County and Population Change — 2010-2016
|
|
|
|
|
| 01/29/2018 |
Iowa Insights |
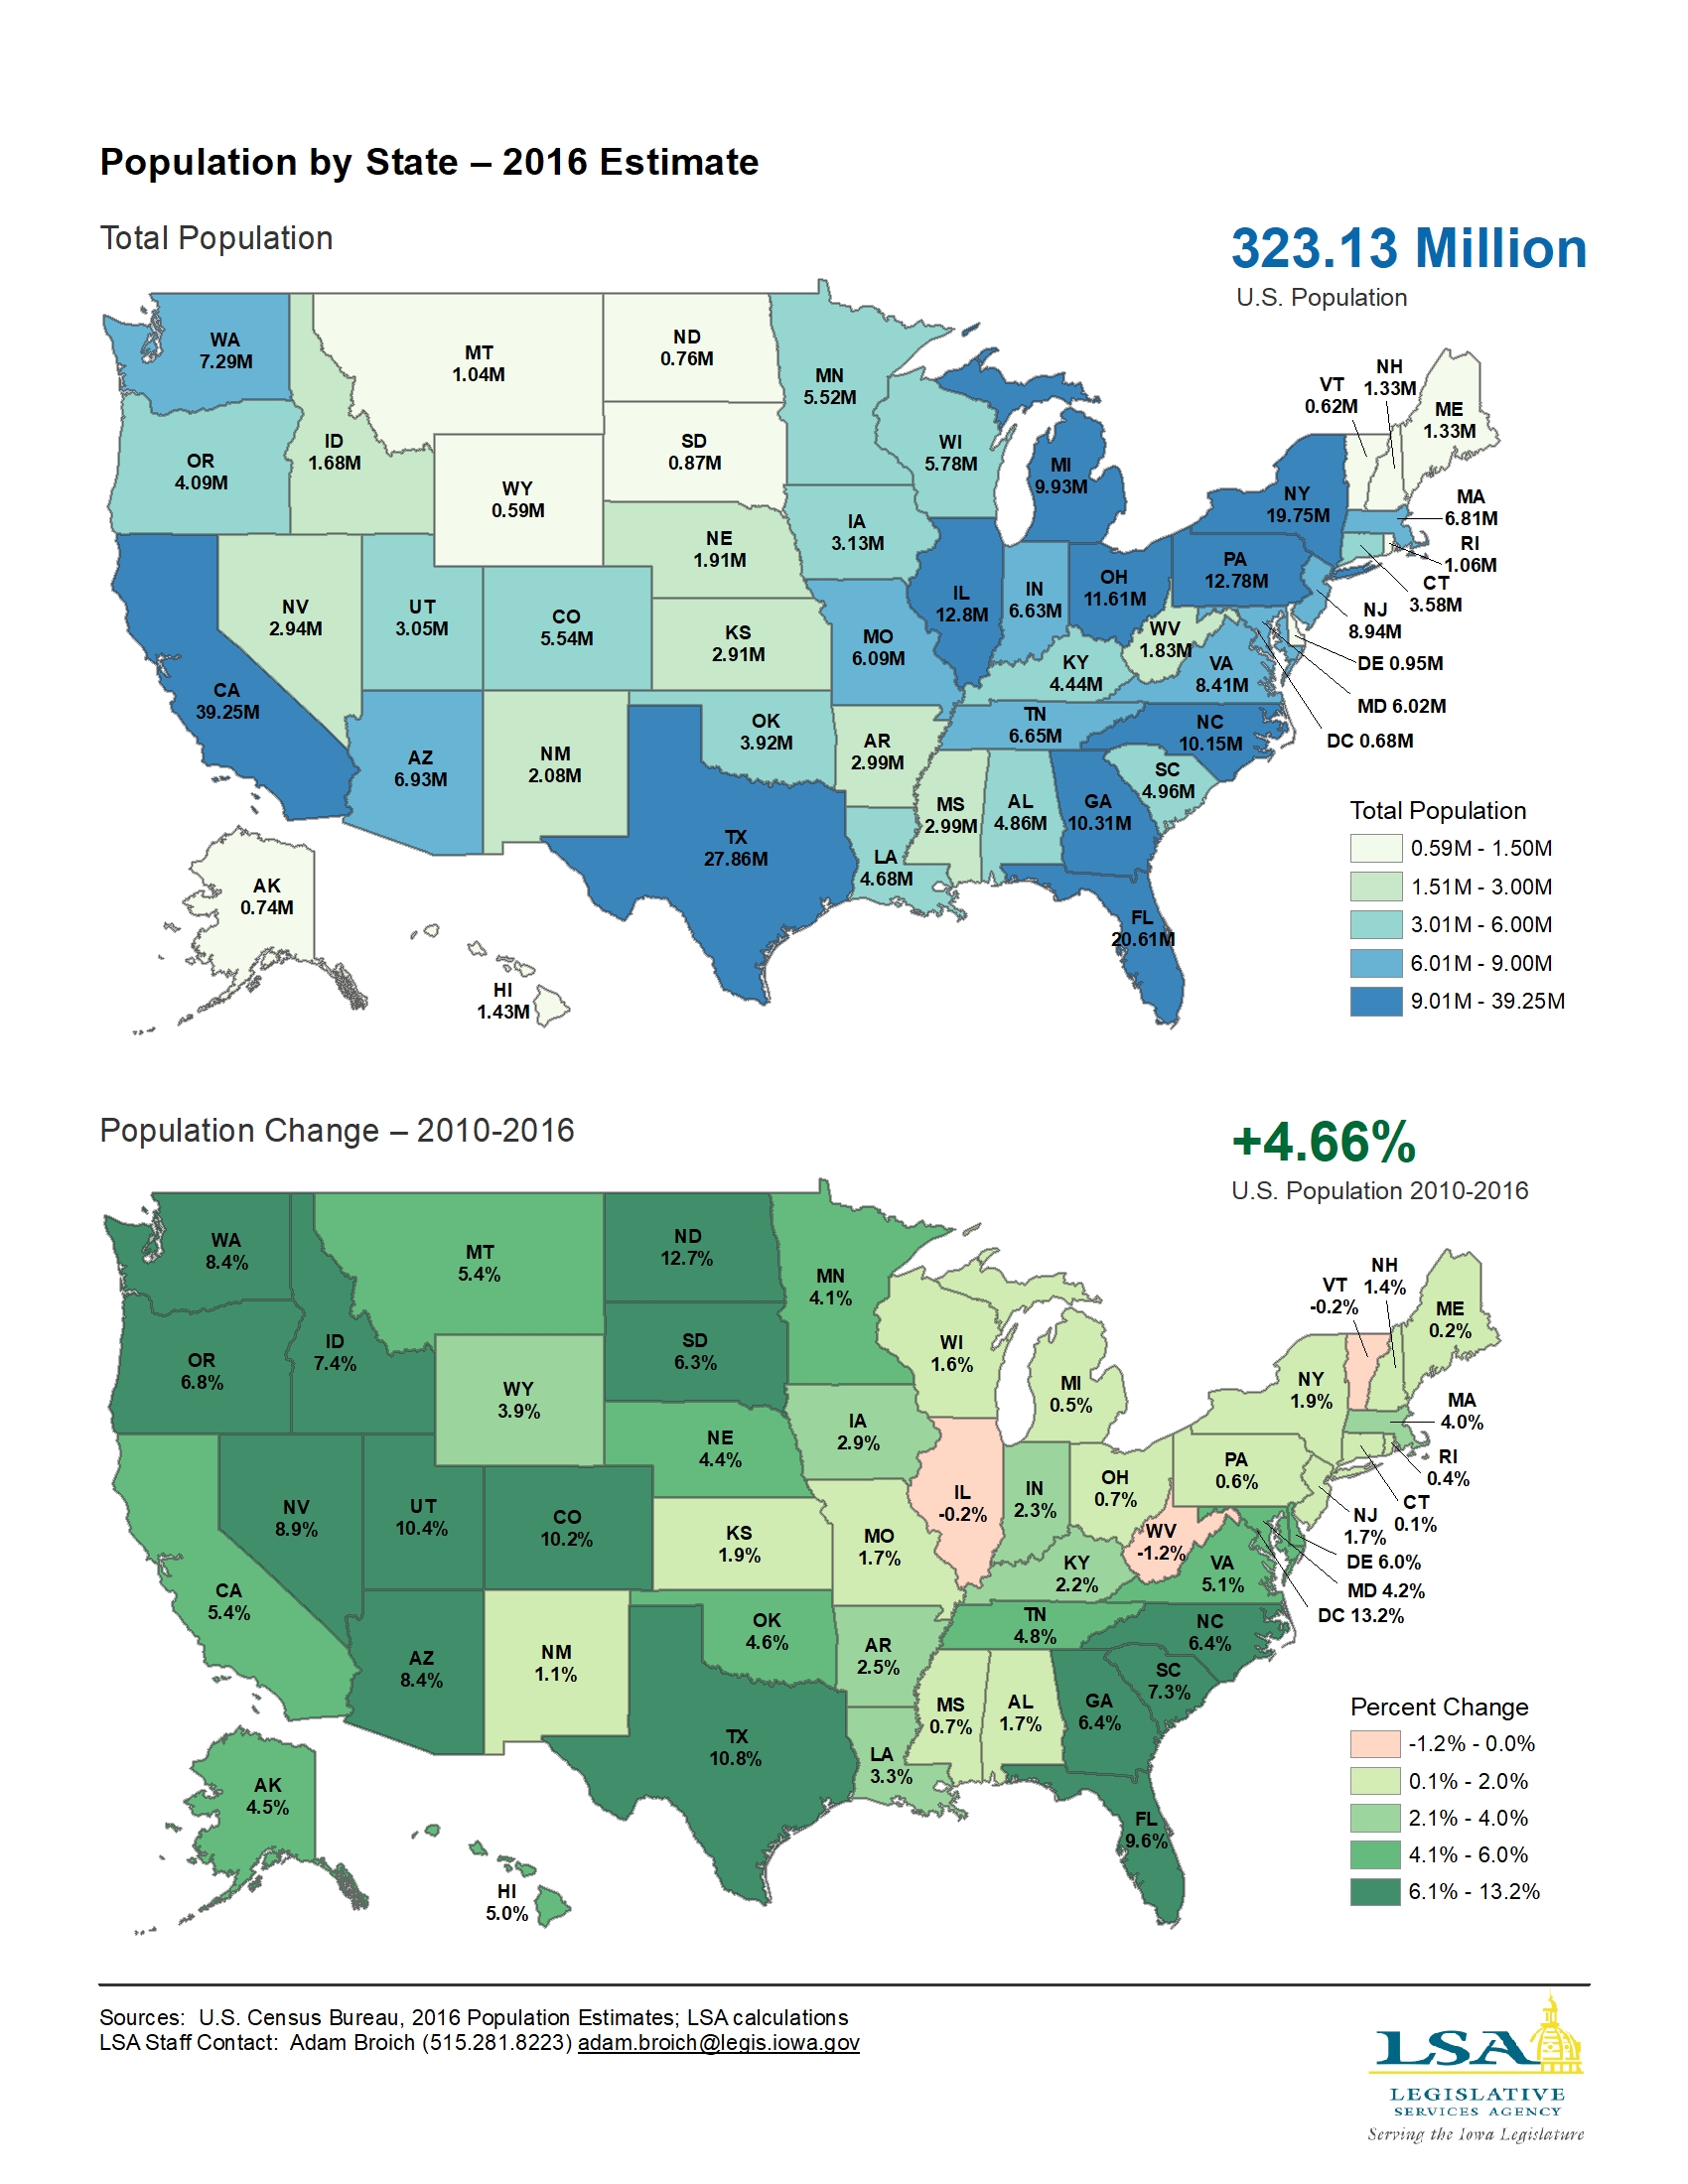
Population by State and Population Change – 2010-2016
|
|
|
|
|
| 01/22/2018 |
Iowa Insights |
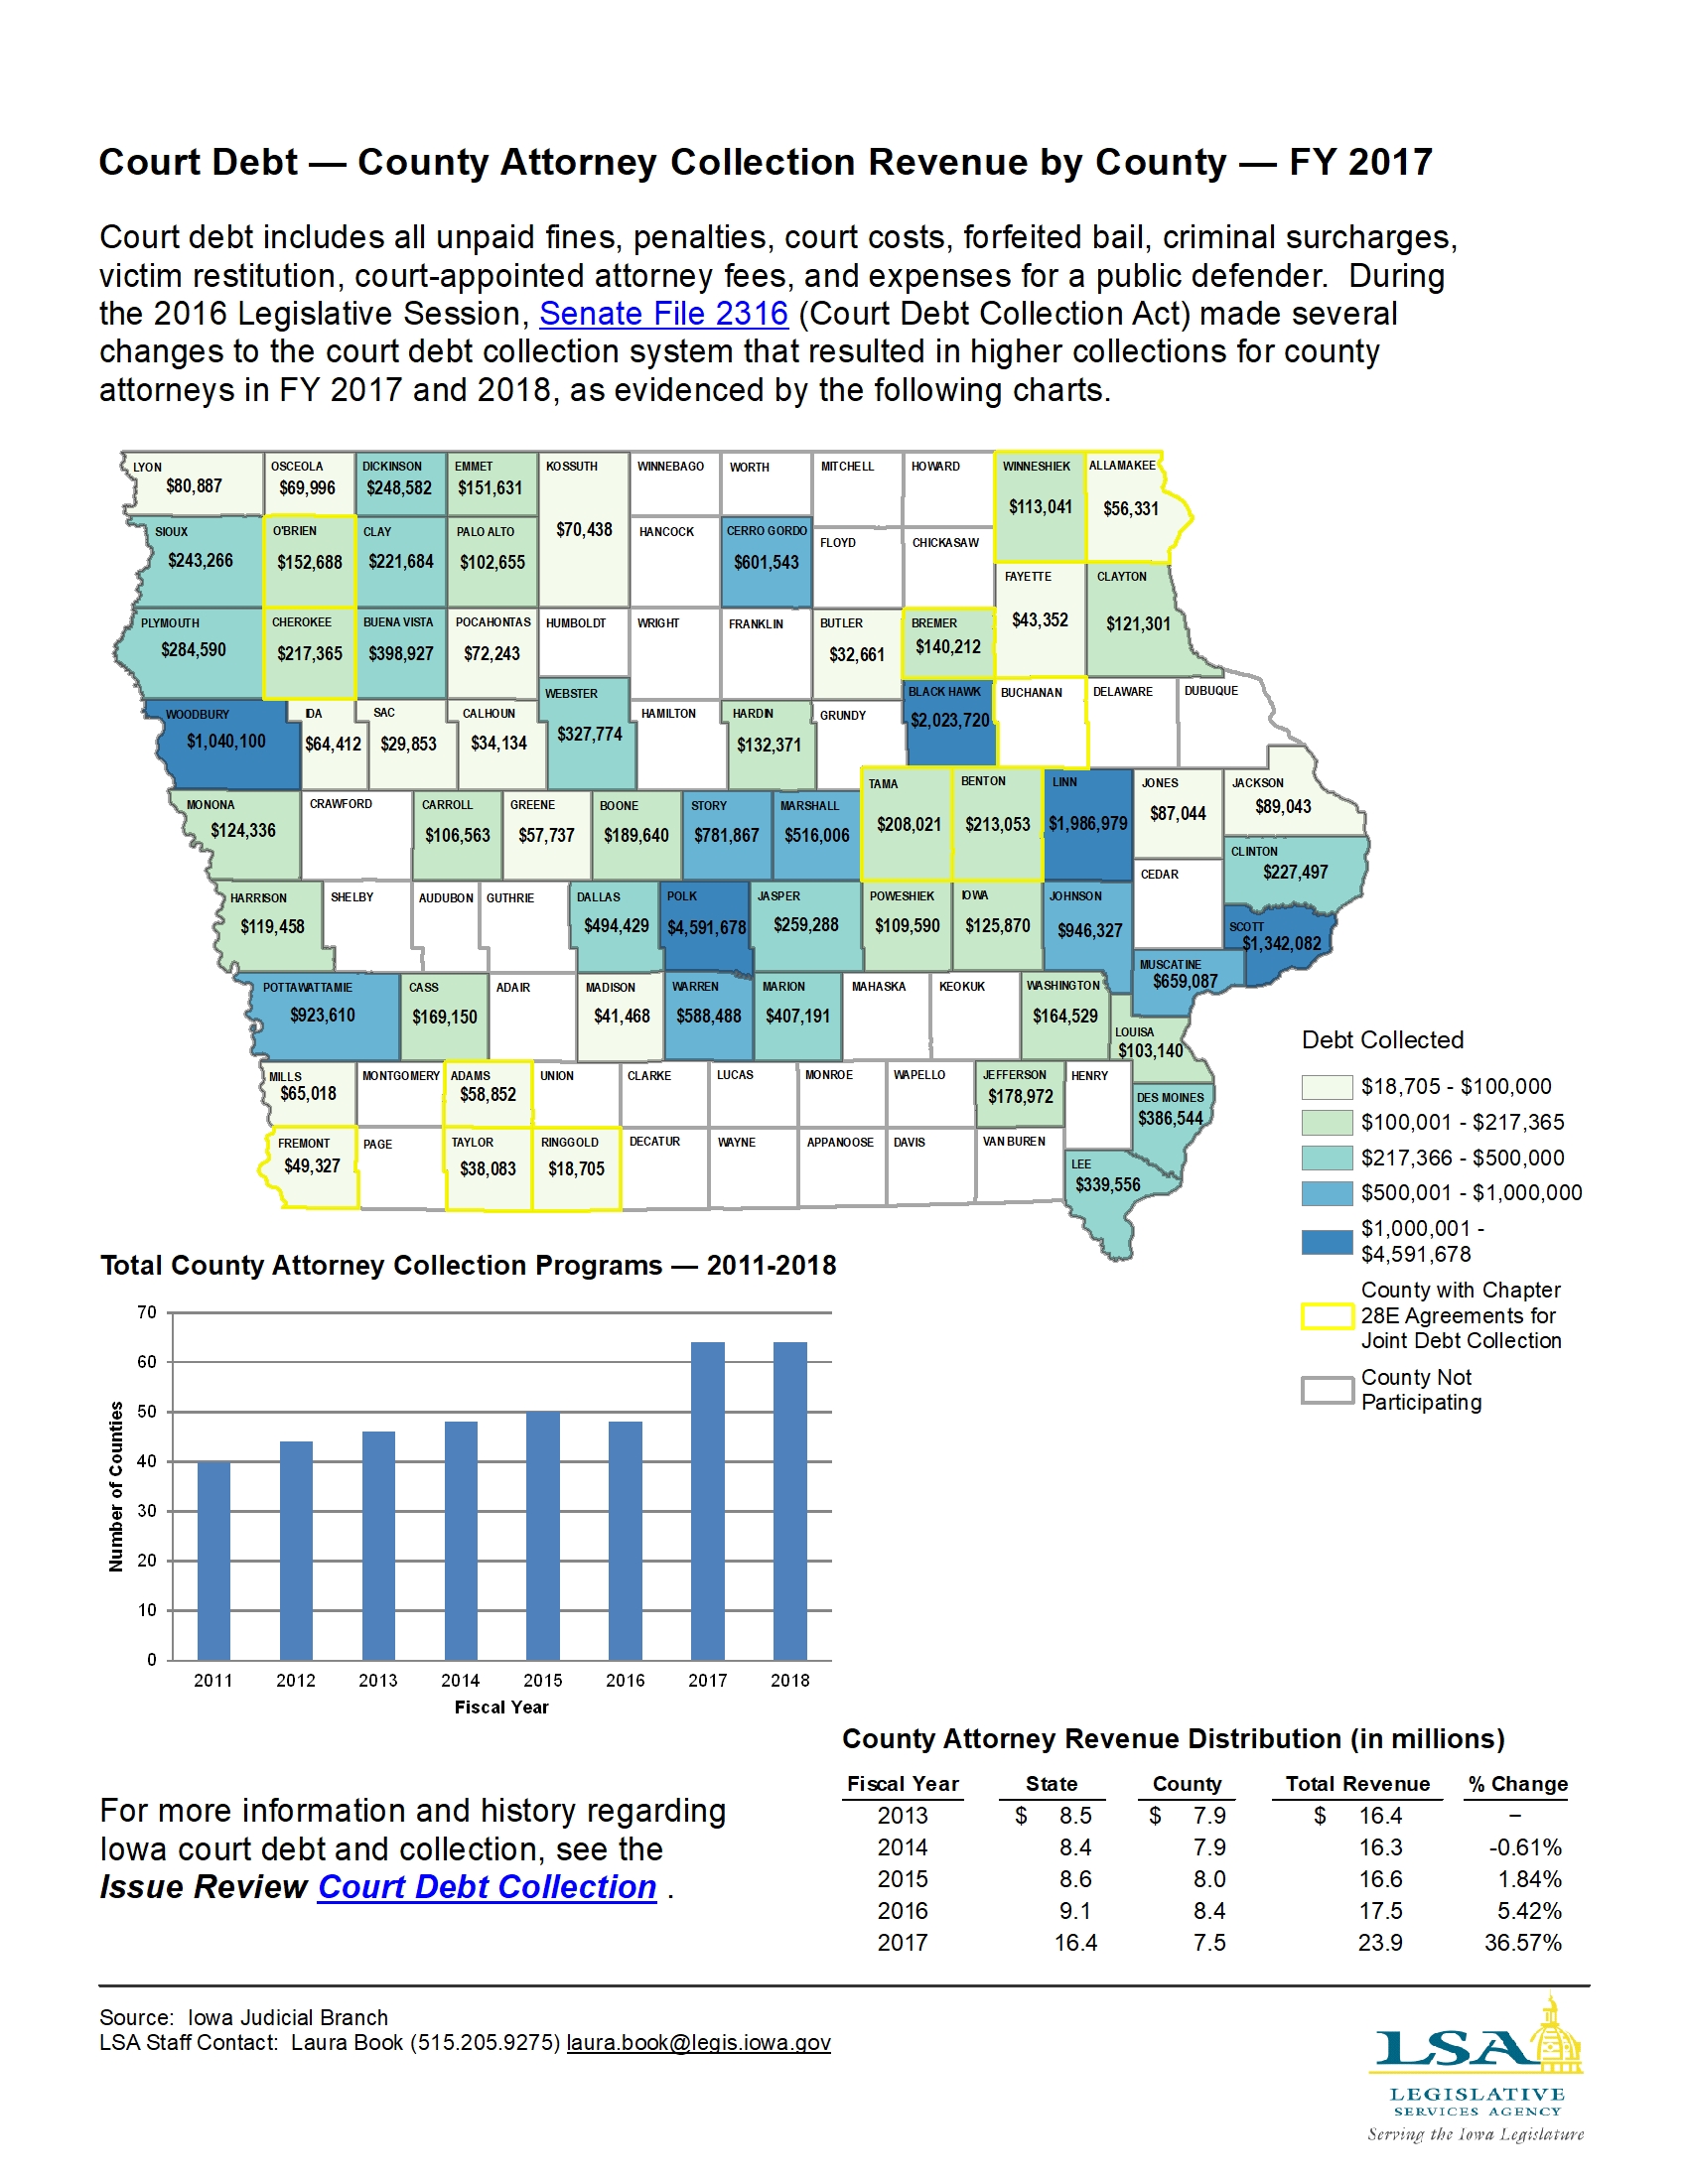
Court Debt — County Attorney Collection Revenue by County — FY 2017
|
|
|
|
|
| 01/15/2018 |
Iowa Insights |
Electric Vehicle Registration Fees

|
|
|
|
|
| 01/08/2018 |
Iowa Insights |
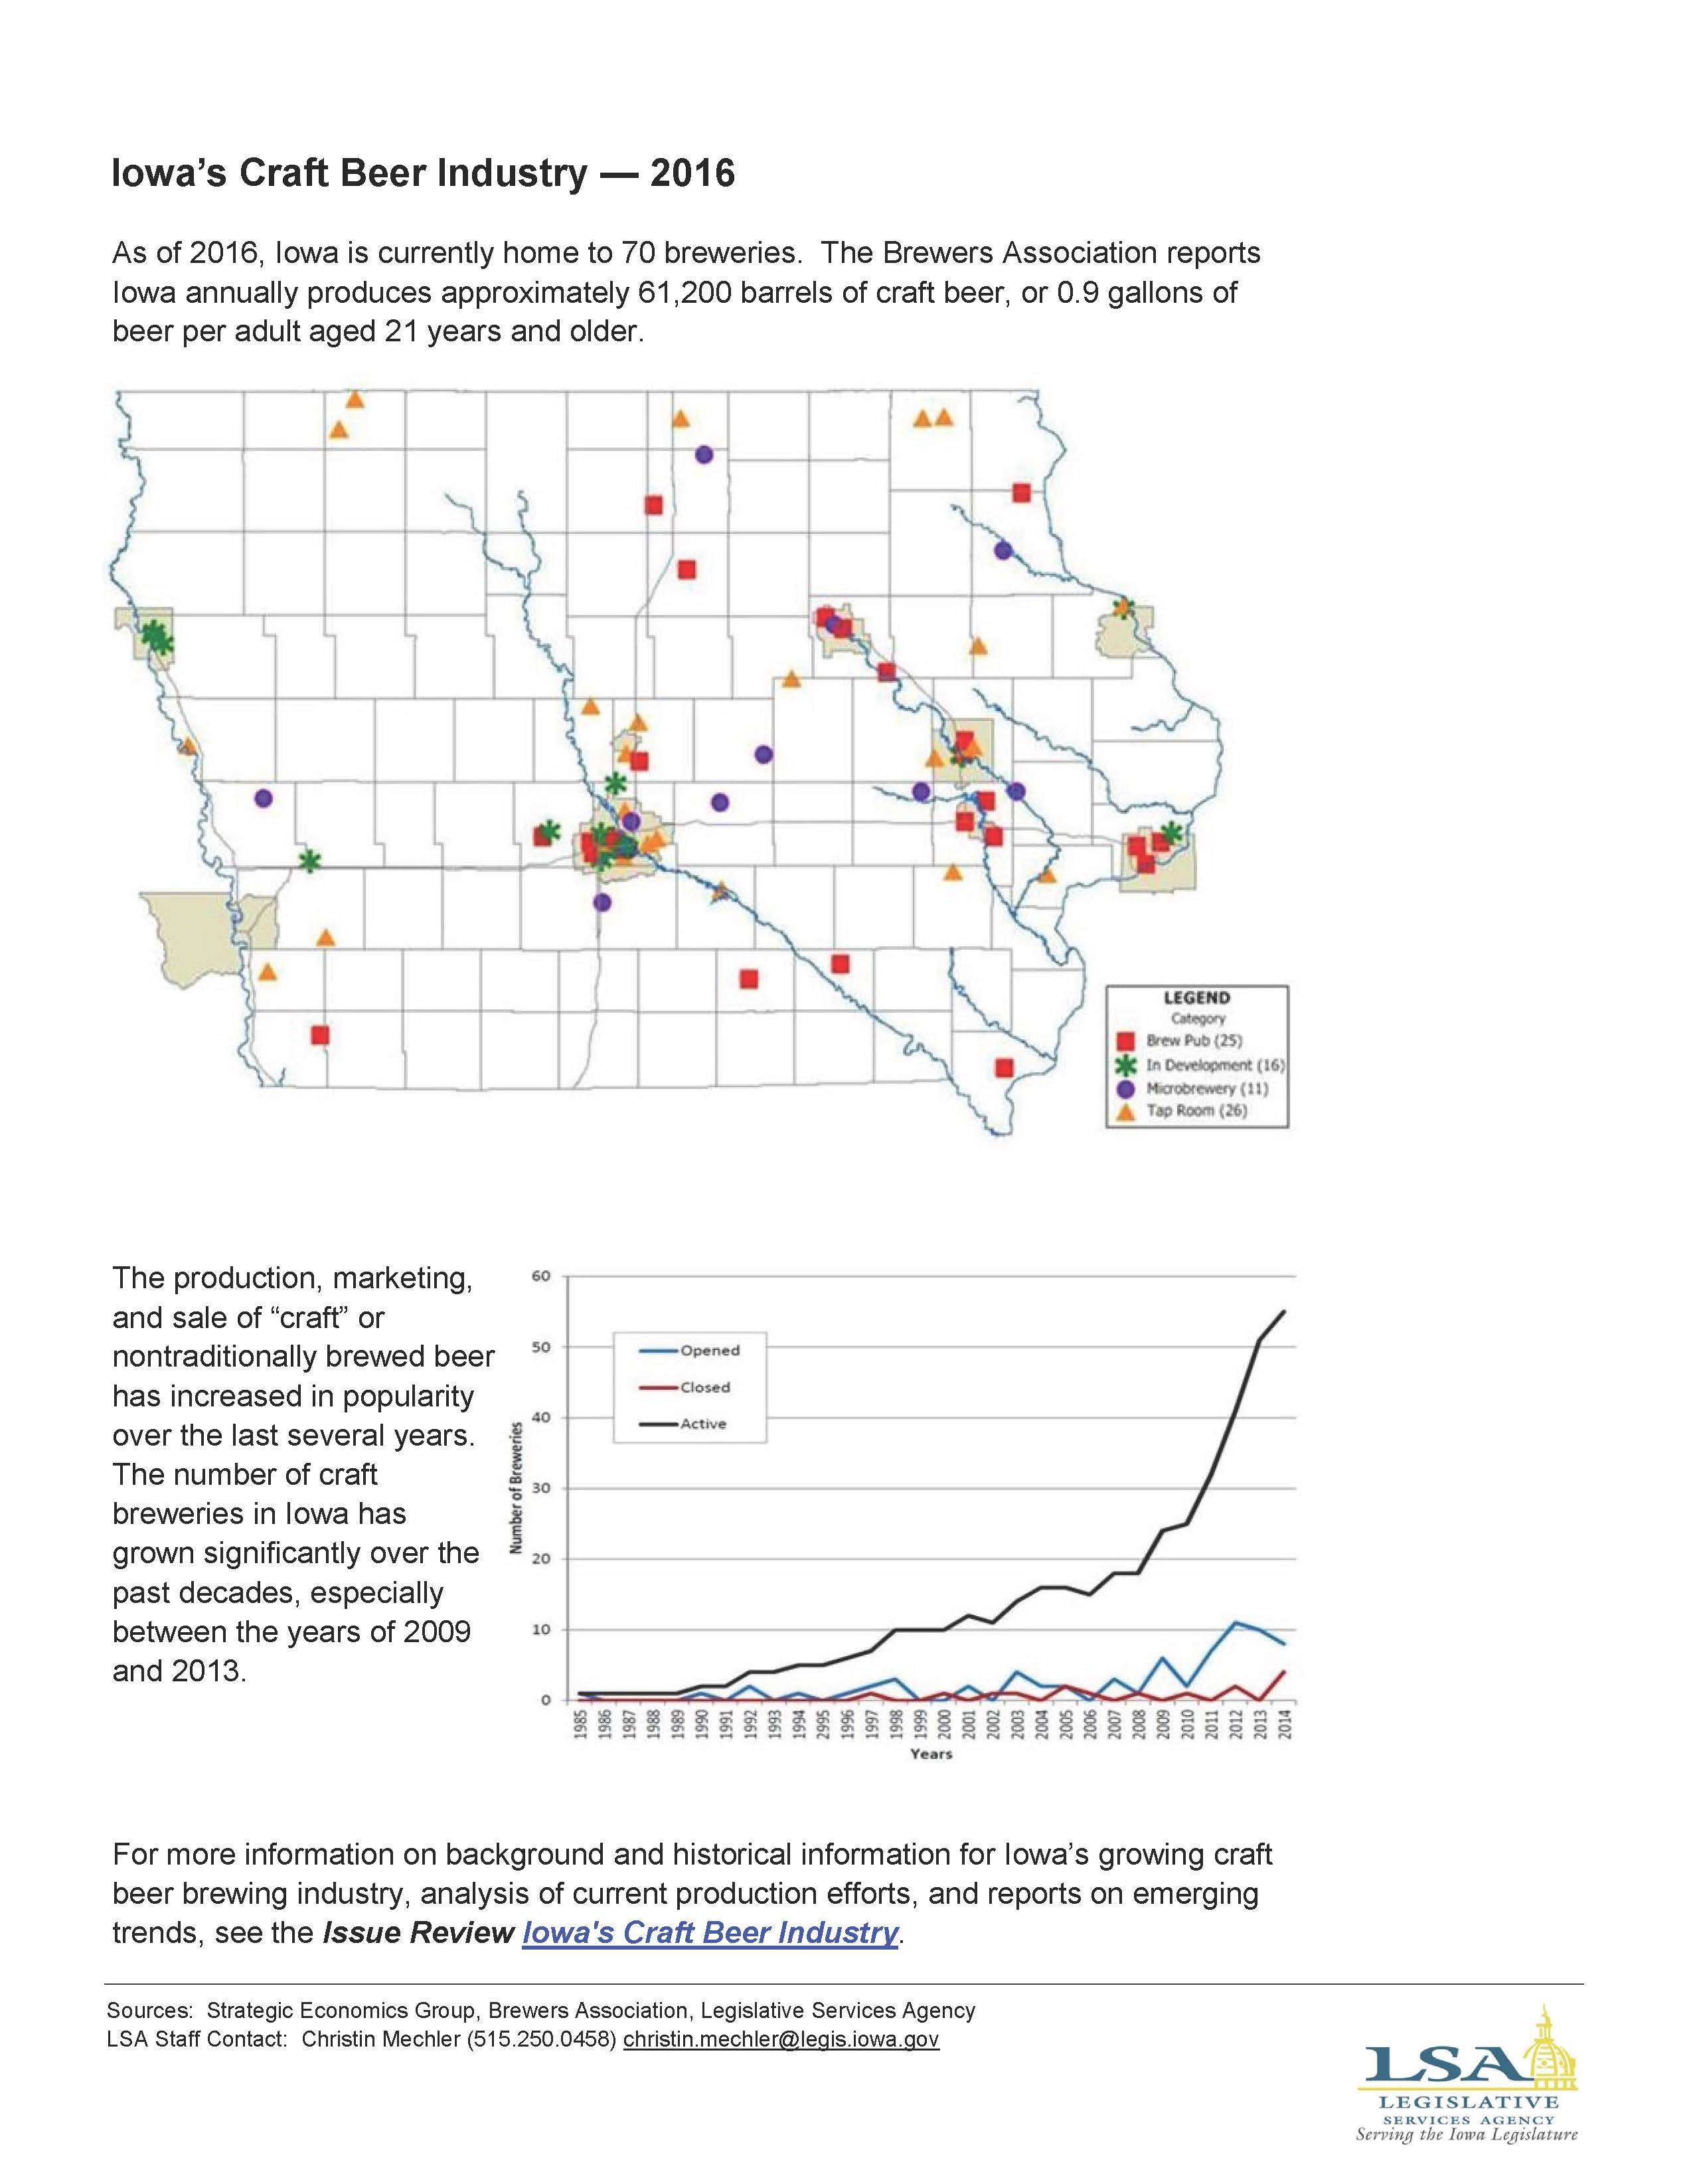
Iowa's Craft Beer Industry — 2016
|
|
|
|
|
| 01/02/2018 |
Iowa Insights |
National and Regional Comparisons – Census
|
|
|
|
|
| 12/18/2017 |
Iowa Insights |
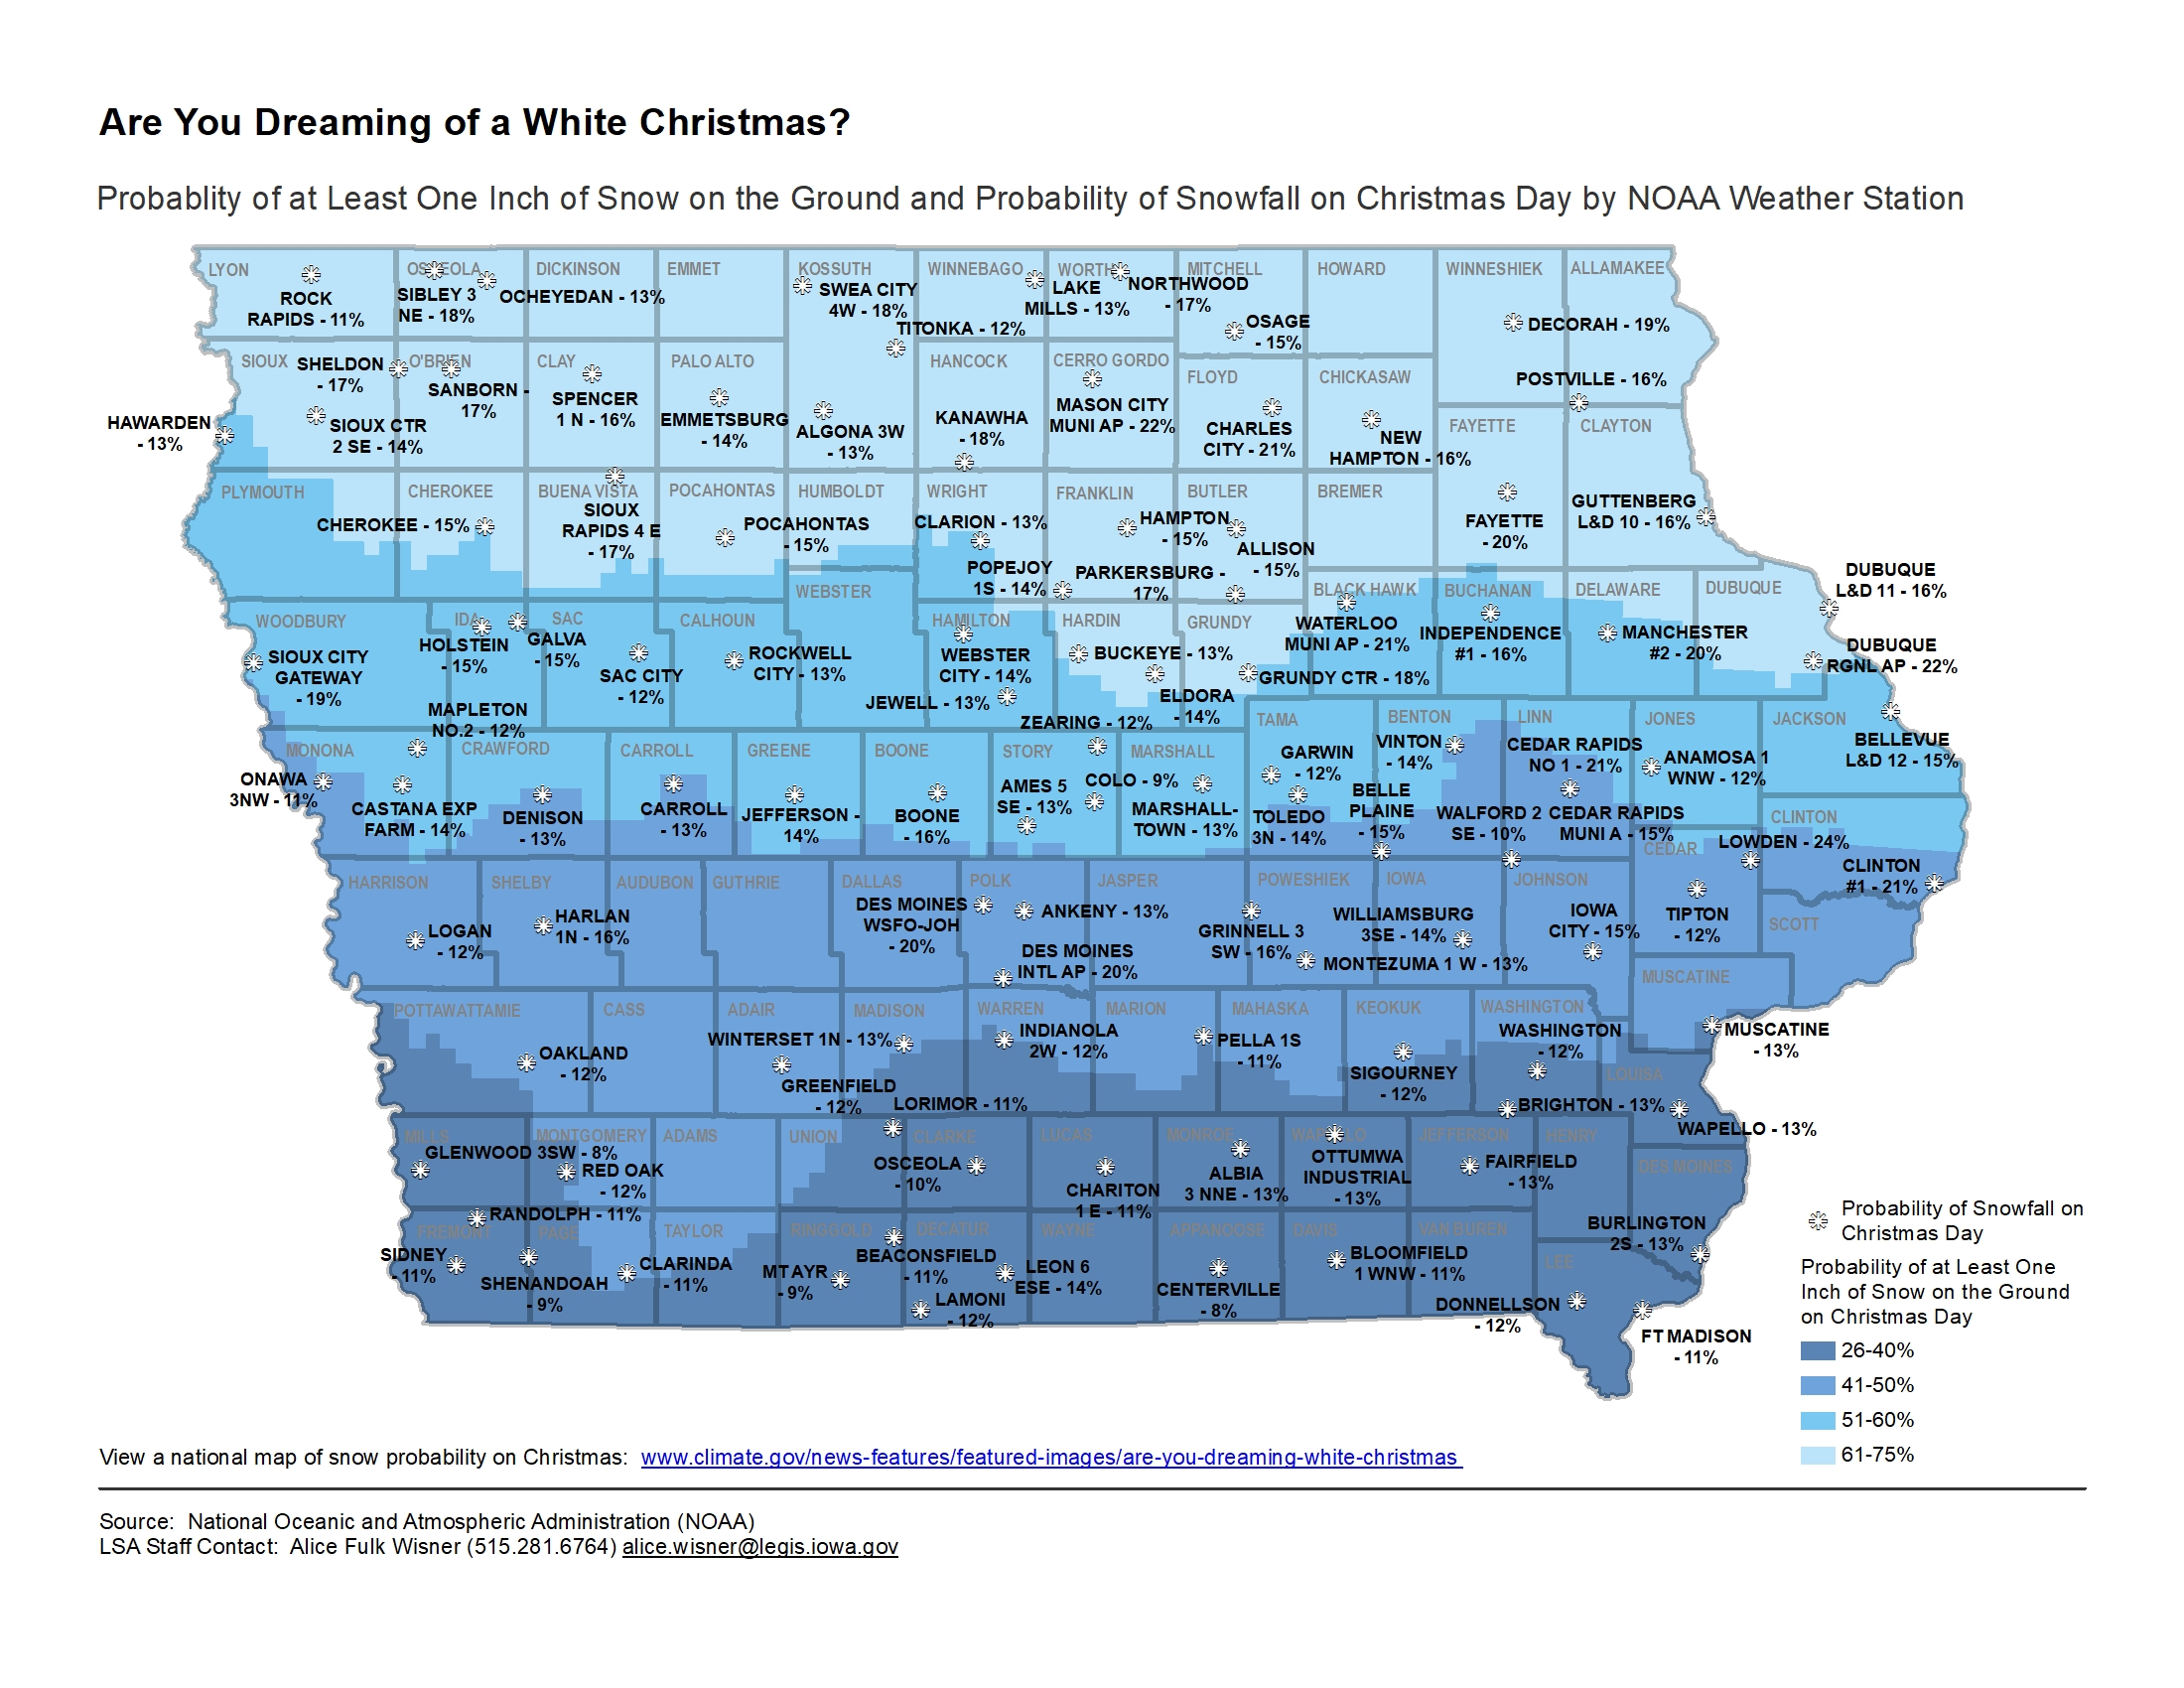
Are you Dreaming of a White Christmas? Probability of Snow on Christmas Day
|
|
|
|
|
| 12/11/2017 |
Iowa Insights |
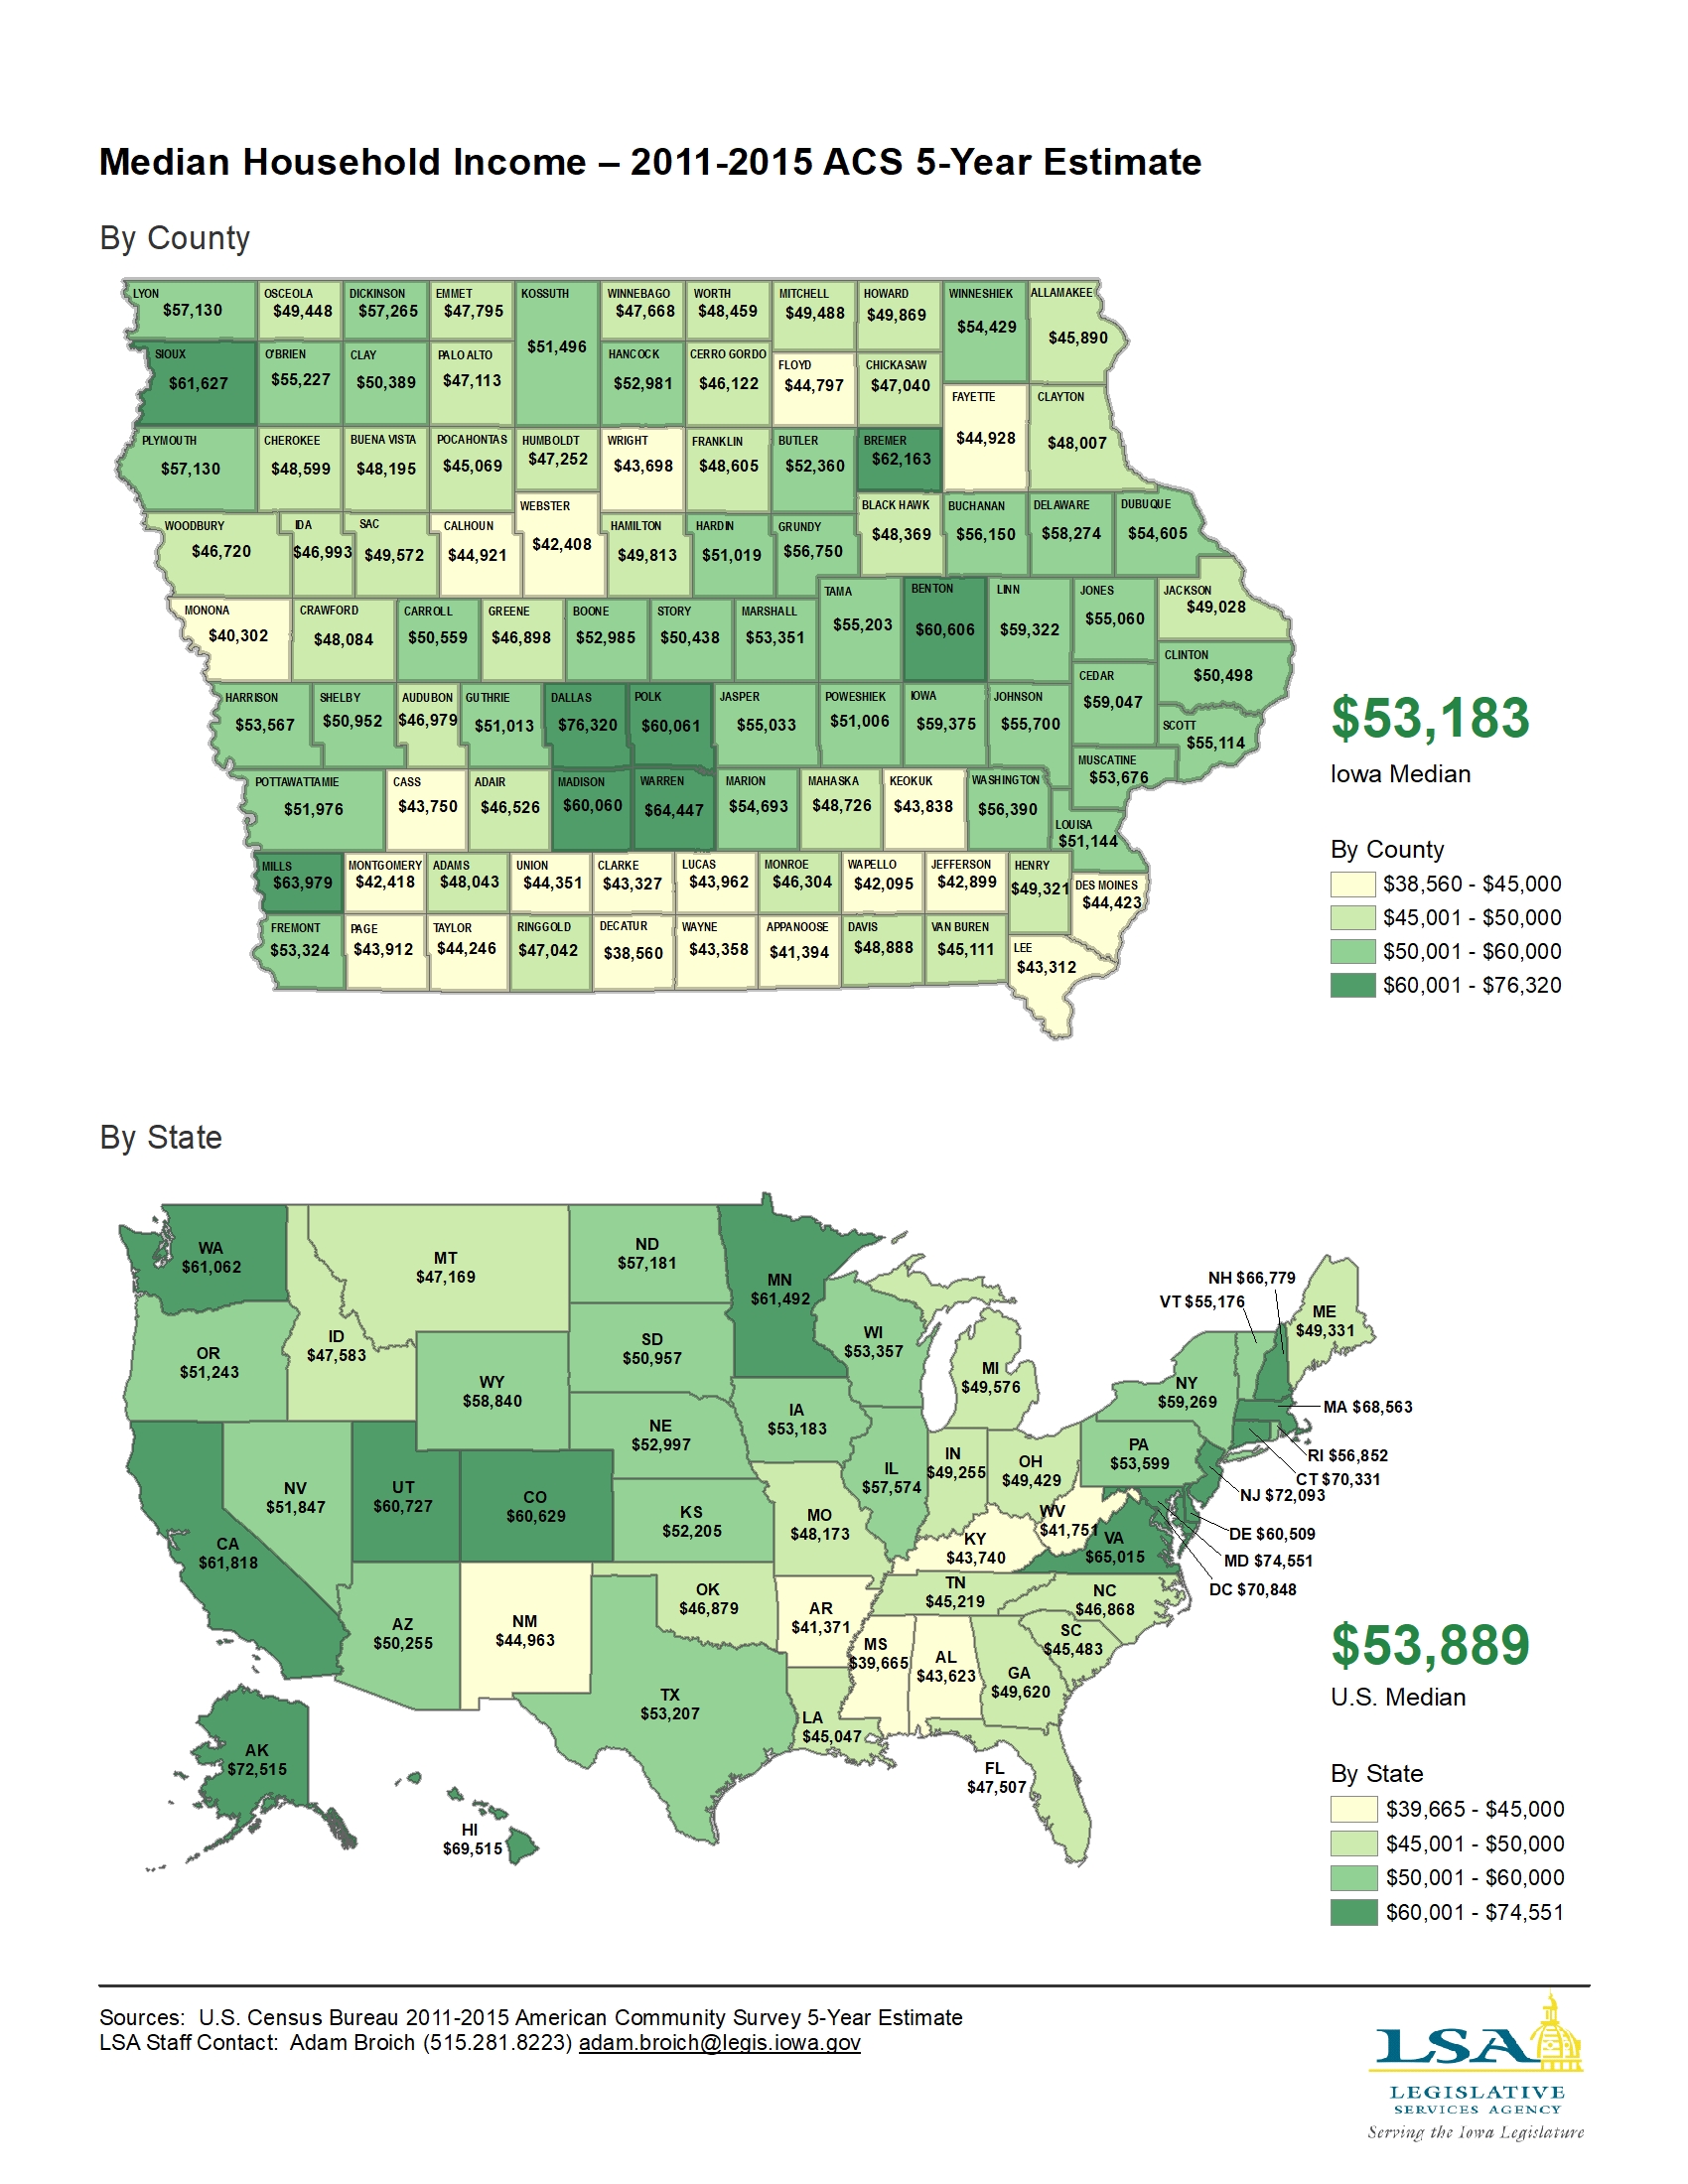
Median Household Income – 2011-2015 ACS 5-Year Estimate
|
|
|
|
|
| 12/04/2017 |
Iowa Insights |
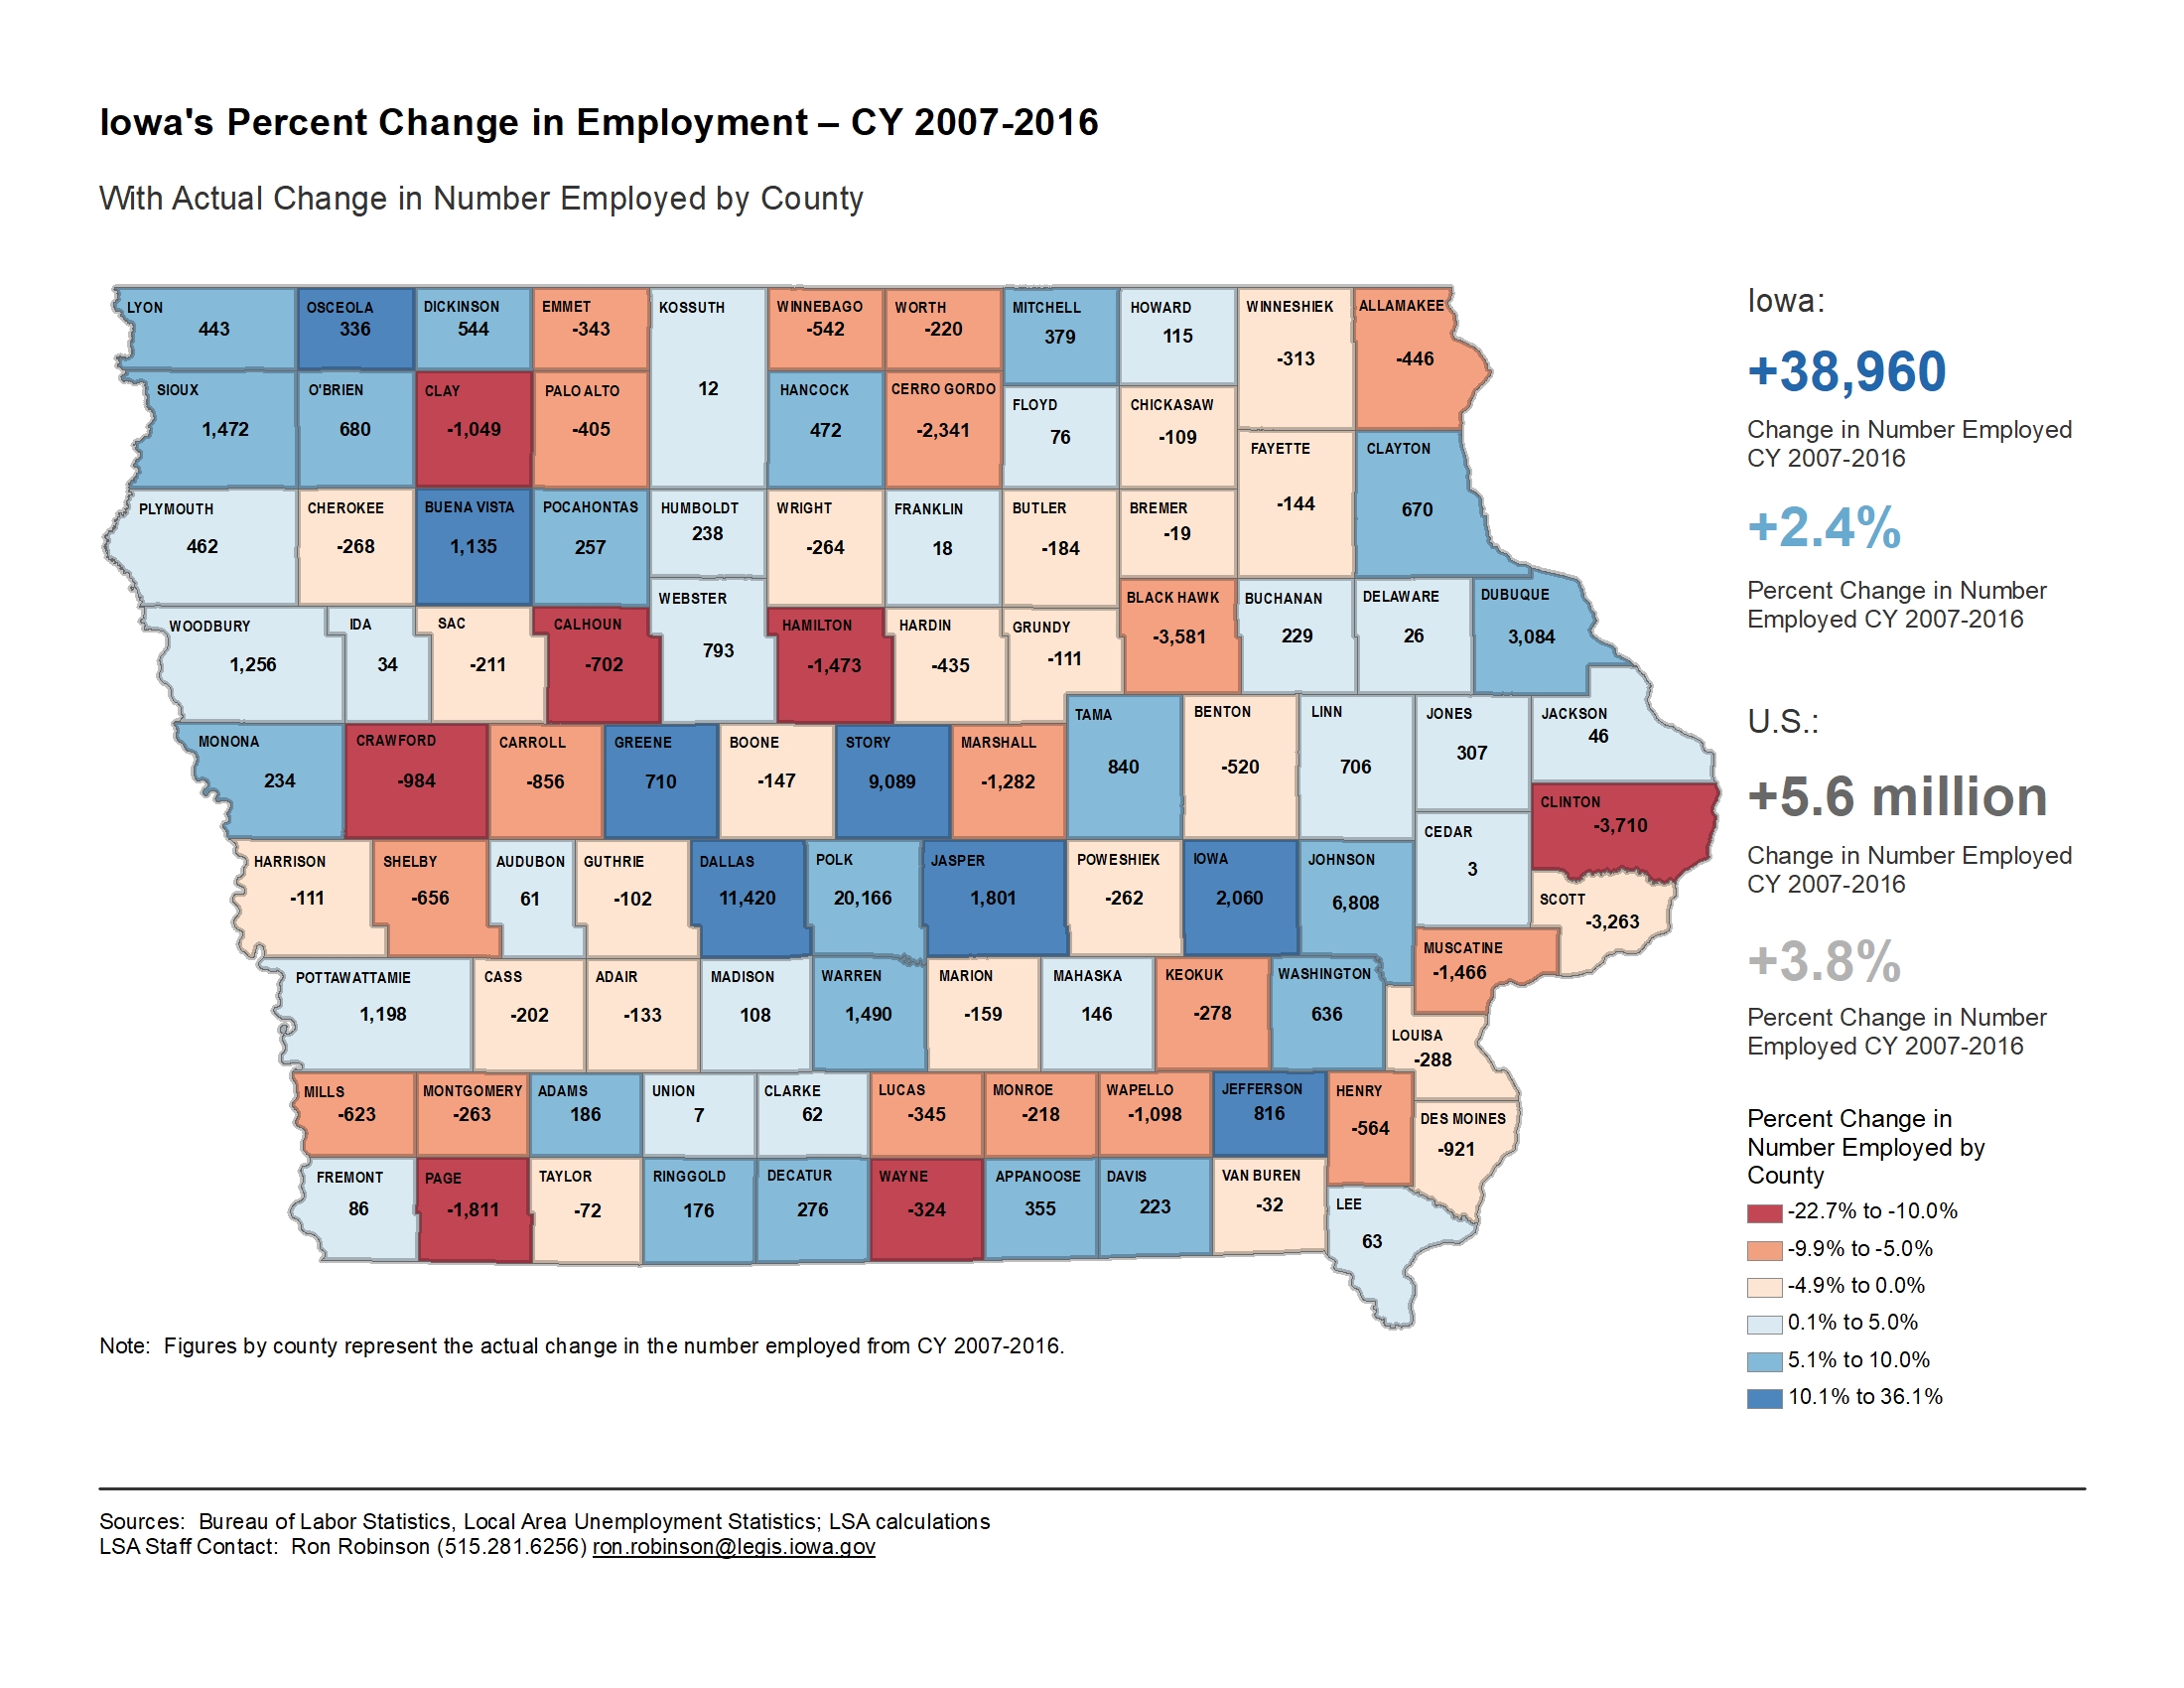
Percent Change in Employment – CY 2007-2016
|
|
|
|
|
| 11/27/2017 |
Iowa Insights |
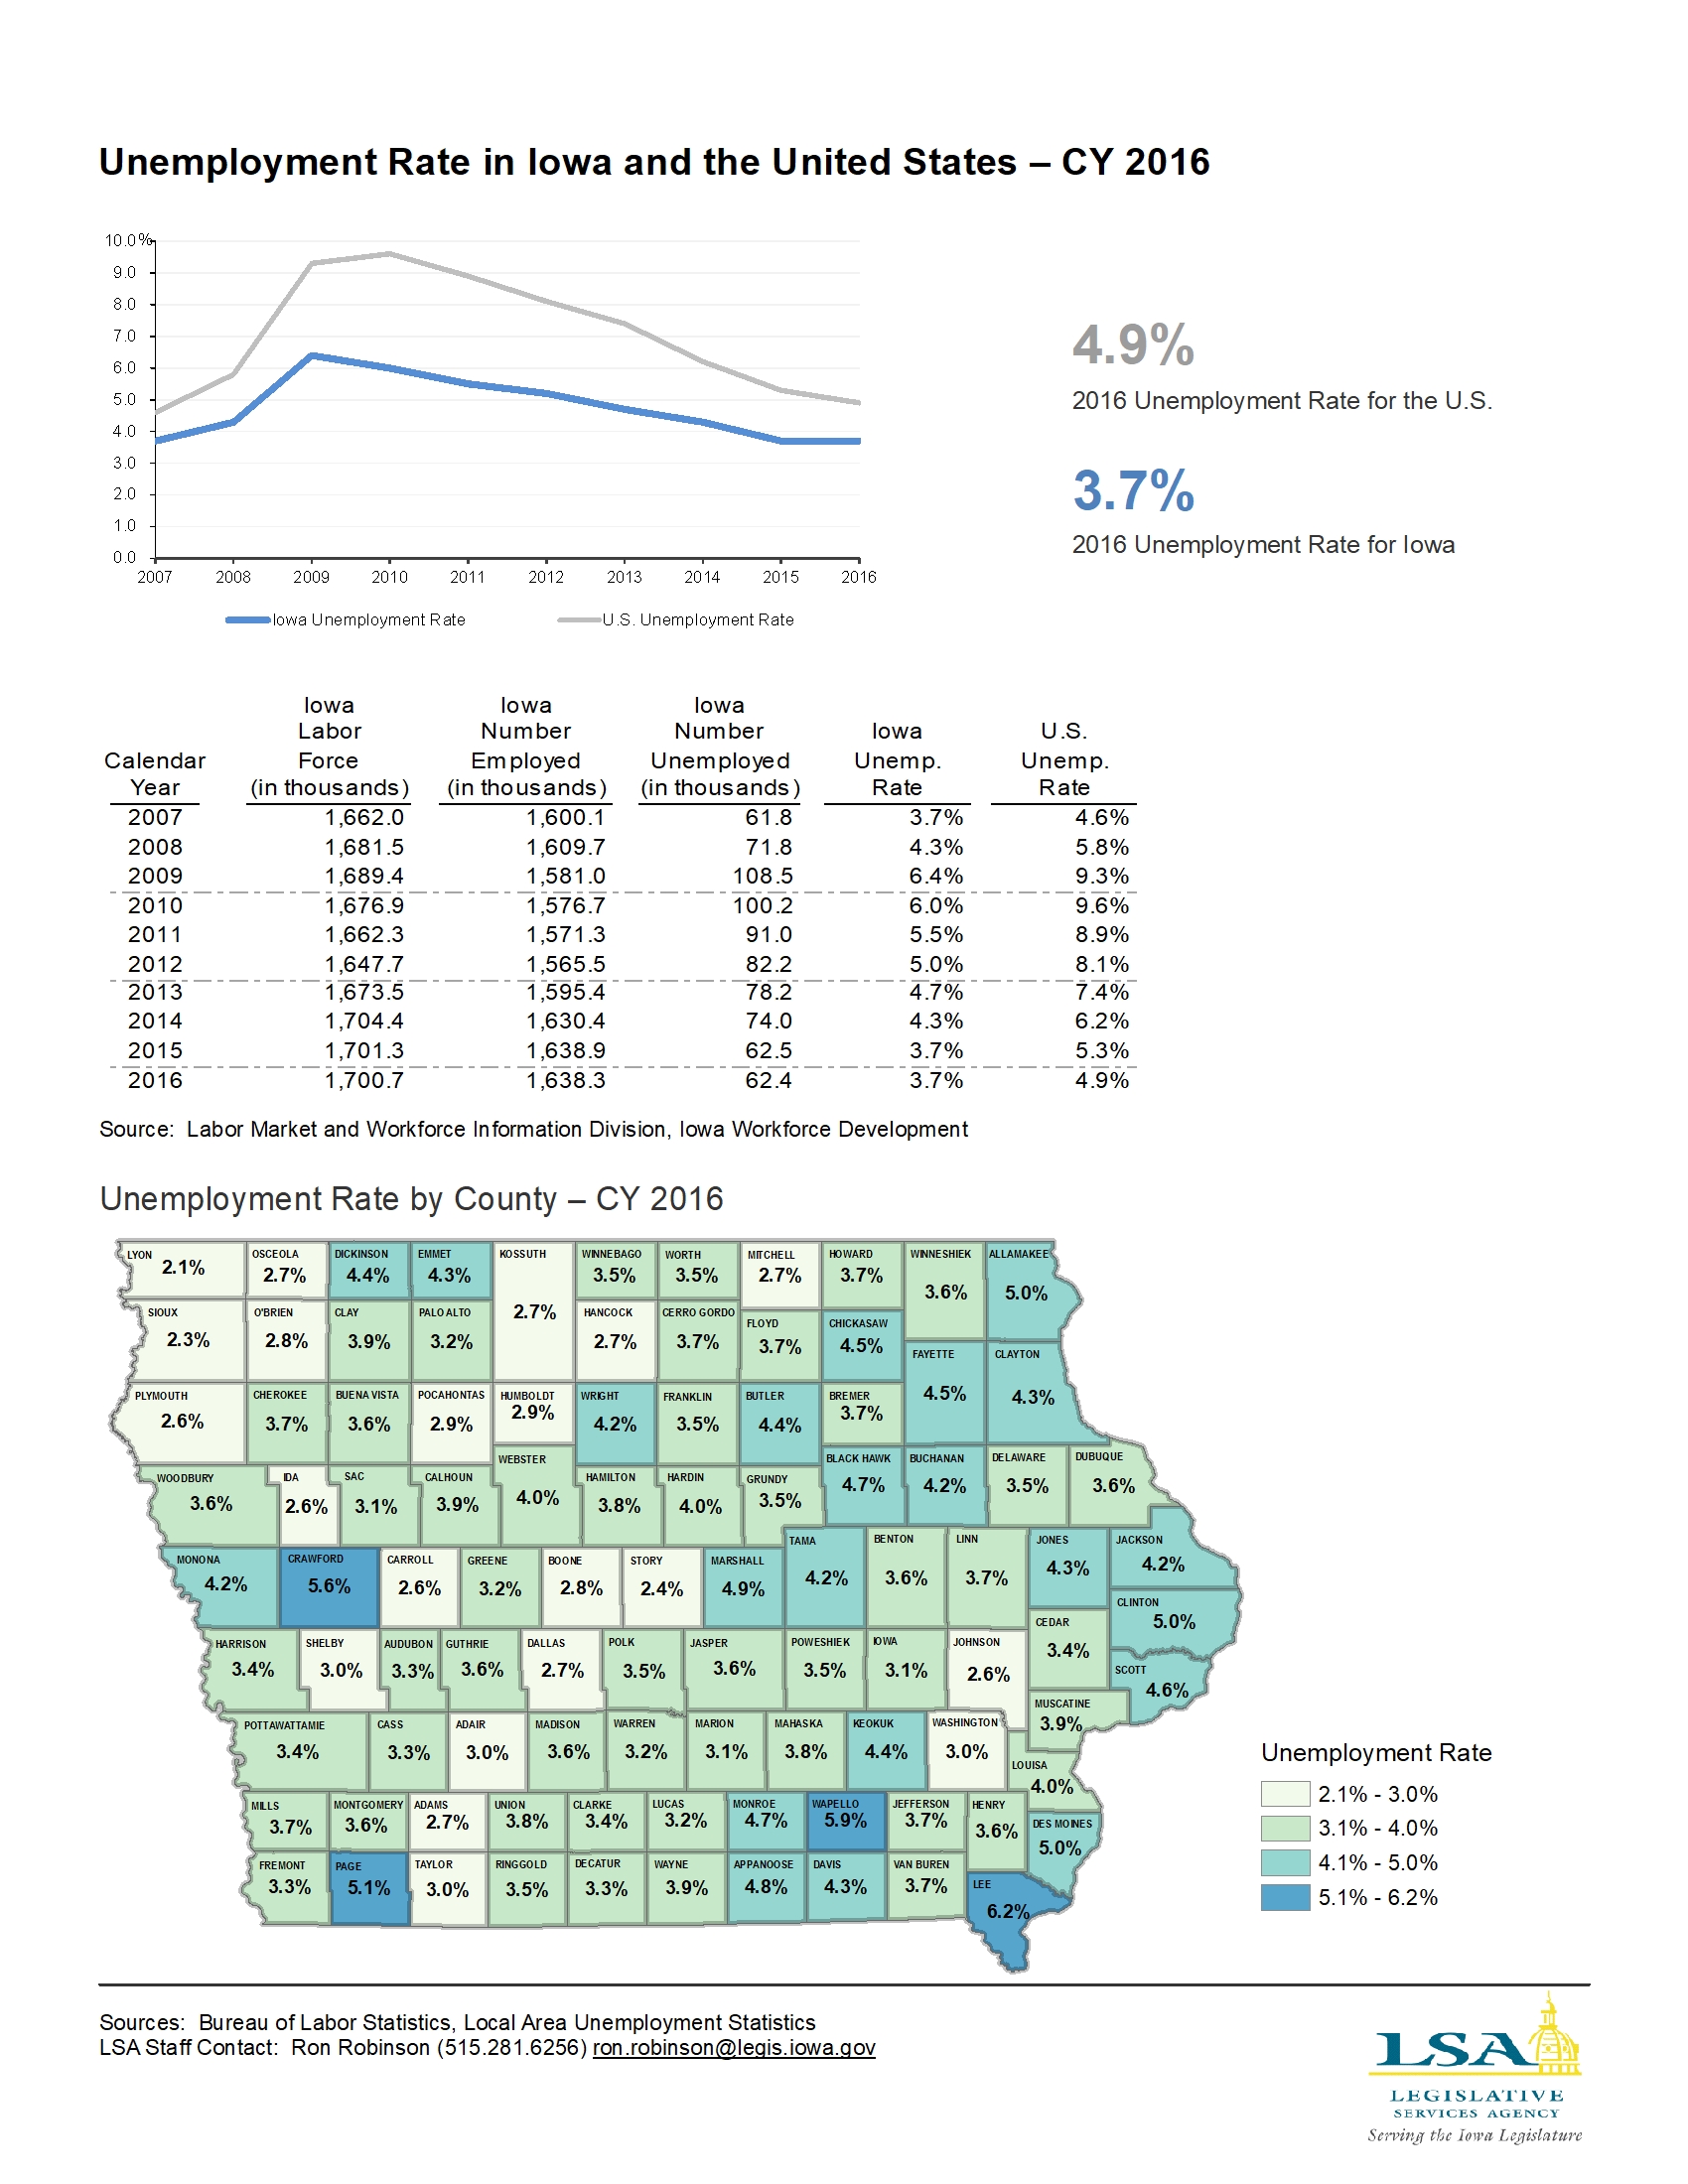
Unemployment Rate – CY 2016
|
|
|
|
|
| 11/20/2017 |
Iowa Insights |
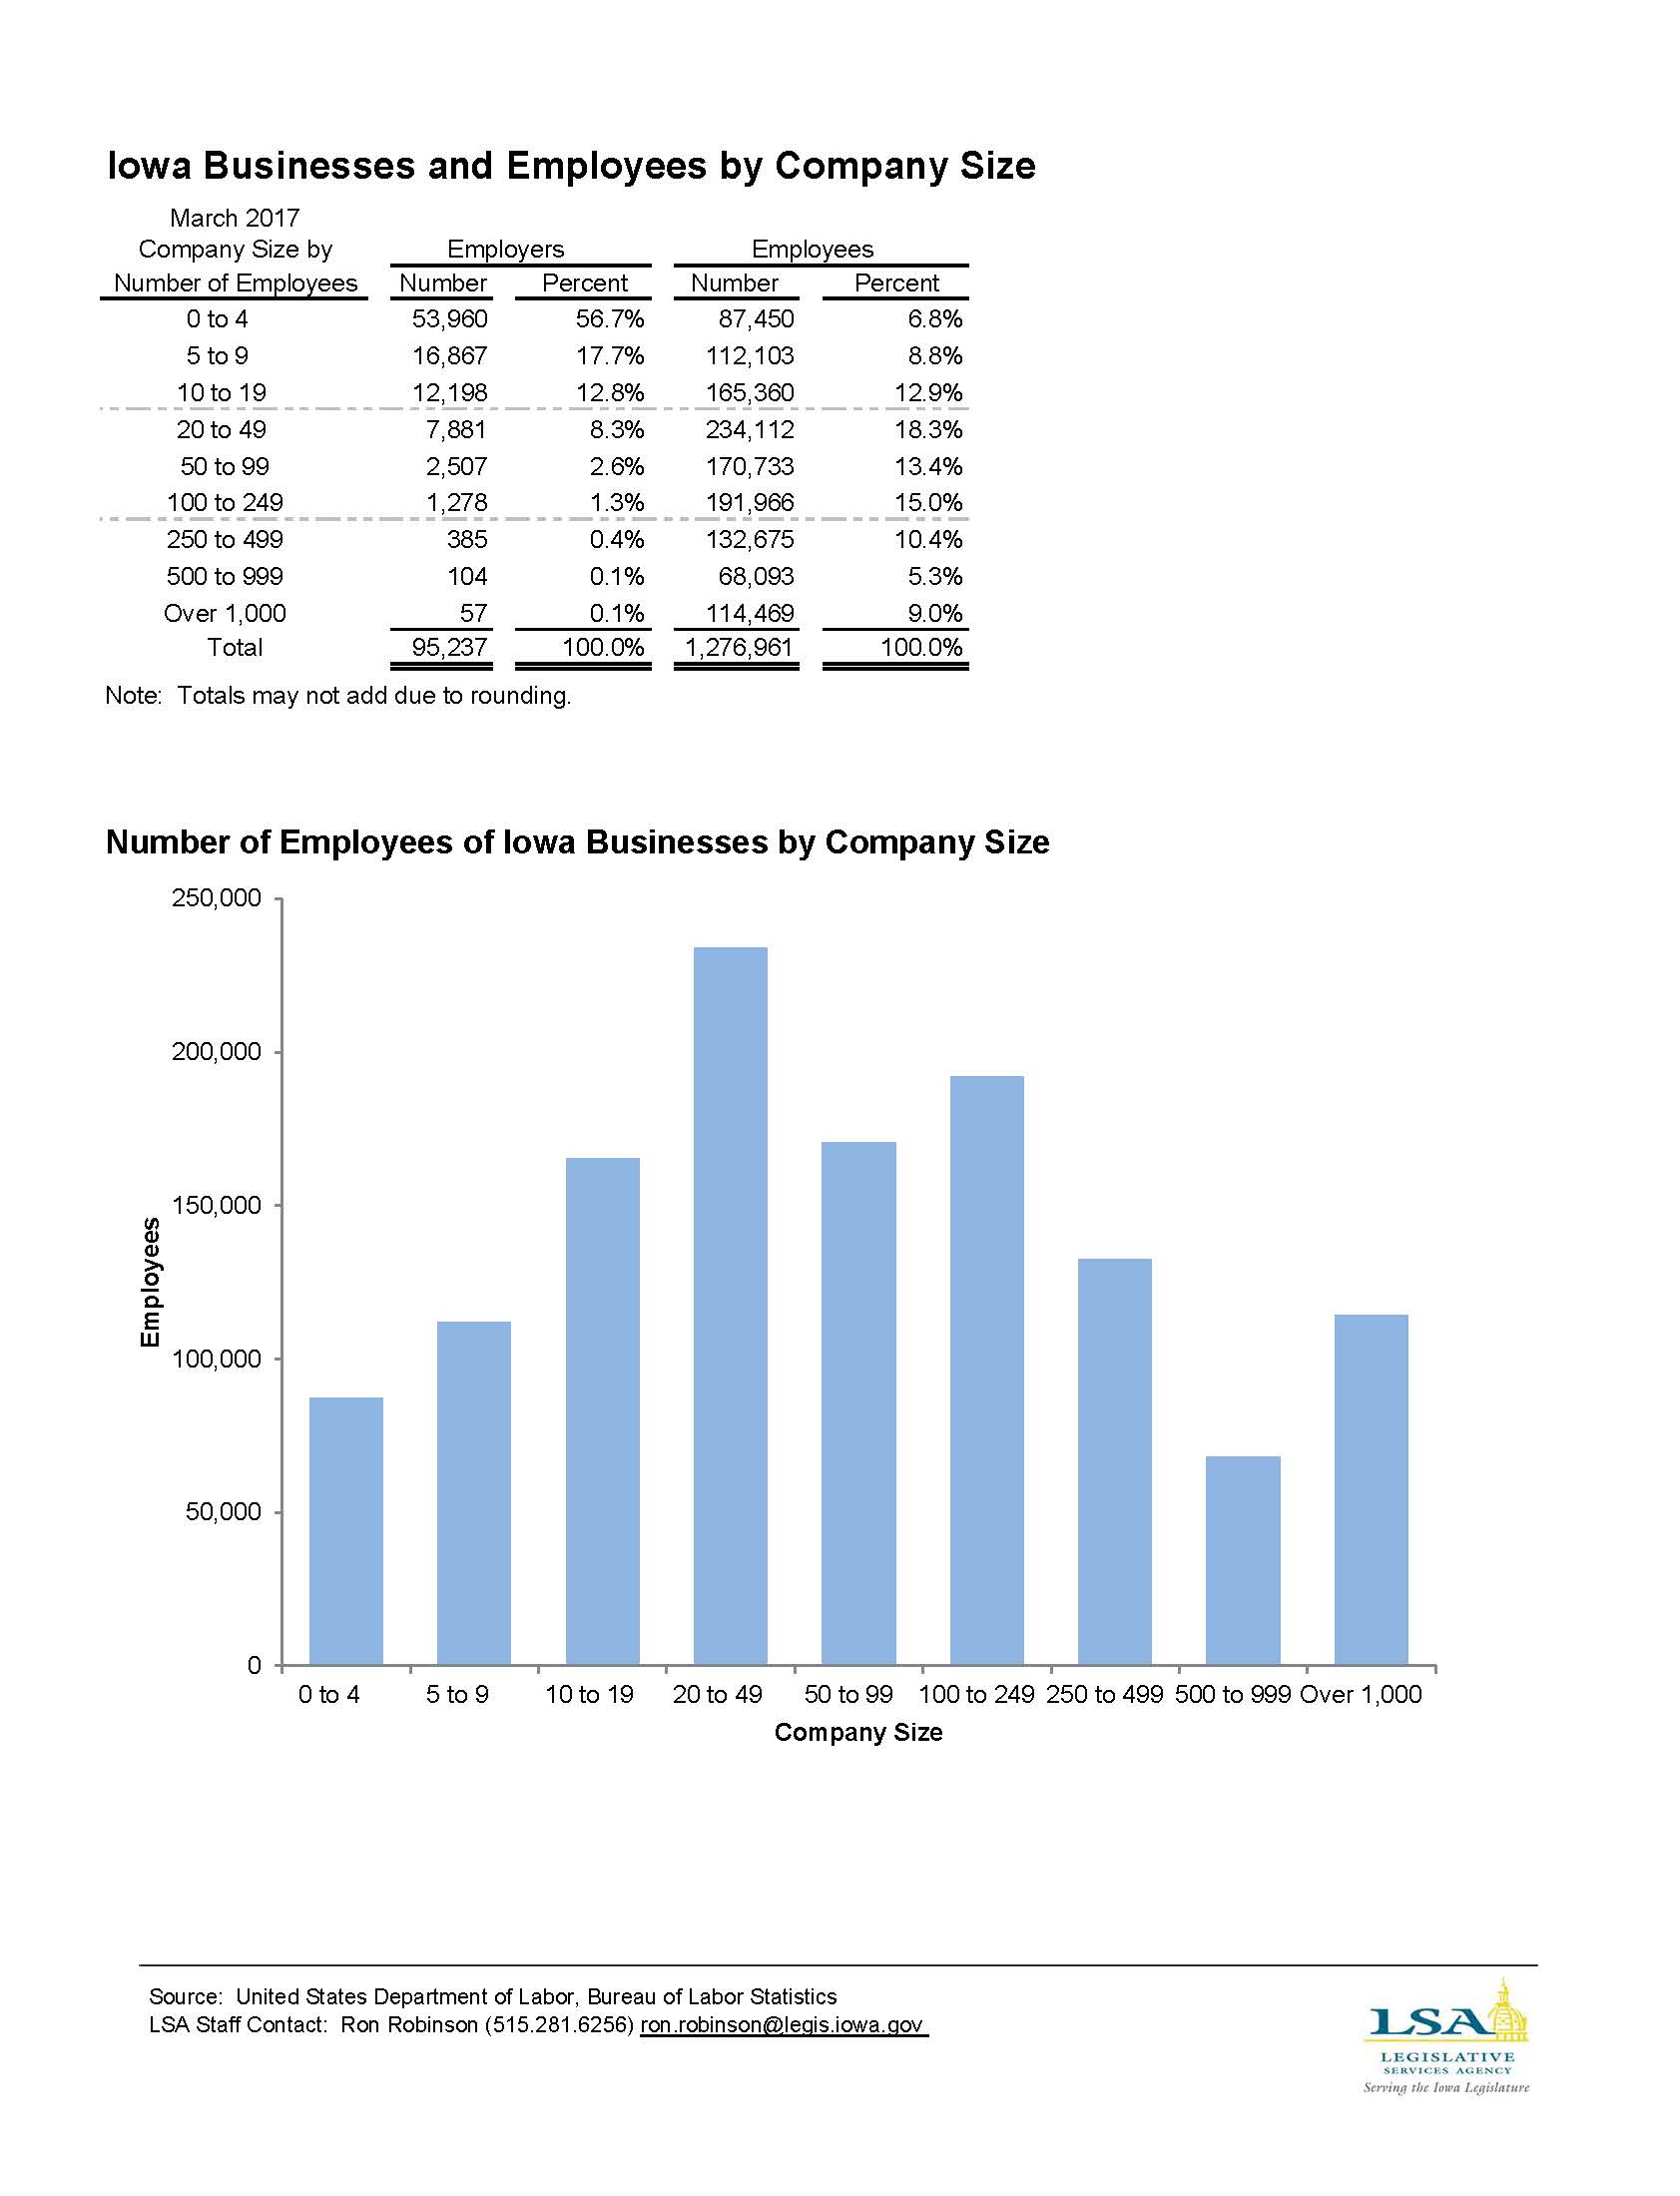
Iowa Businesses and Employees by Company Size – March 2017
|
|
|
|
|
| 11/13/2017 |
Iowa Insights |
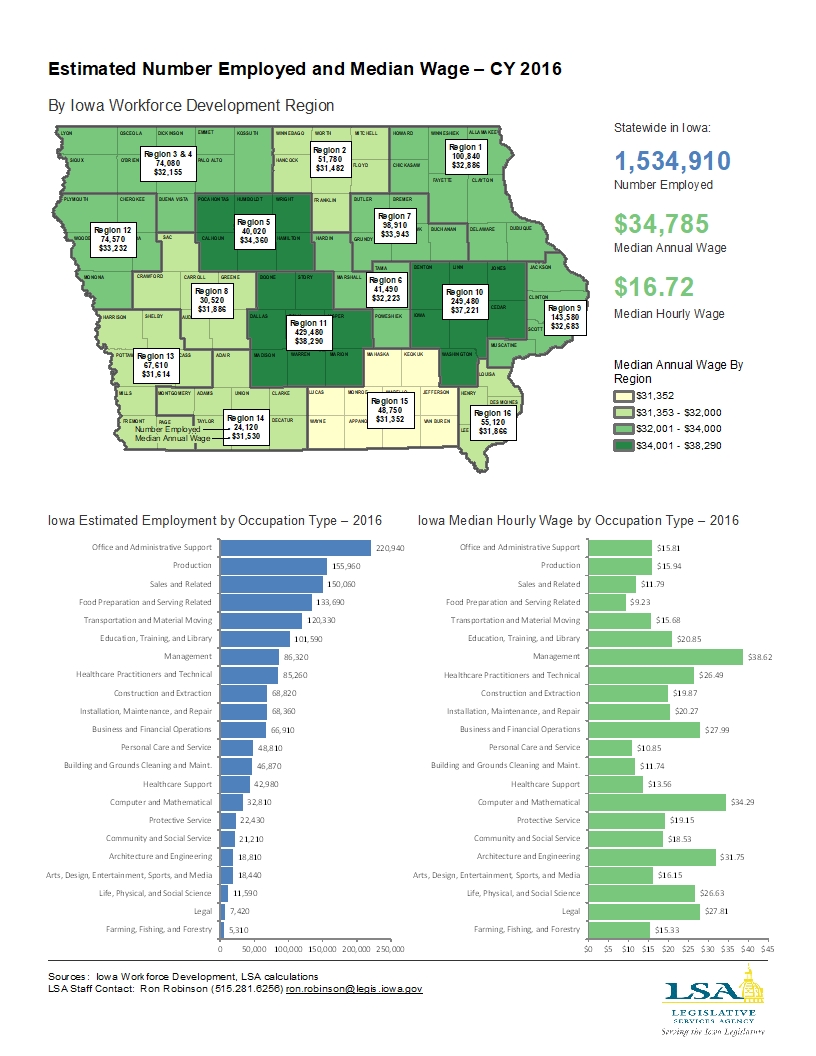
Estimated Number Employed and Median Wage – CY 2016
|
|
|
|
|
| 10/30/2017 |
Iowa Insights |
Senate File 257 – Impact on the County Highways
|
|
|
|
|
| 10/30/2017 |
Iowa Insights |
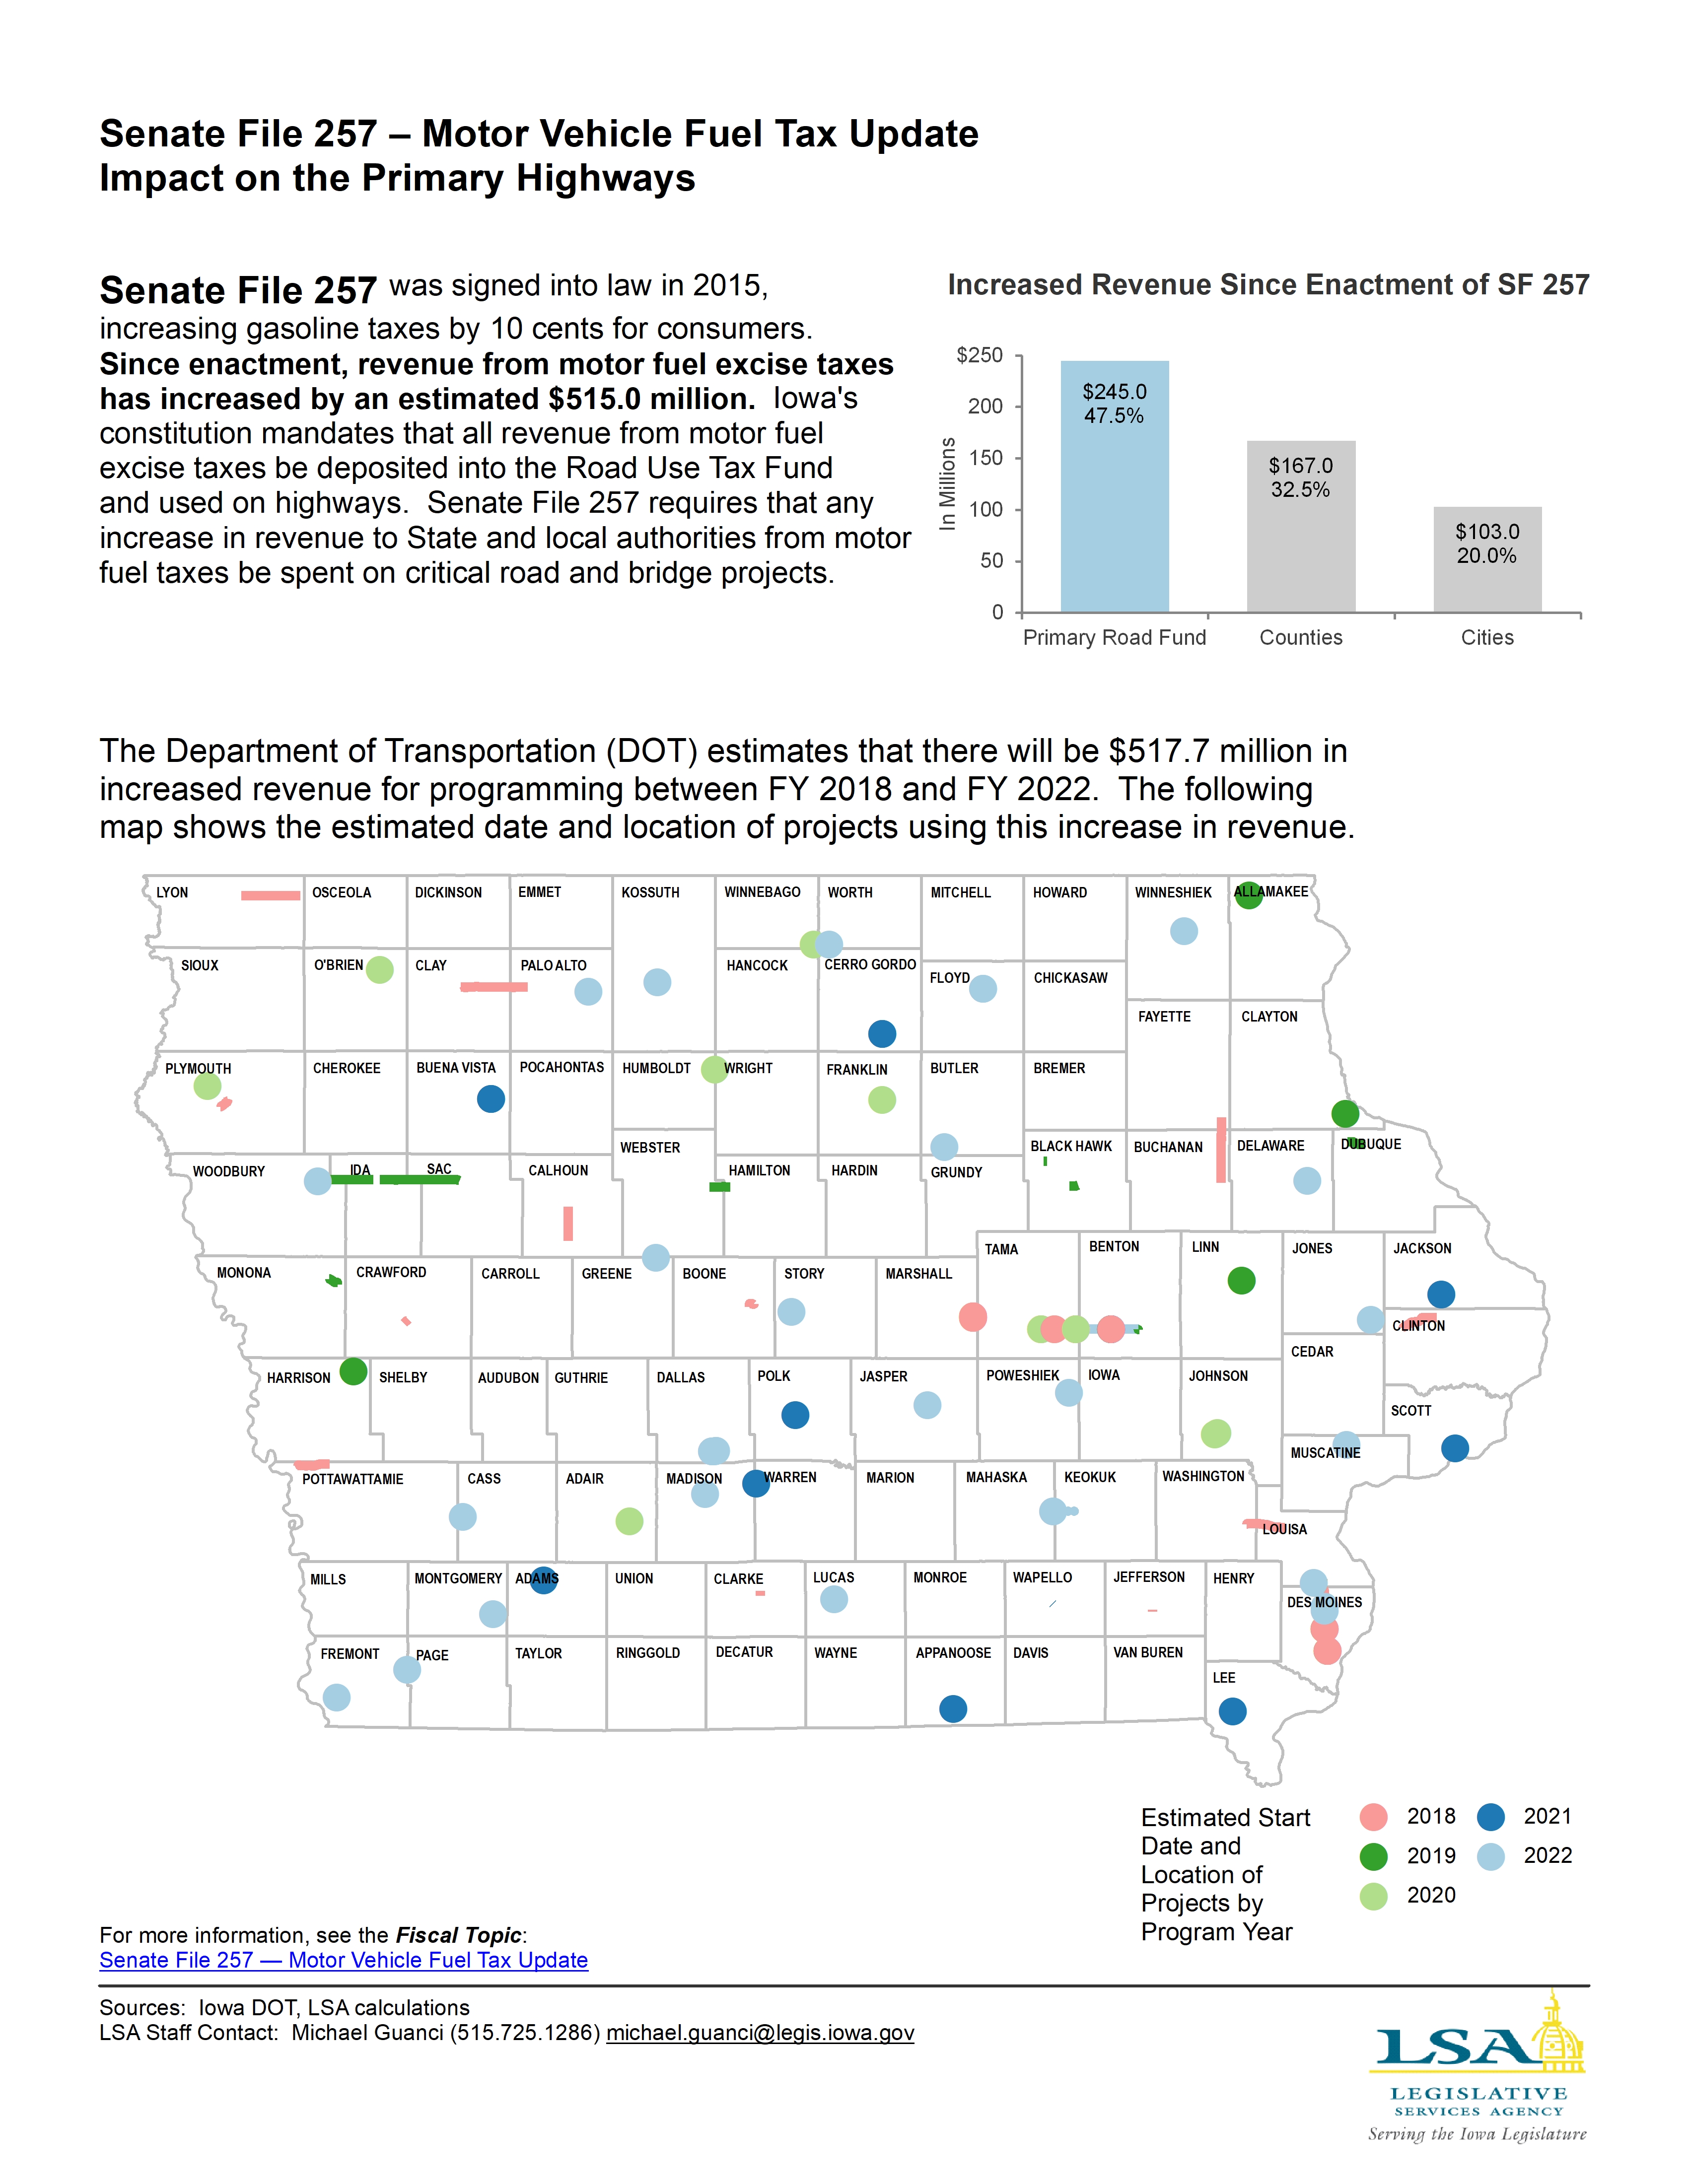
Senate File 257 – Impact on the Primary Highways
|
|
|
|
|
| 10/23/2017 |
Iowa Insights |
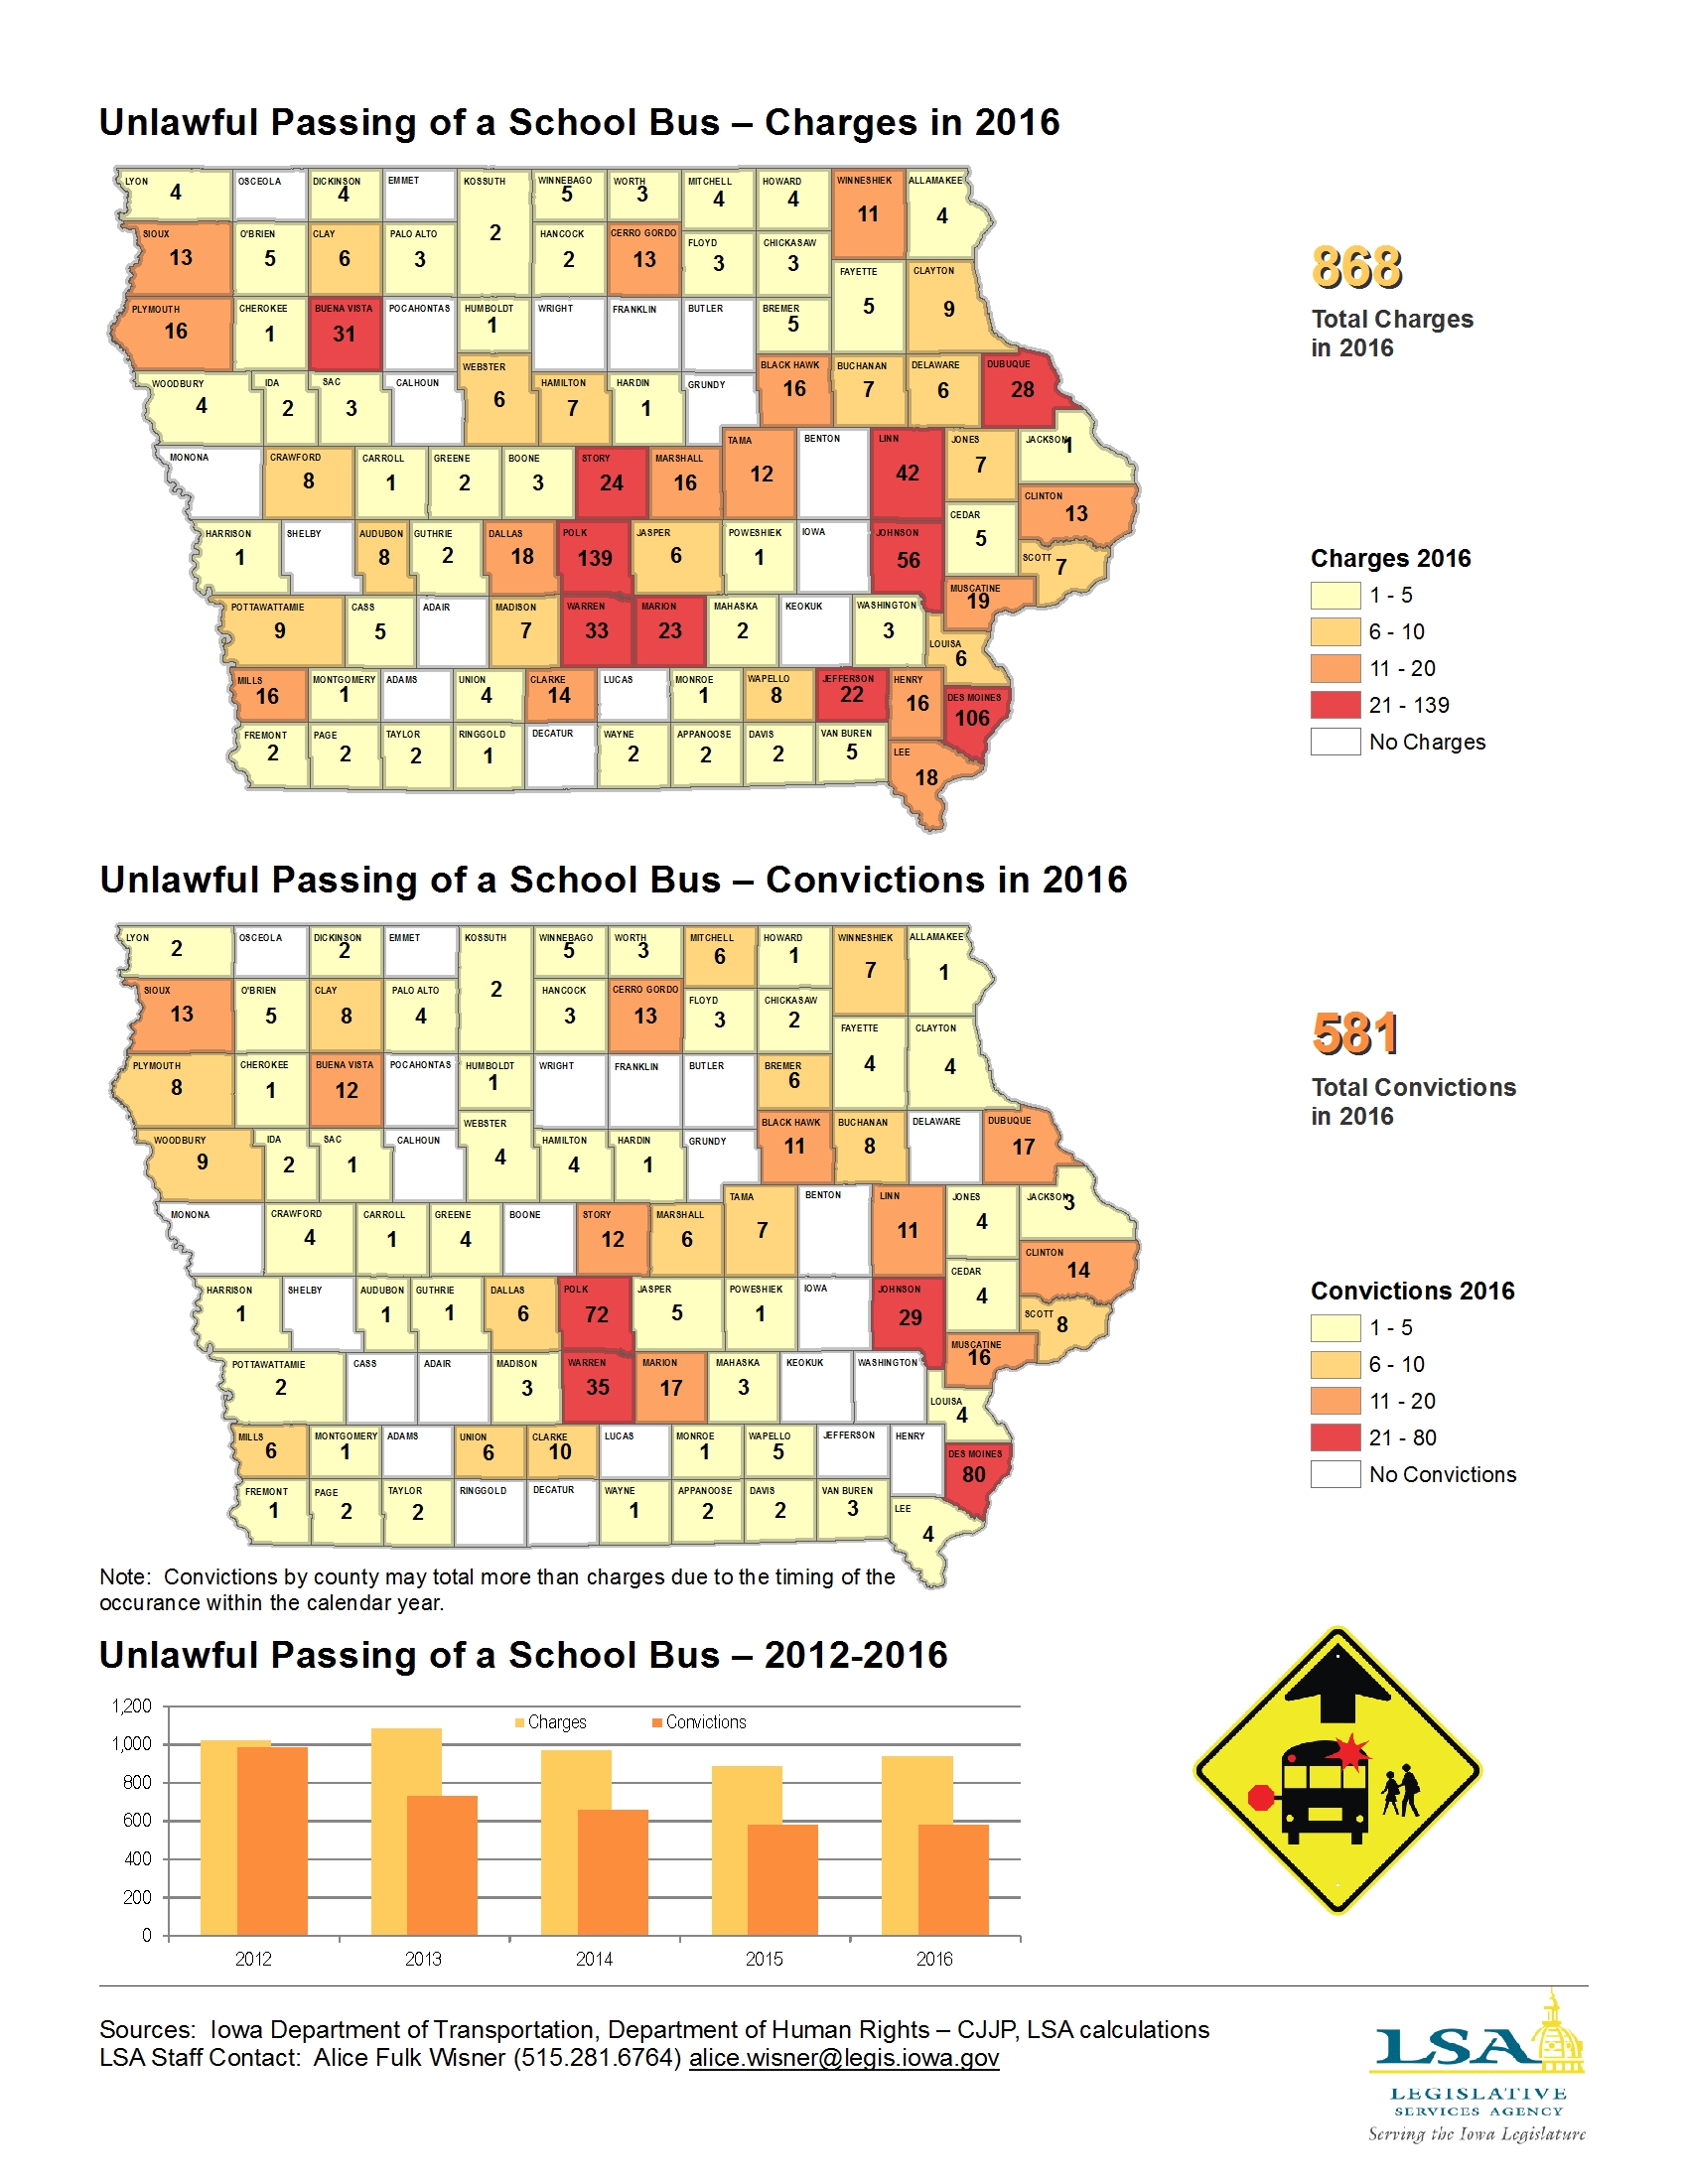
Unlawful Passing of a School Bus Charges and Convictions – 2016
|
|
|
|
|
| 10/16/2017 |
Iowa Insights |
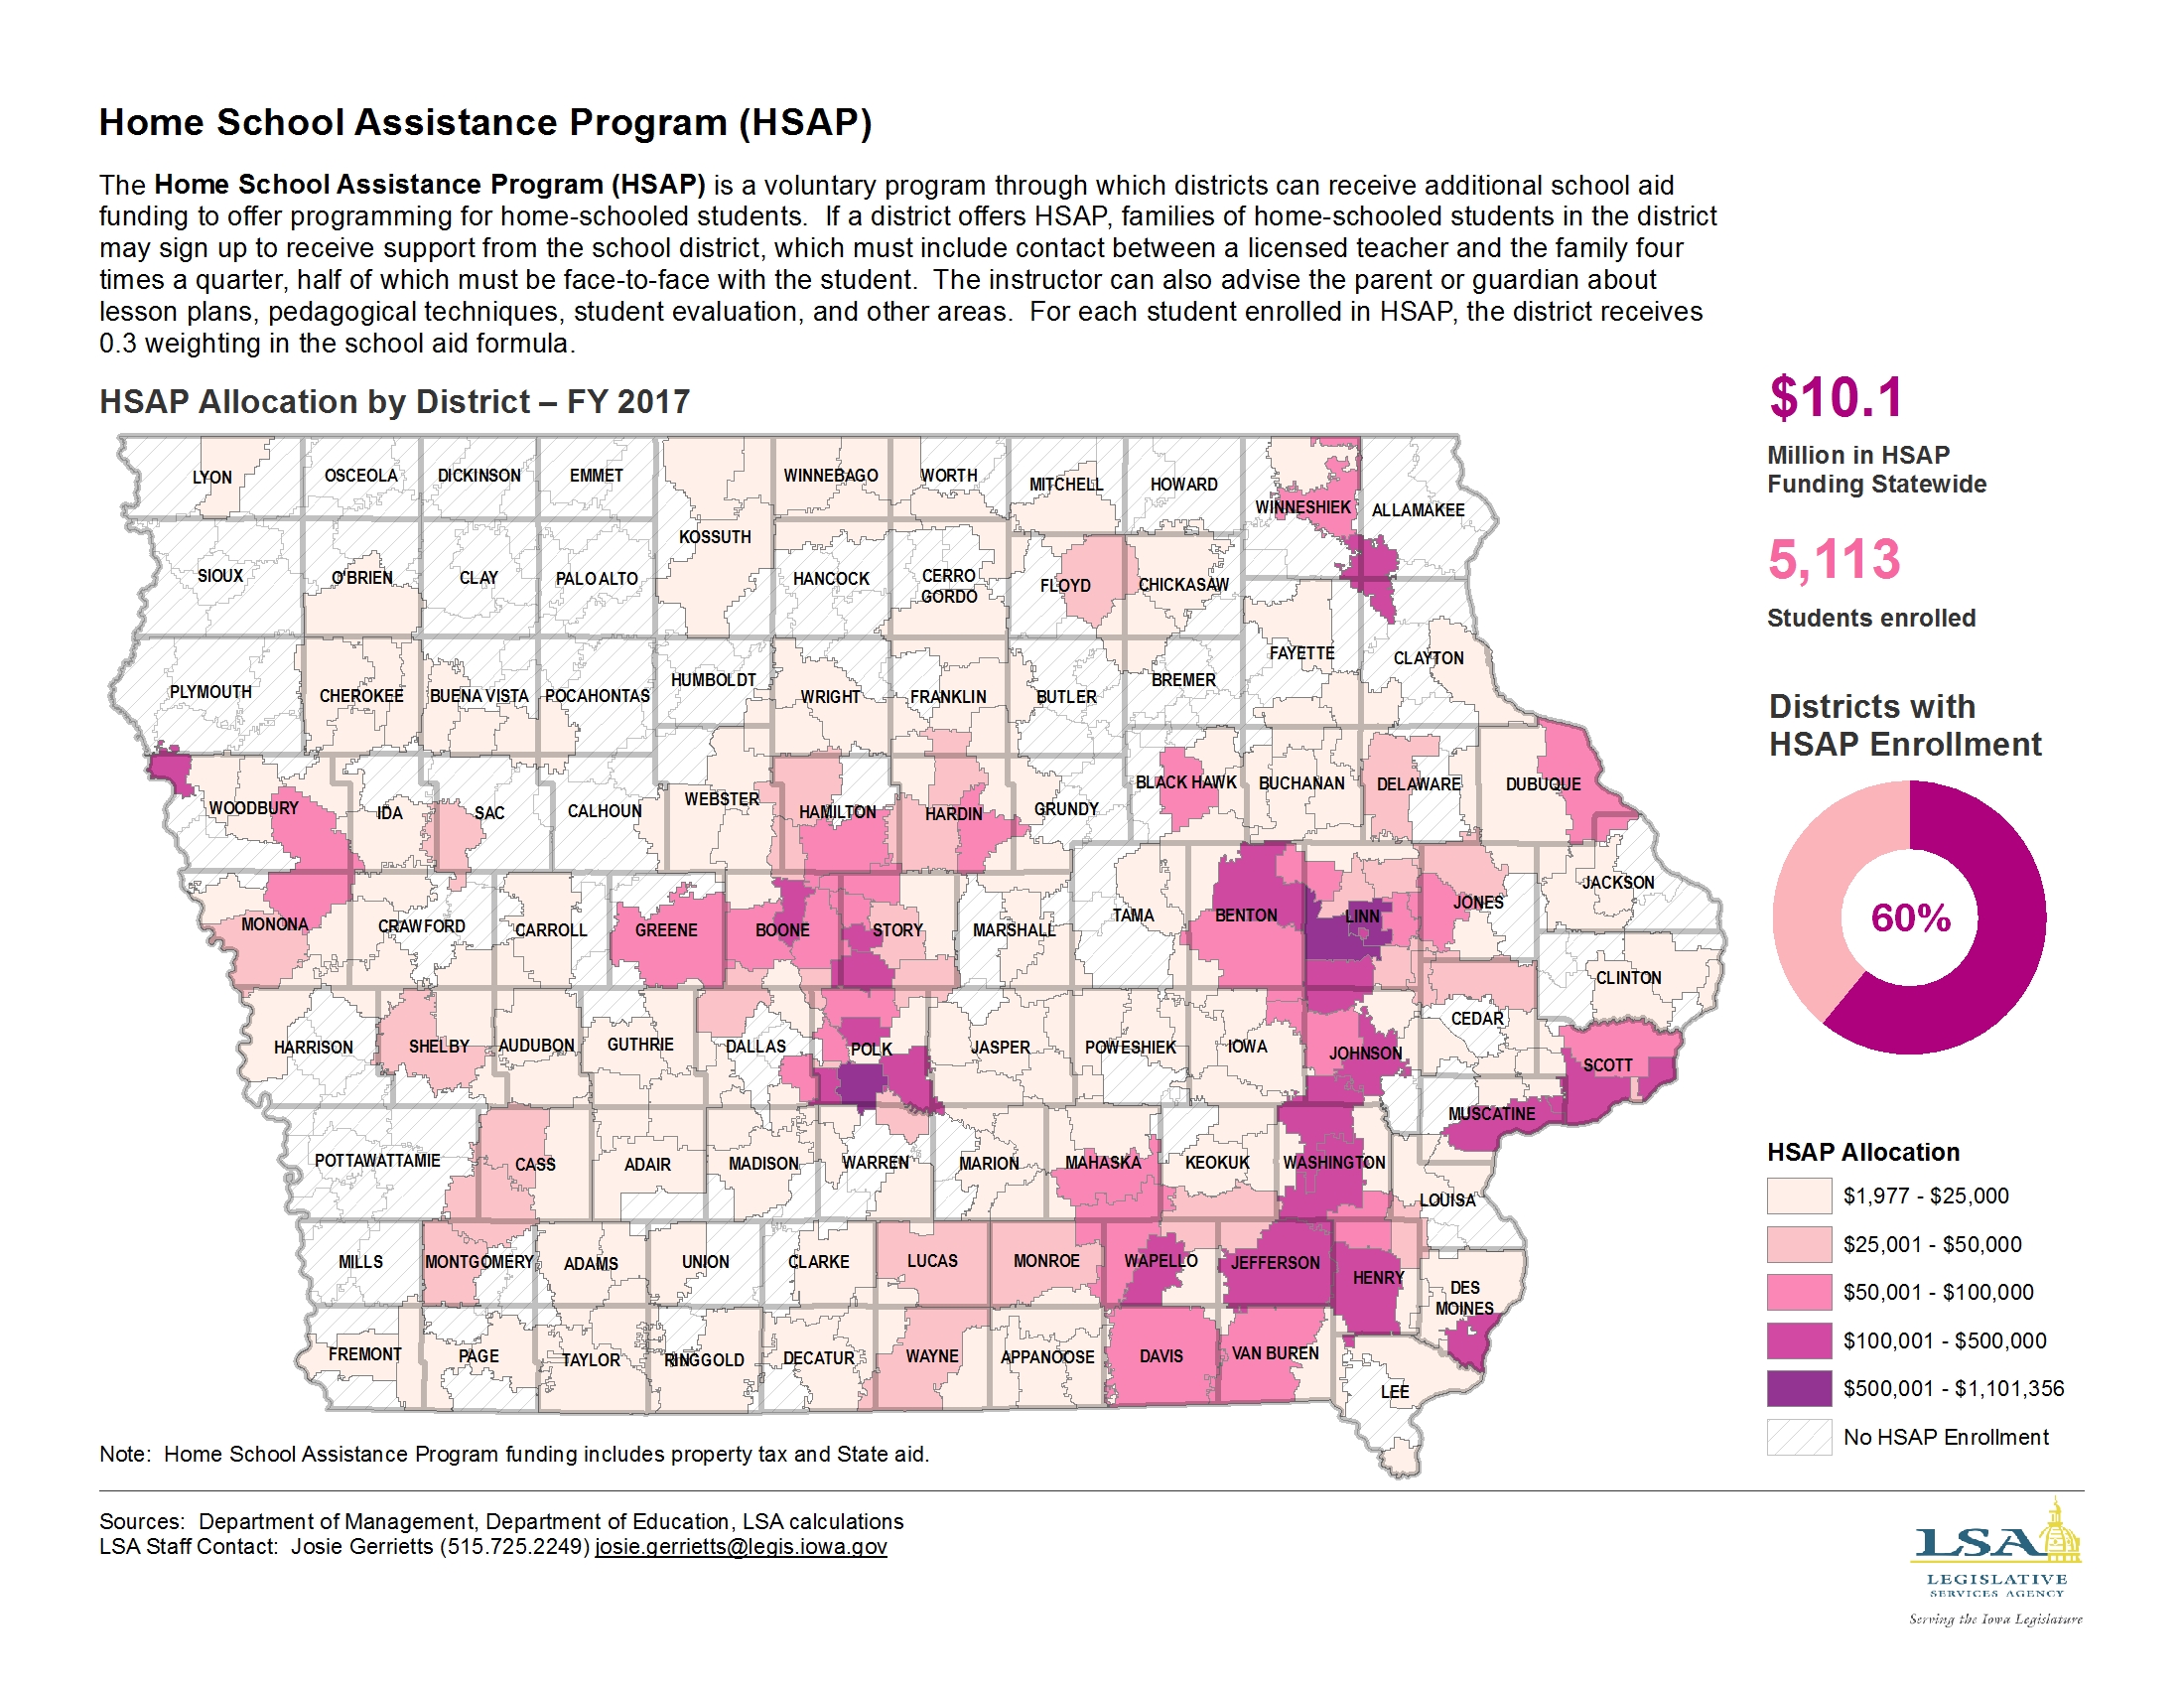
Home School Assistance Program (HSAP) – FY 2017
|
|
|
|
|
| 10/09/2017 |
Iowa Insights |
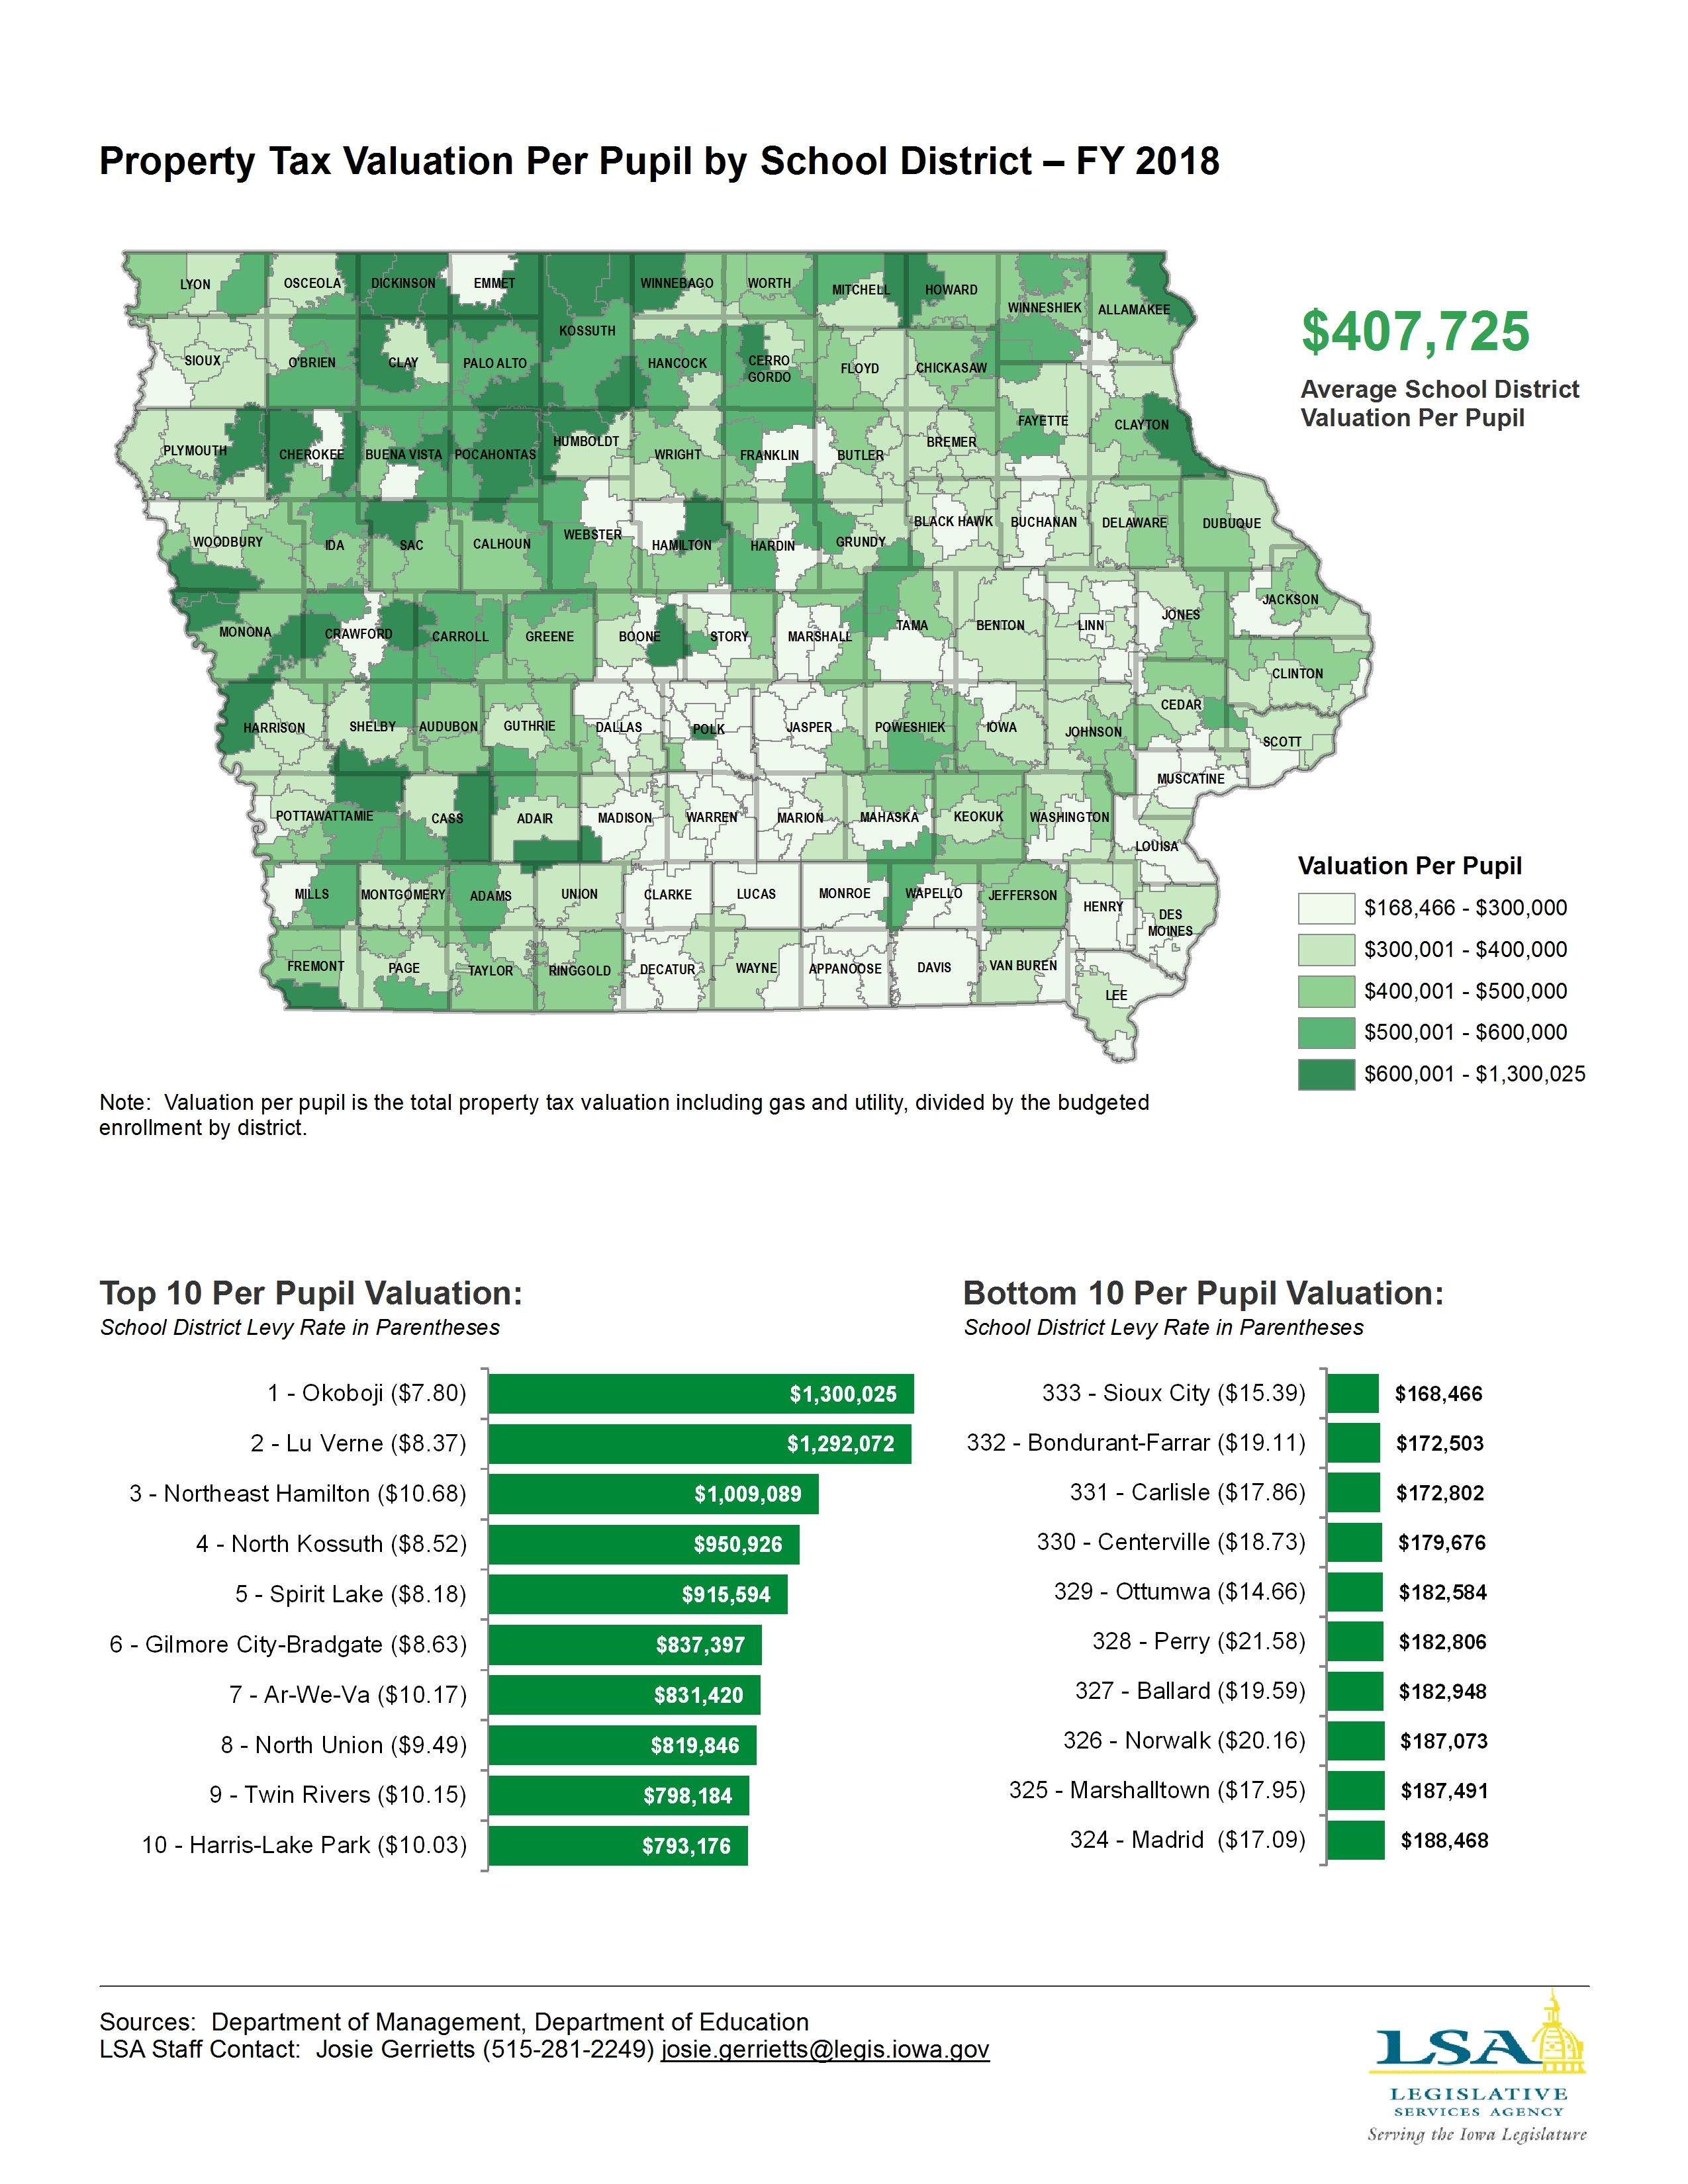
Property Valuation Per Pupil by School District – FY 2018
|
|
|
|
|
| 10/02/2017 |
Iowa Insights |
Total School District Levy Rate – FY 2018

|
|
|
|
|
| 09/25/2017 |
Iowa Insights |
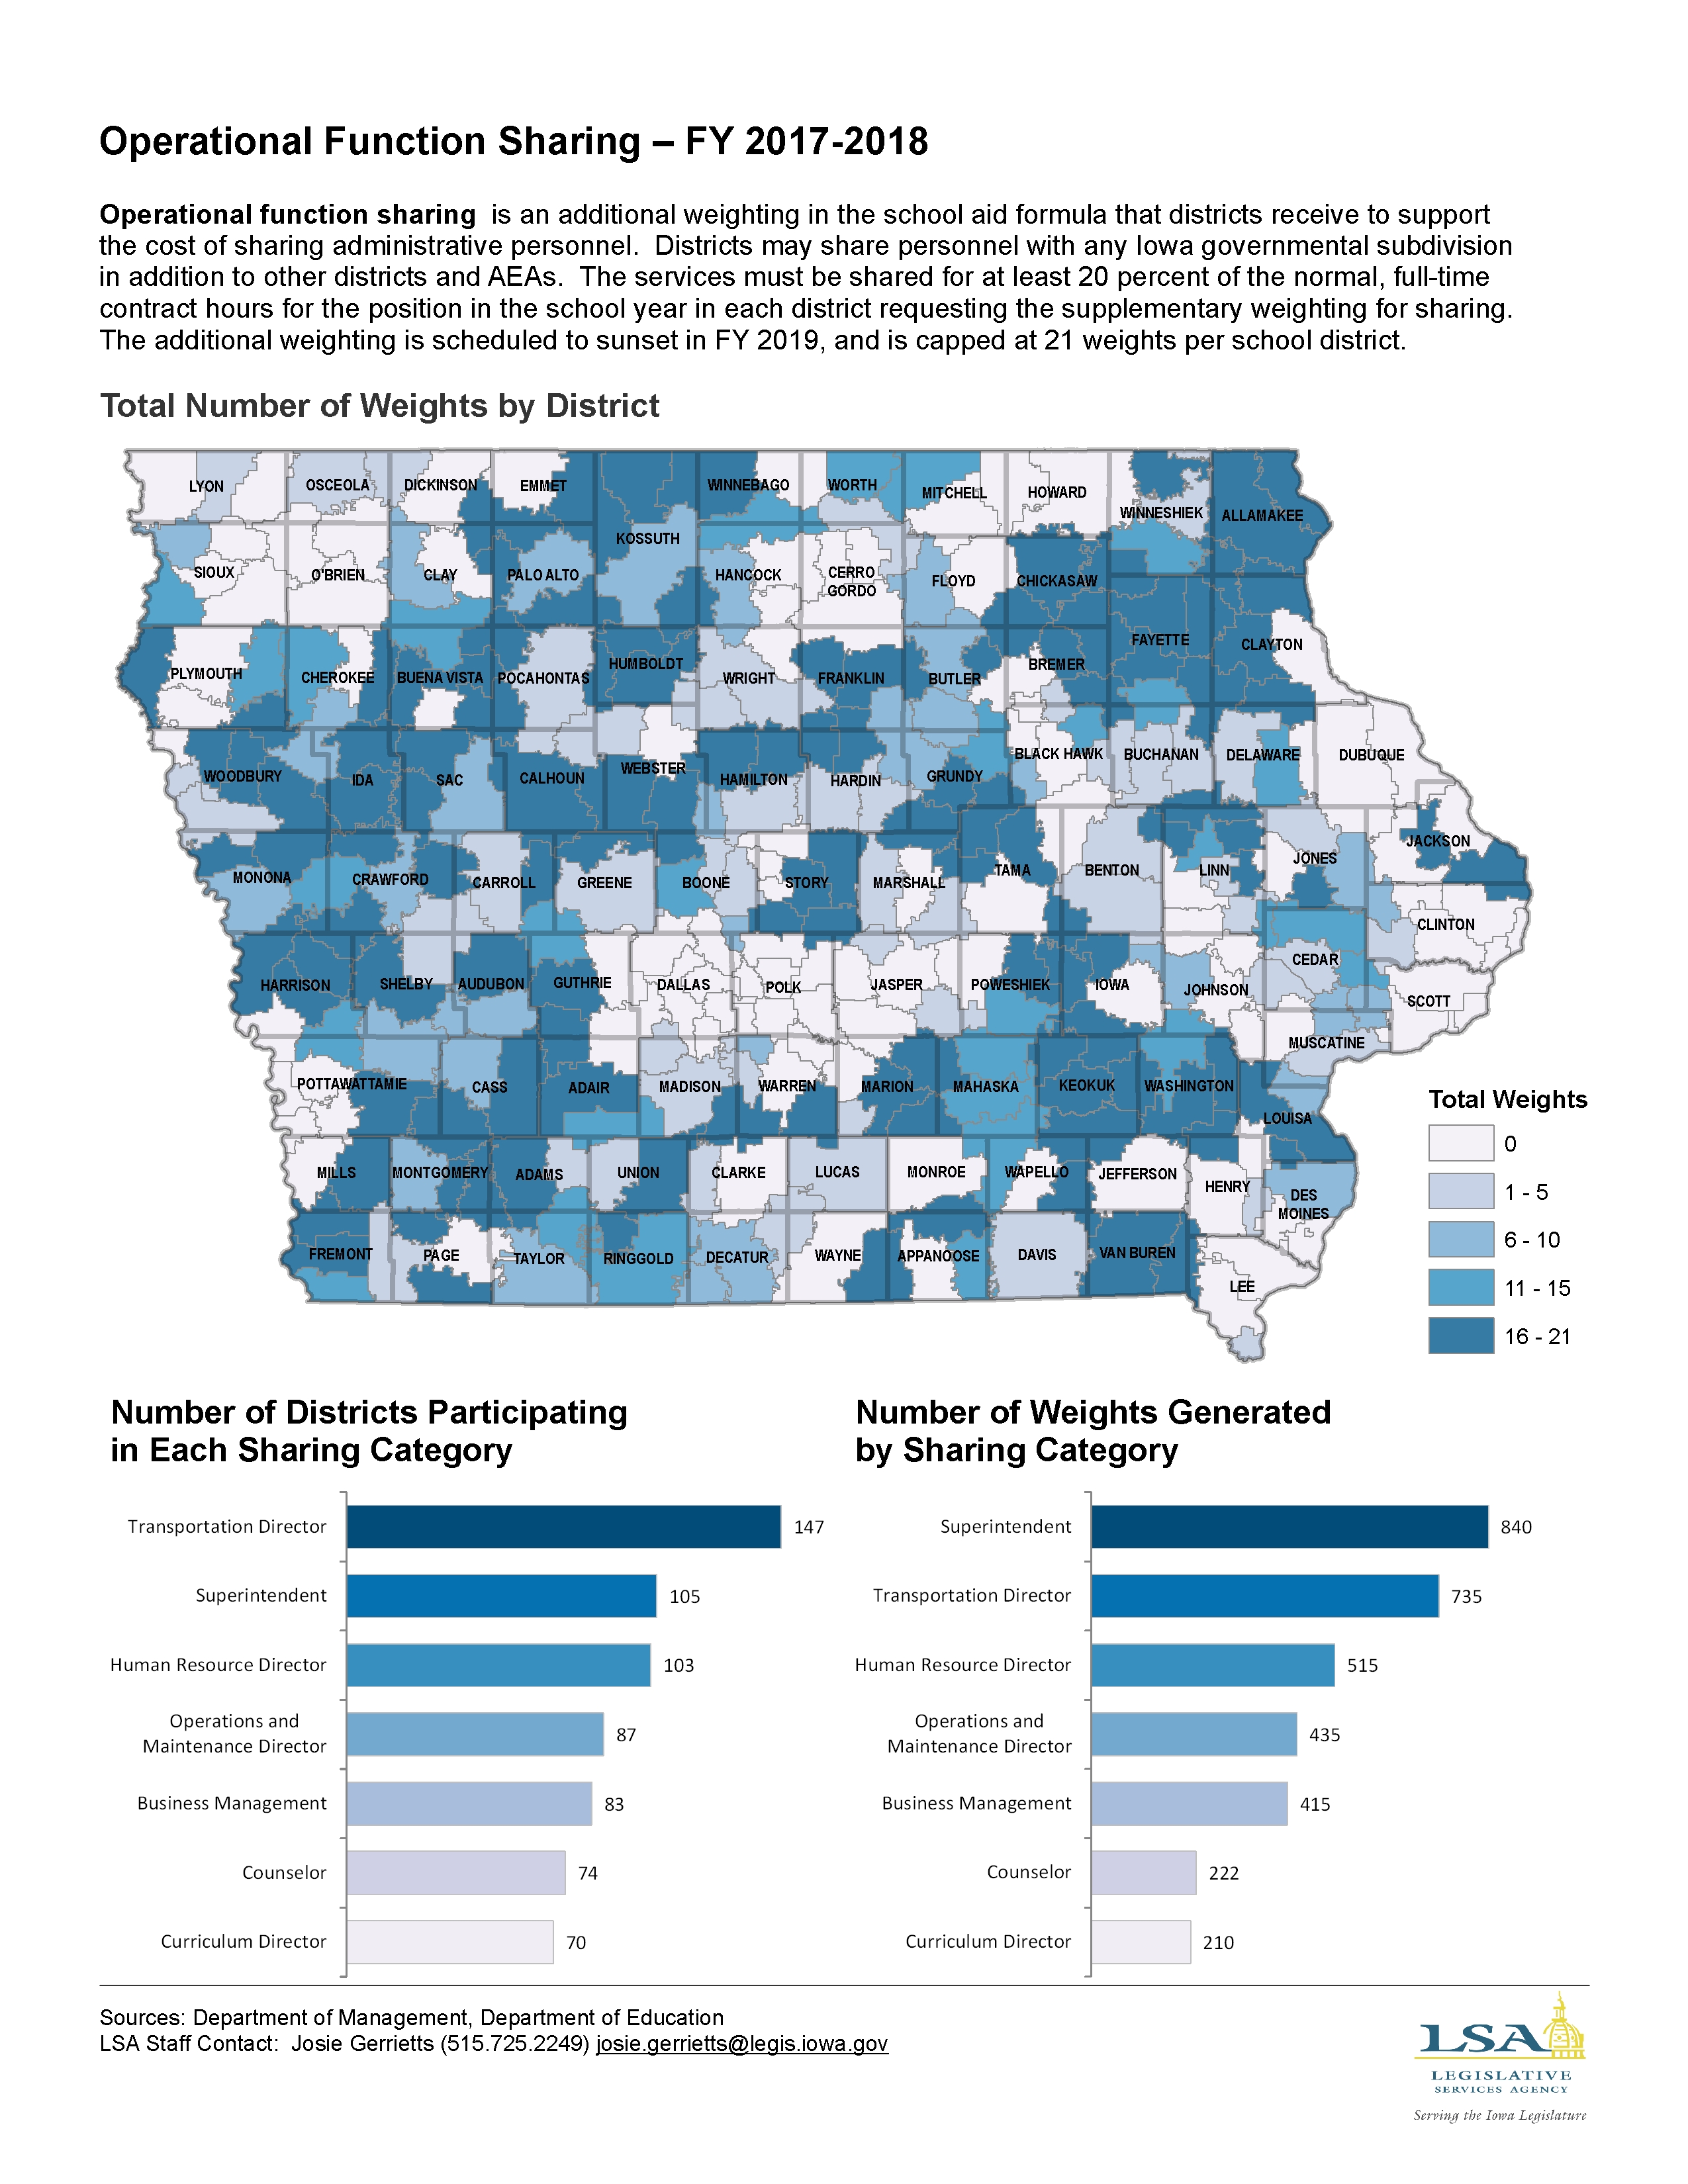
Operational Function Sharing – FY 2017-2018
|
|
|
|
|
| 09/18/2017 |
Iowa Insights |
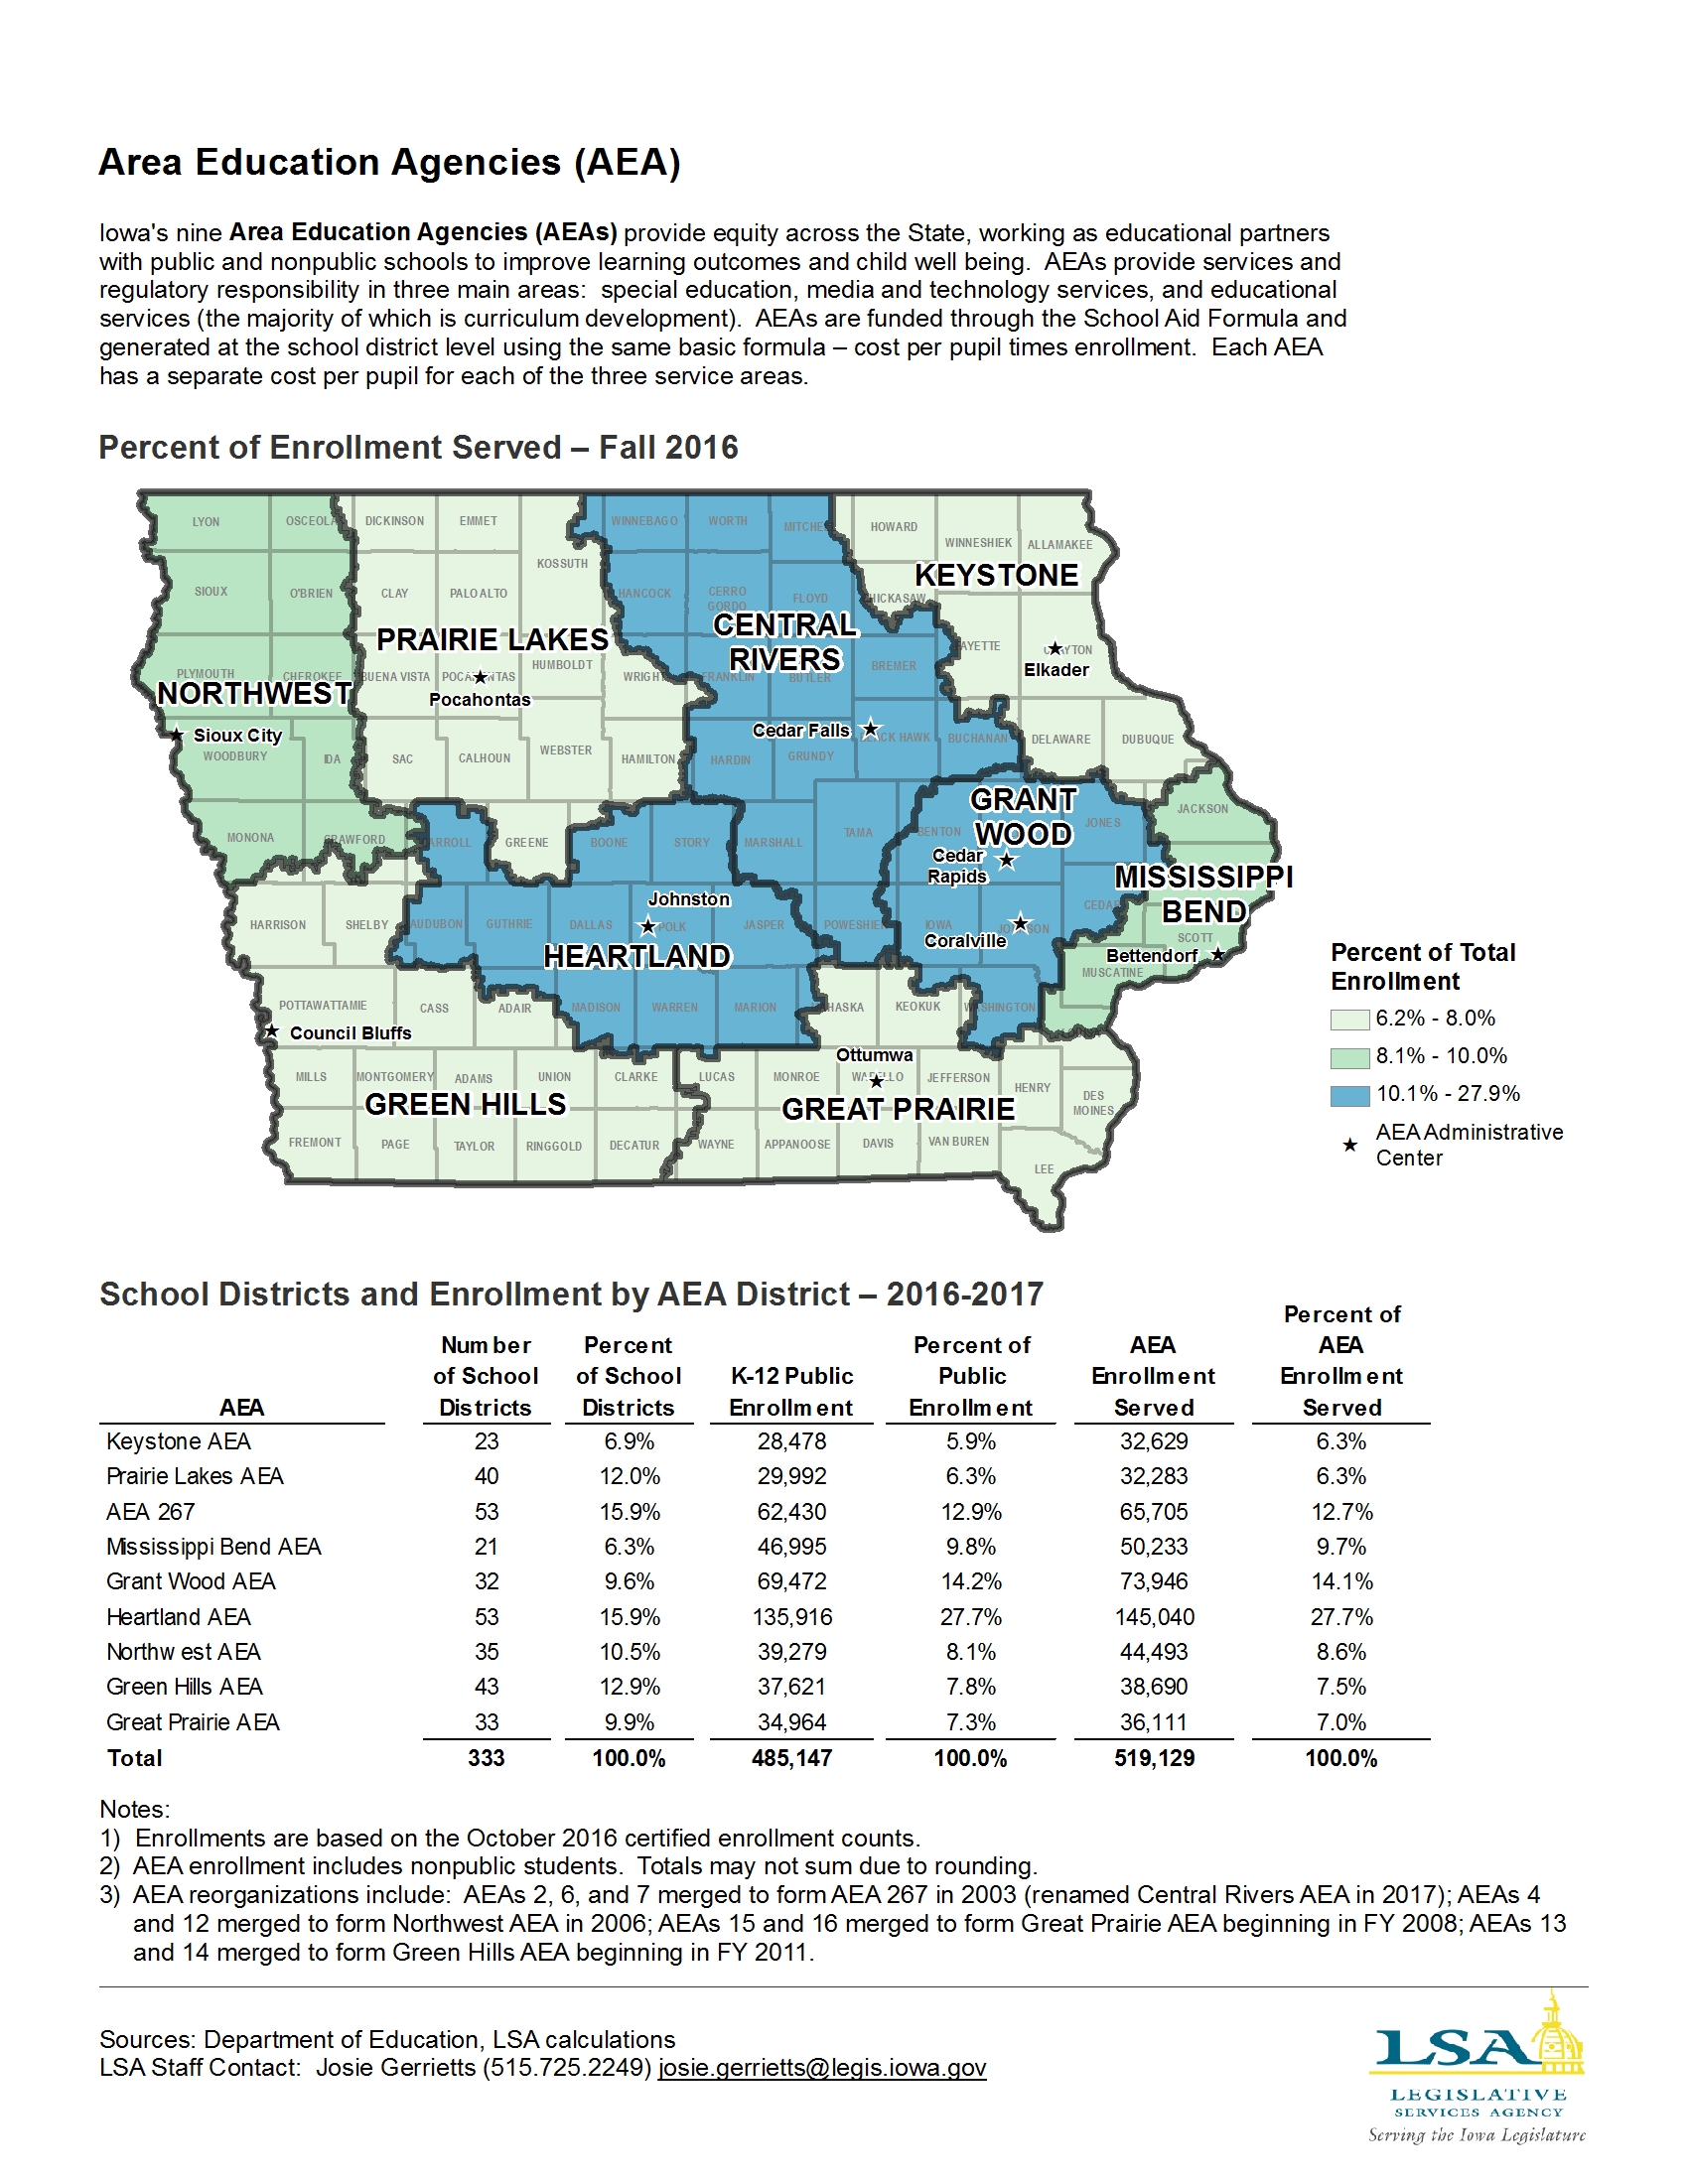
Enrollment Served by Area Education Agency – Fall 2016
|
|
|
|
|
| 09/11/2017 |
Iowa Insights |
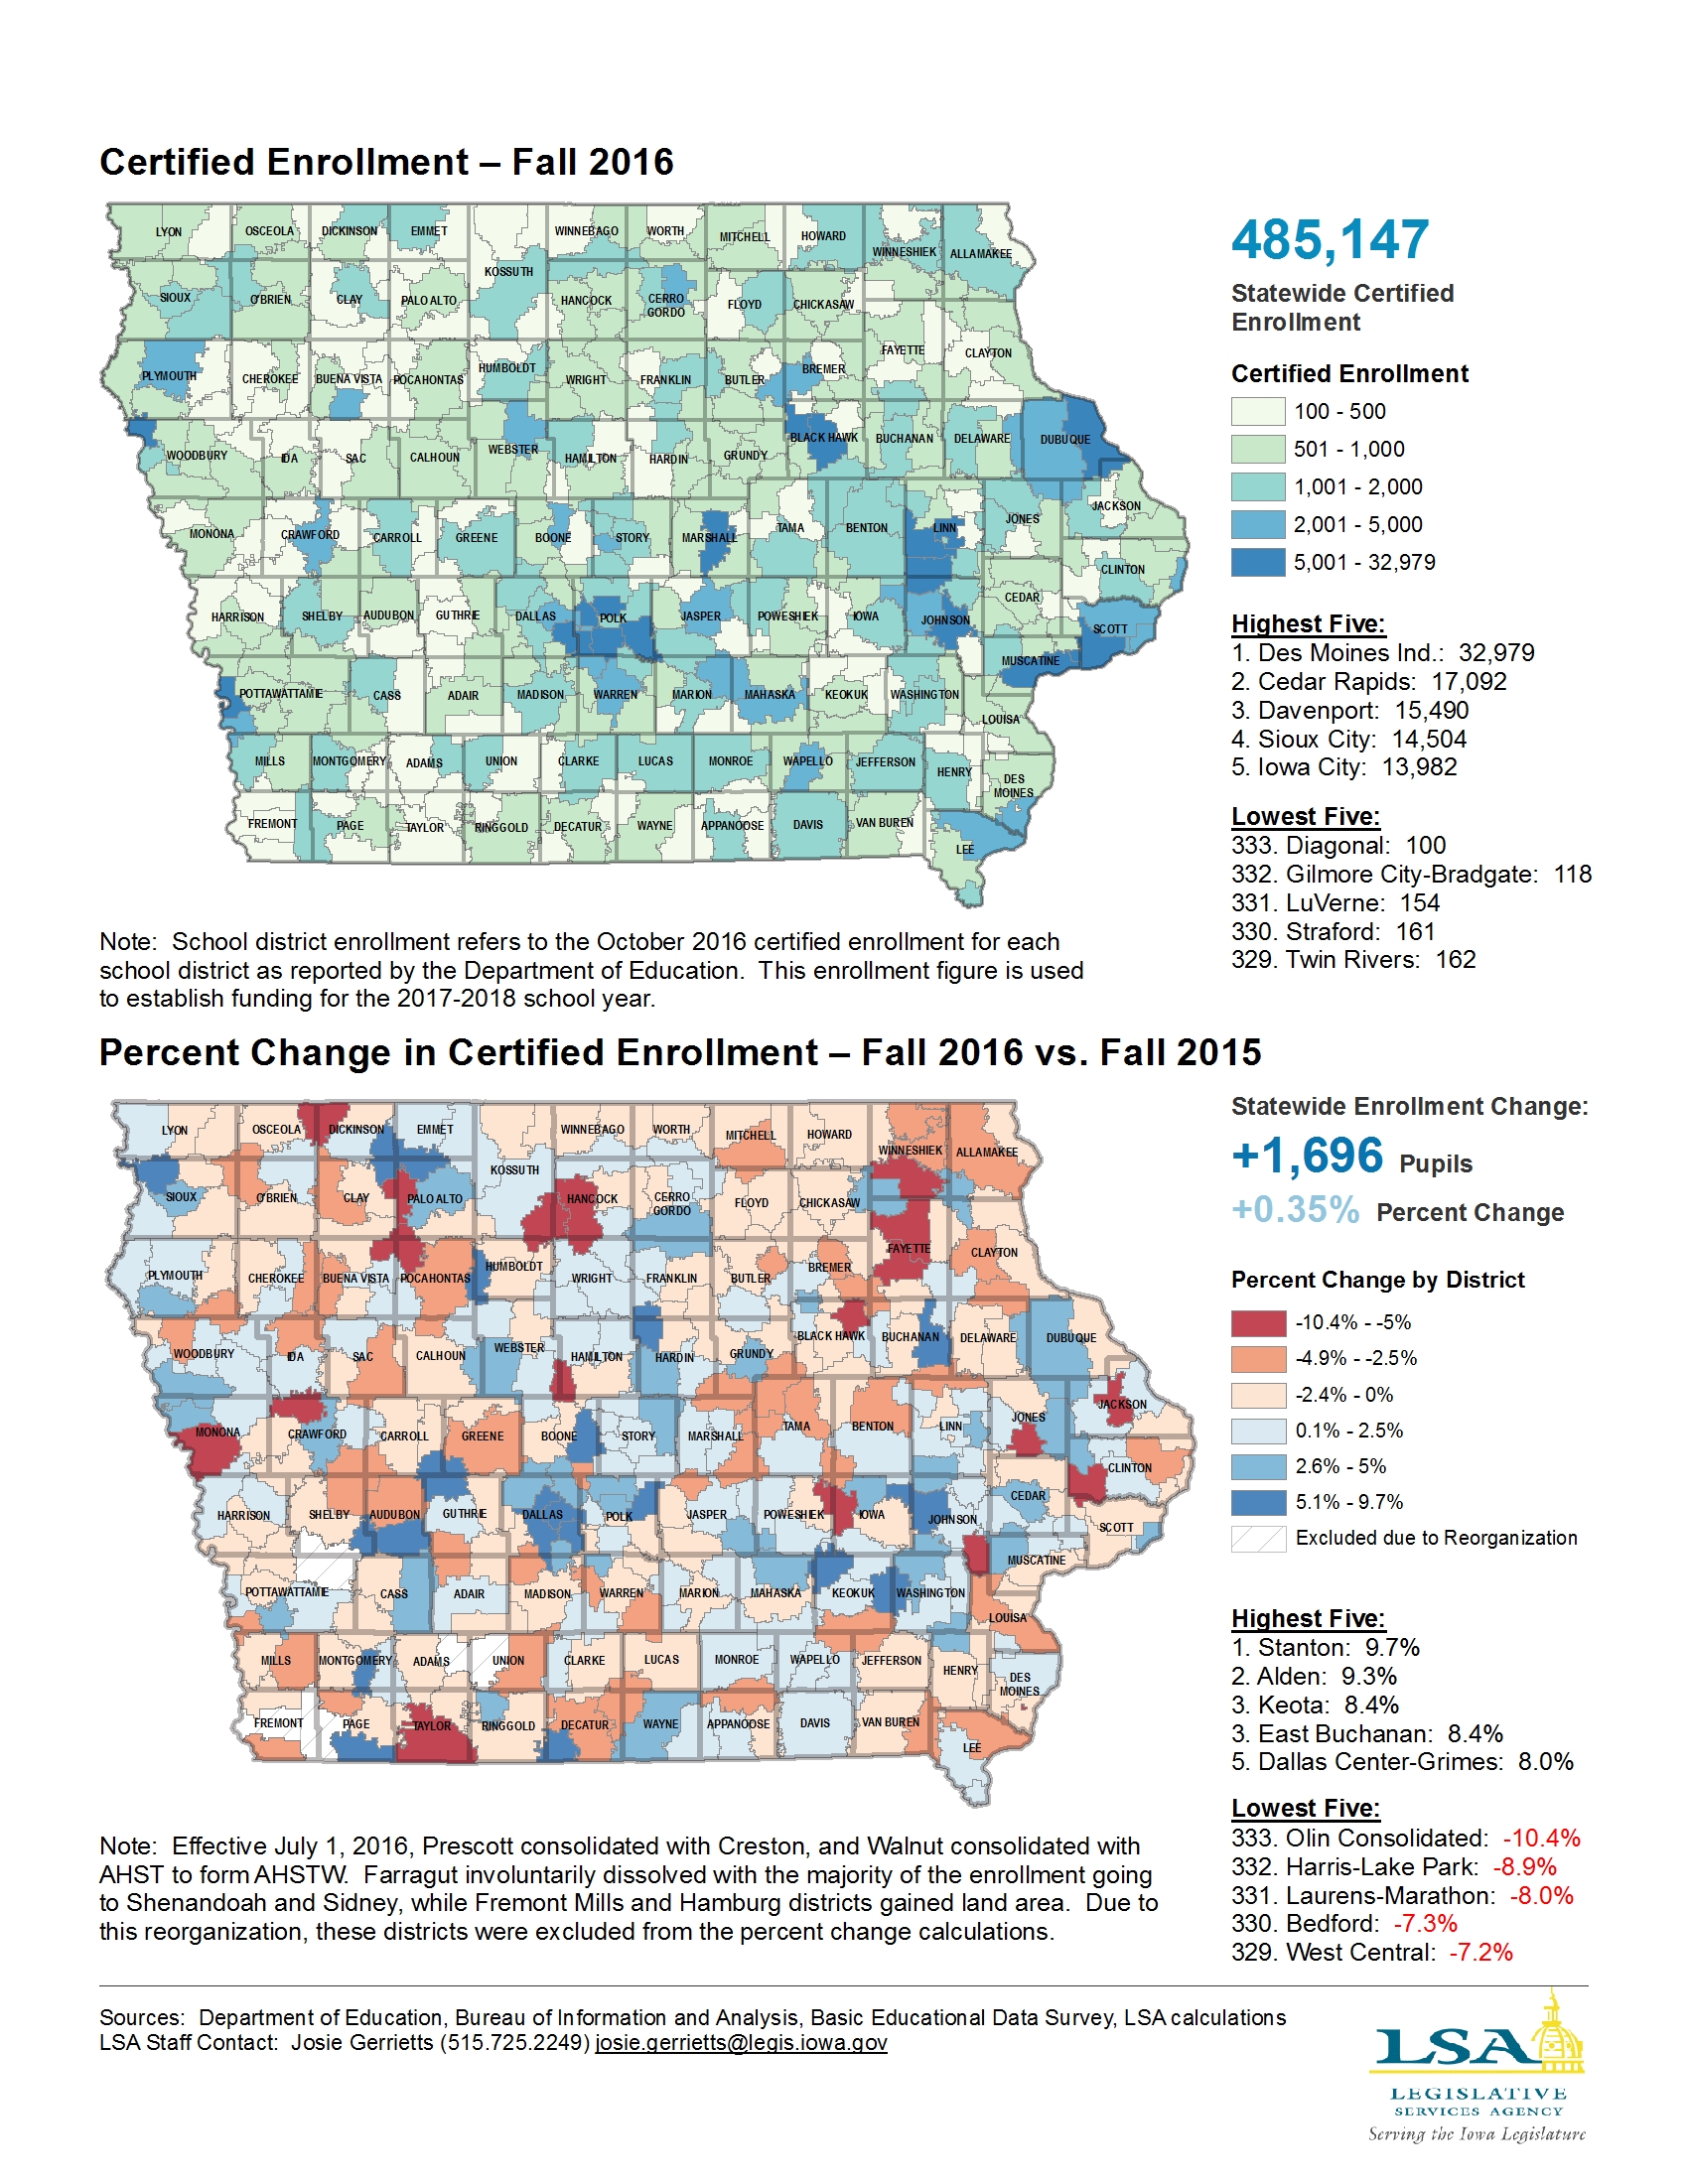
Certified Enrollment by School District – 2016-2017
|
|
|
|
|
| 09/05/2017 |
Iowa Insights |
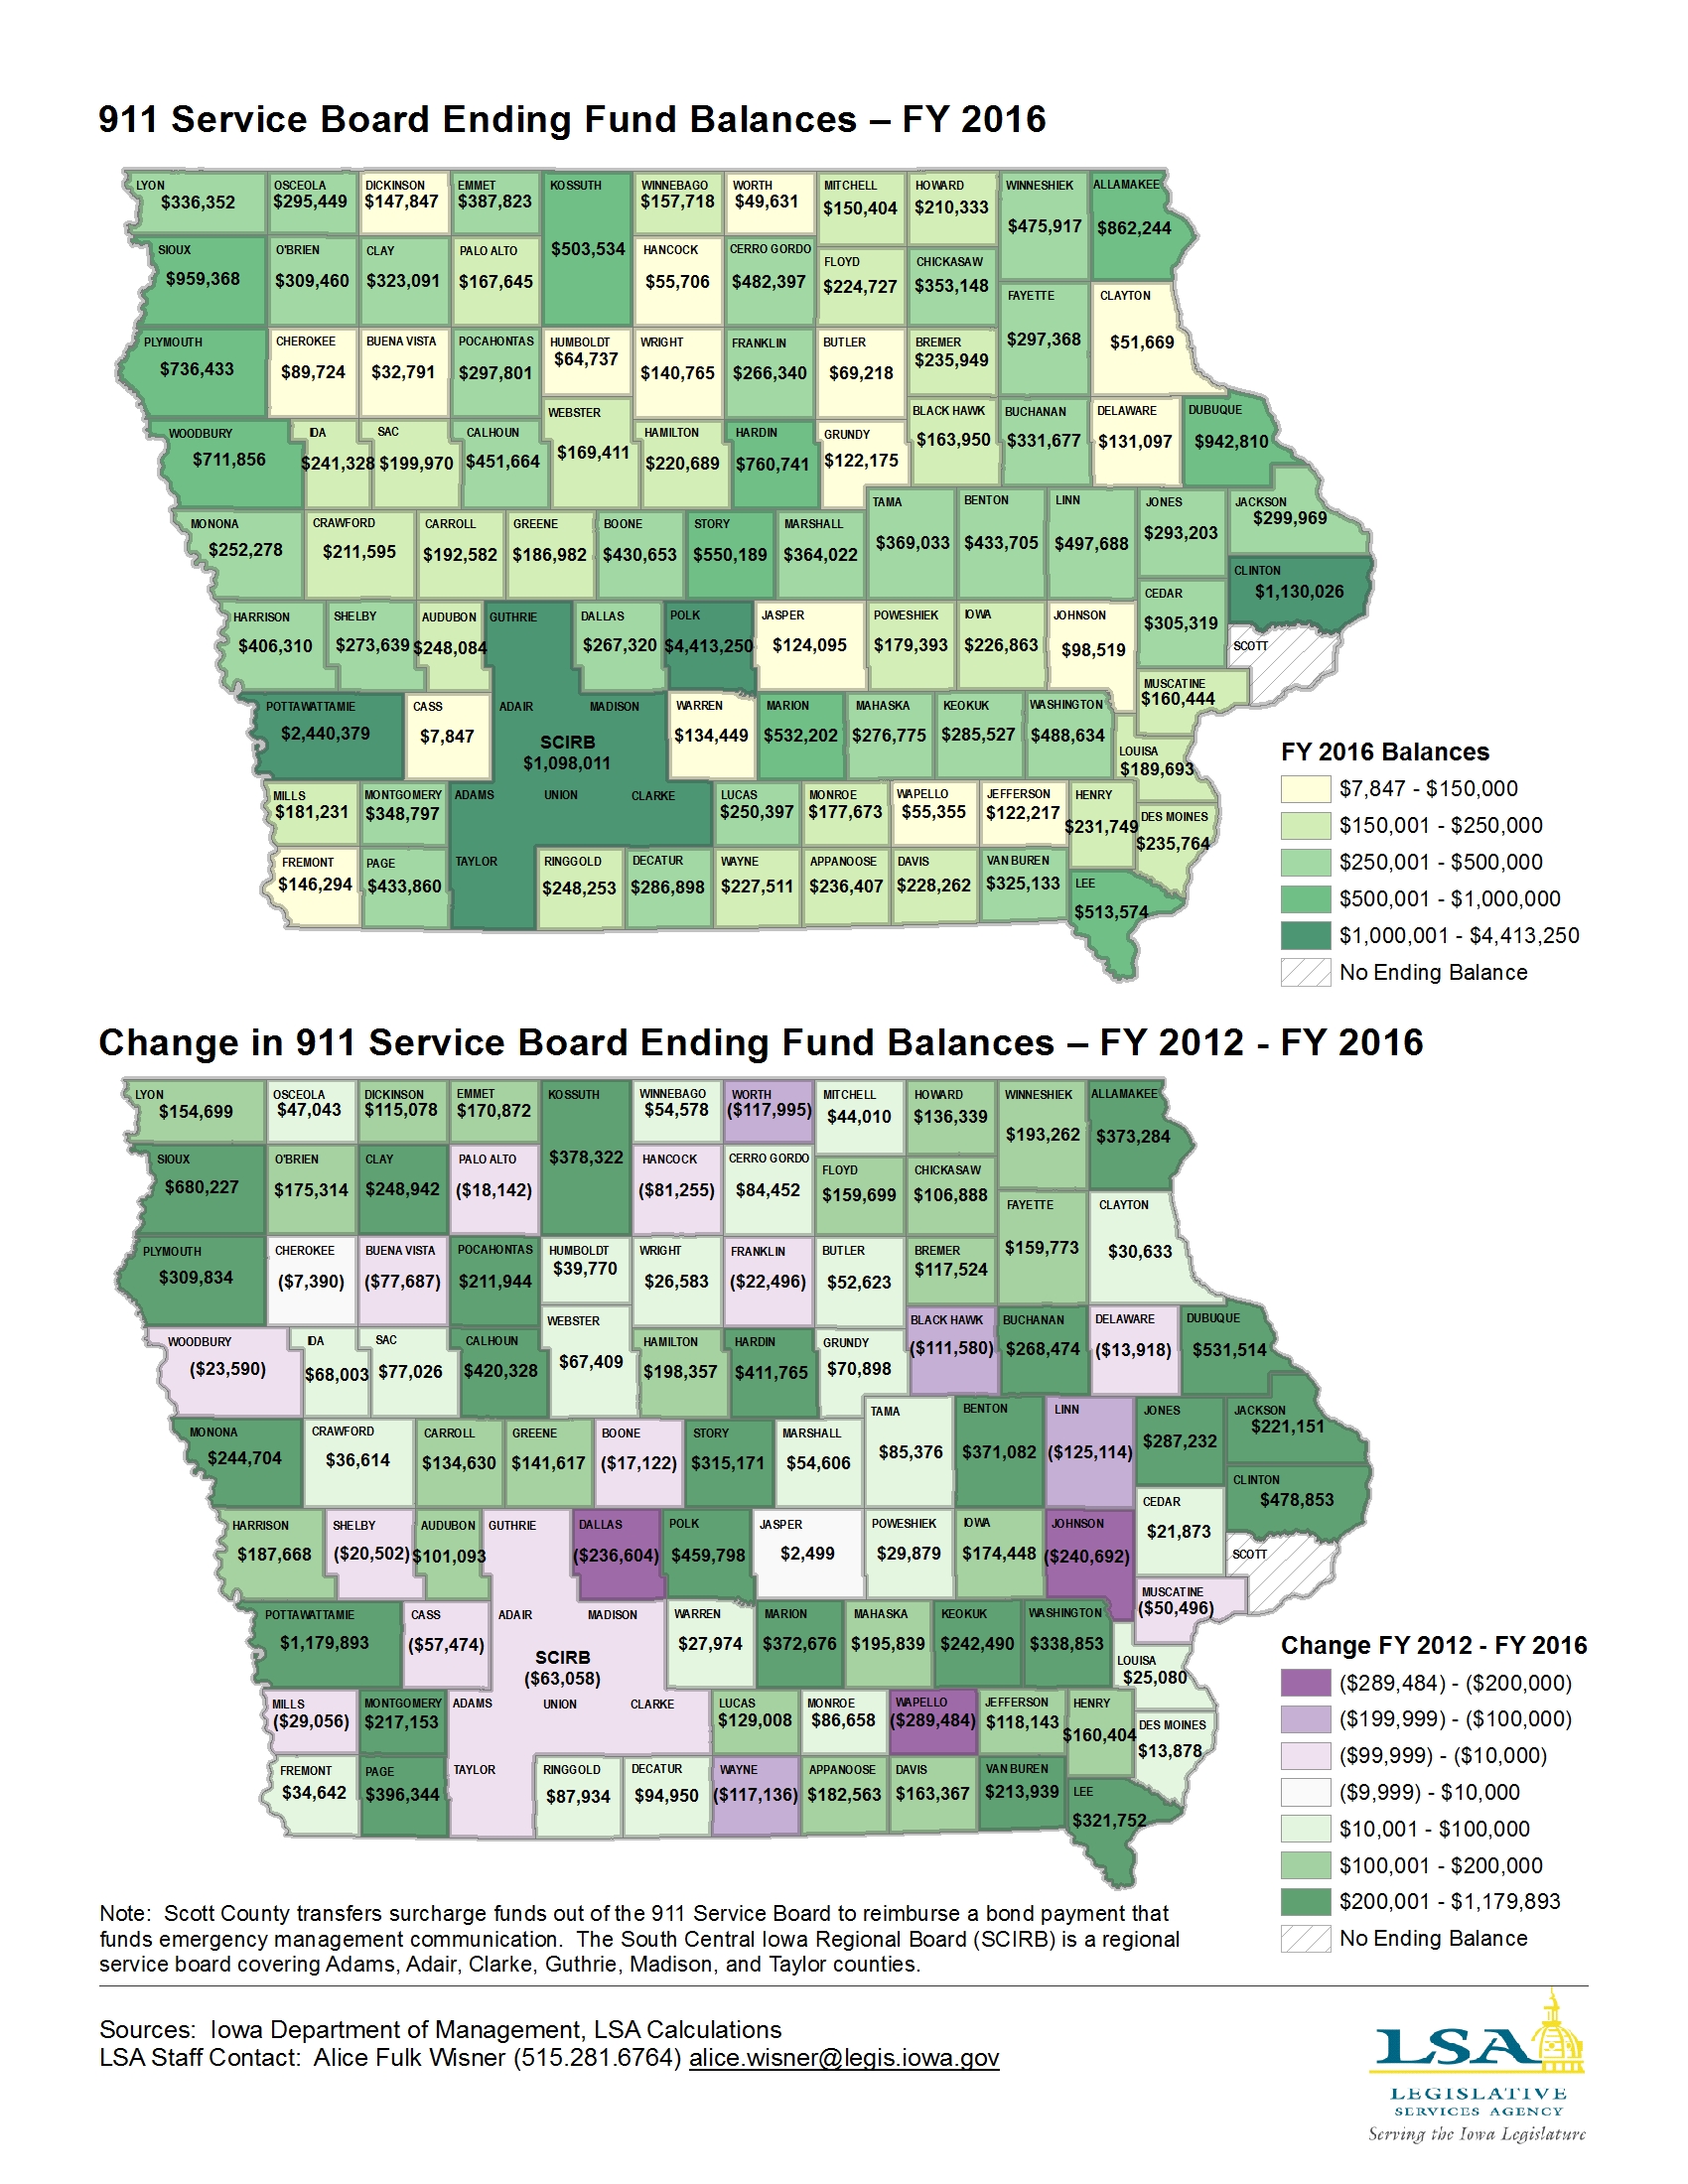
911 Service Board Ending Fund Balances – FY 2016
|
|
|
|
|
| 08/30/2017 |
Iowa Insights |
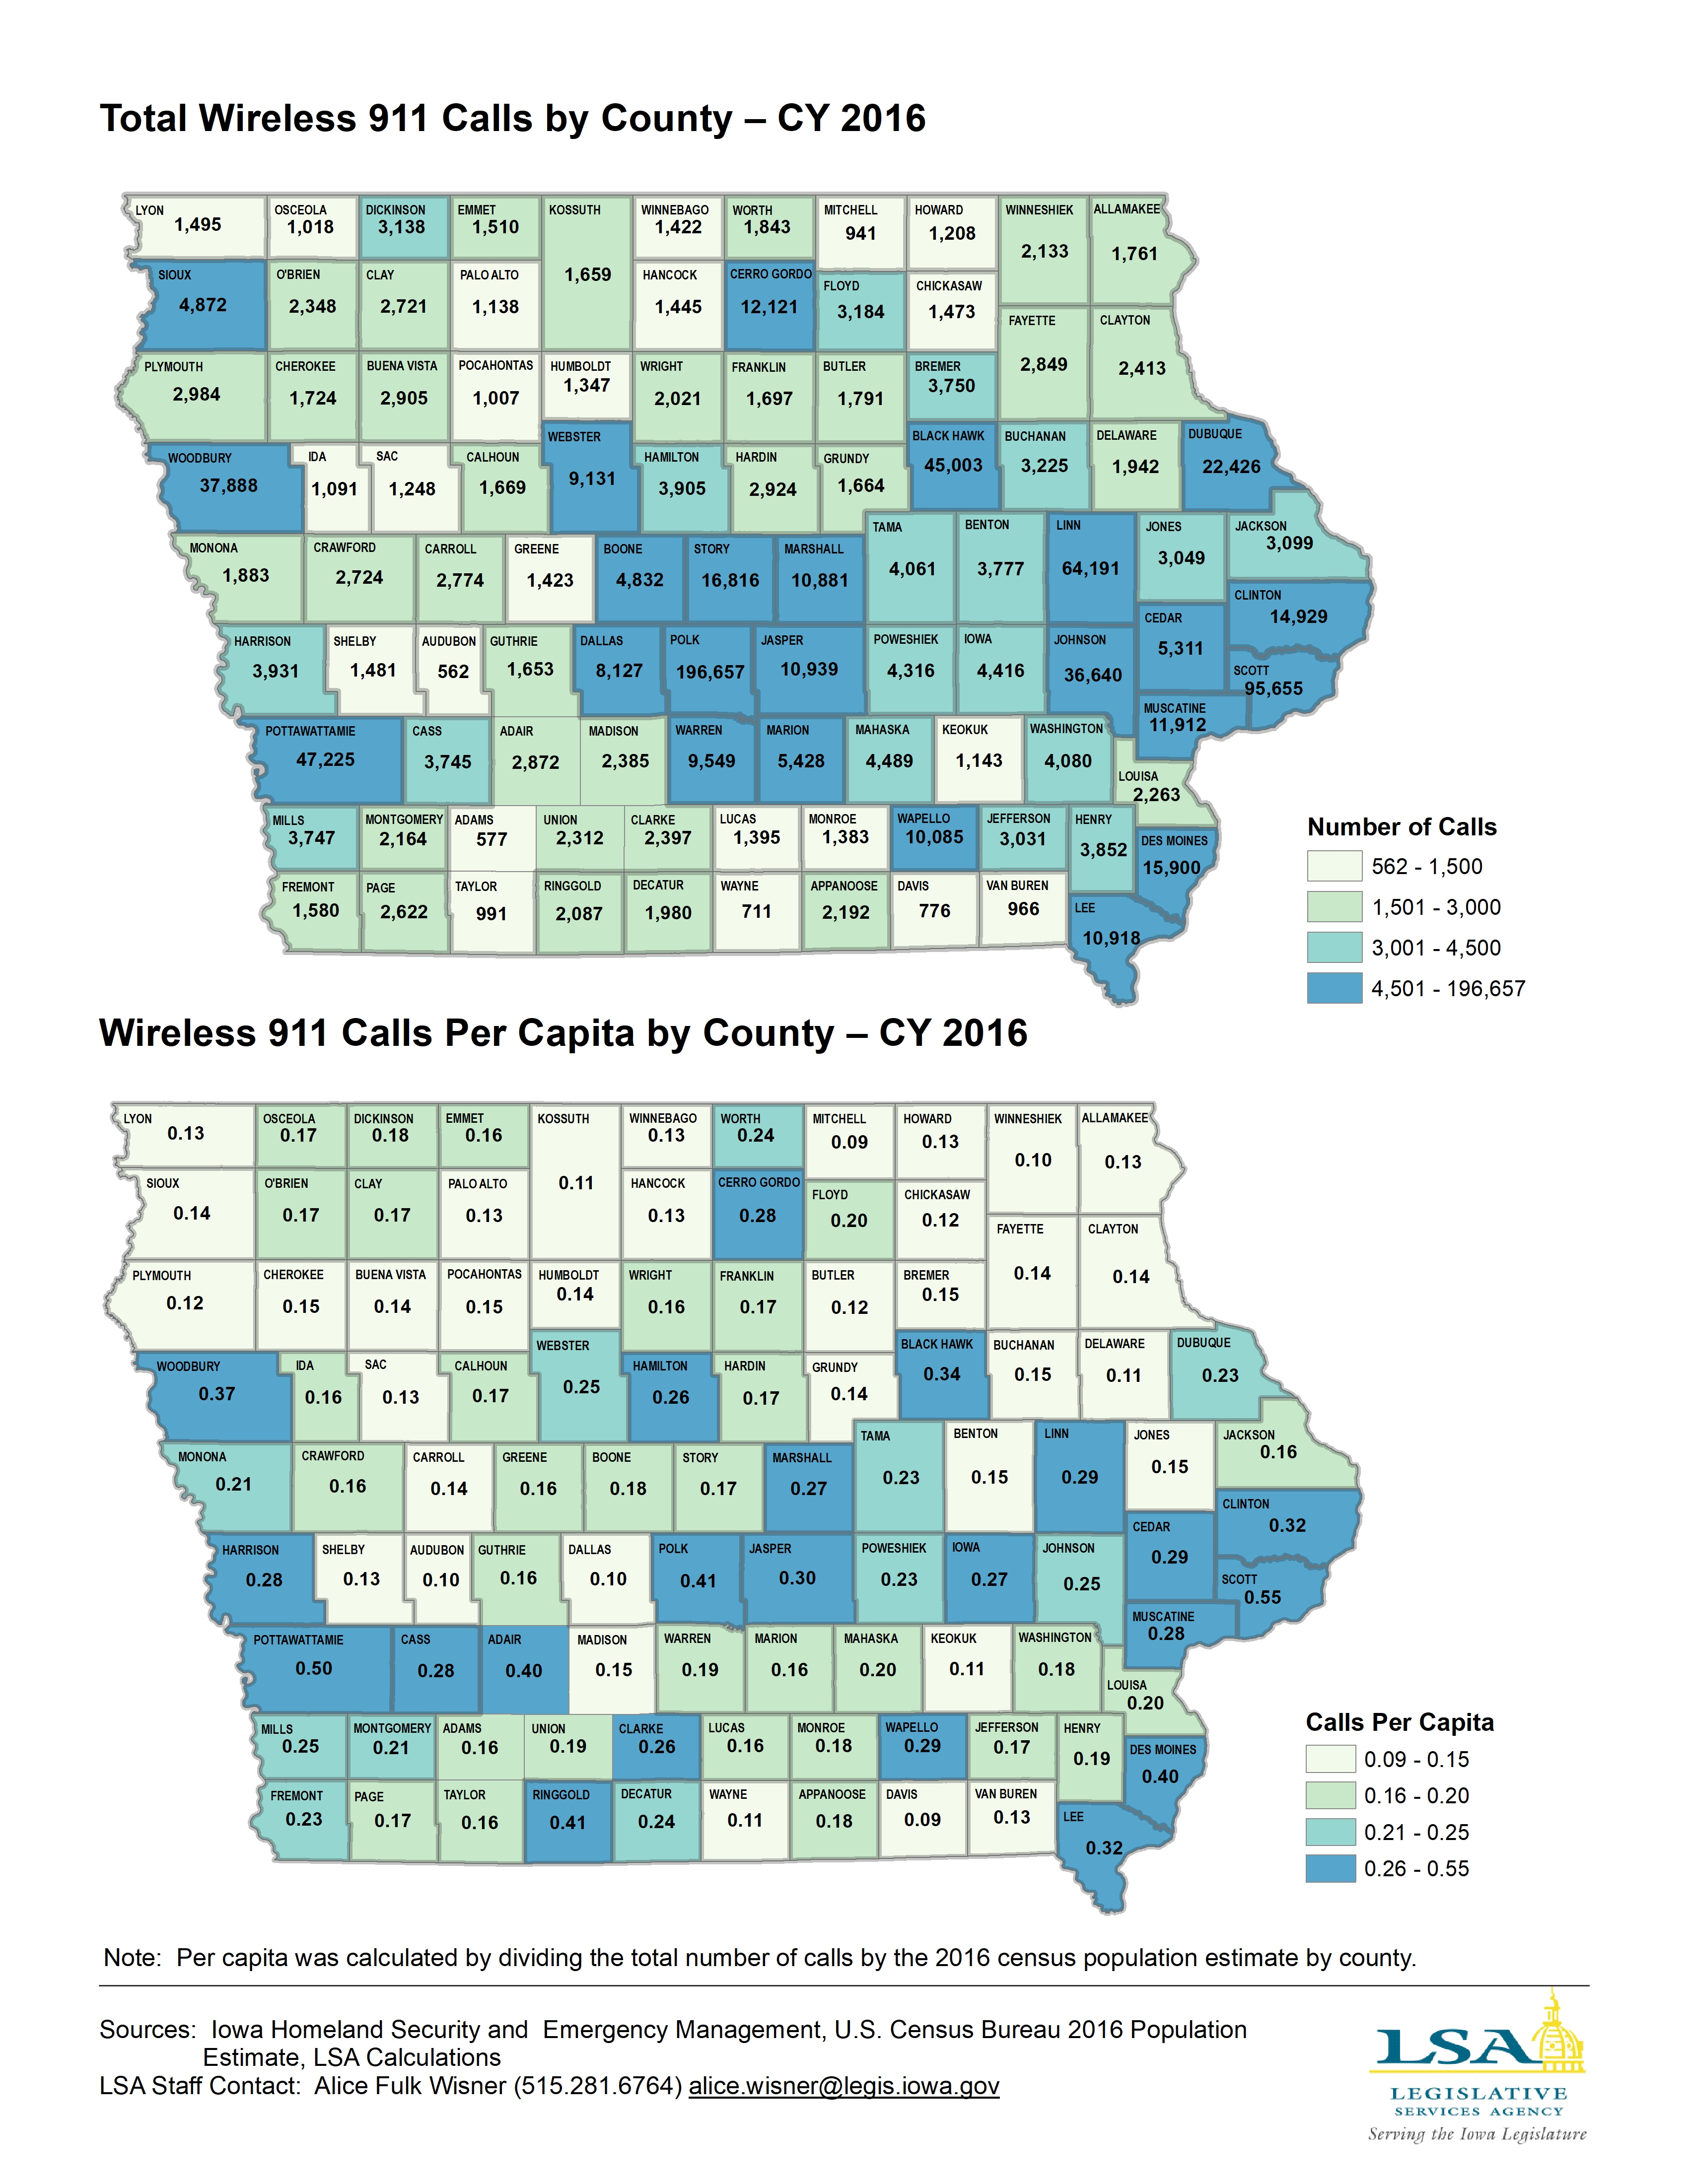
Total Wireless 911 Calls by County — CY 2016
|
|
|
|
|
| 08/21/2017 |
Iowa Insights |
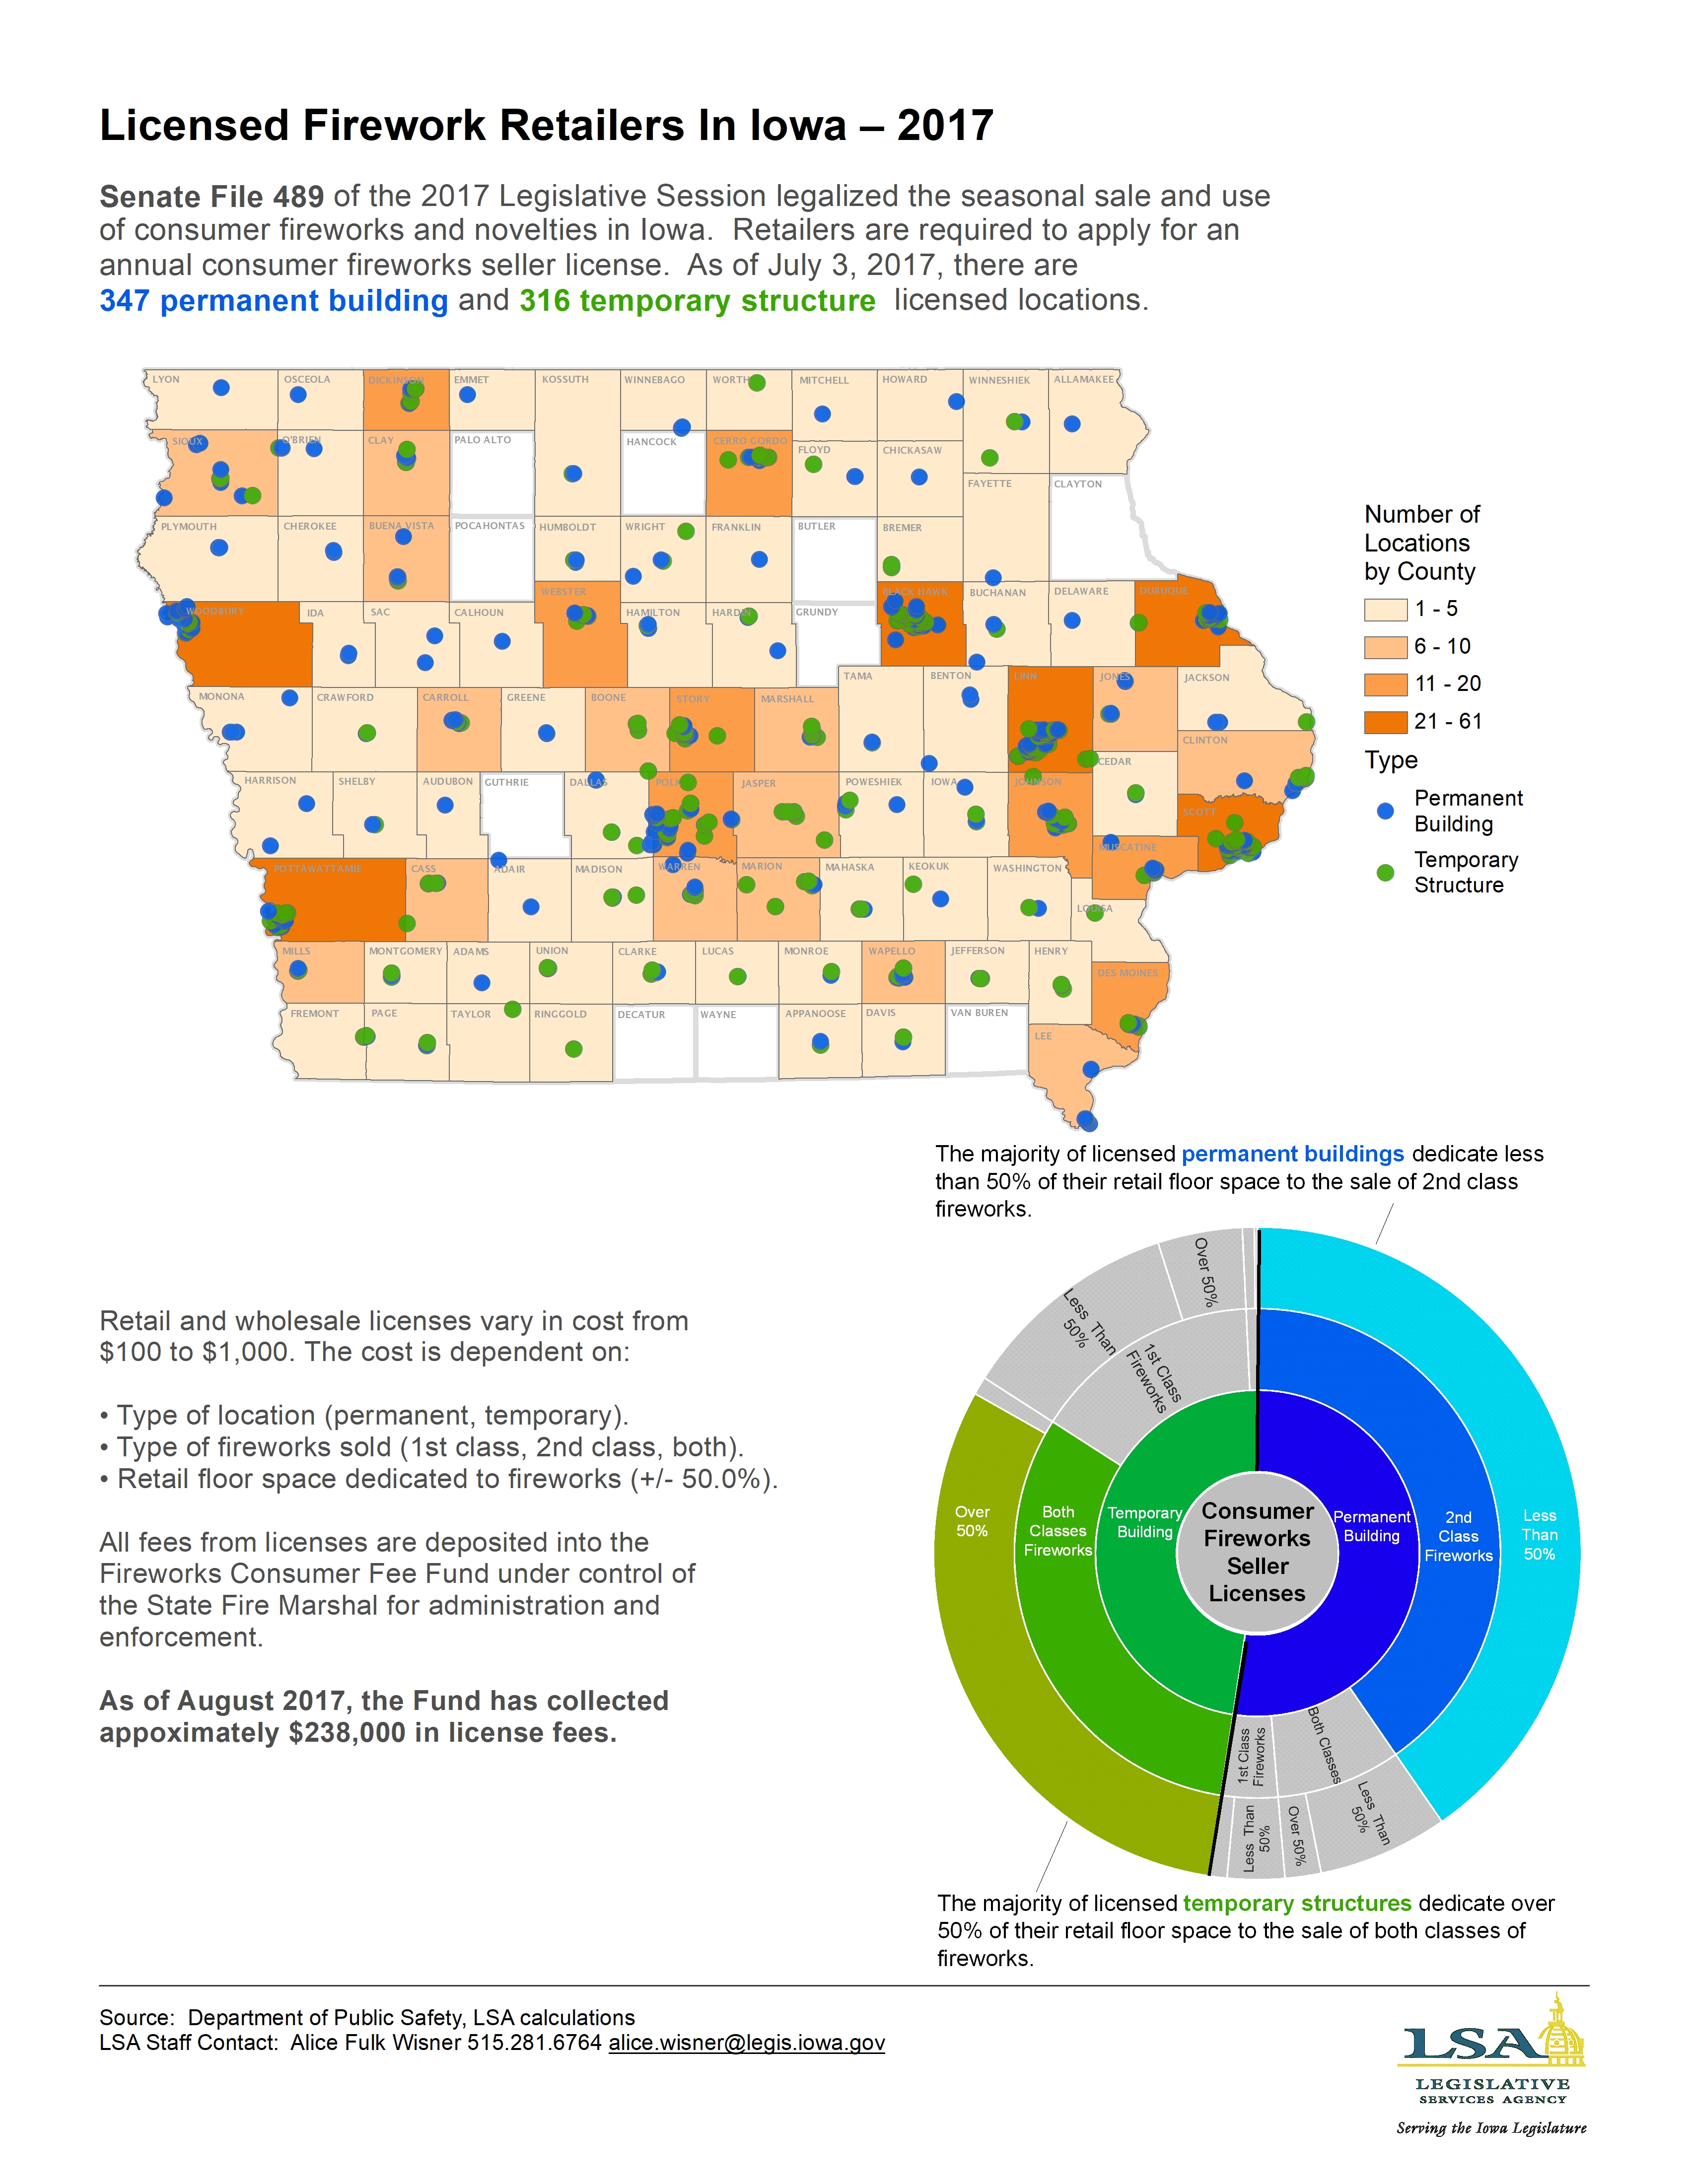
Licensed Firework Retailers In Iowa — 2017
|
|
|
|
|
| 08/14/2017 |
Iowa Insights |
National Comparison of Adult Corrections Population — CY 2015

|
|
|
|
|
| 08/07/2017 |
Iowa Insights |
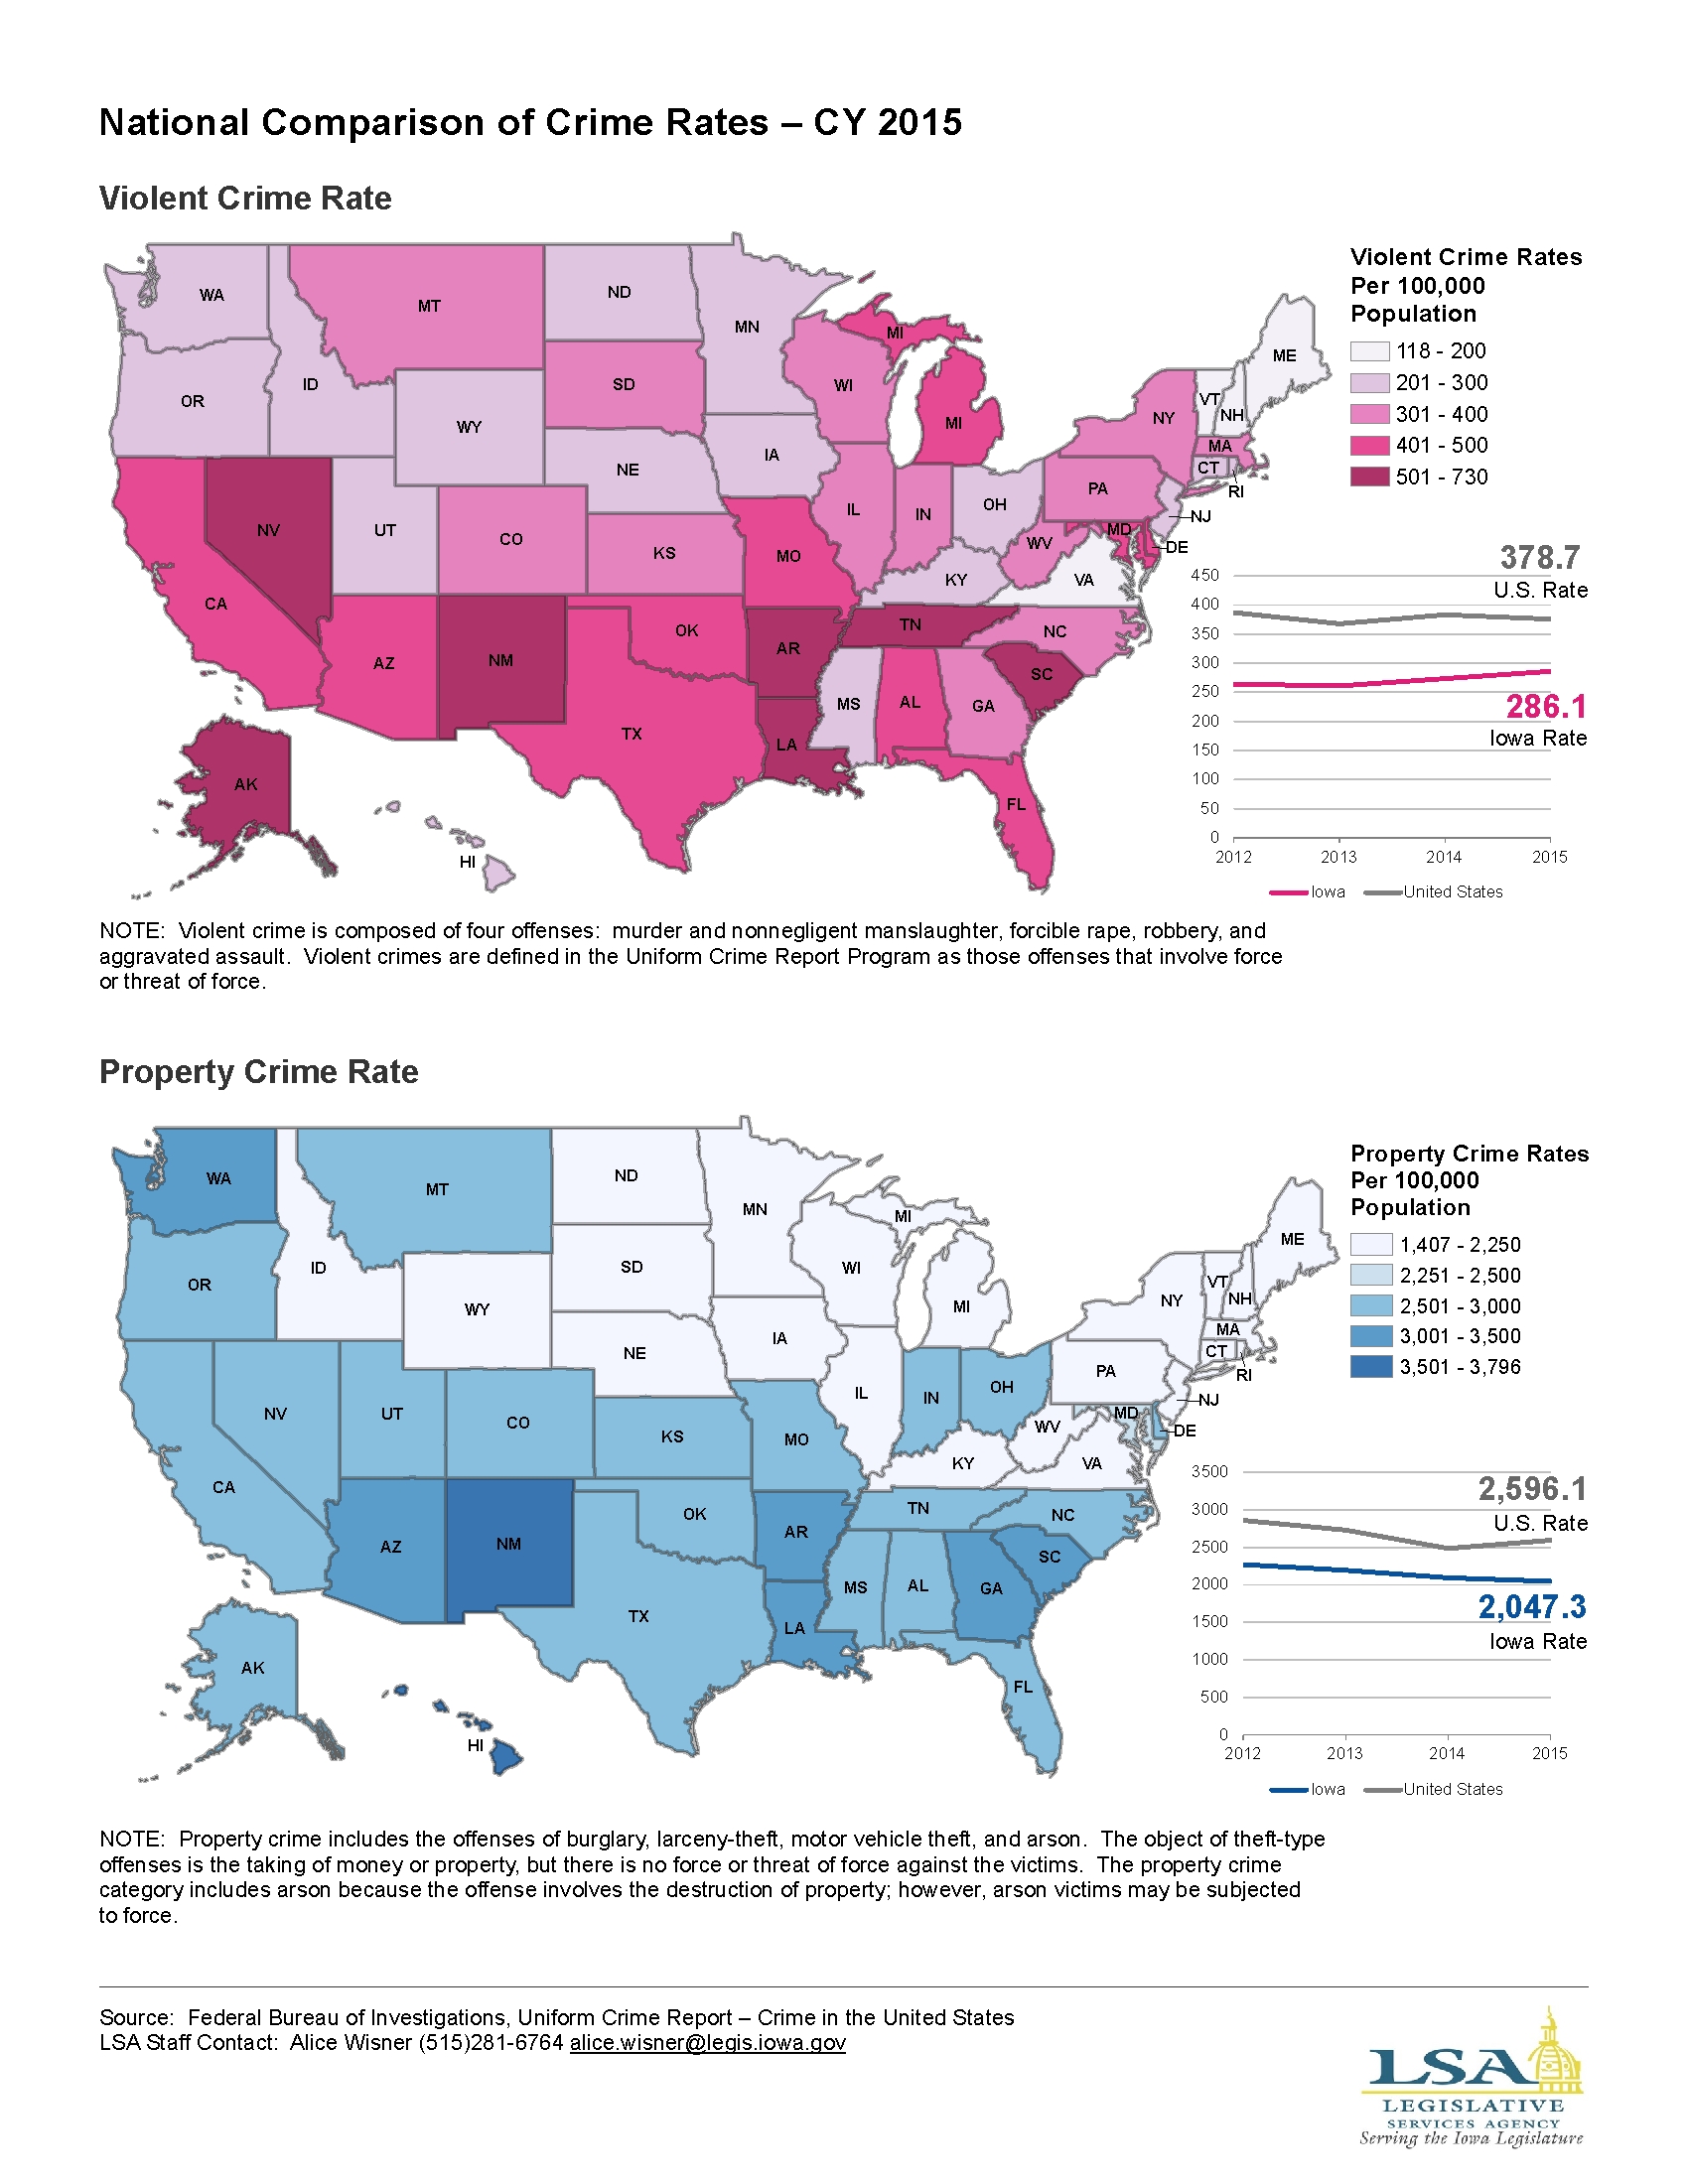
National Comparison of Crime Rates — CY 2015
|
|
|
|
|
| 07/31/2017 |
Iowa Insights |
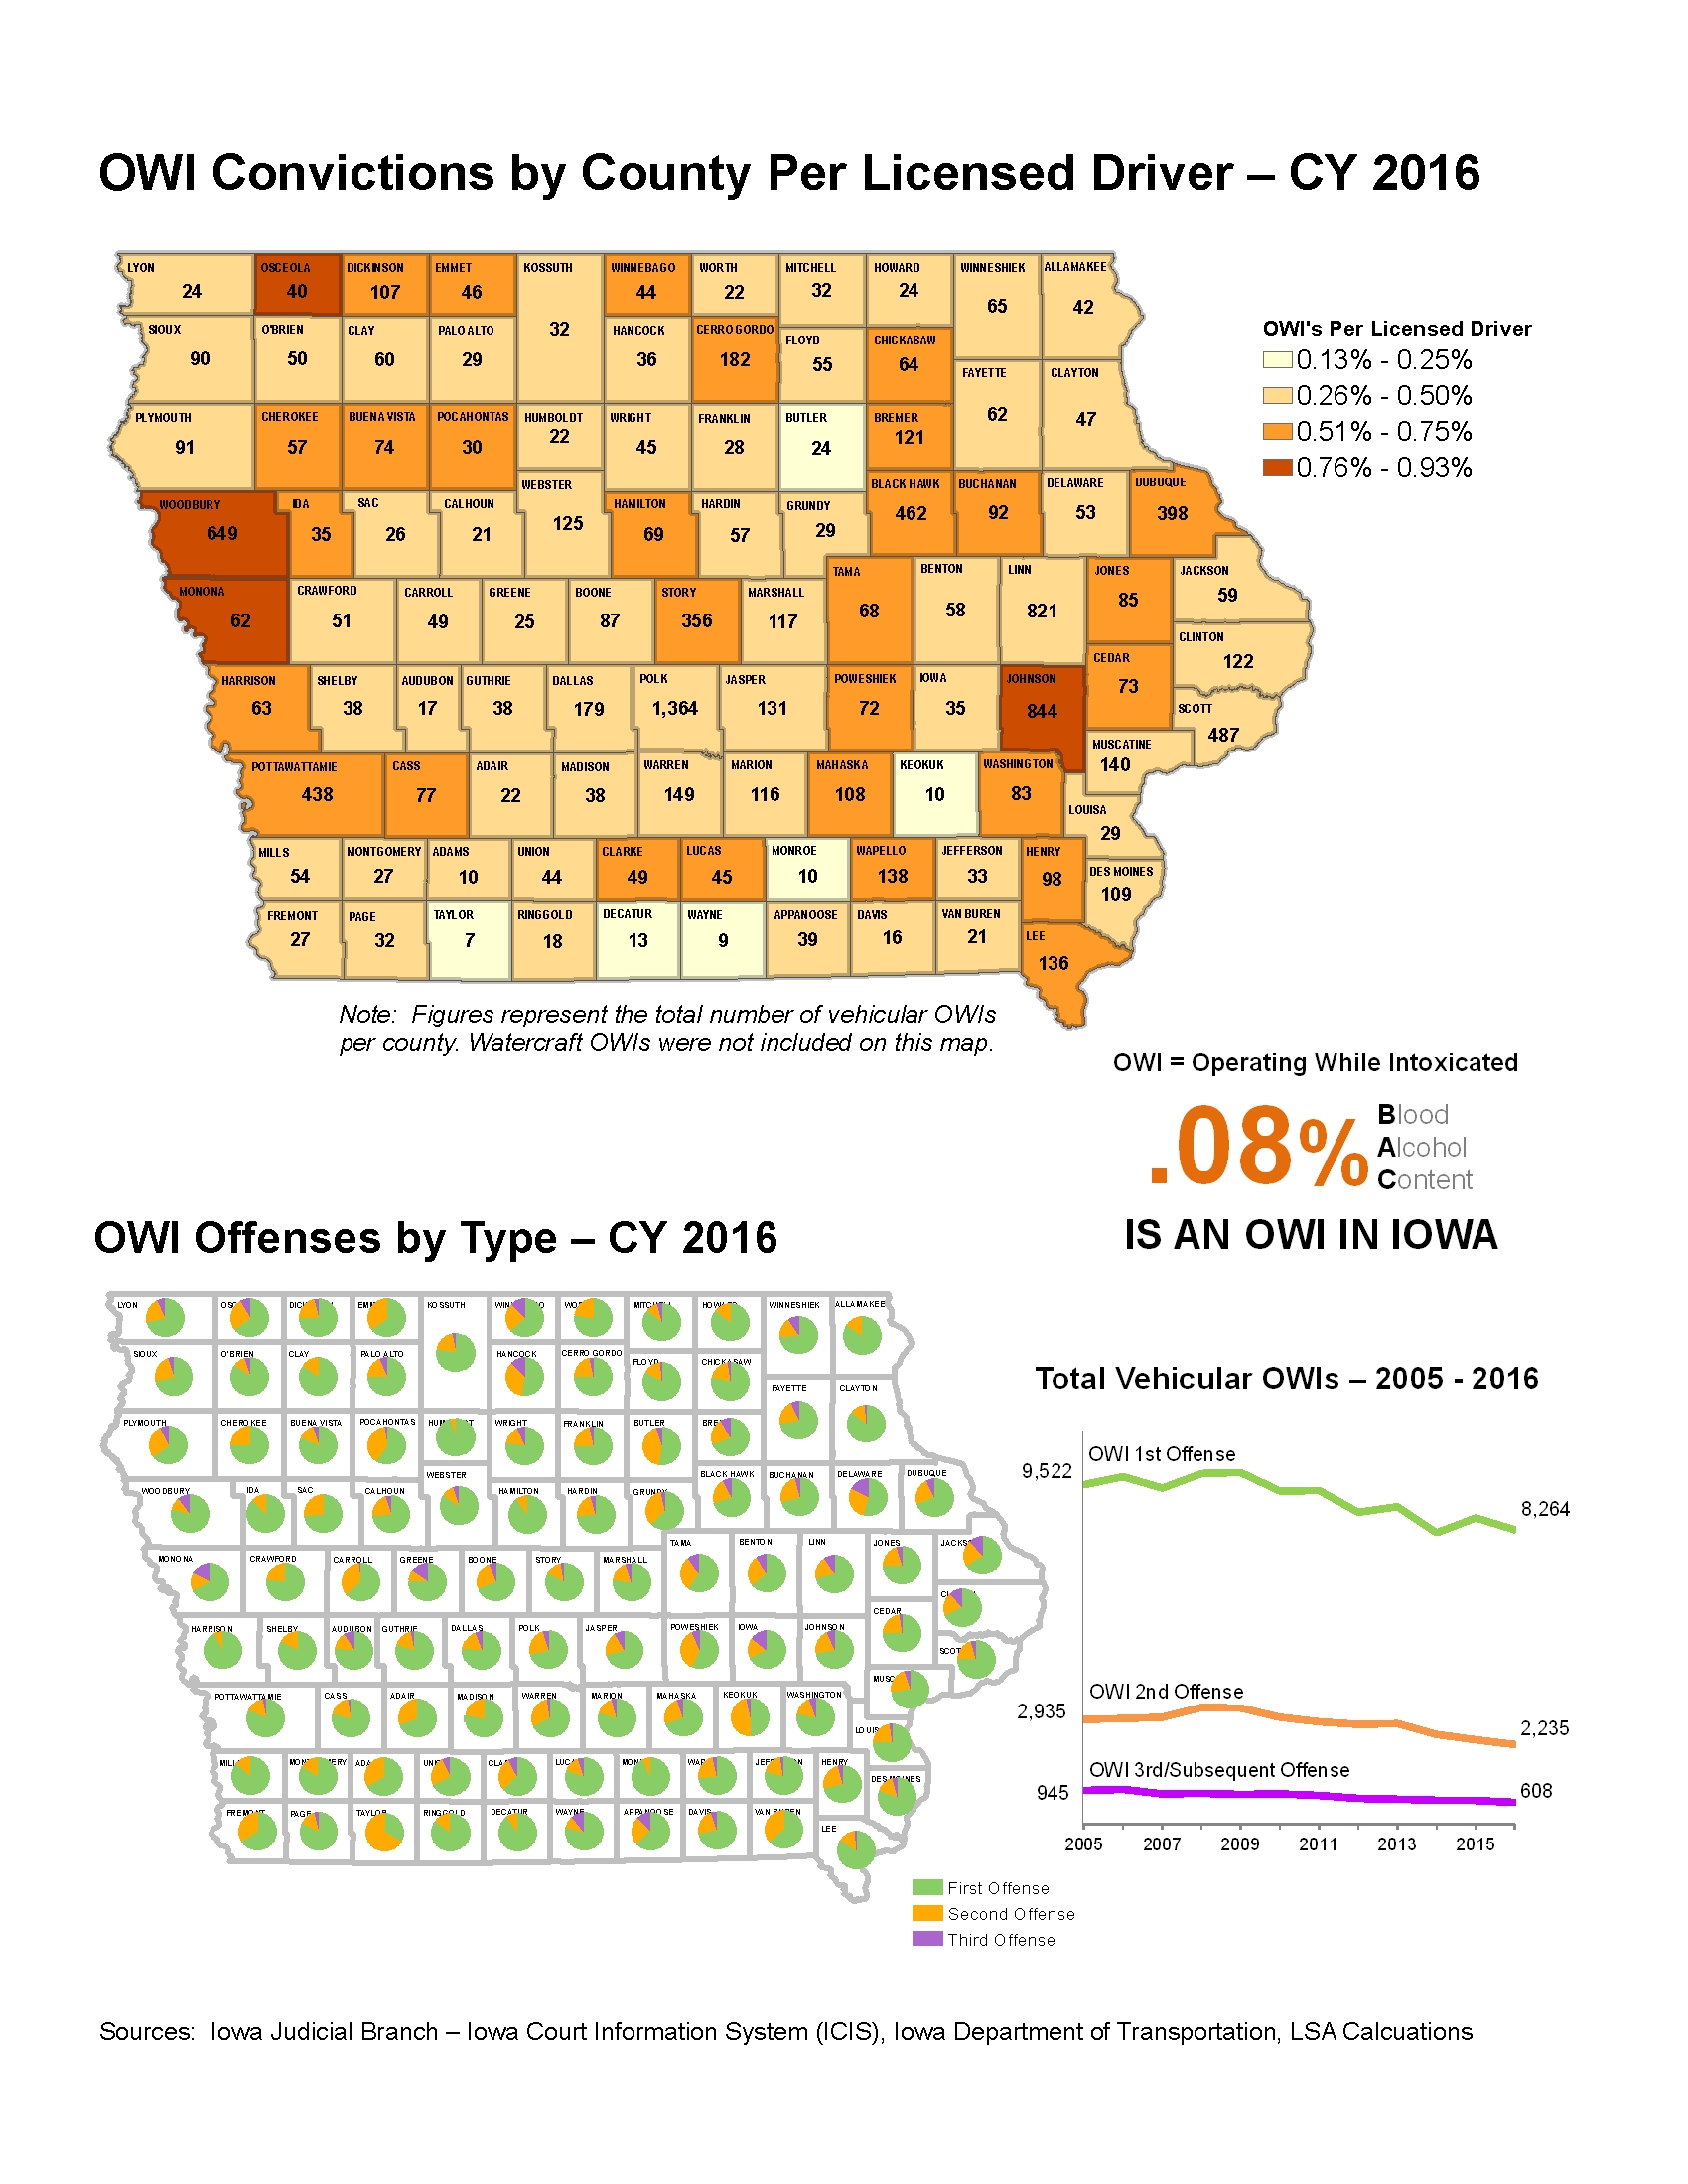
OWI Convictions per Licensed Driver — CY 2016
|
|
|
|
|
| 07/24/2017 |
Iowa Insights |
Estimated First-Year Costs For ISP Trooper

|
|
|
|
|
| 07/17/2017 |
Iowa Insights |
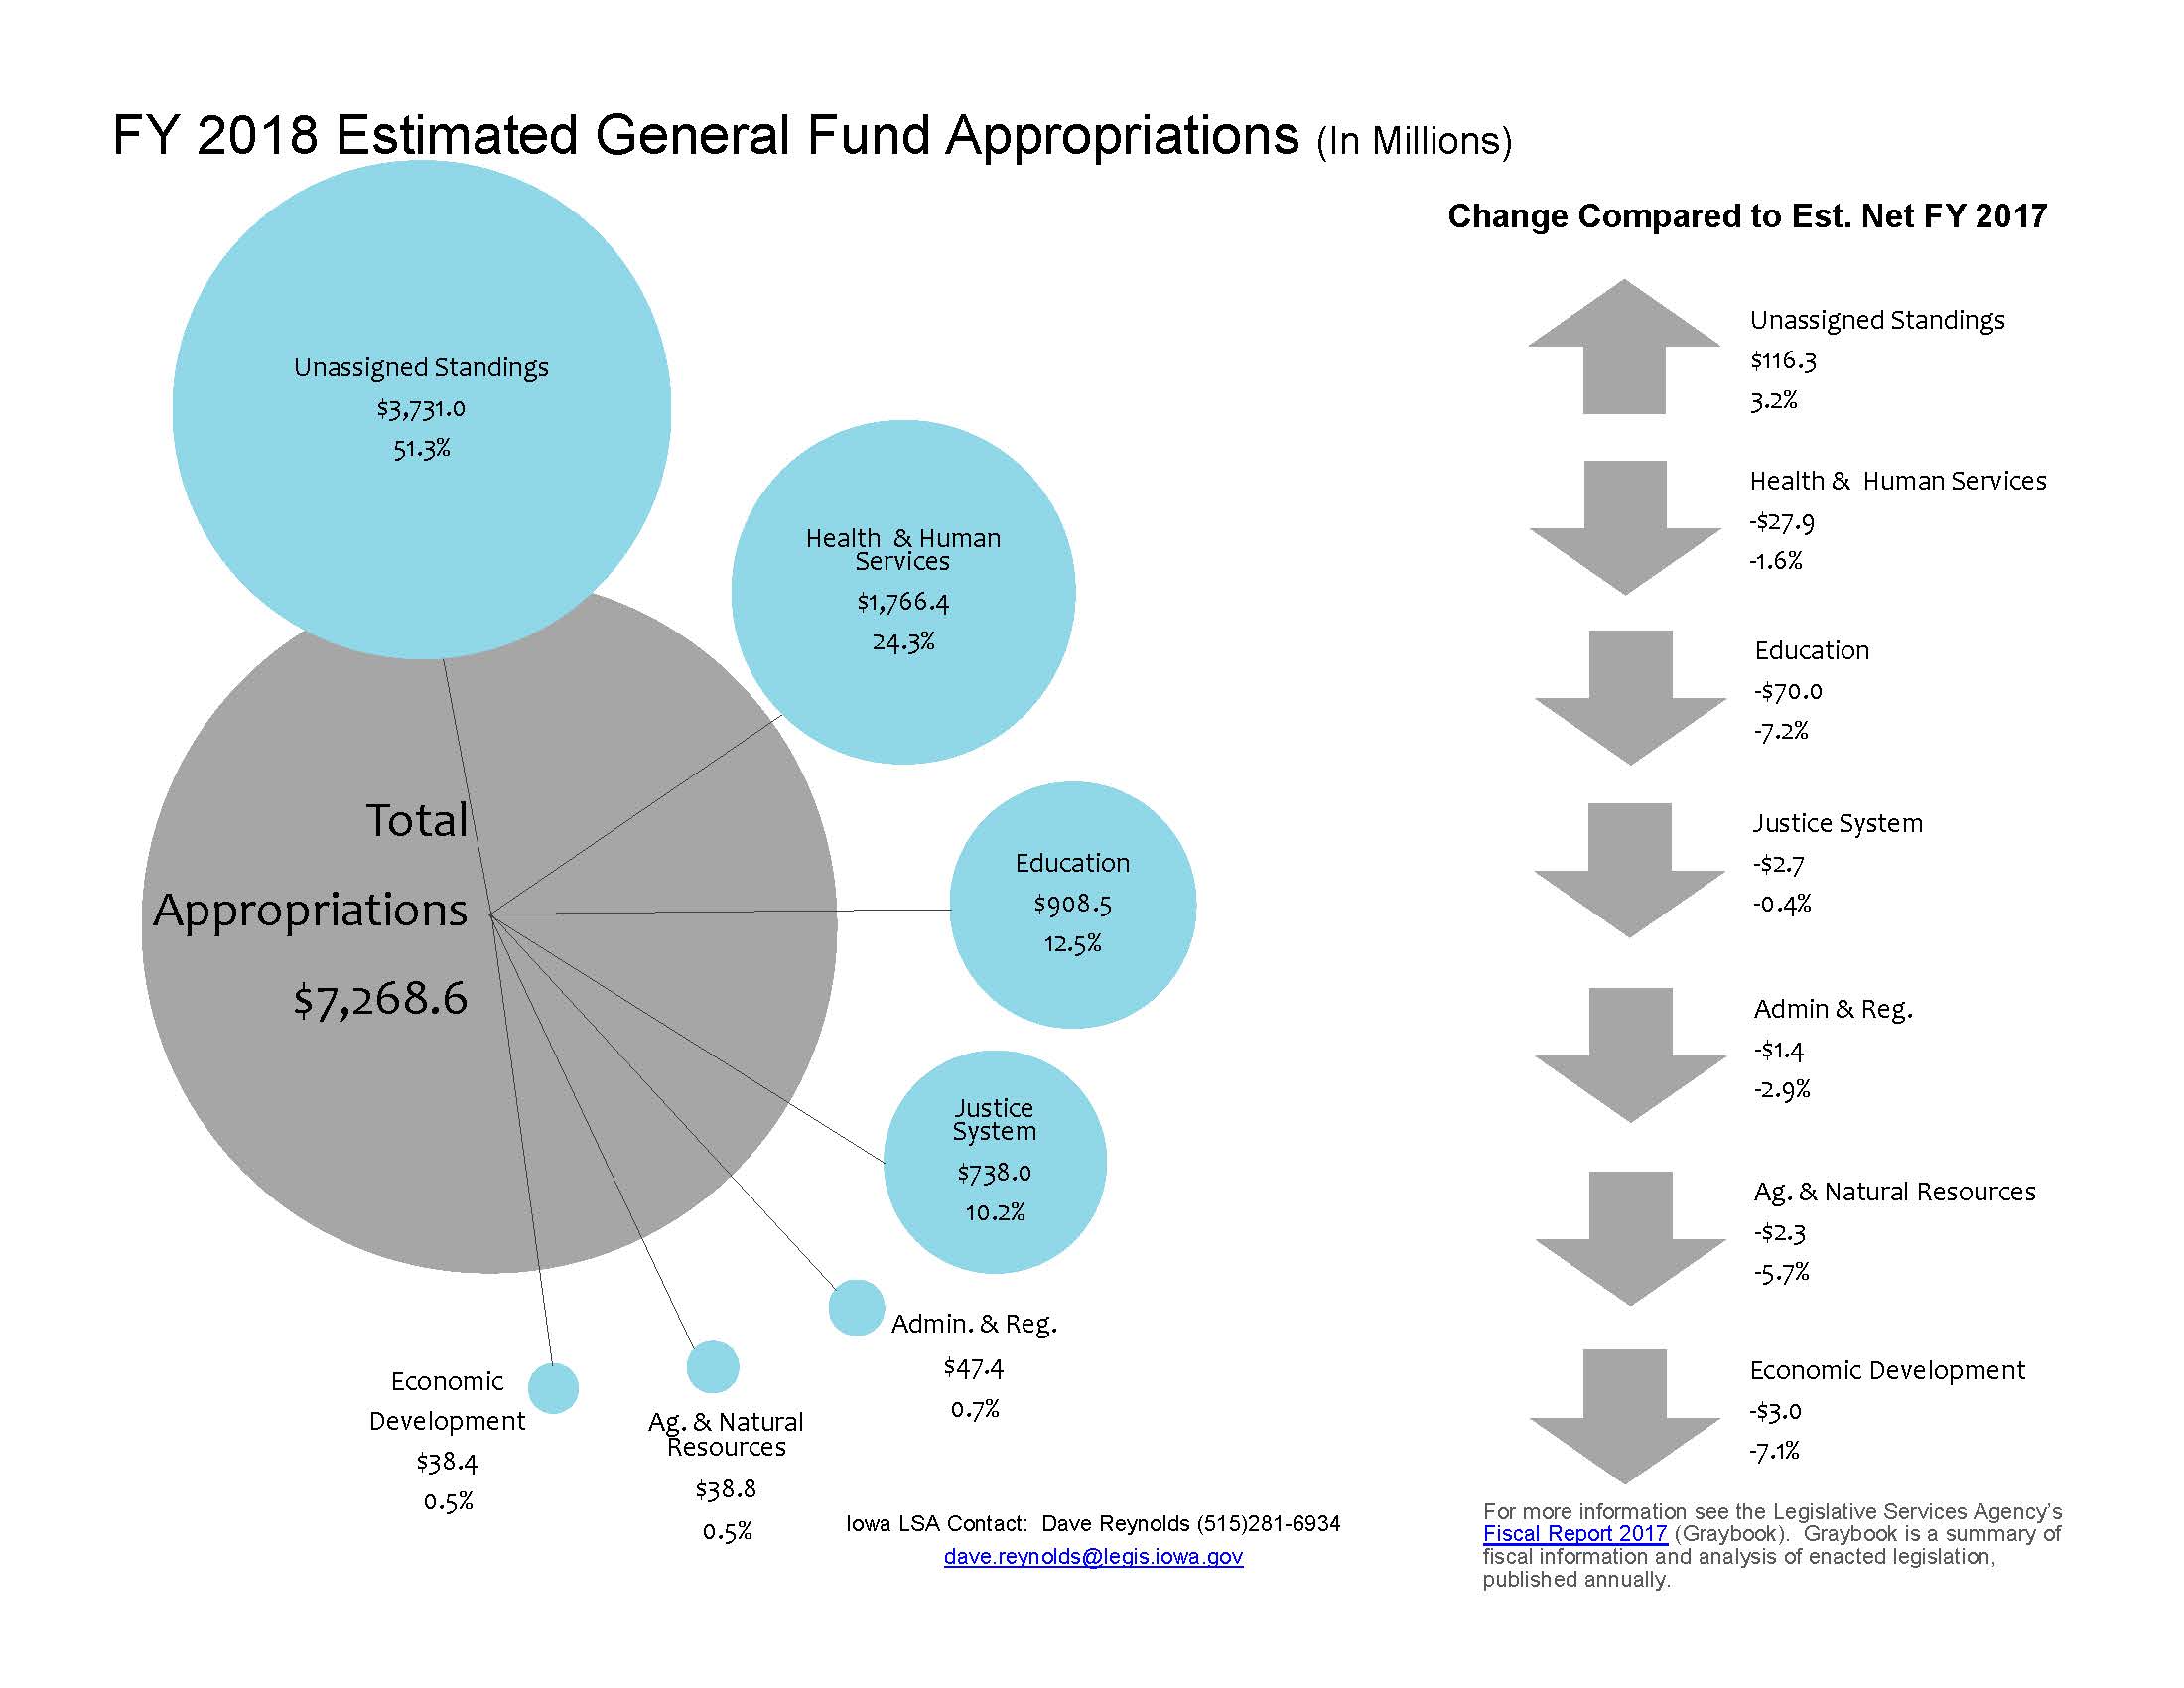
Estimated General Fund Appropriations — FY 2018
|
|
|
|
|
| 07/10/2017 |
Iowa Insights |
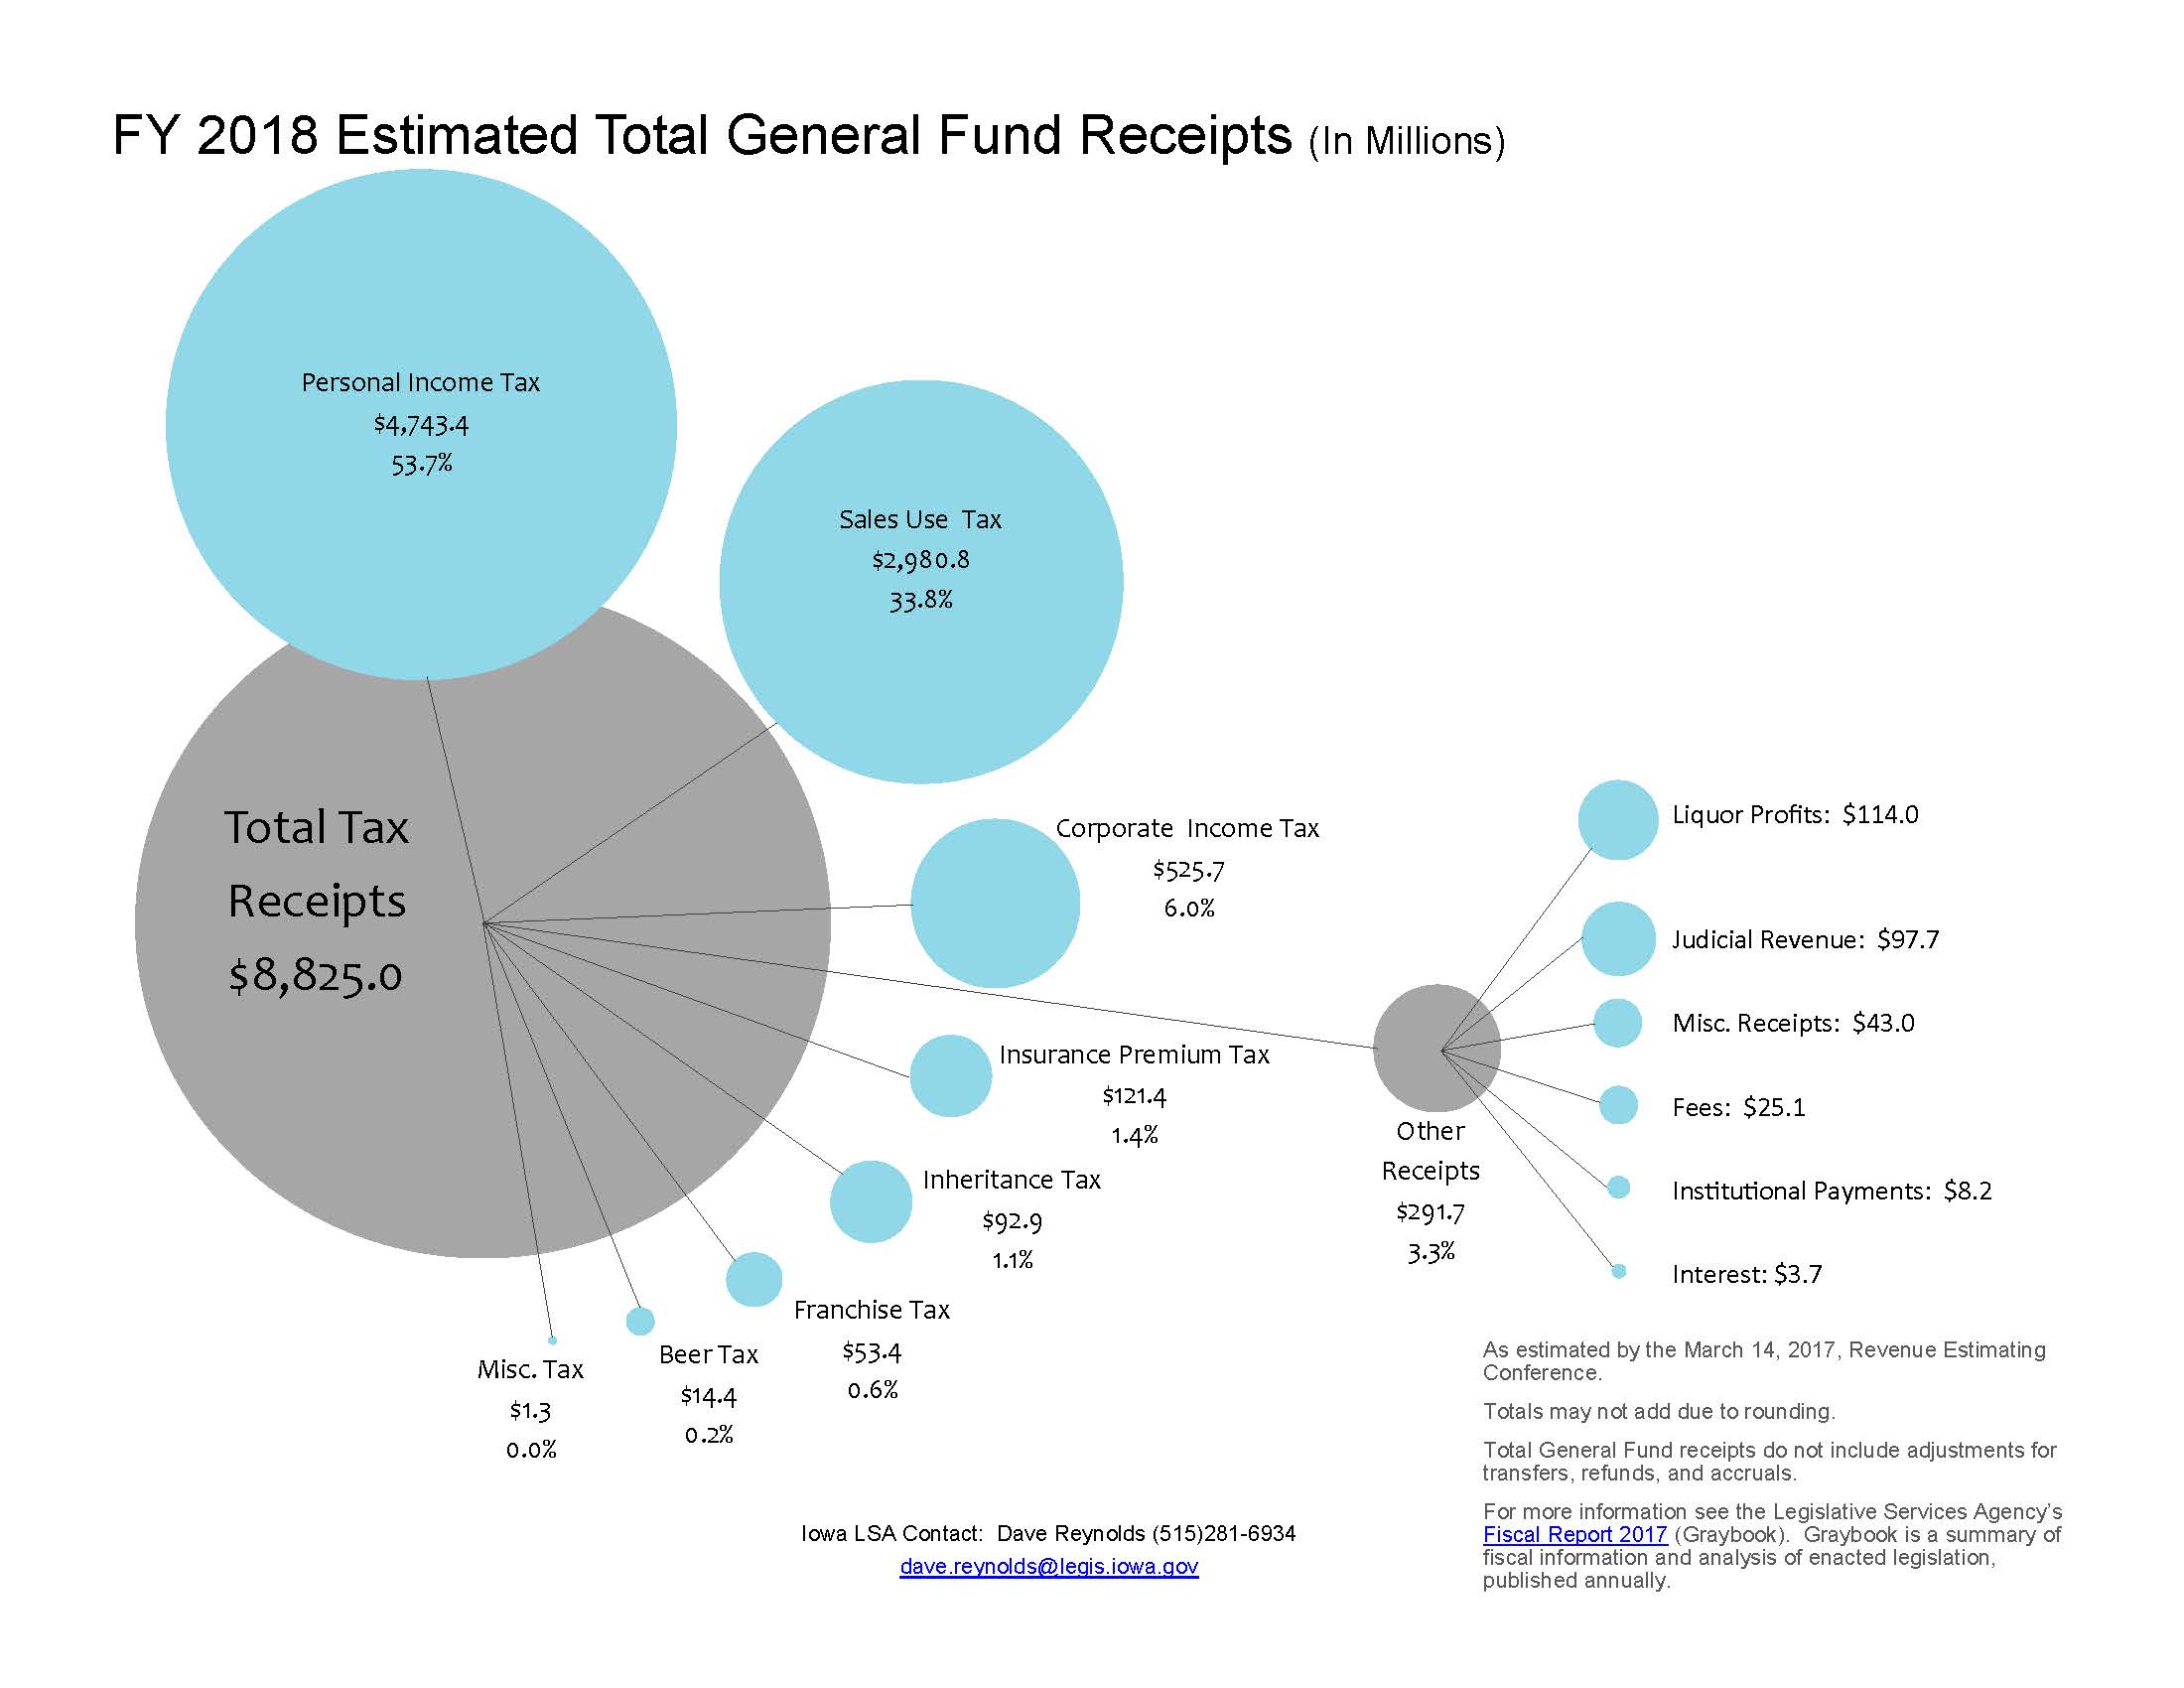
Estimated Total General Fund Receipts — FY 2018
|
|
|
|
|
| 07/03/2017 |
Iowa Insights |
Flow of General Fund Revenue After Expenditure Limitation
|
|
|
|
|
| 06/26/2017 |
Iowa Insights |
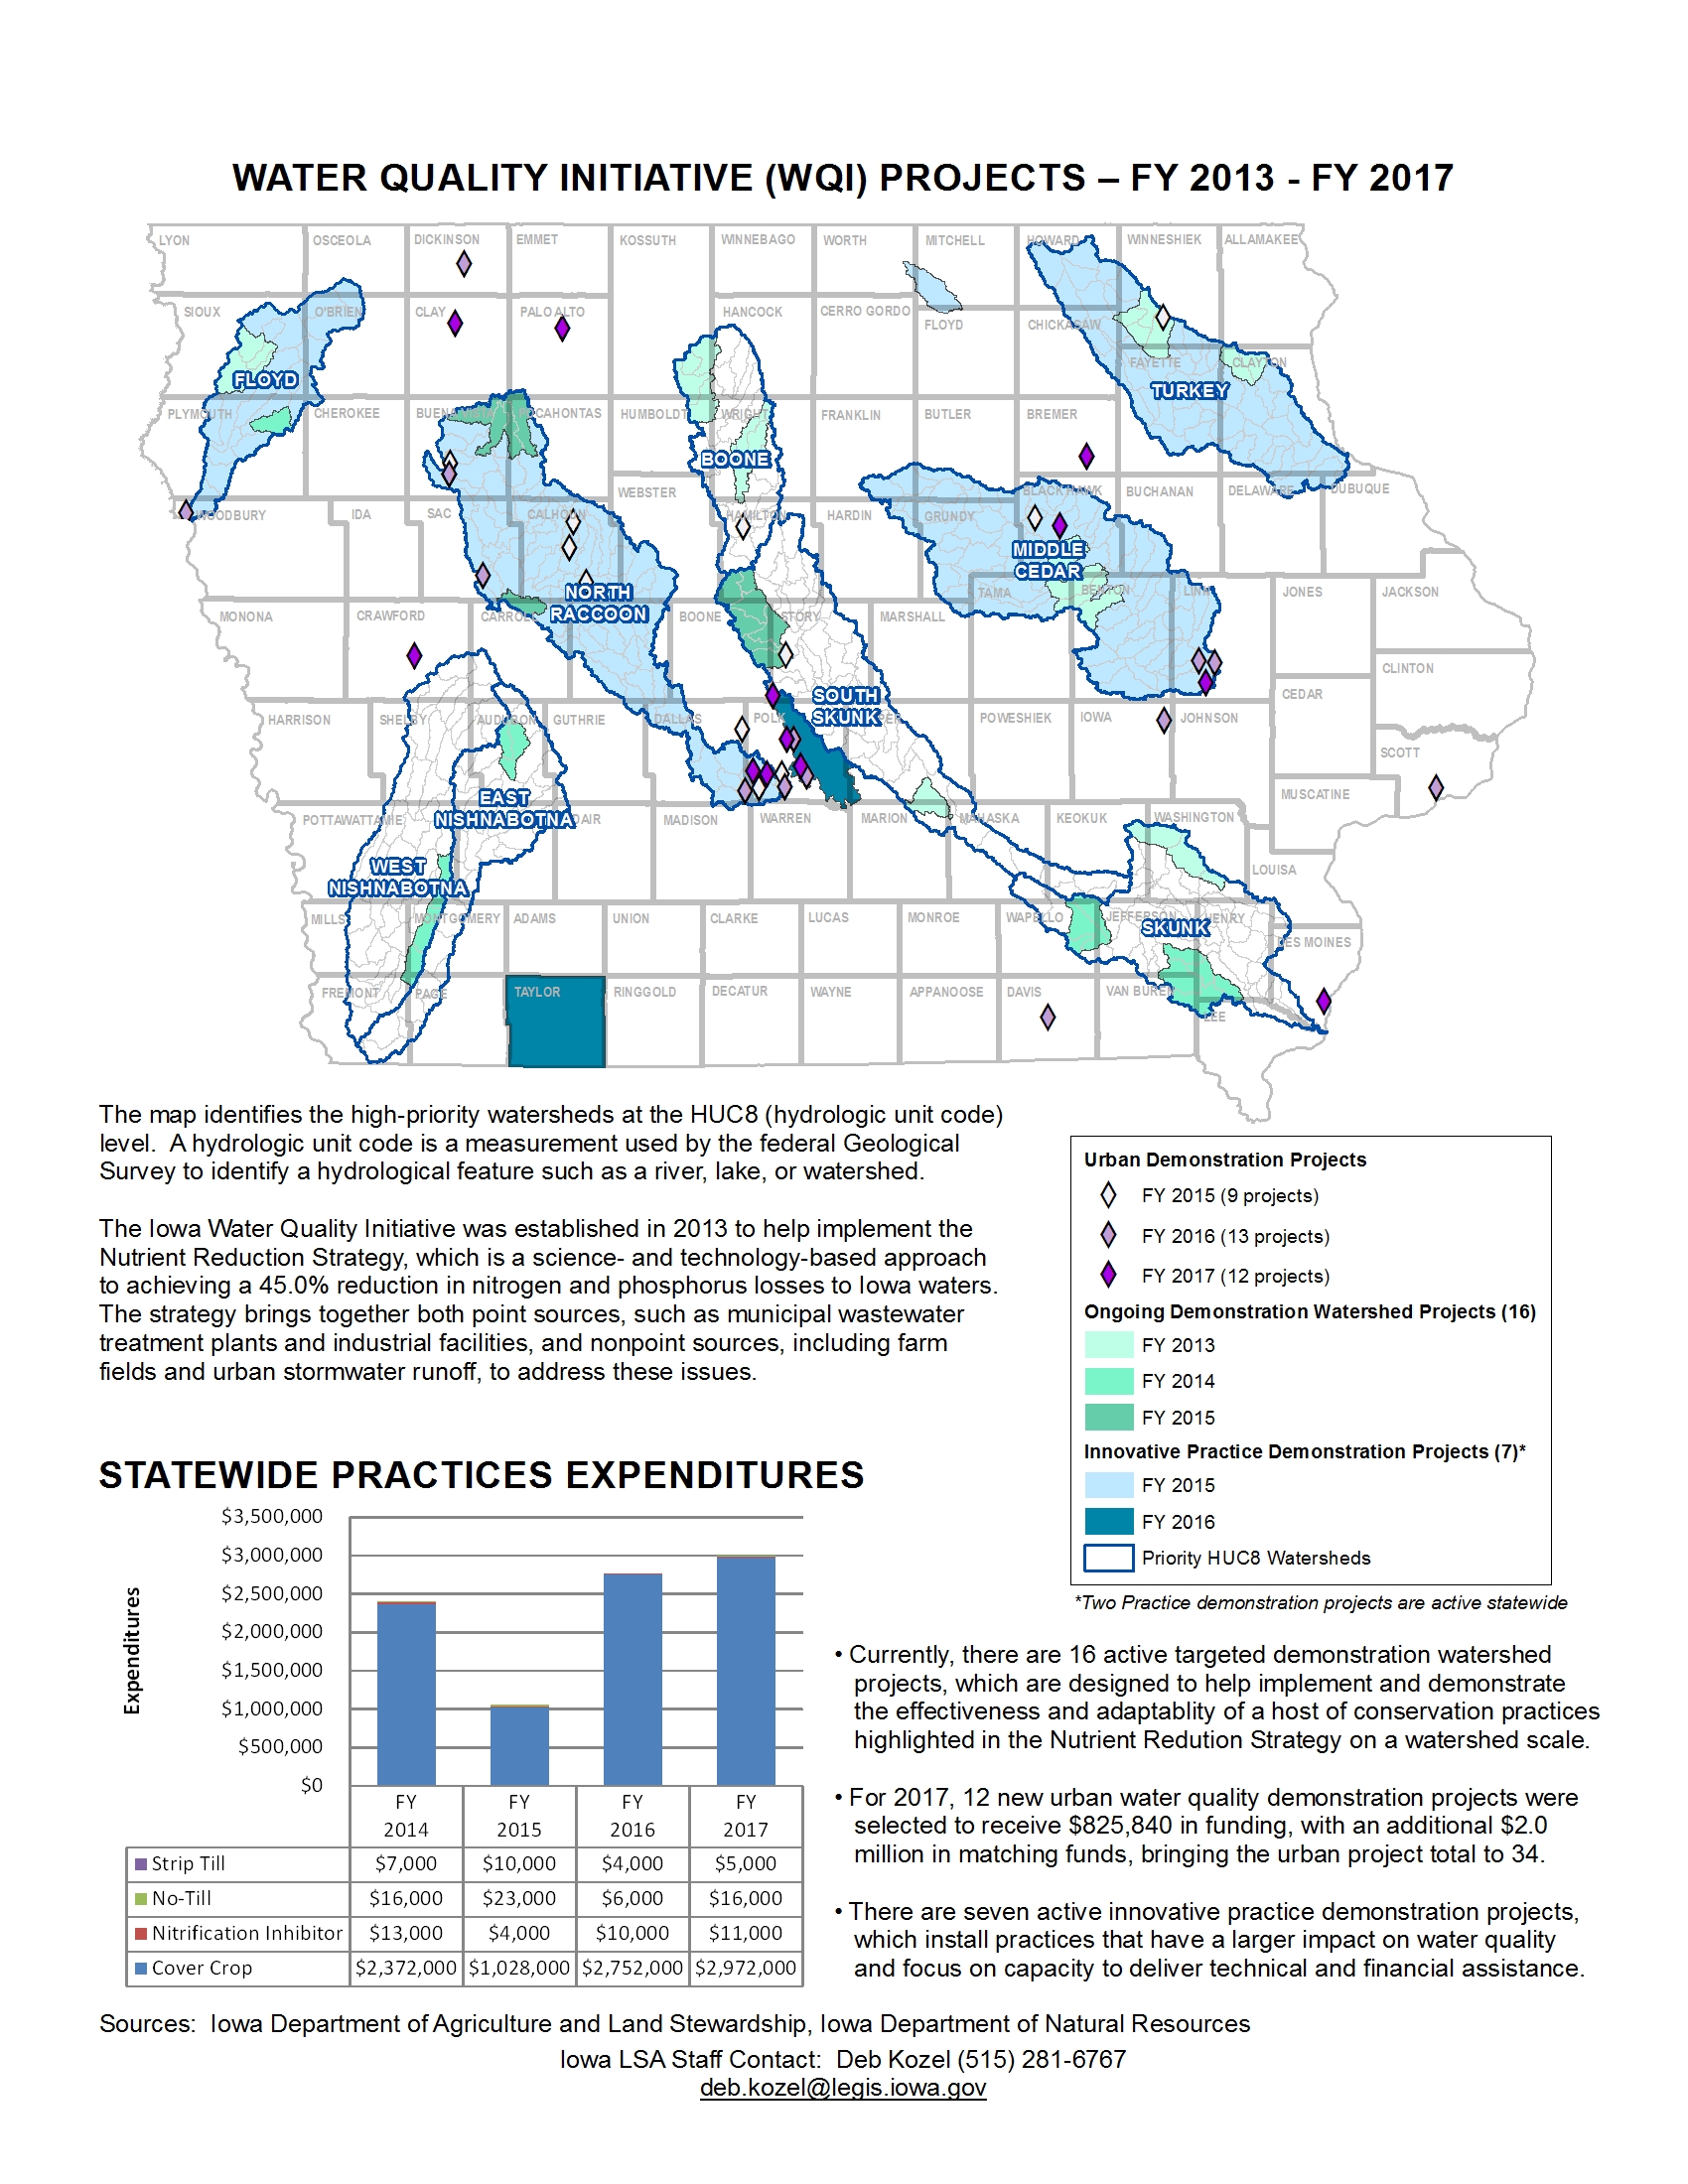
Water Qualiity Initiative Projects — FY 2013 - FY 2017
|
|
|
|
|
| 06/19/2017 |
Iowa Insights |
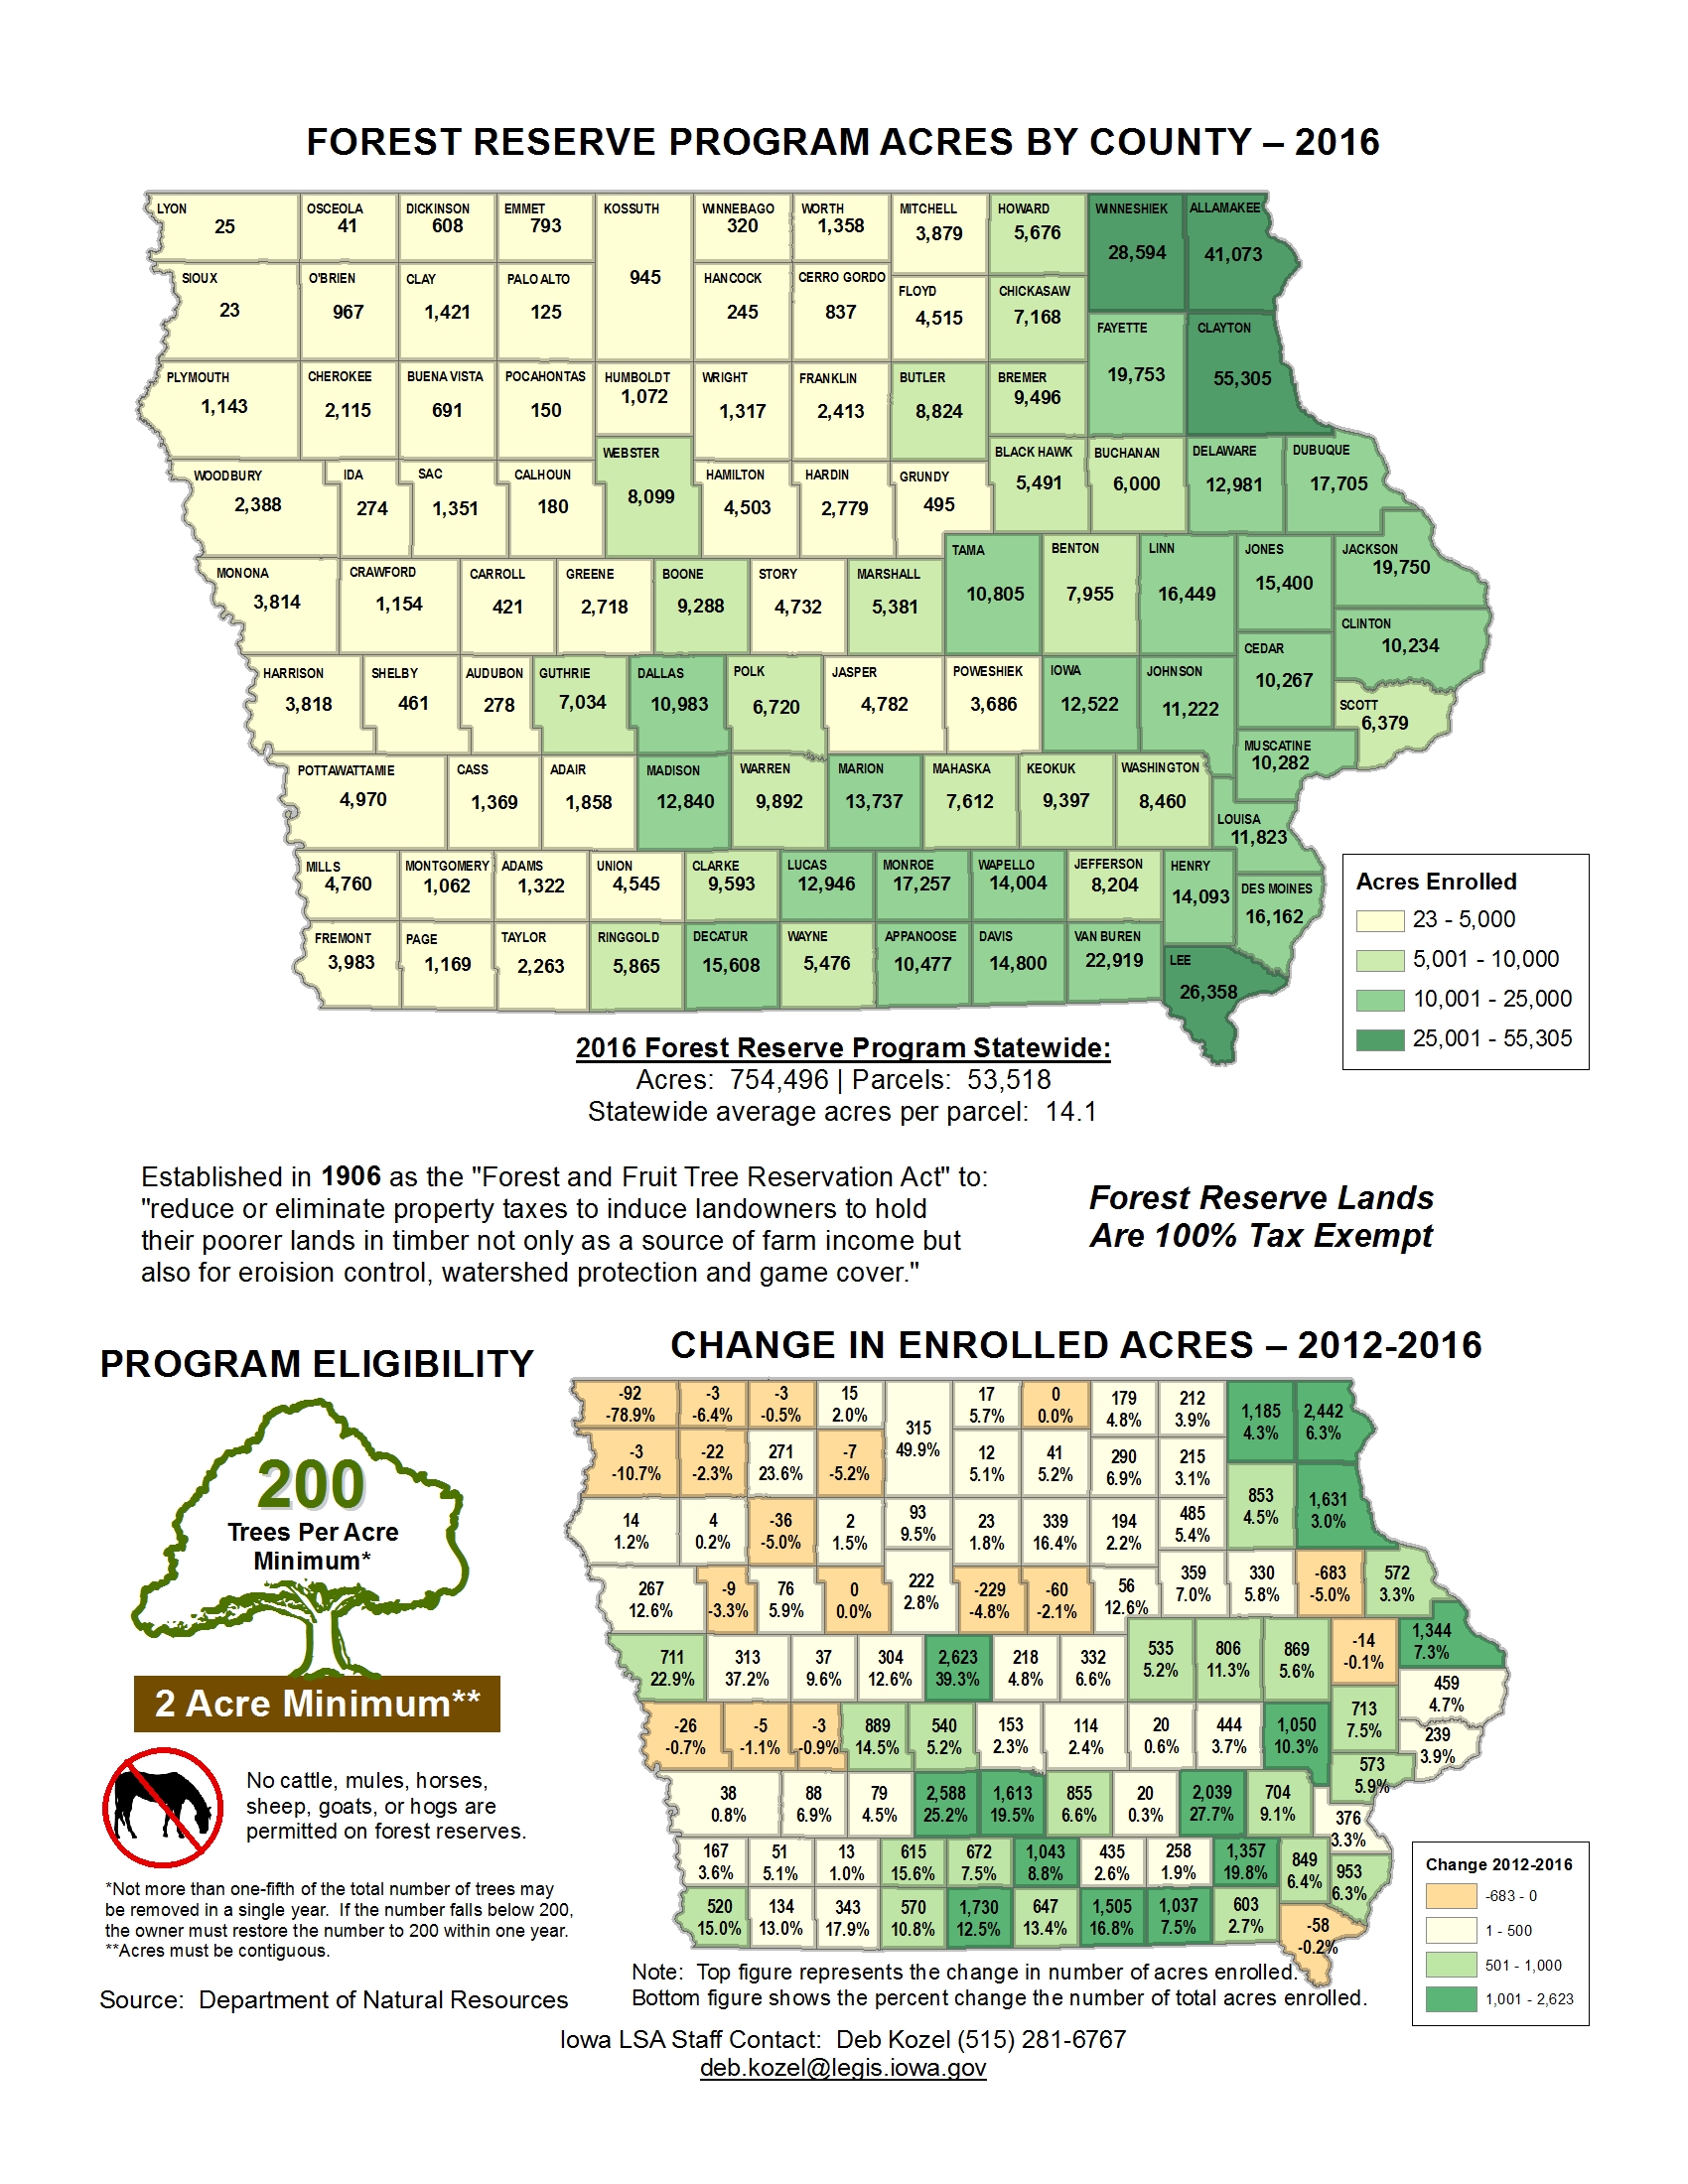
Forest Reserve Program — 2016
|
|
|
|
|
| 06/12/2017 |
Iowa Insights |
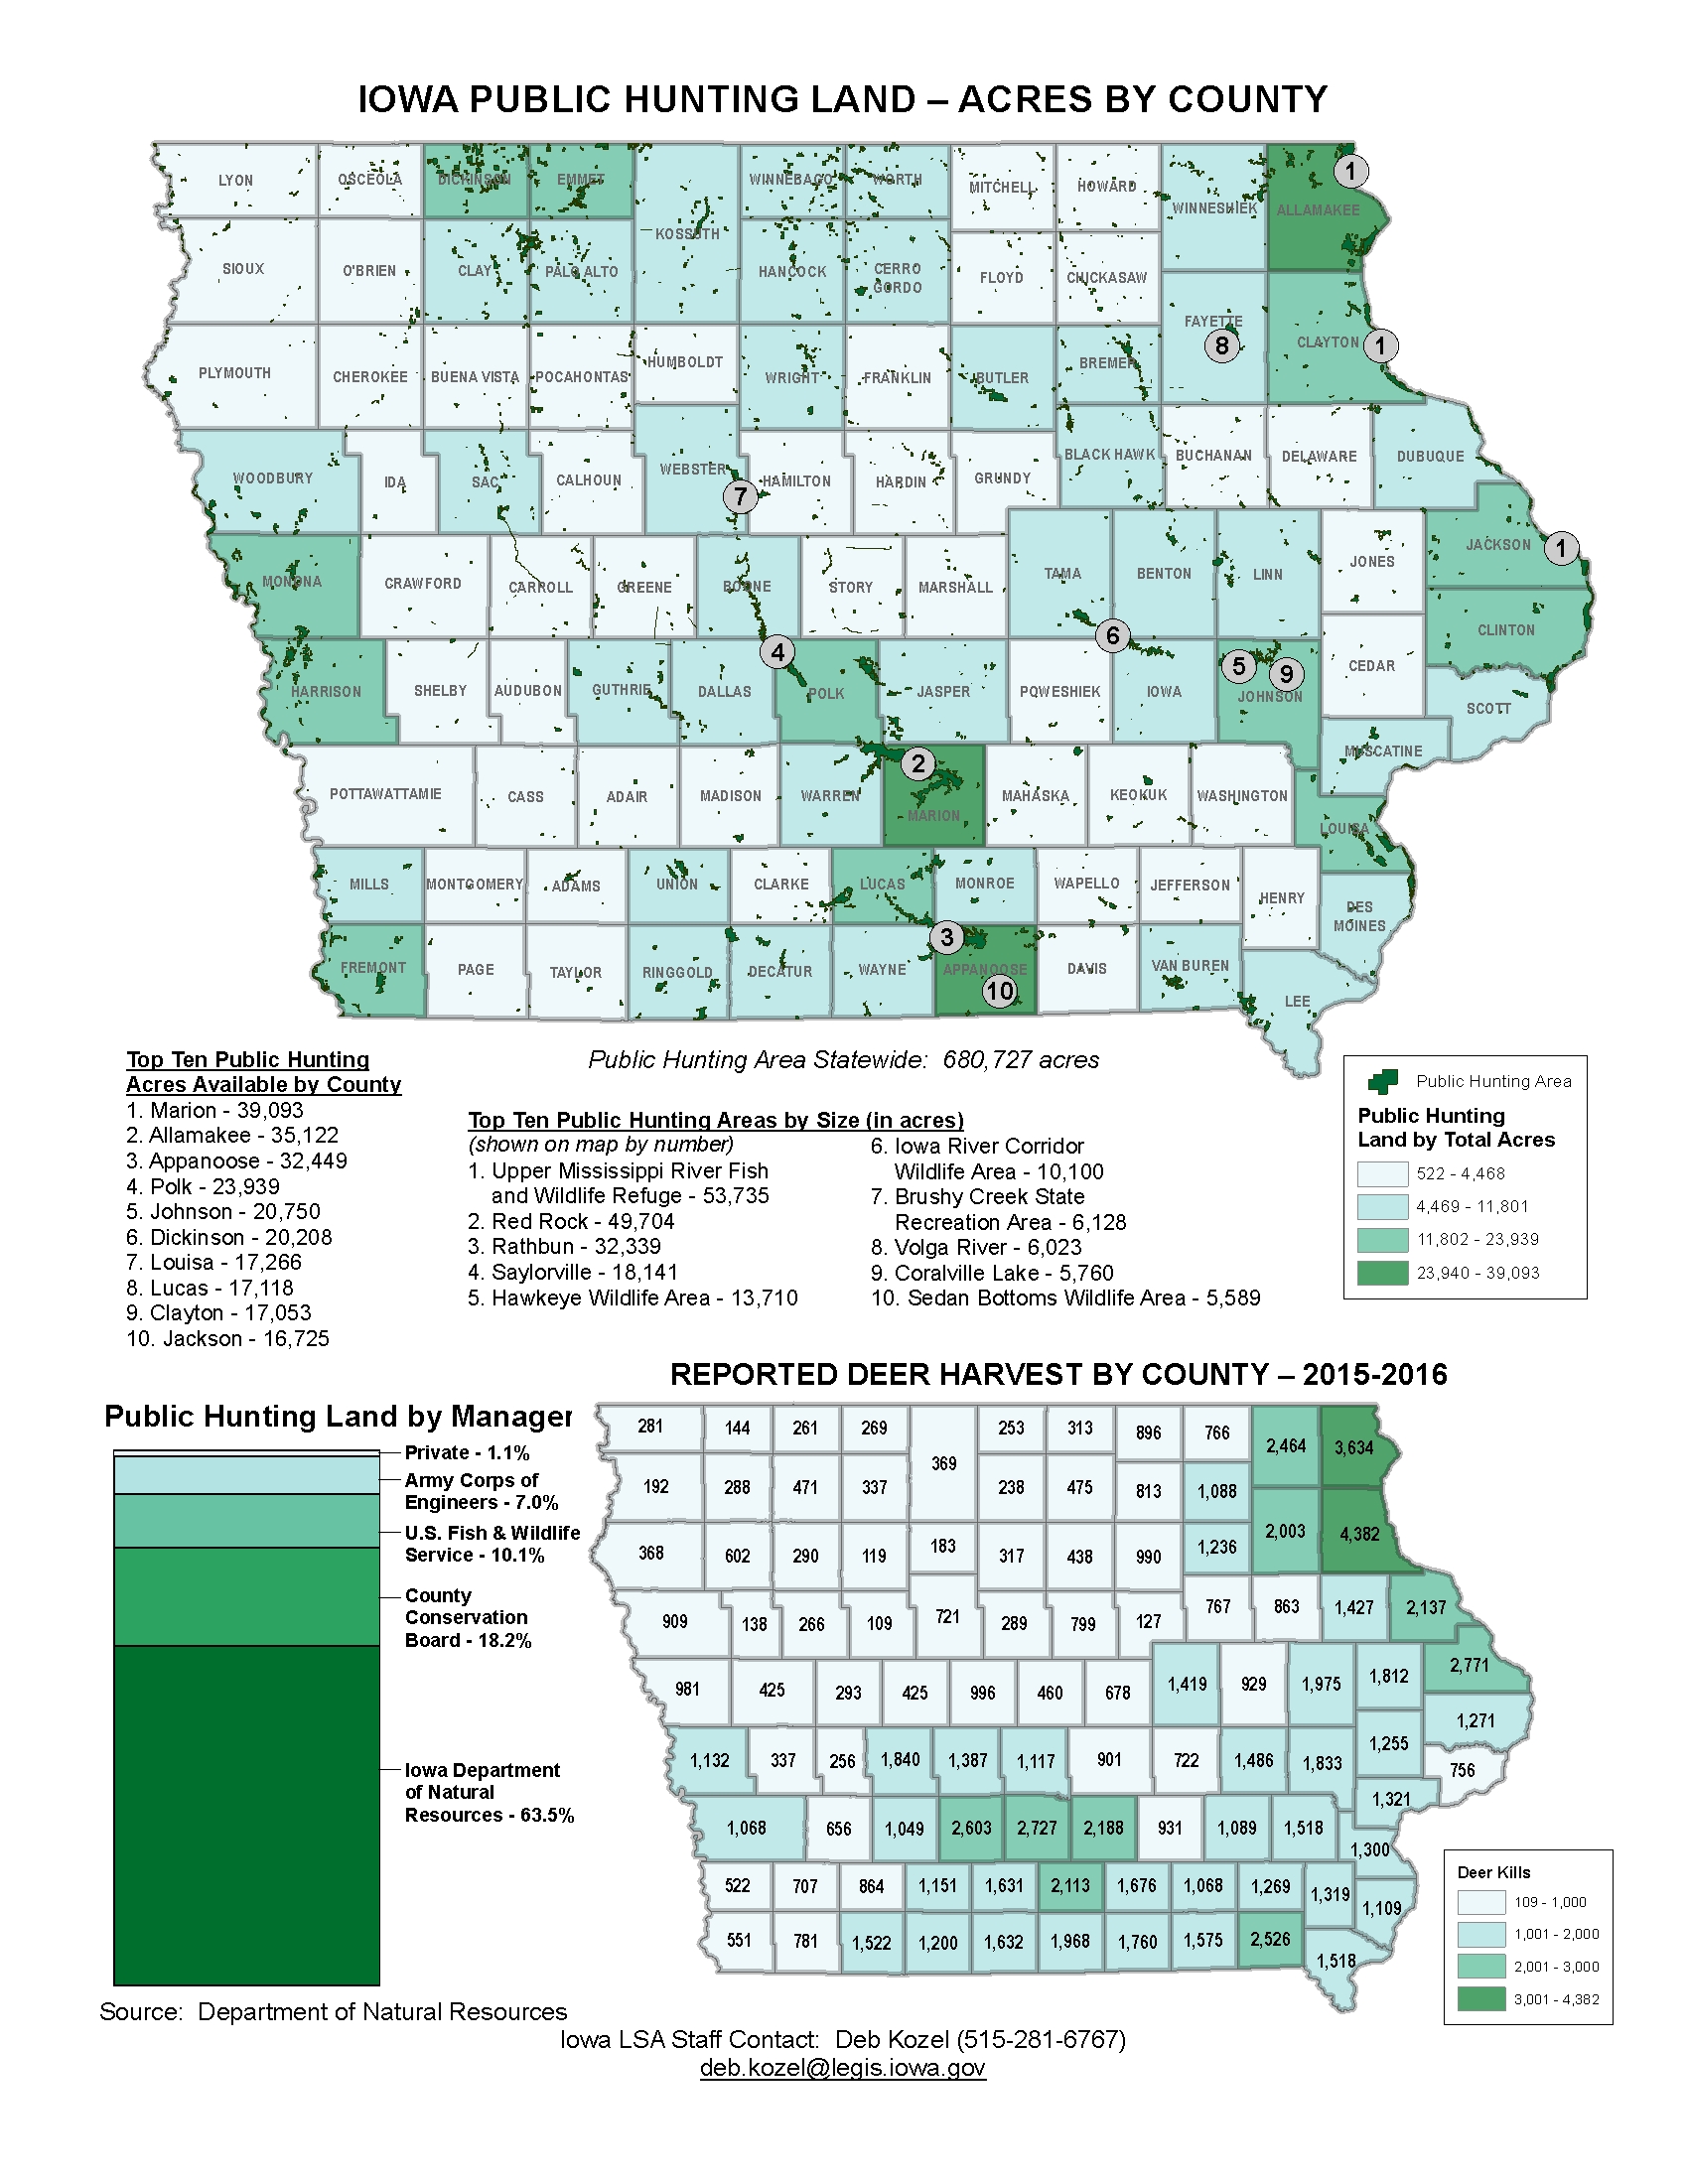
Iowa Public Hunting Land – Acres by County
|
|
|
|
|
| 06/05/2017 |
Iowa Insights |
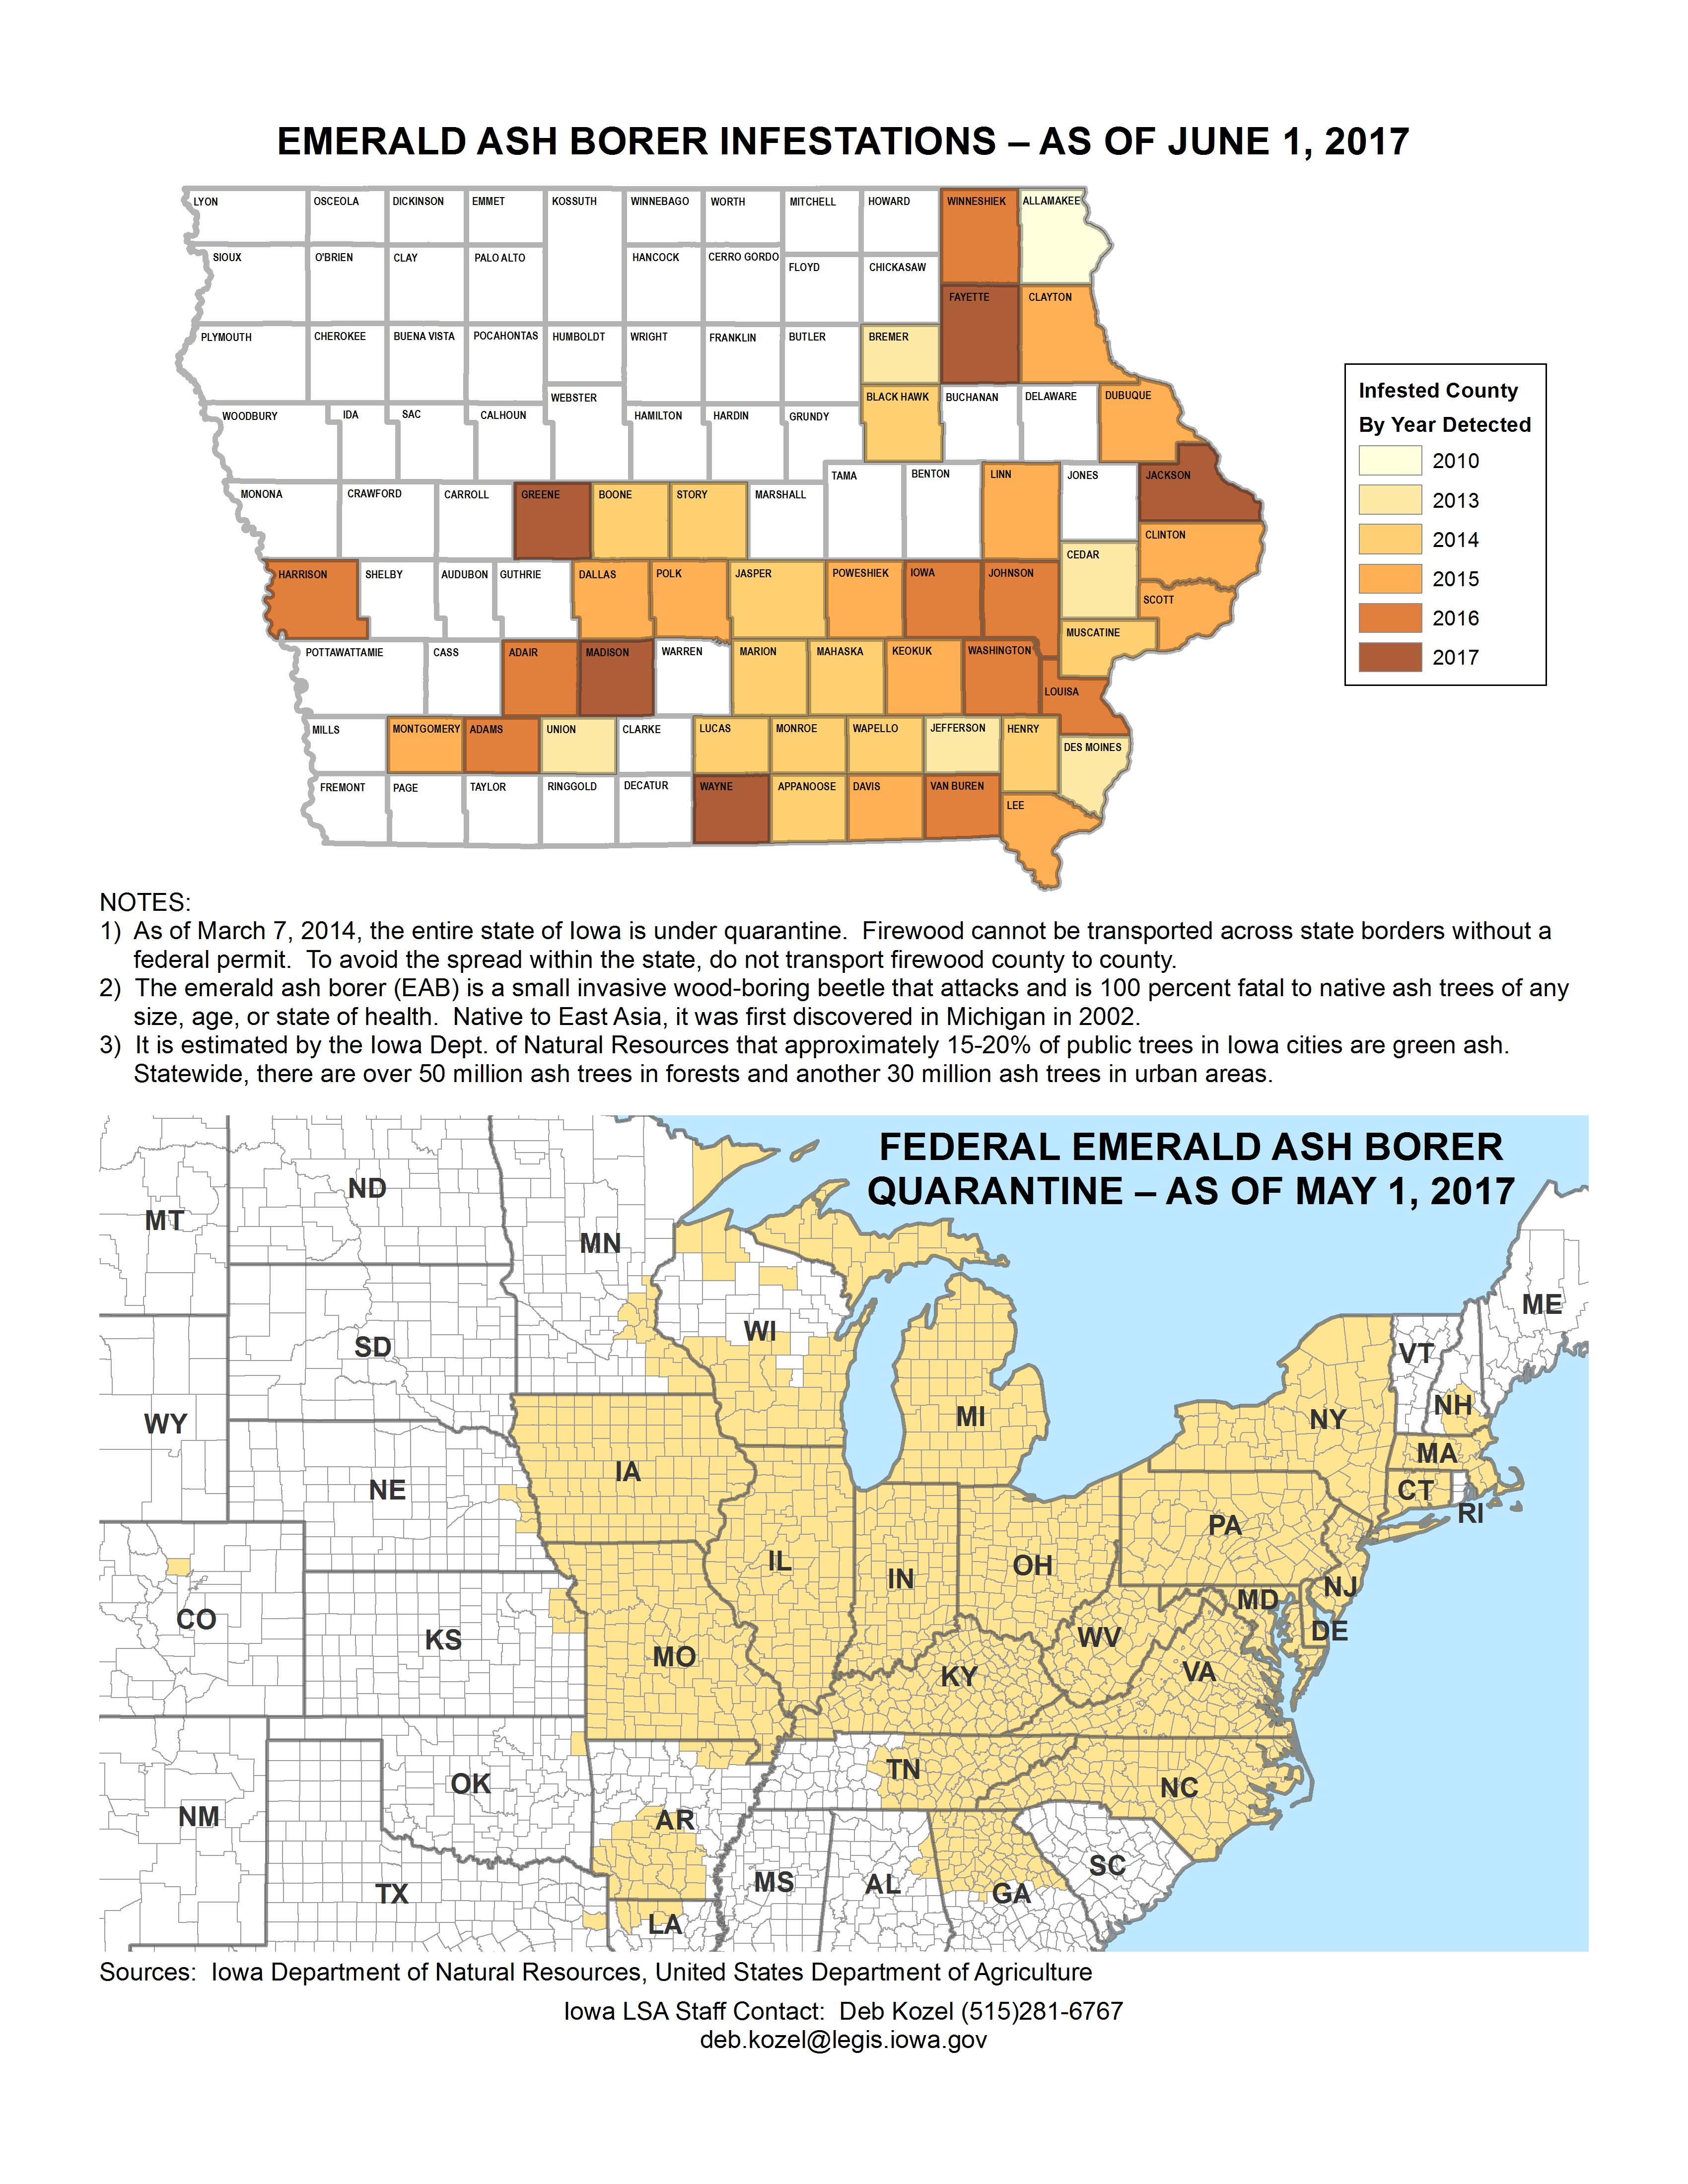
Emerald Ash Borer Infestations — As of June 1, 2017
|
|
|
|
|
| 05/30/2017 |
Iowa Insights |
Average Cash Rent per Acre of Cropland — 2017

|
|
|
|
|
| 05/22/2017 |
Iowa Insights |
Average Farmland Value per Acre — 2016 with Percent Change

|
|
|
|
|
| 05/15/2017 |
Iowa Insights |
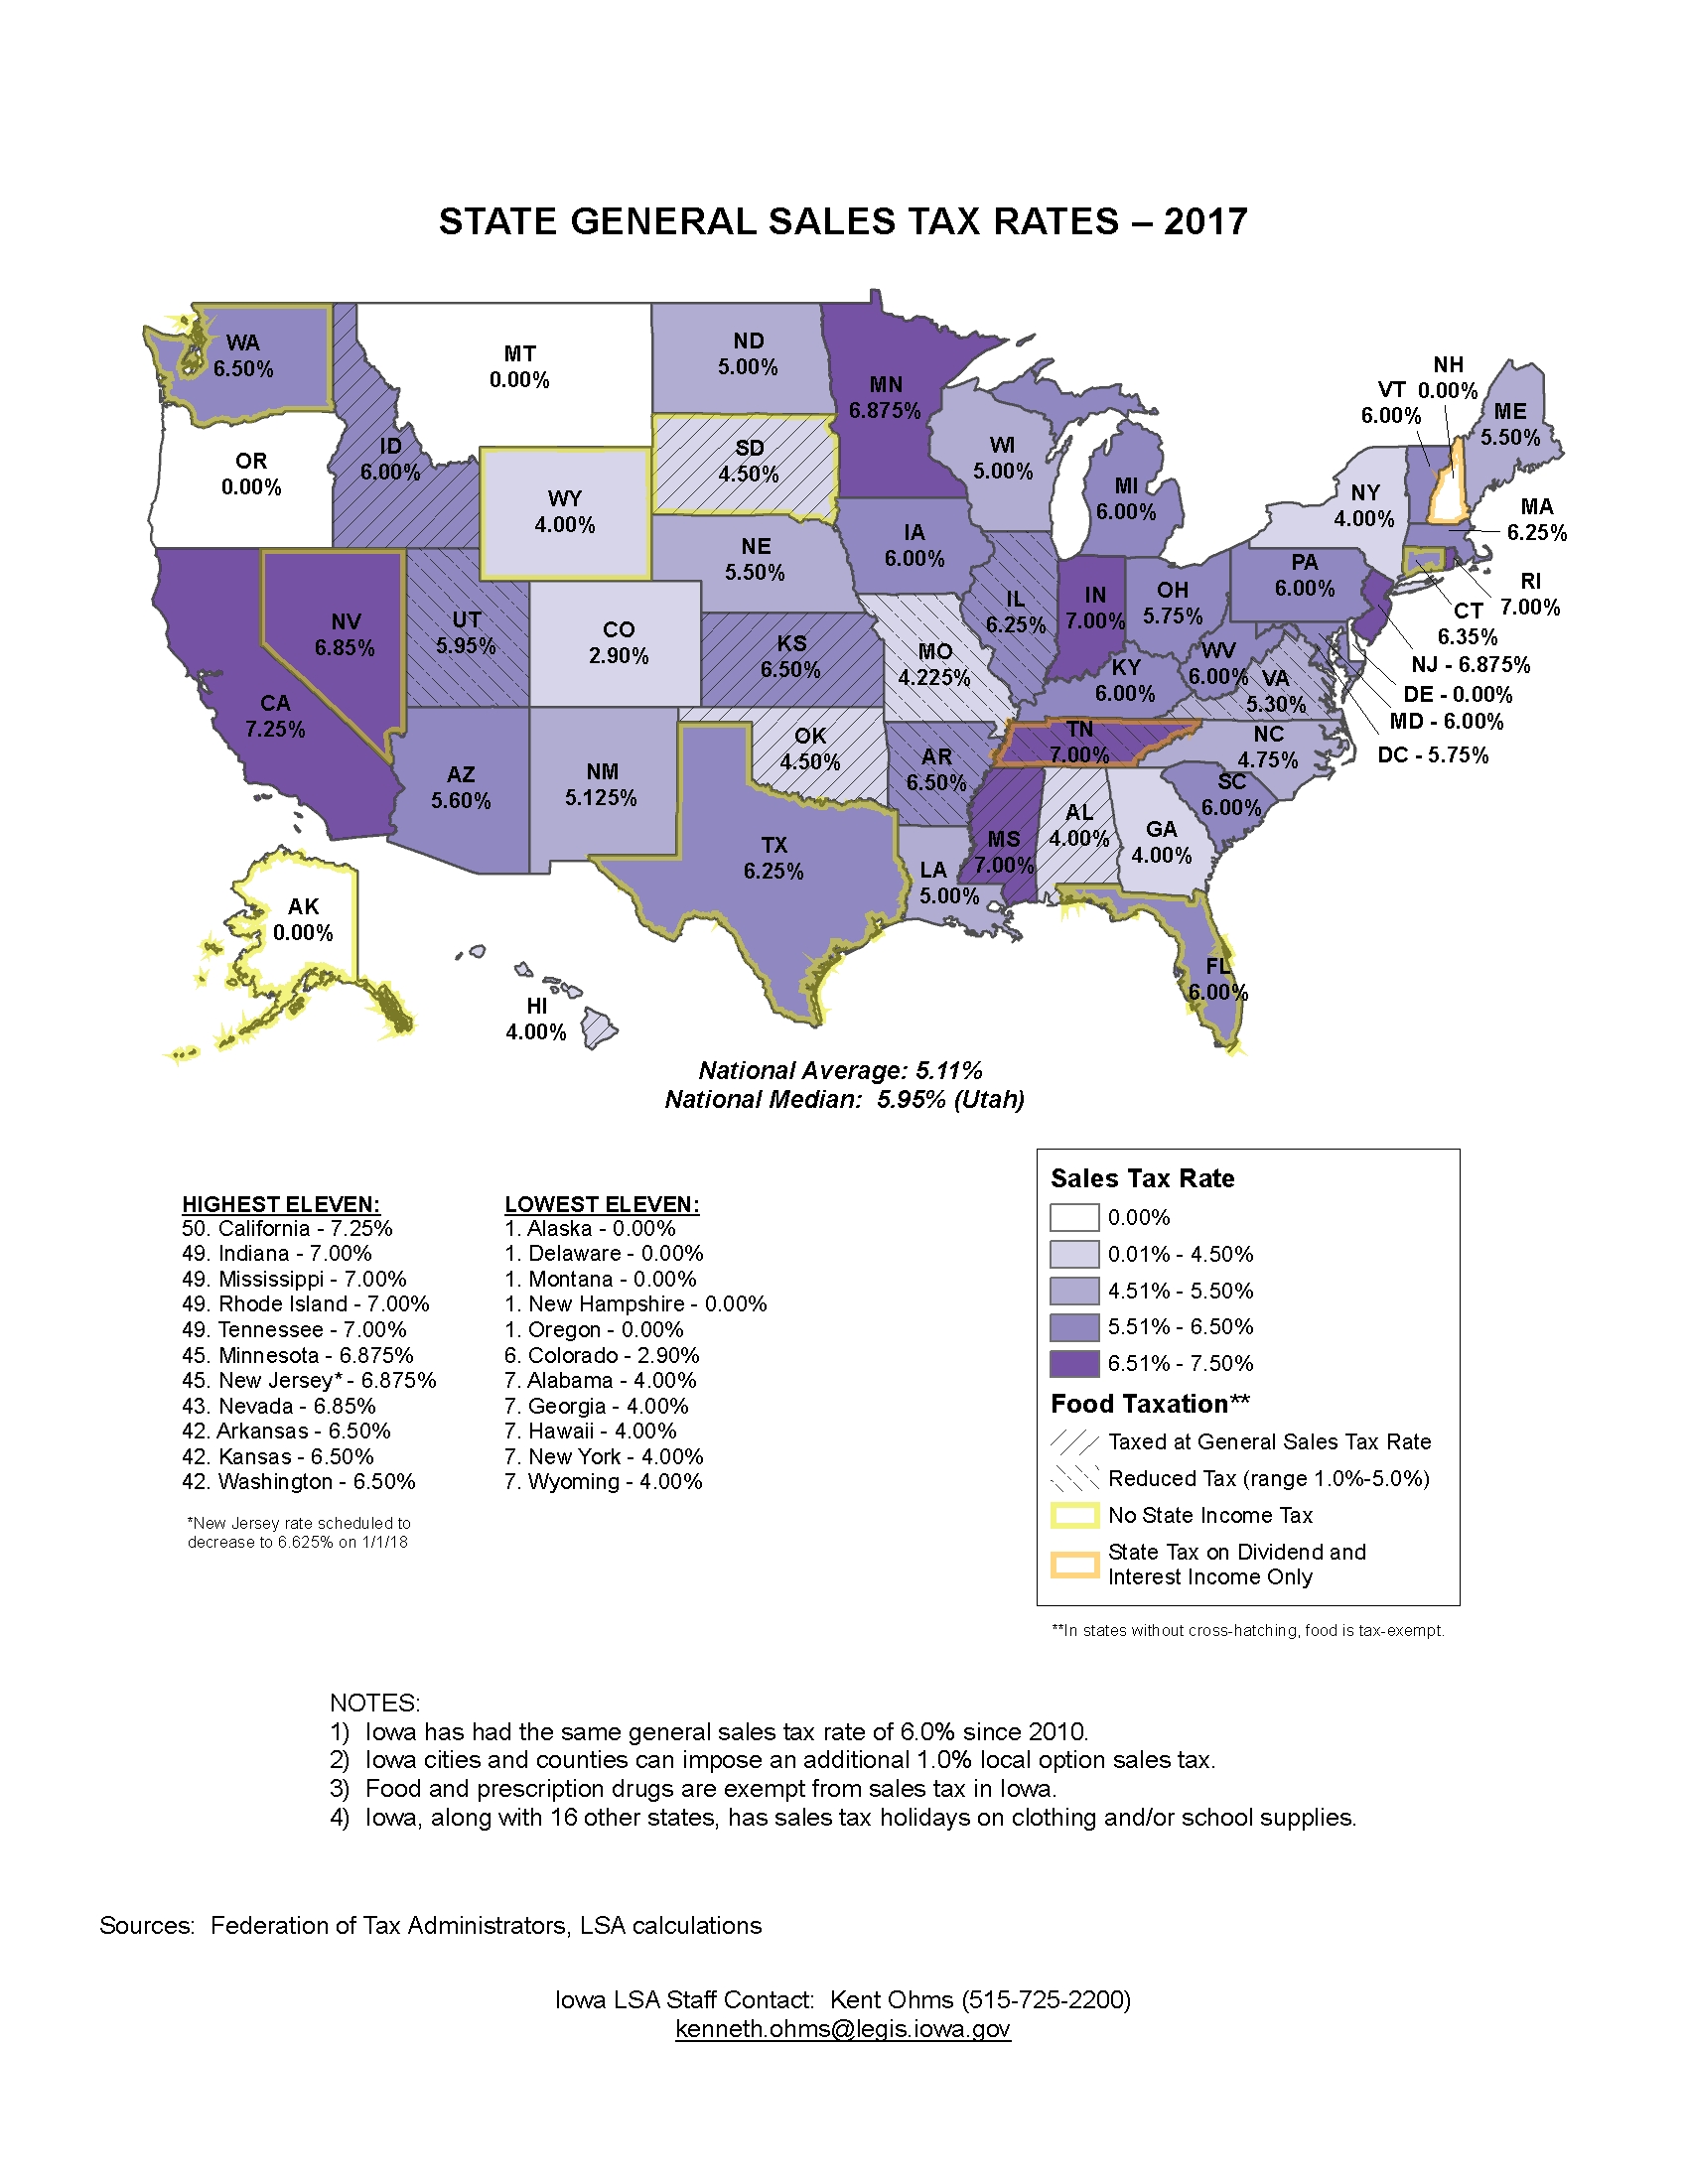
State General Sales Tax Rates — 2017
|
|
|
|
|
| 05/08/2017 |
Iowa Insights |
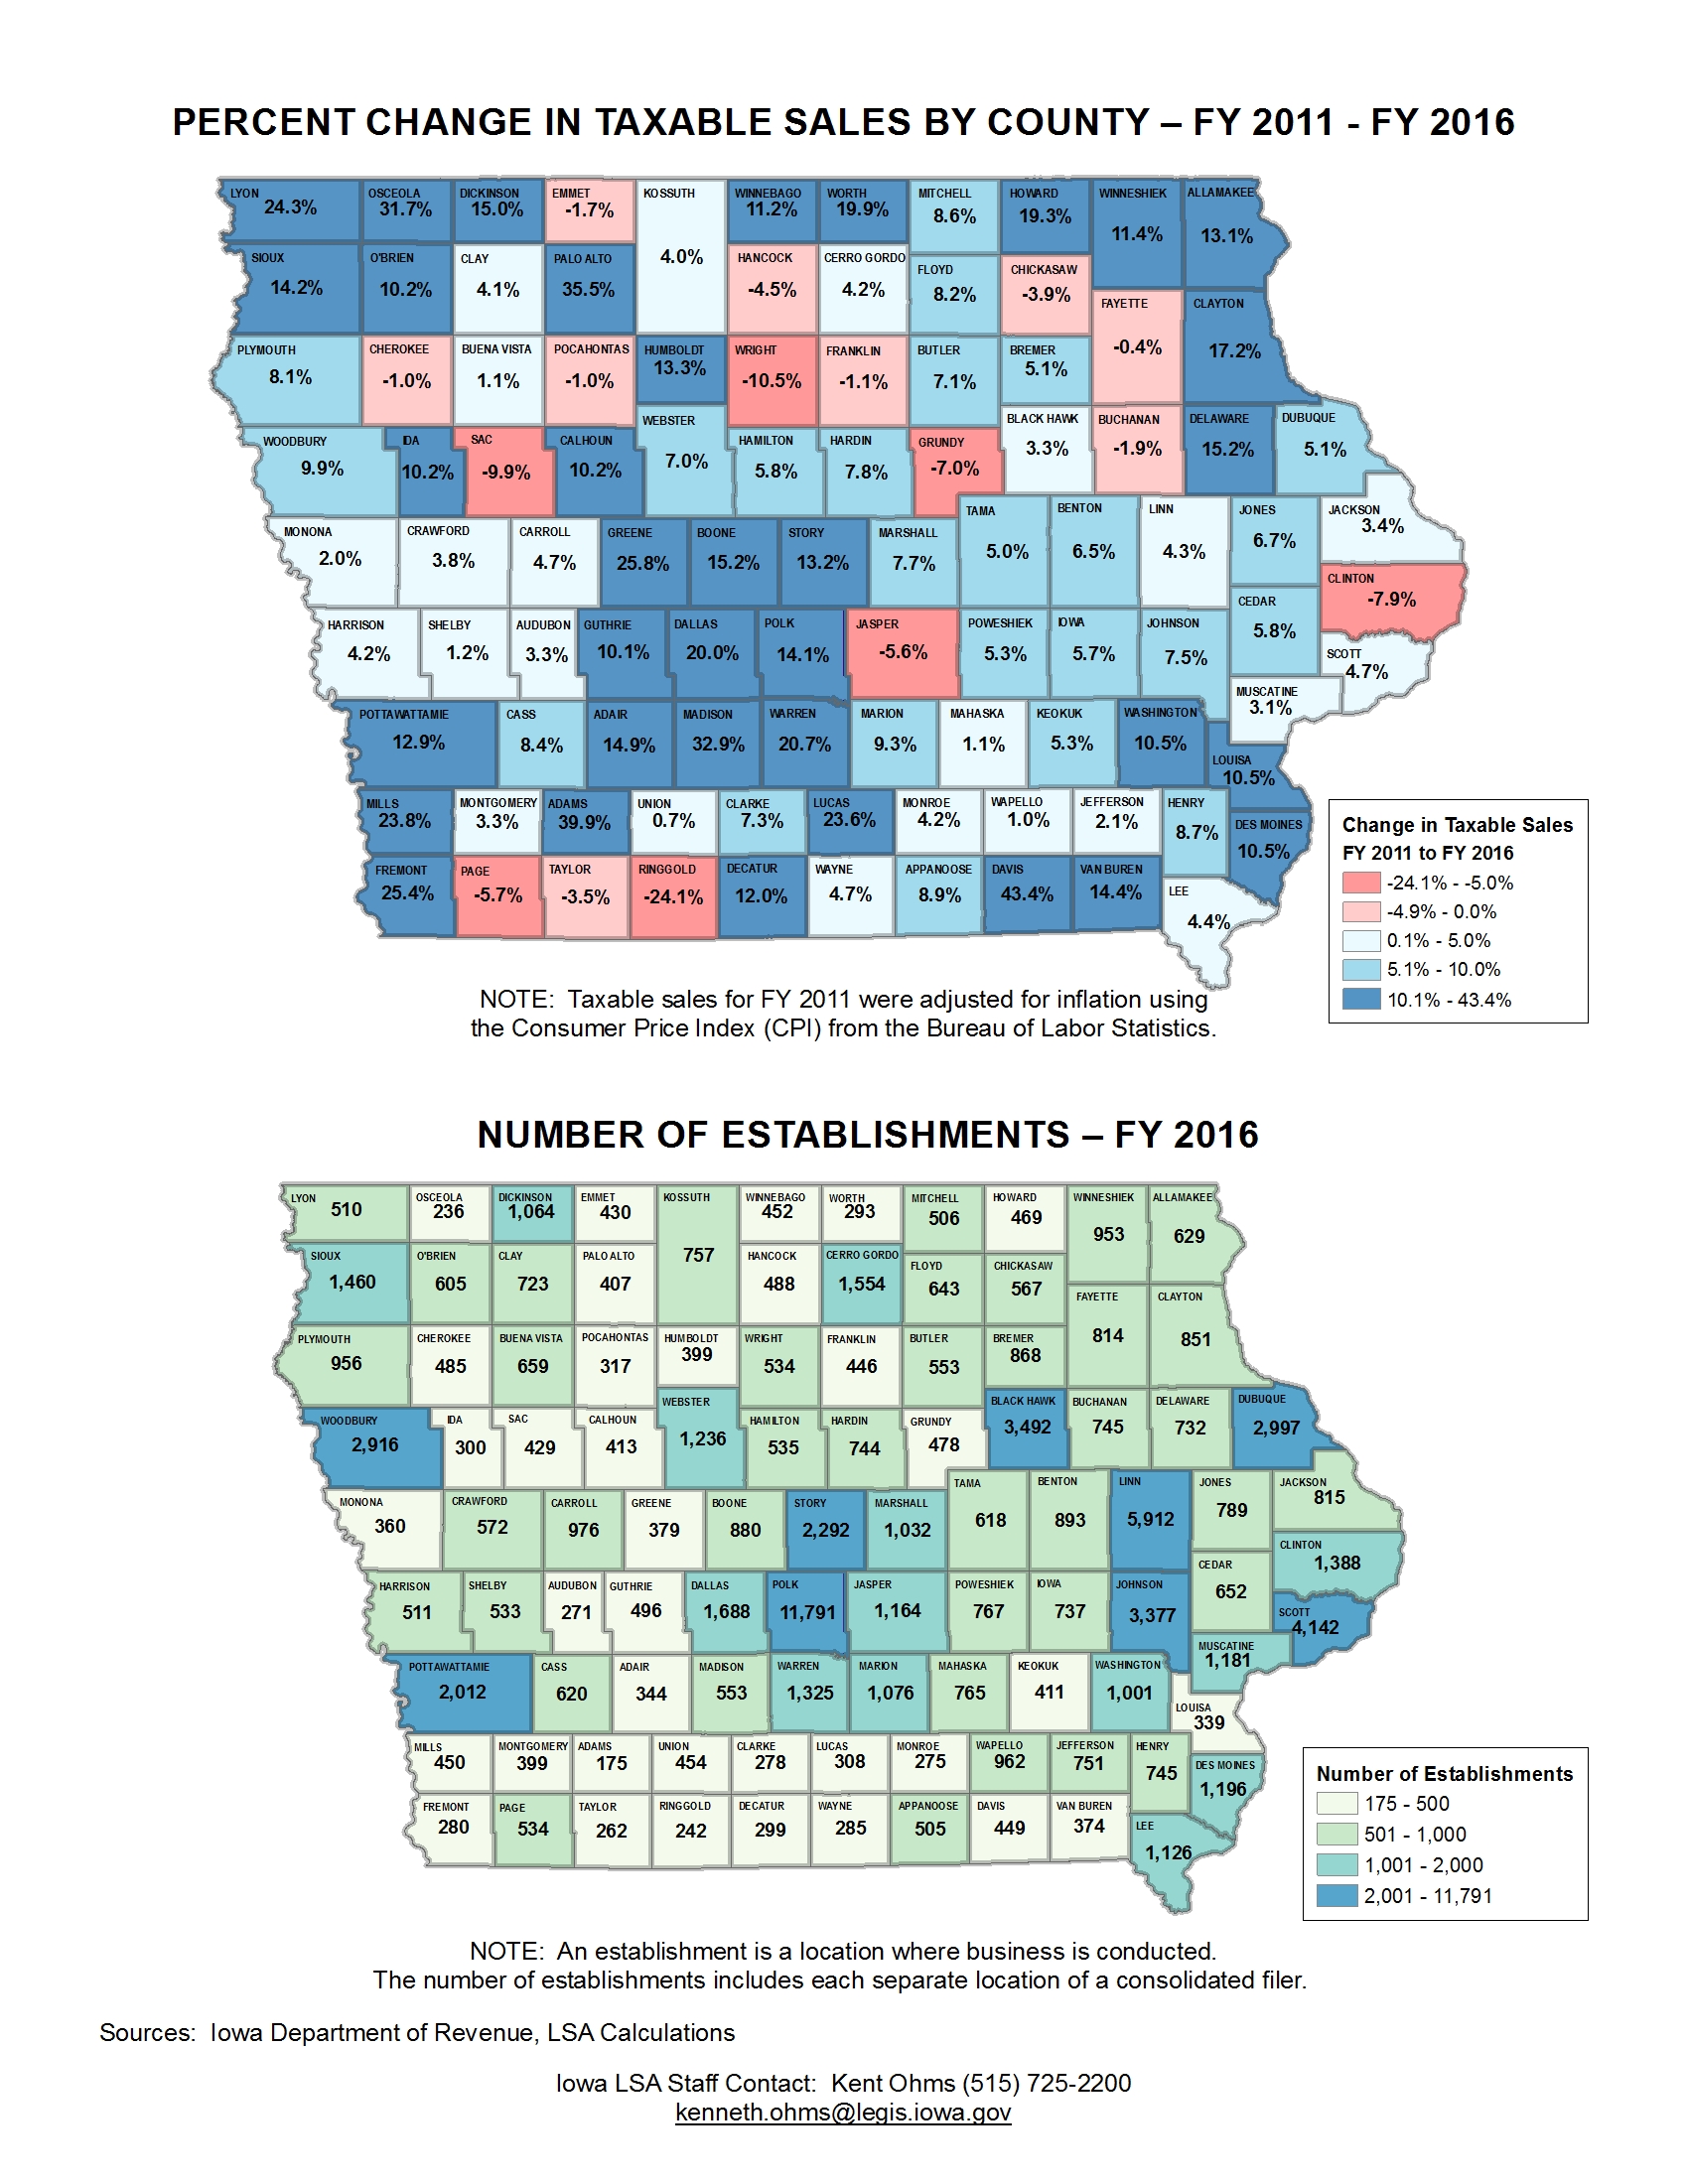
Number of Establishments and Percent Change in Taxable Sales by County — FY 2011-FY2016
|
|
|
|
|
| 05/01/2017 |
Iowa Insights |
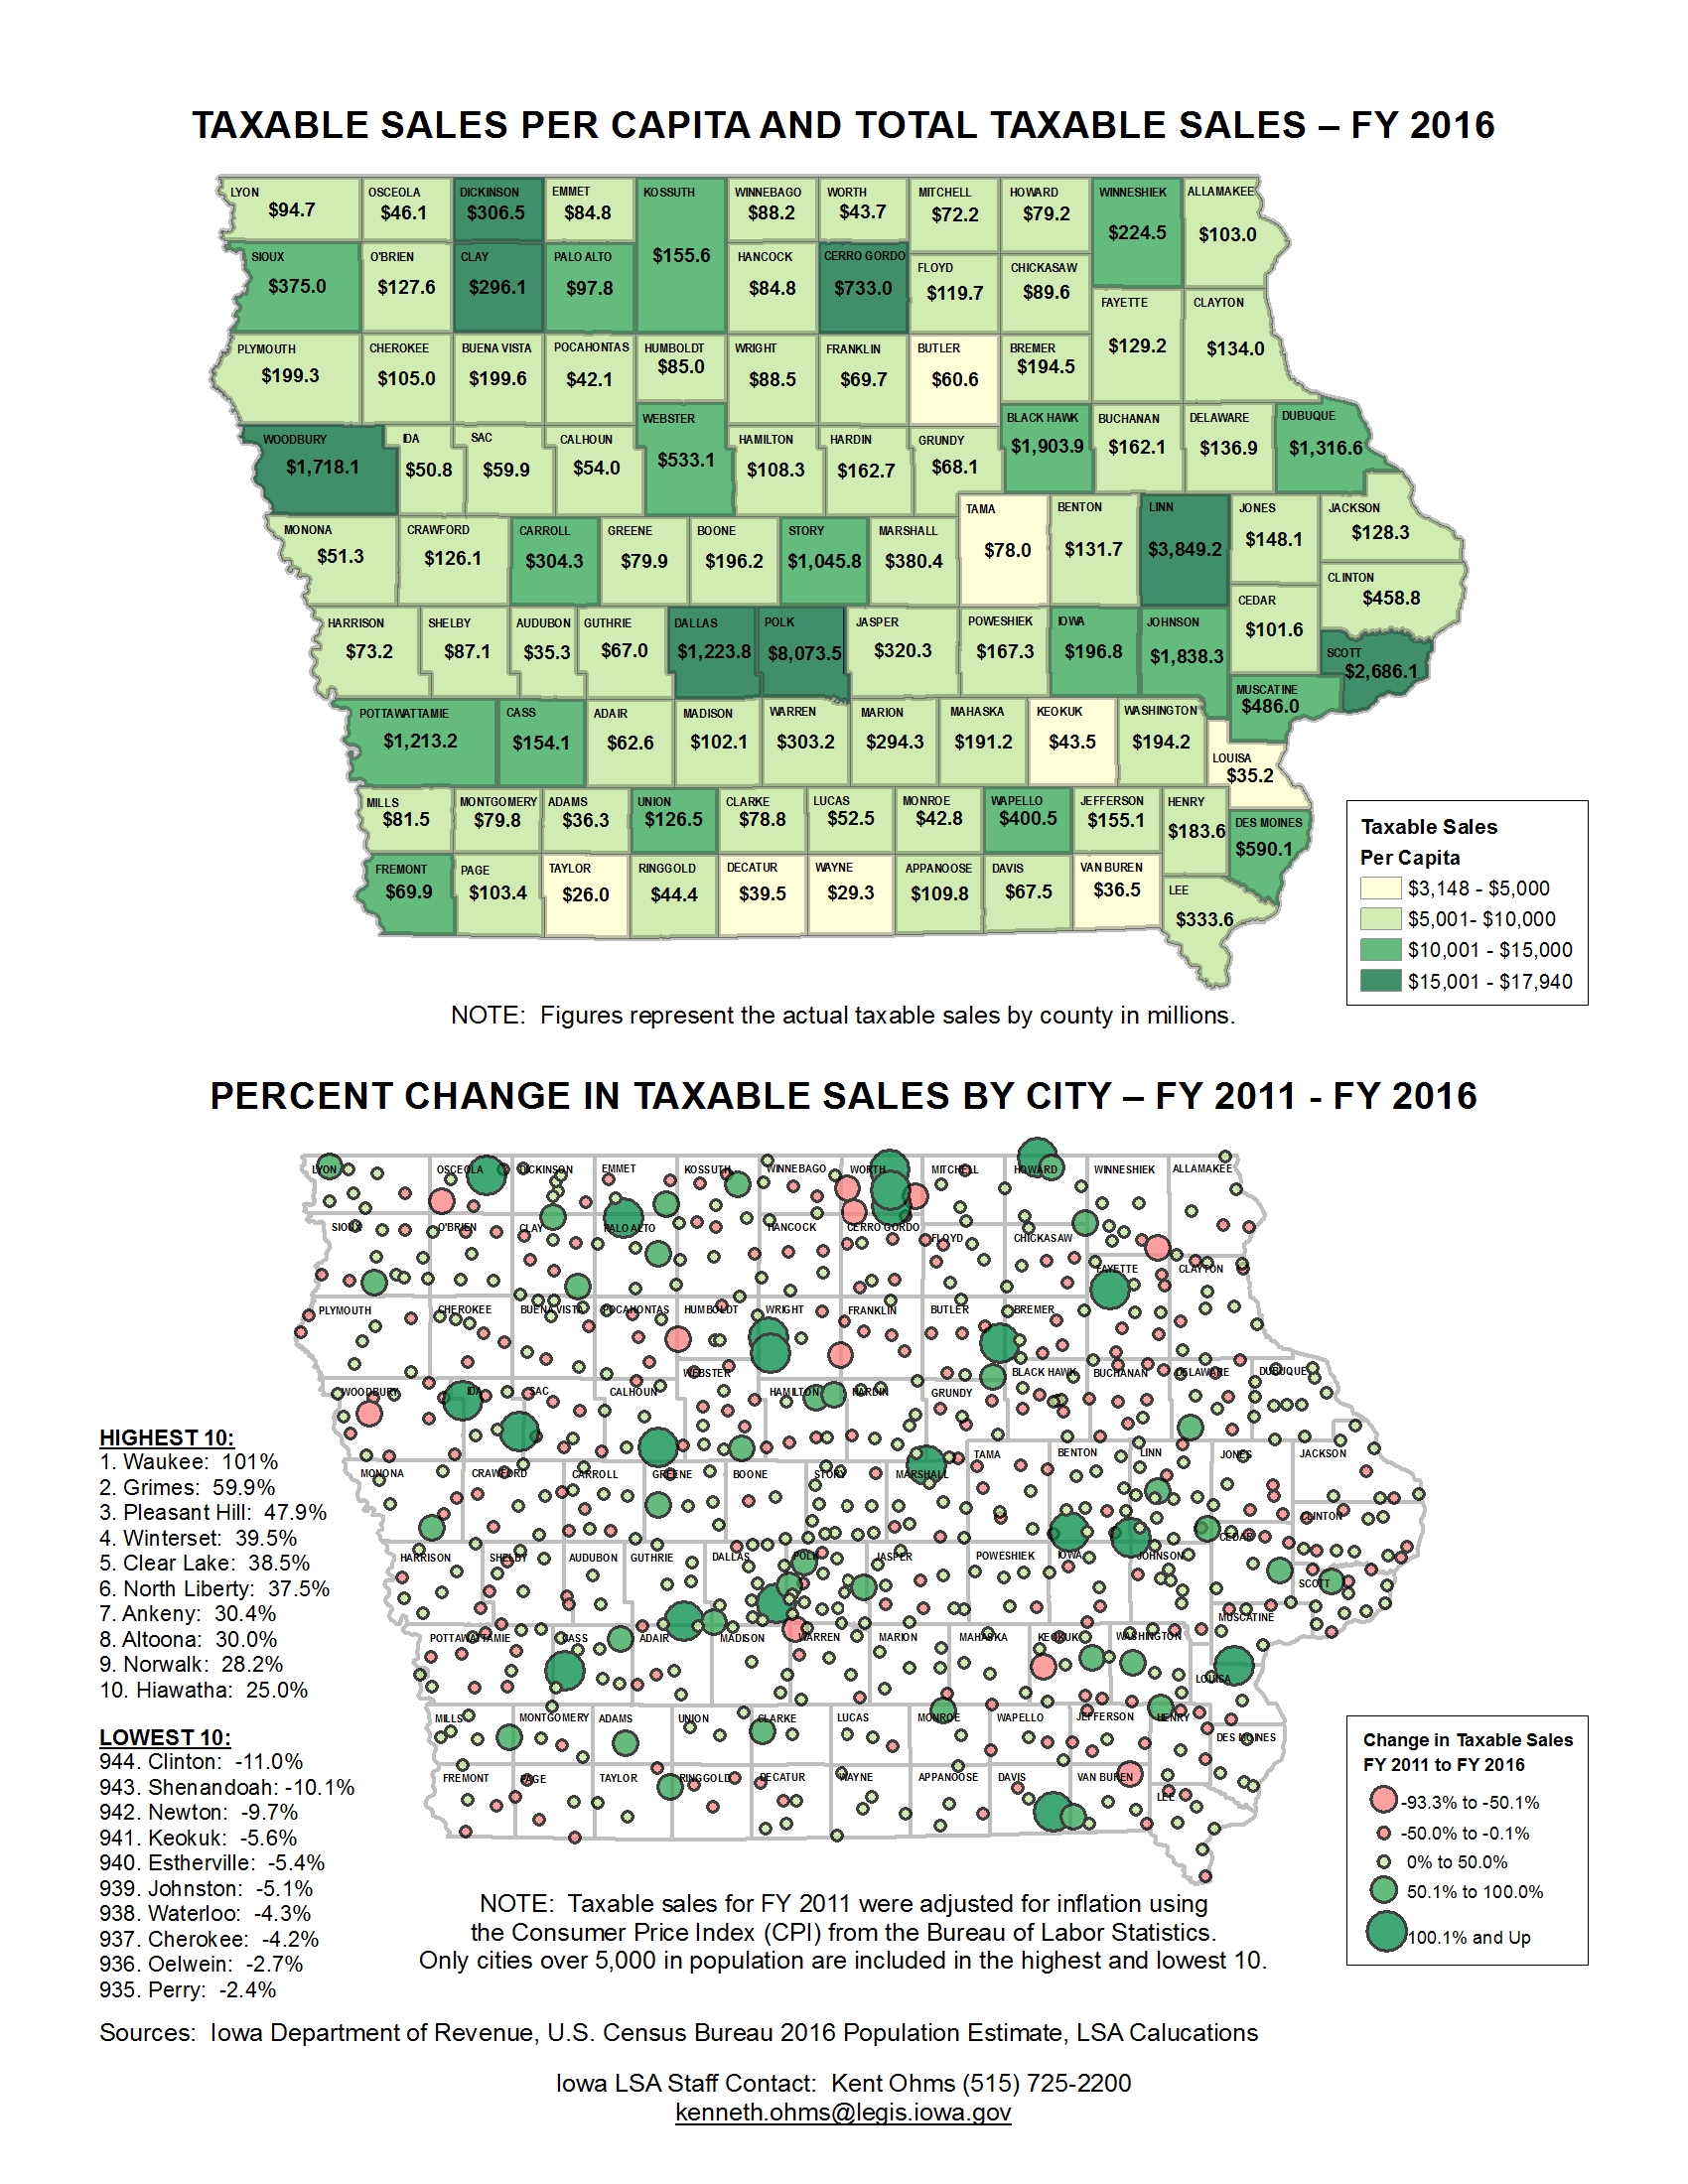
Taxable Sales Per Capita — FY 2016 and Percent Change by City — FY 2011-FY2017
|
|
|
|
|
| 04/24/2017 |
Iowa Insights |
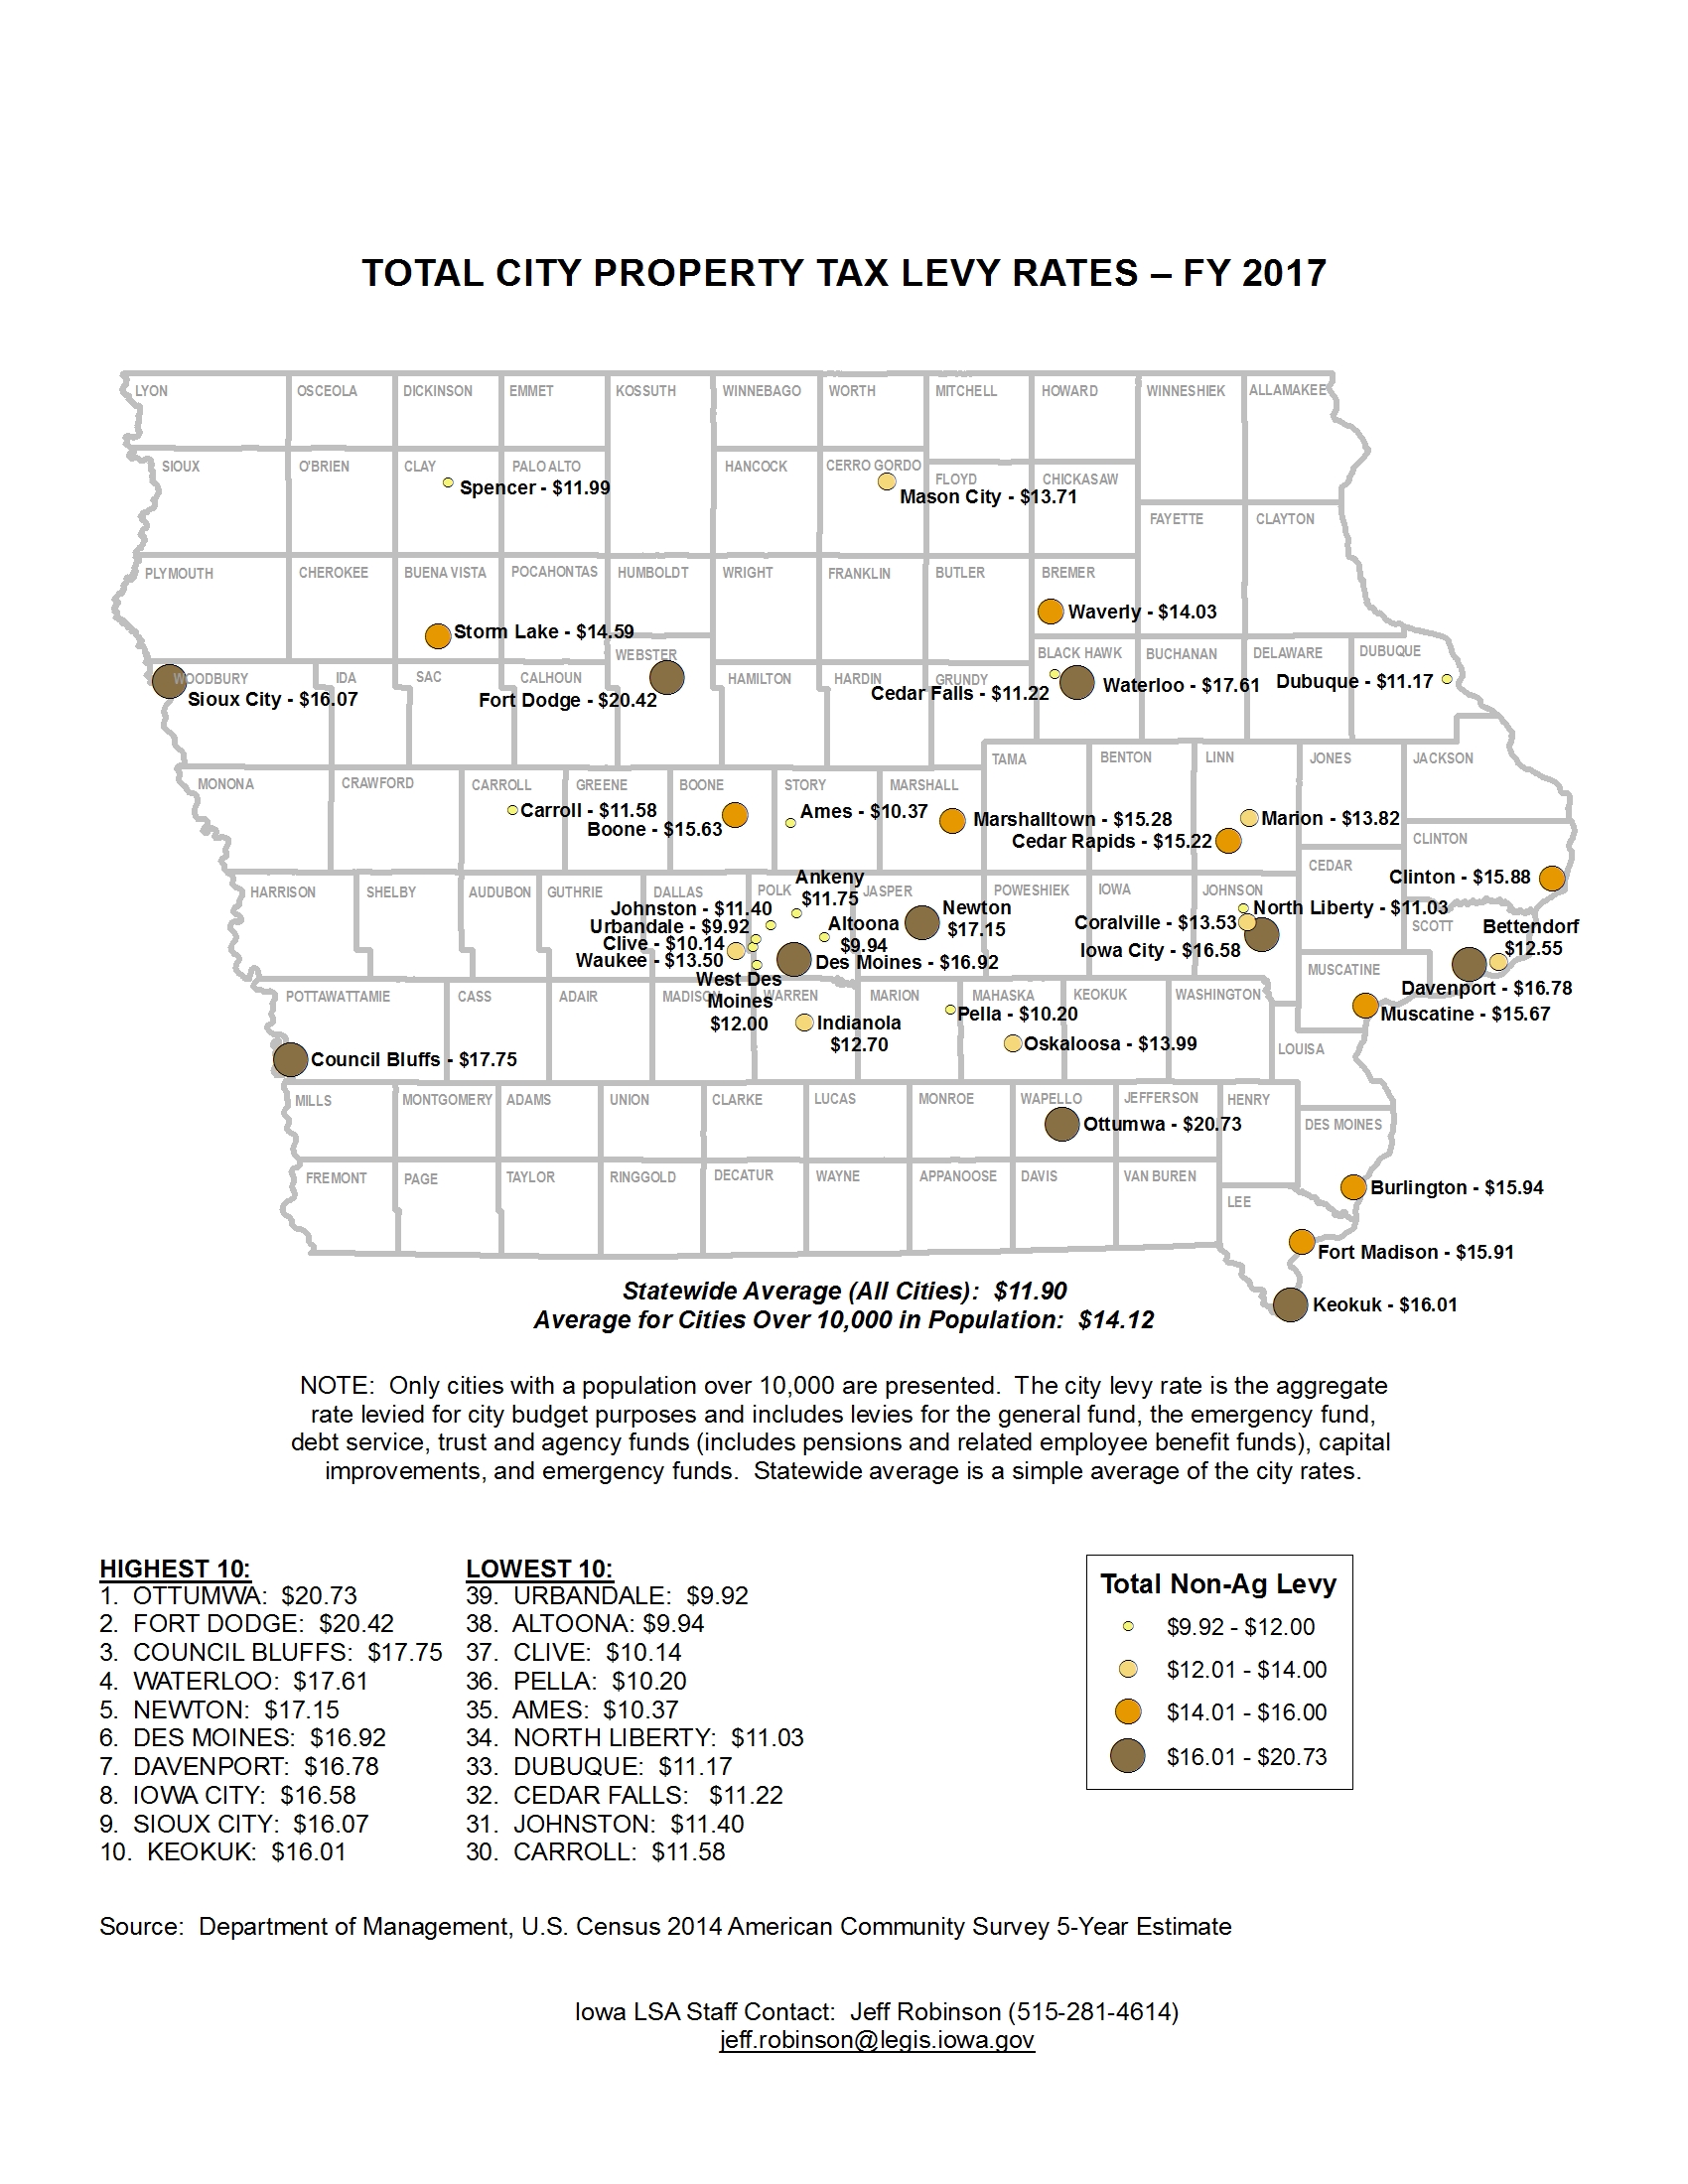
Total City Property Tax Levy Rates — FY 2017
|
|
|
|
|
| 04/17/2017 |
Iowa Insights |
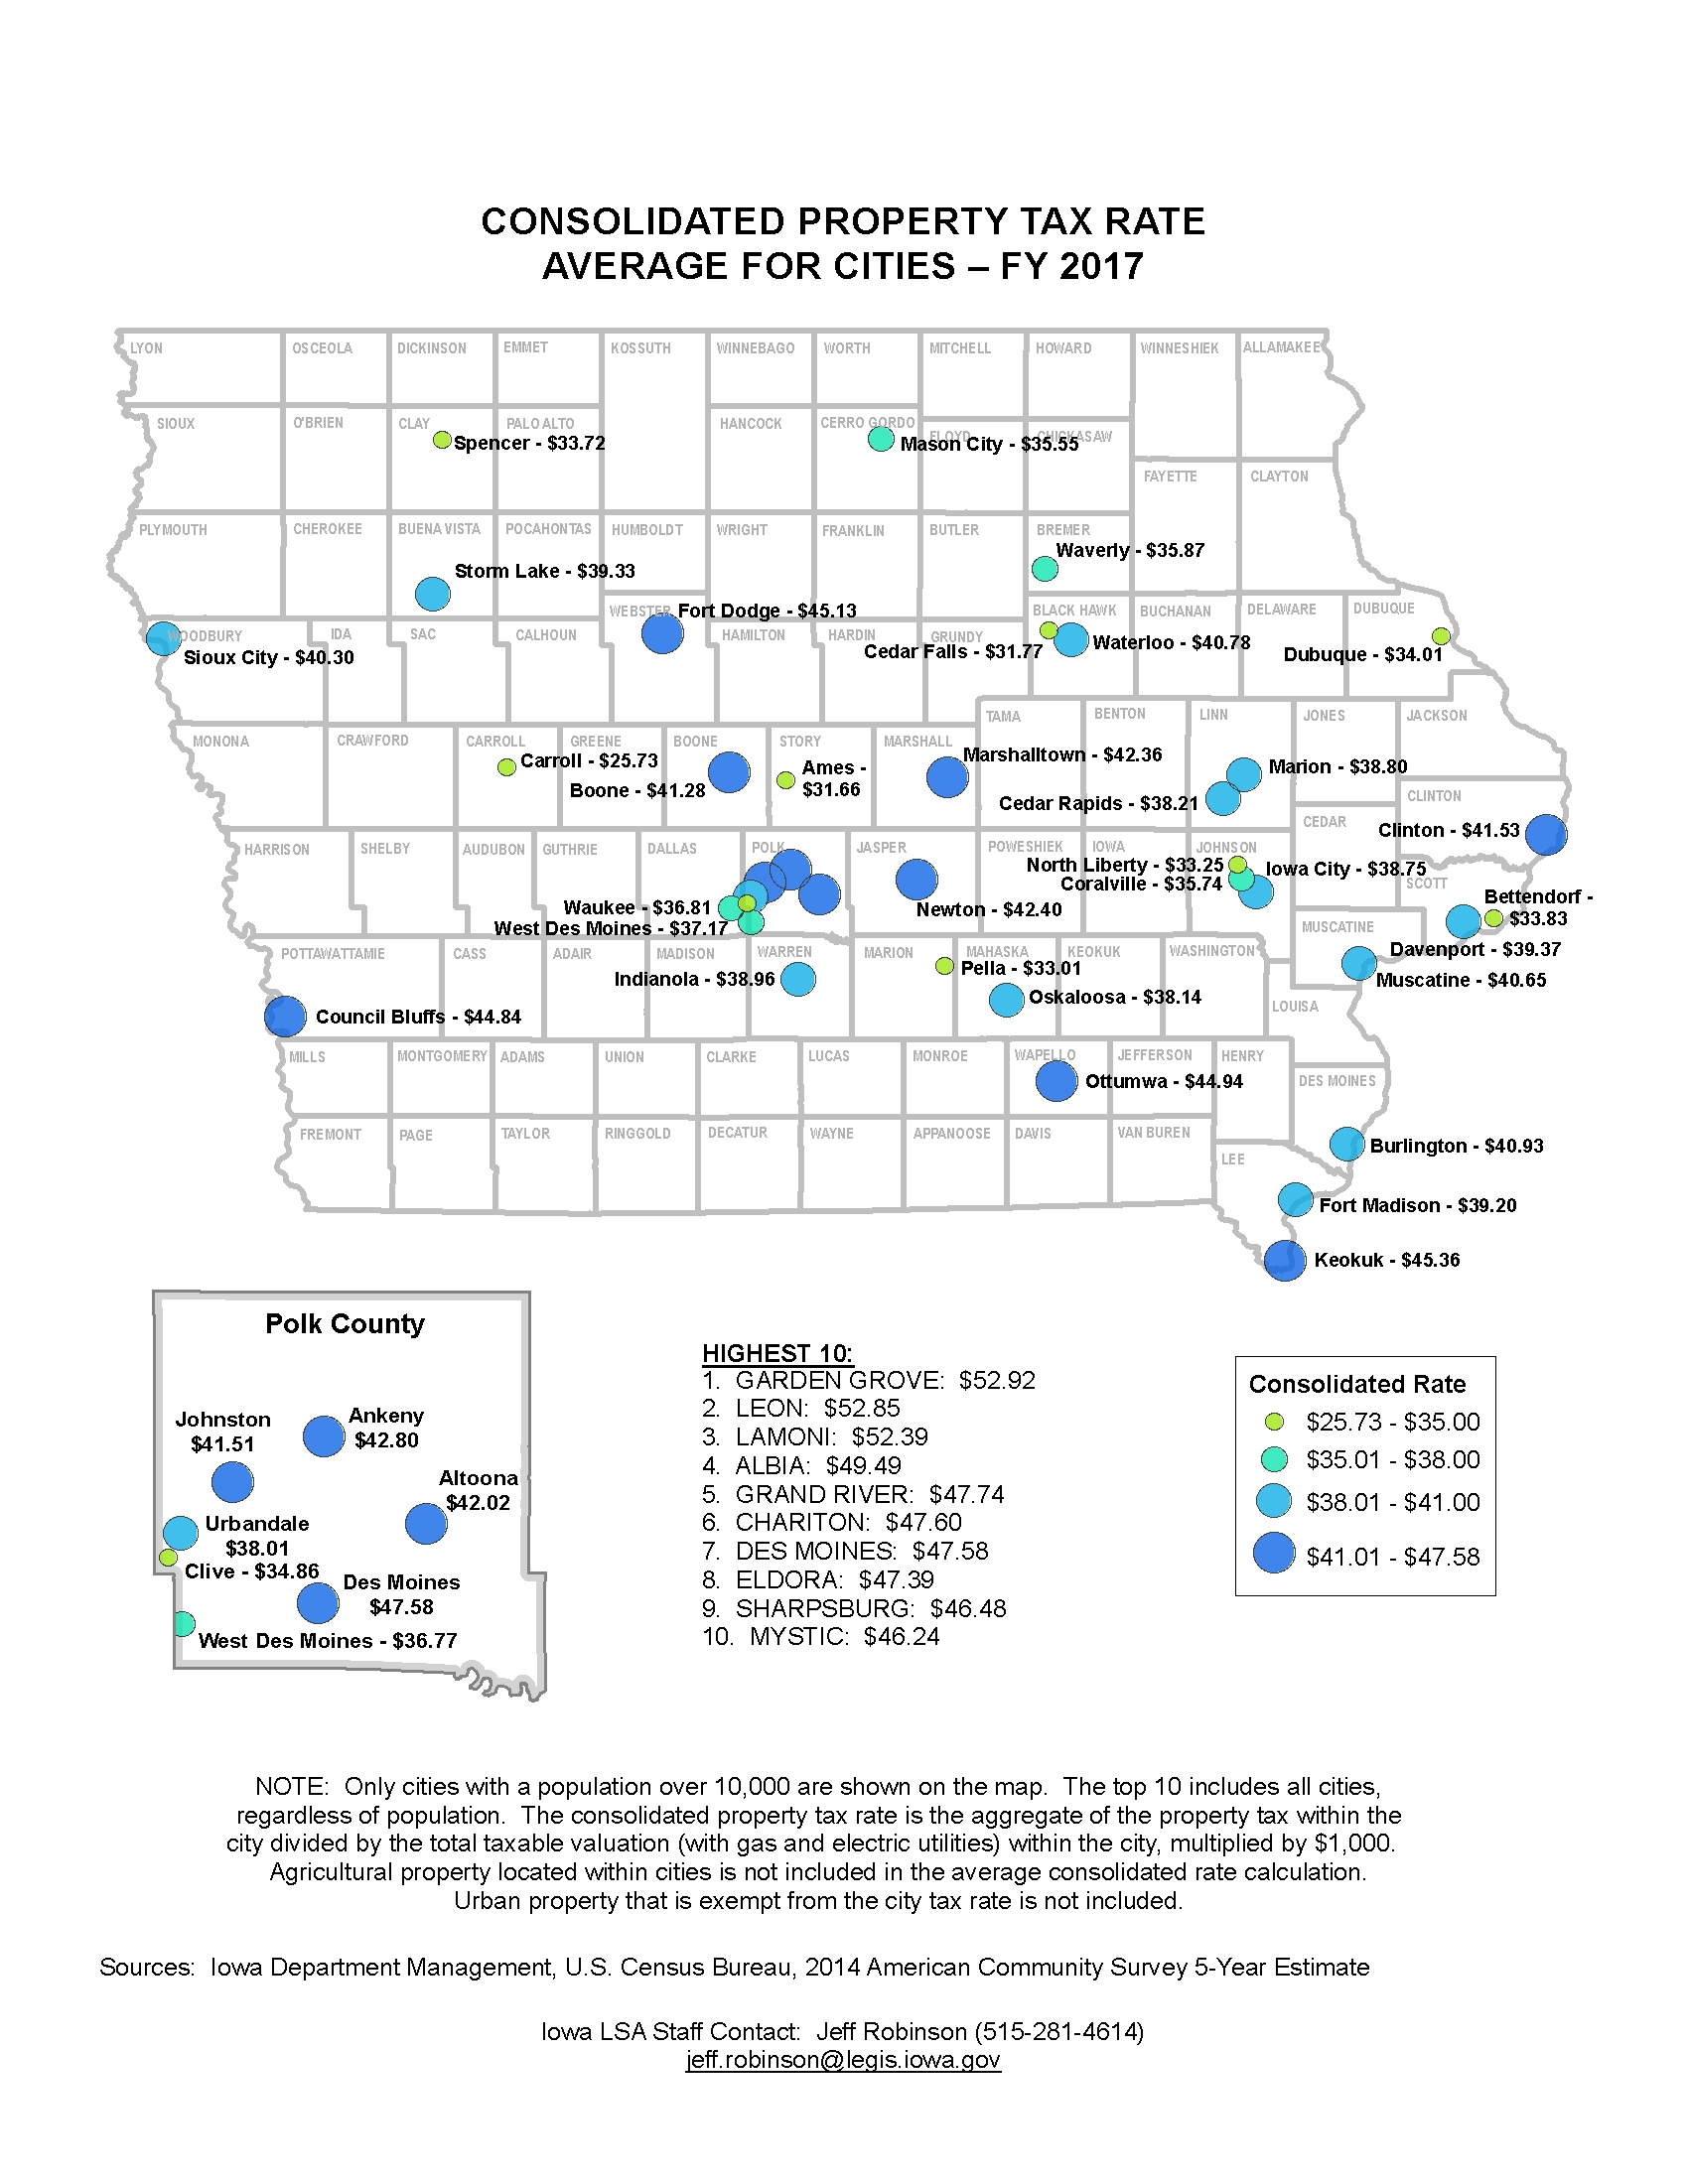
Consolidated Property Tax Rate - Average for Cities — FY 2017
|
|
|
|
|
| 04/17/2017 |
Iowa Insights |
County Property Tax Rates - Urban and Rural — FY 2017
|
|
|
|
|
| 03/20/2017 |
Iowa Insights |
Taxable Valuation by County Property Classification — FY 2017

|
|
|
|
|
| 03/13/2017 |
Iowa Insights |
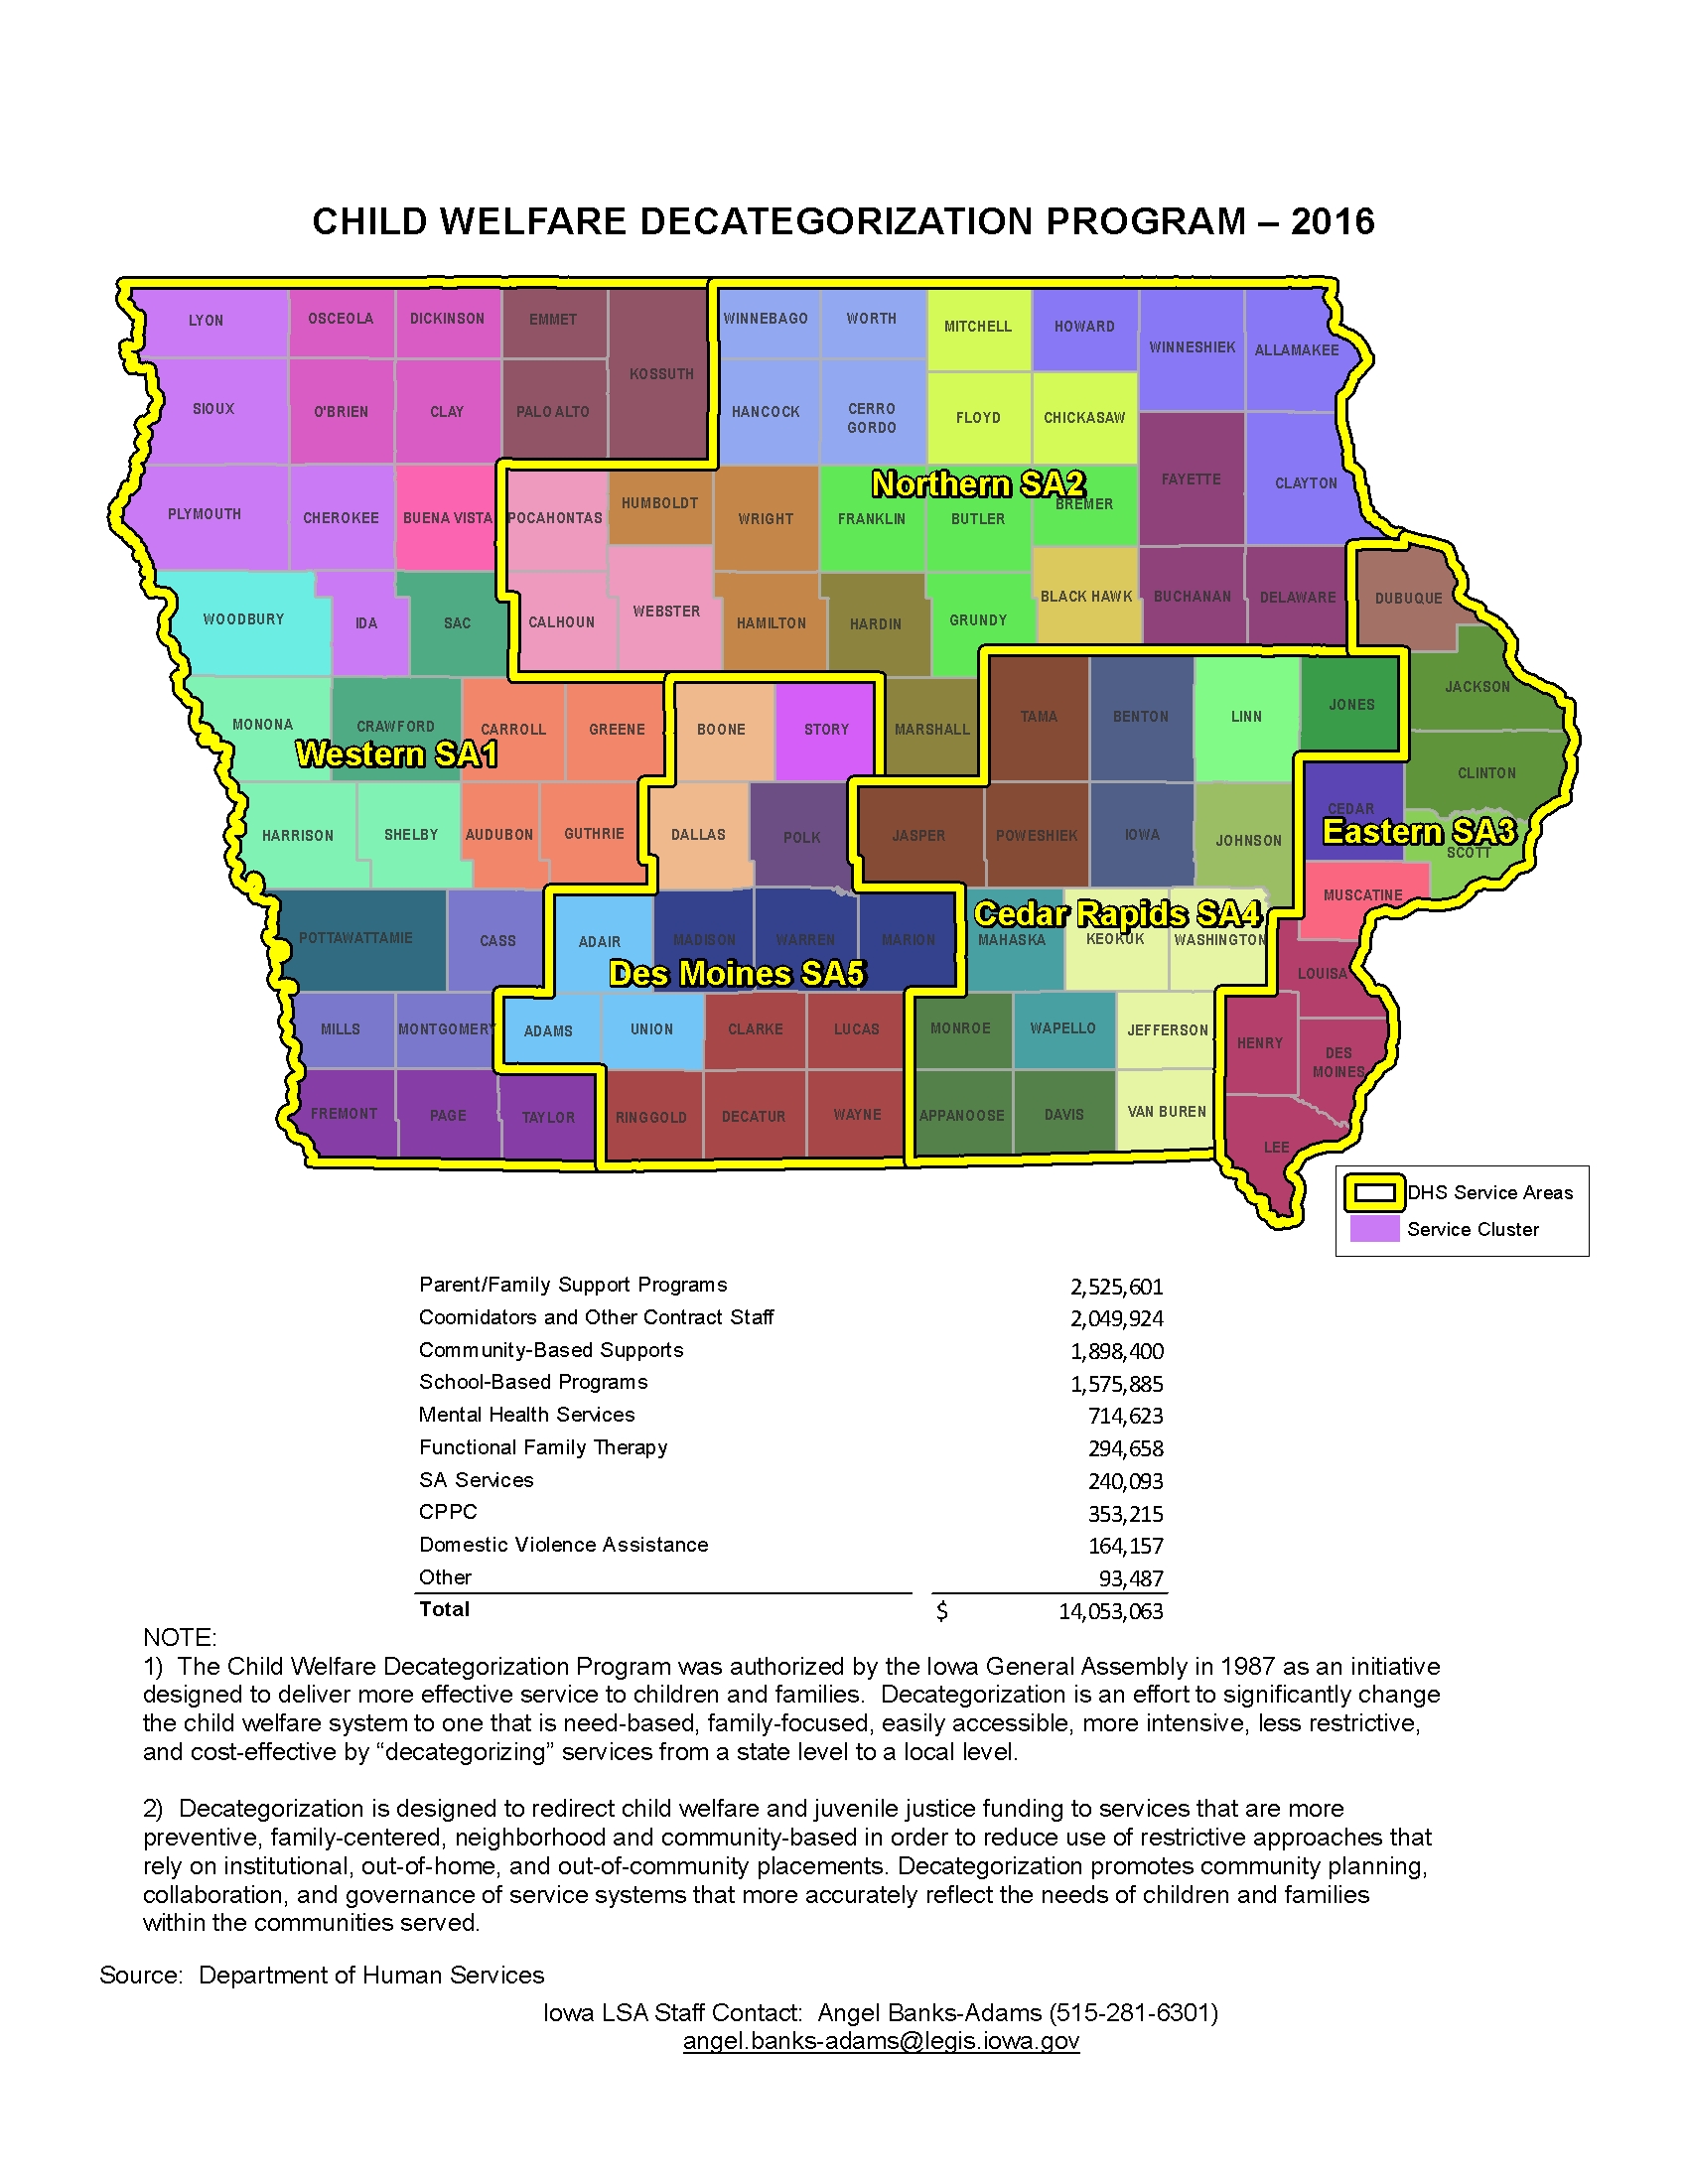
Child Welfare Decategorization Program — 2016
|
|
|
|
|
| 03/06/2017 |
Iowa Insights |
CHIP Enrollment — as of June 2016
|
|
|
|
|
| 02/27/2017 |
Iowa Insights |
Health and Wellness Plan Enrollment — as of Oct. 2016
|
|
|
|
|
| 02/20/2017 |
Iowa Insights |
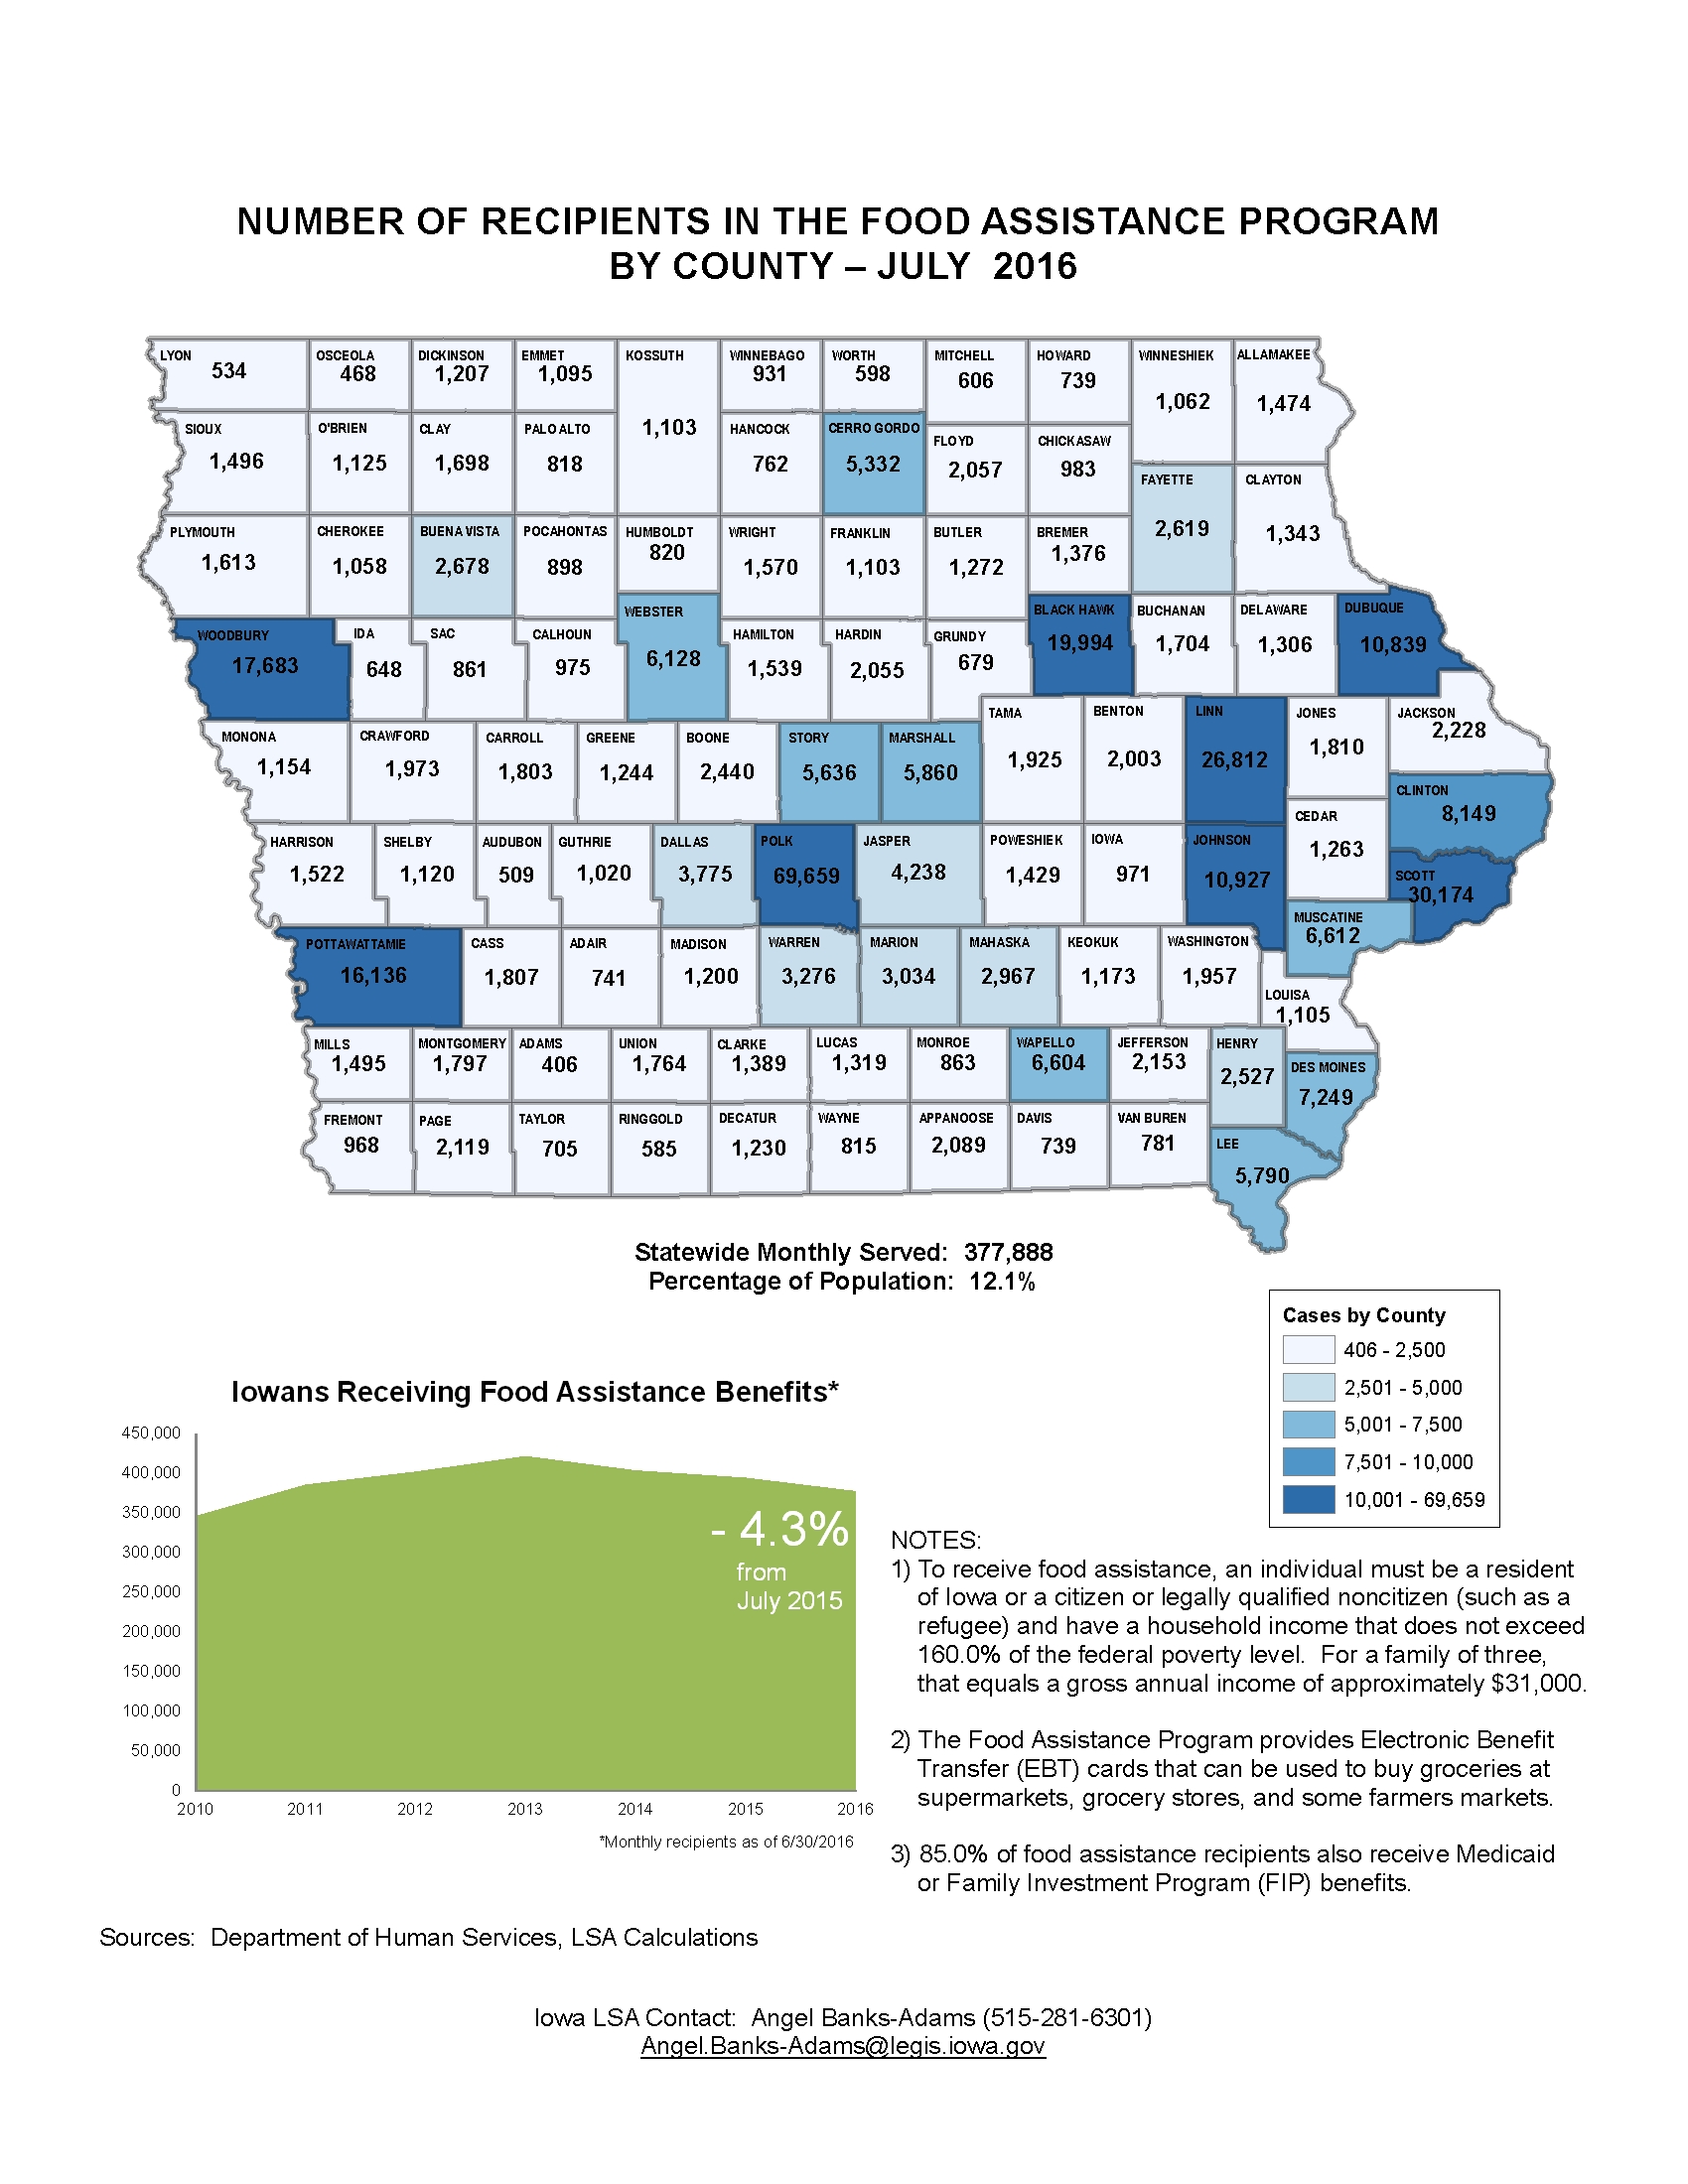
Recipients Served in the Food Assistance Program by County — July 2016
|
|
|
|
|
| 02/13/2017 |
Iowa Insights |
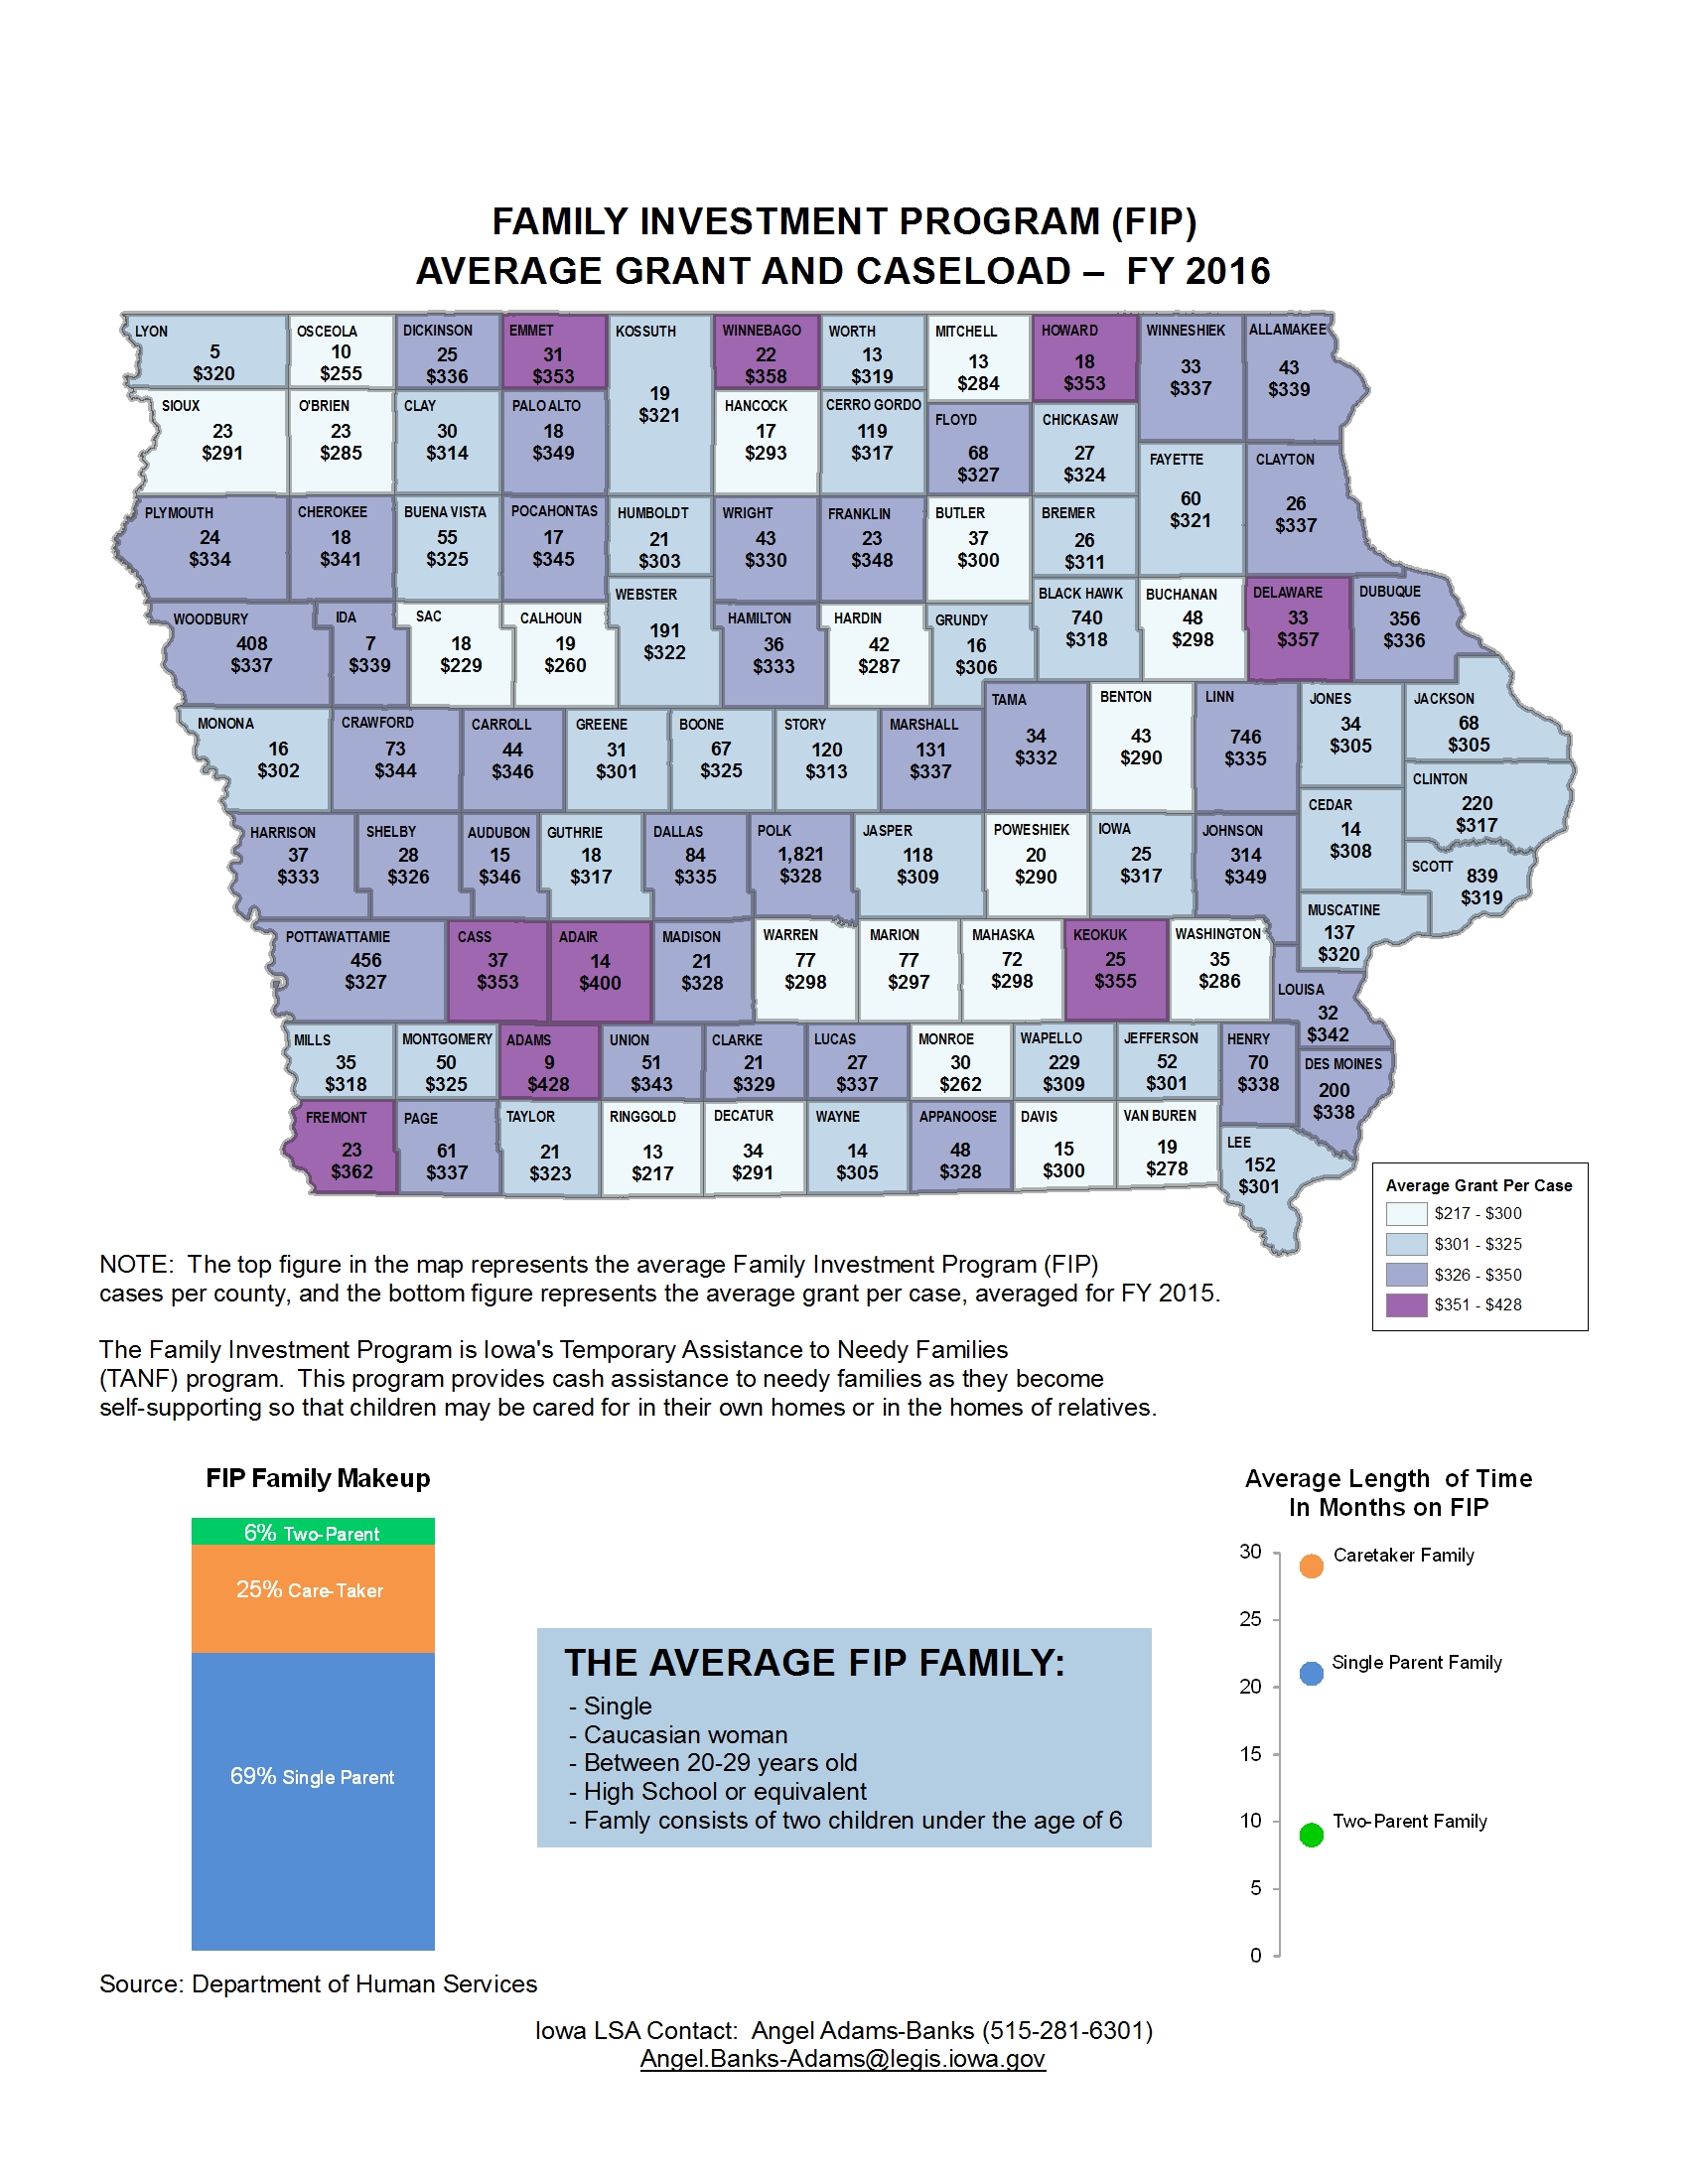
Family Investment Program - Average Grant and Caseload - FY16
|
|
|
|
|
| 01/30/2017 |
Iowa Insights |
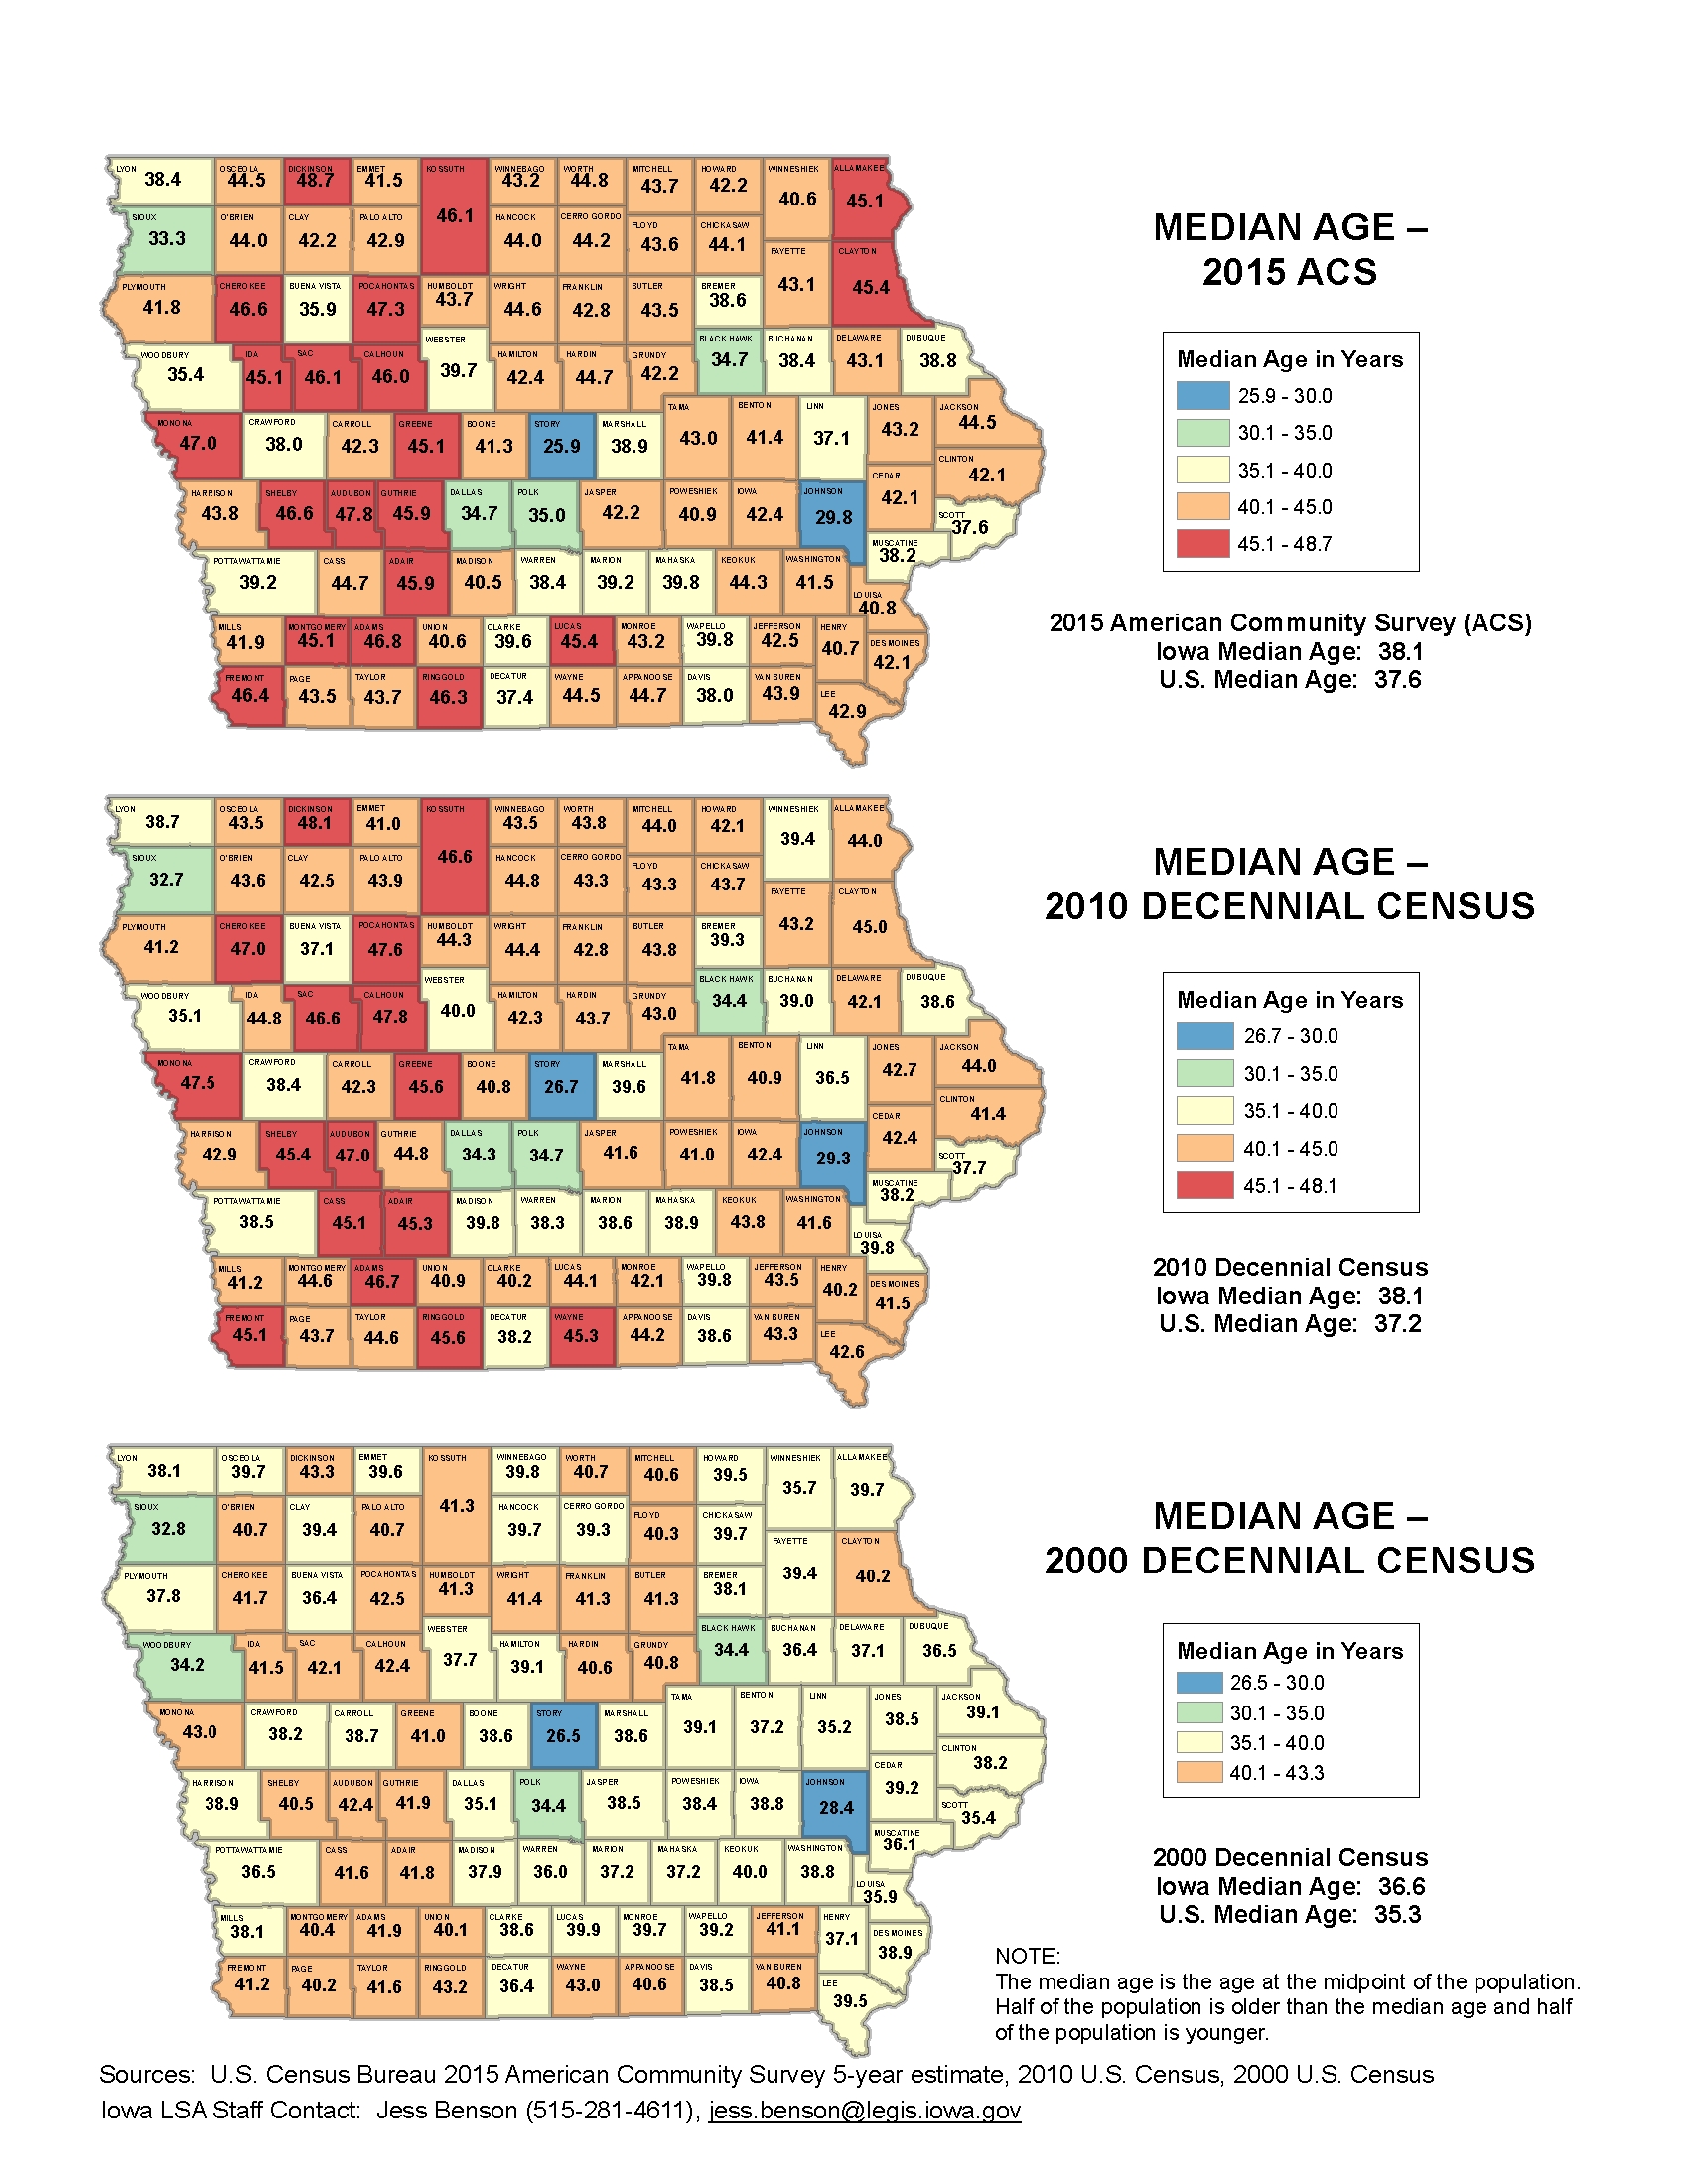
Median Age by County – 2000-2015
|
|
|
|
|
| 01/23/2017 |
Iowa Insights |
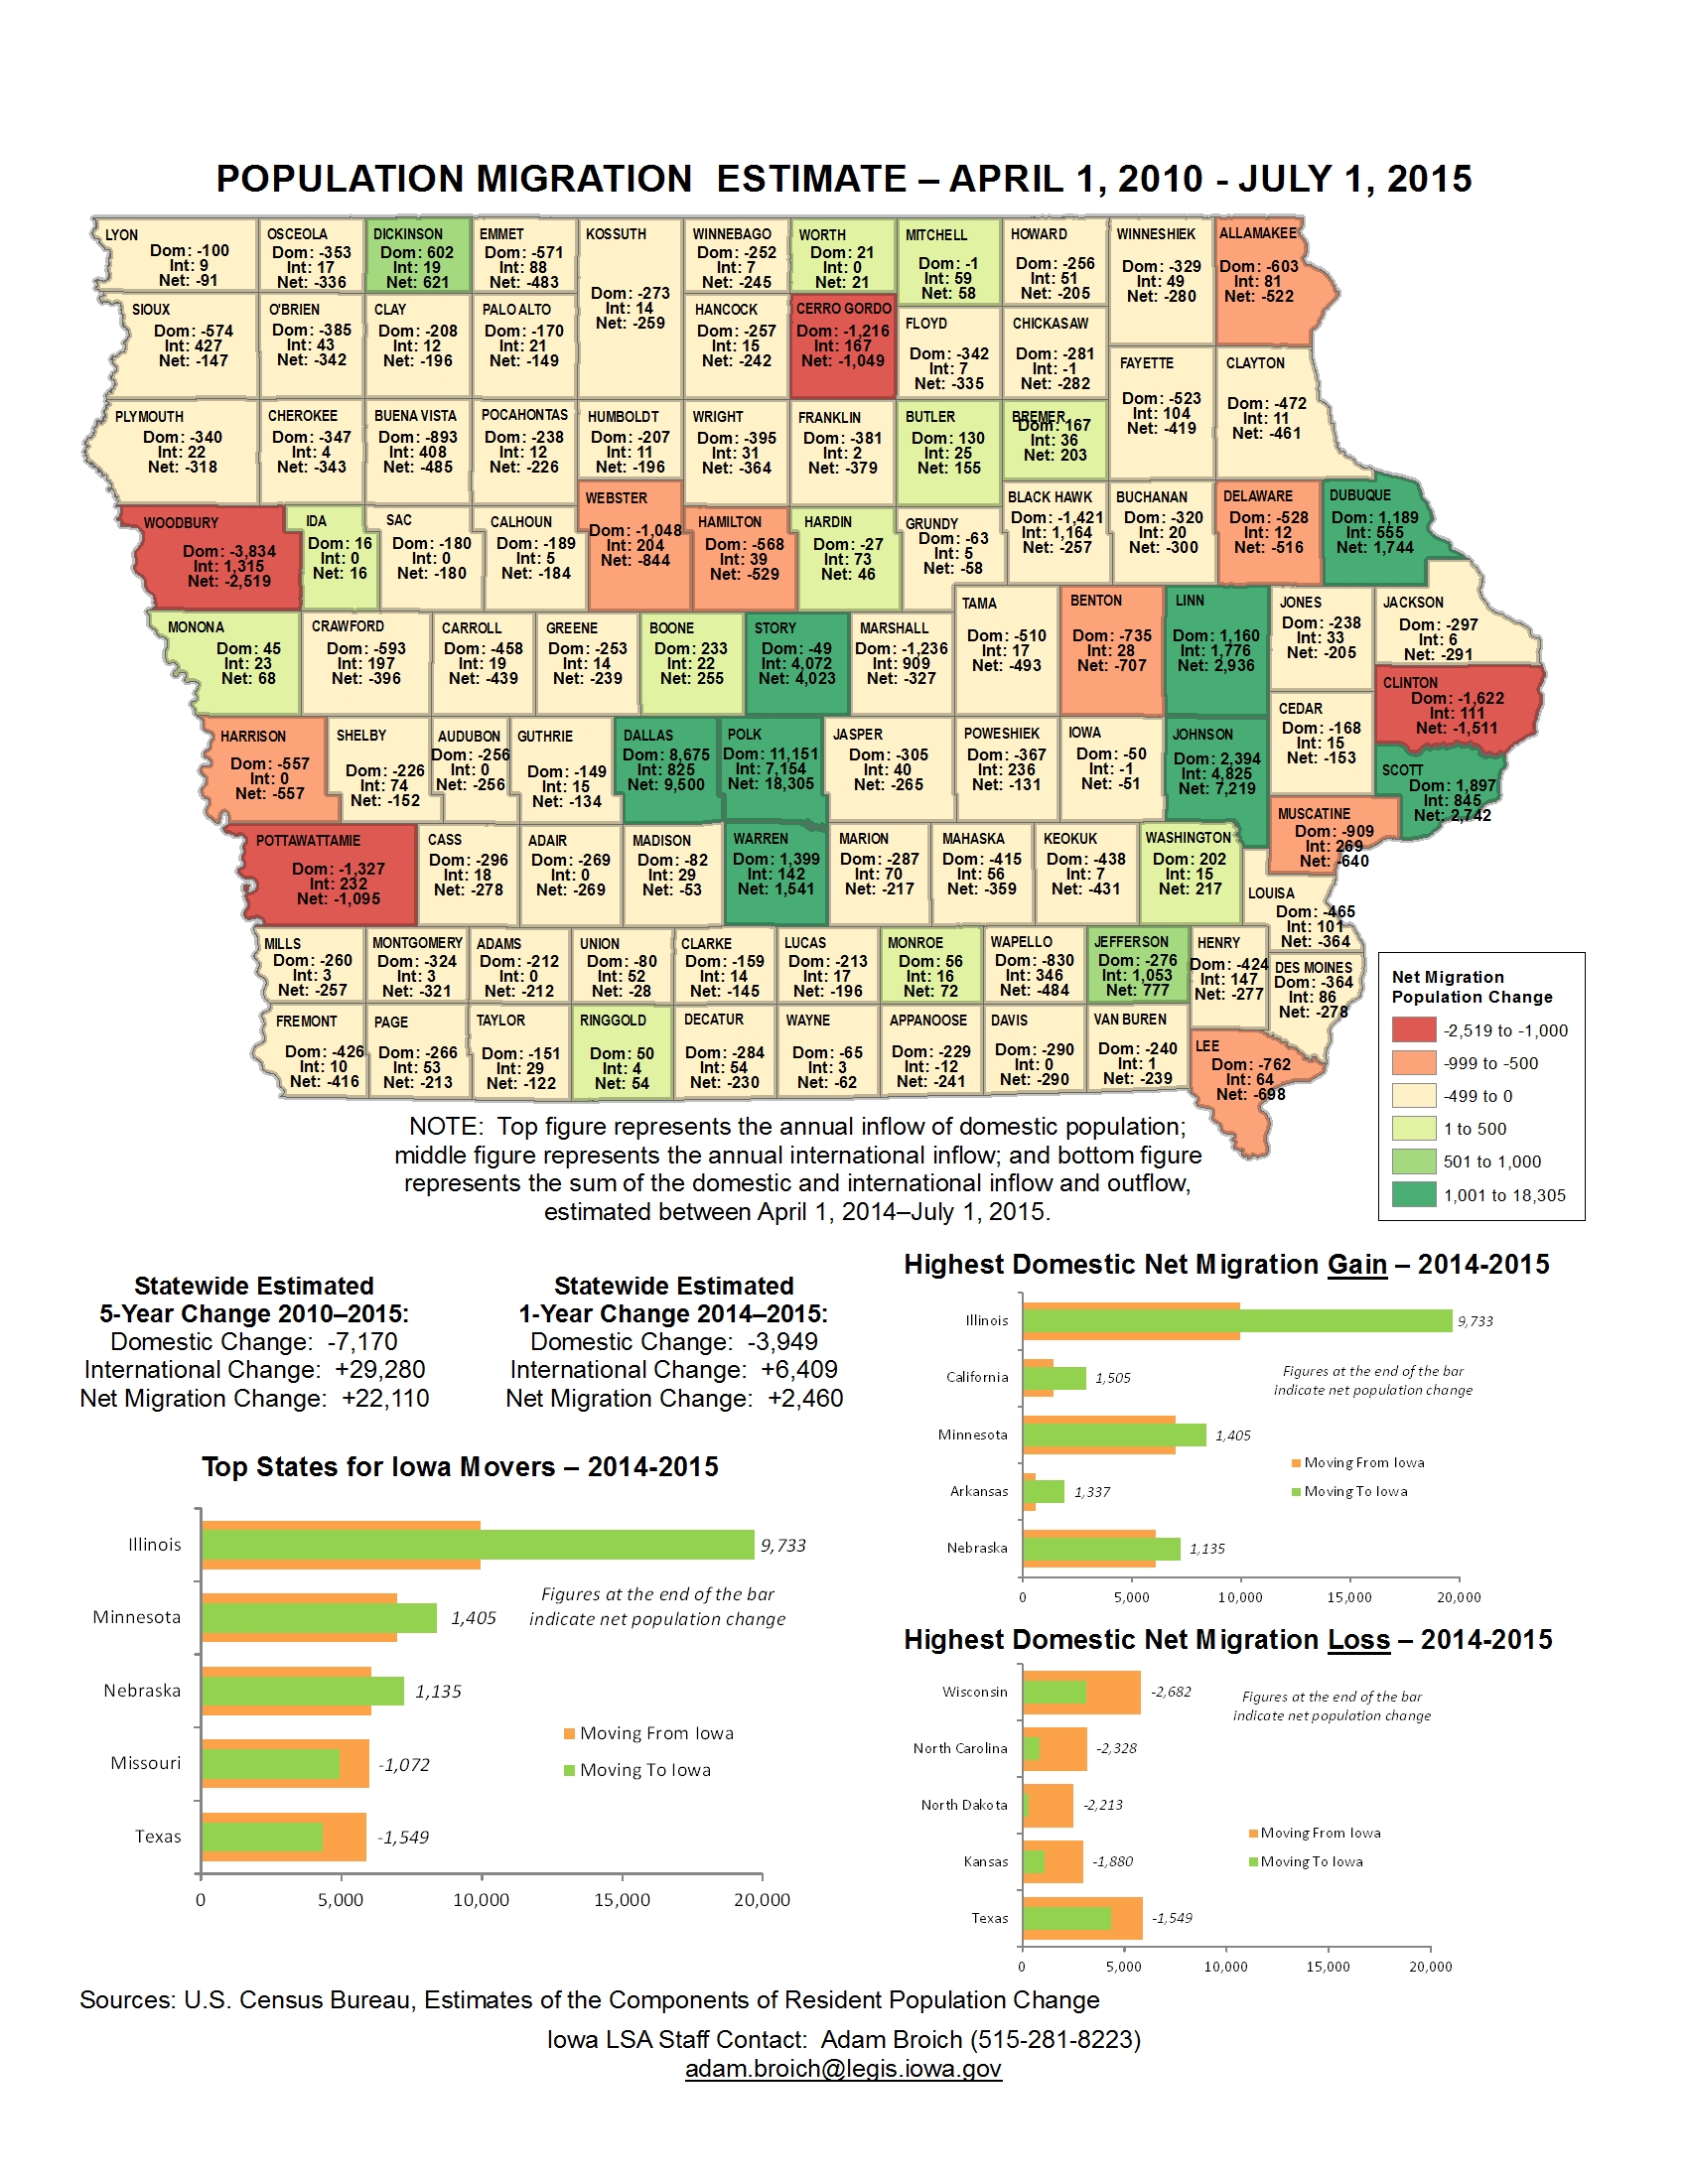
Population Migration Estimate – 4/1/2010-7/1/2015
|
|
|
|
|
| 01/16/2017 |
Iowa Insights |
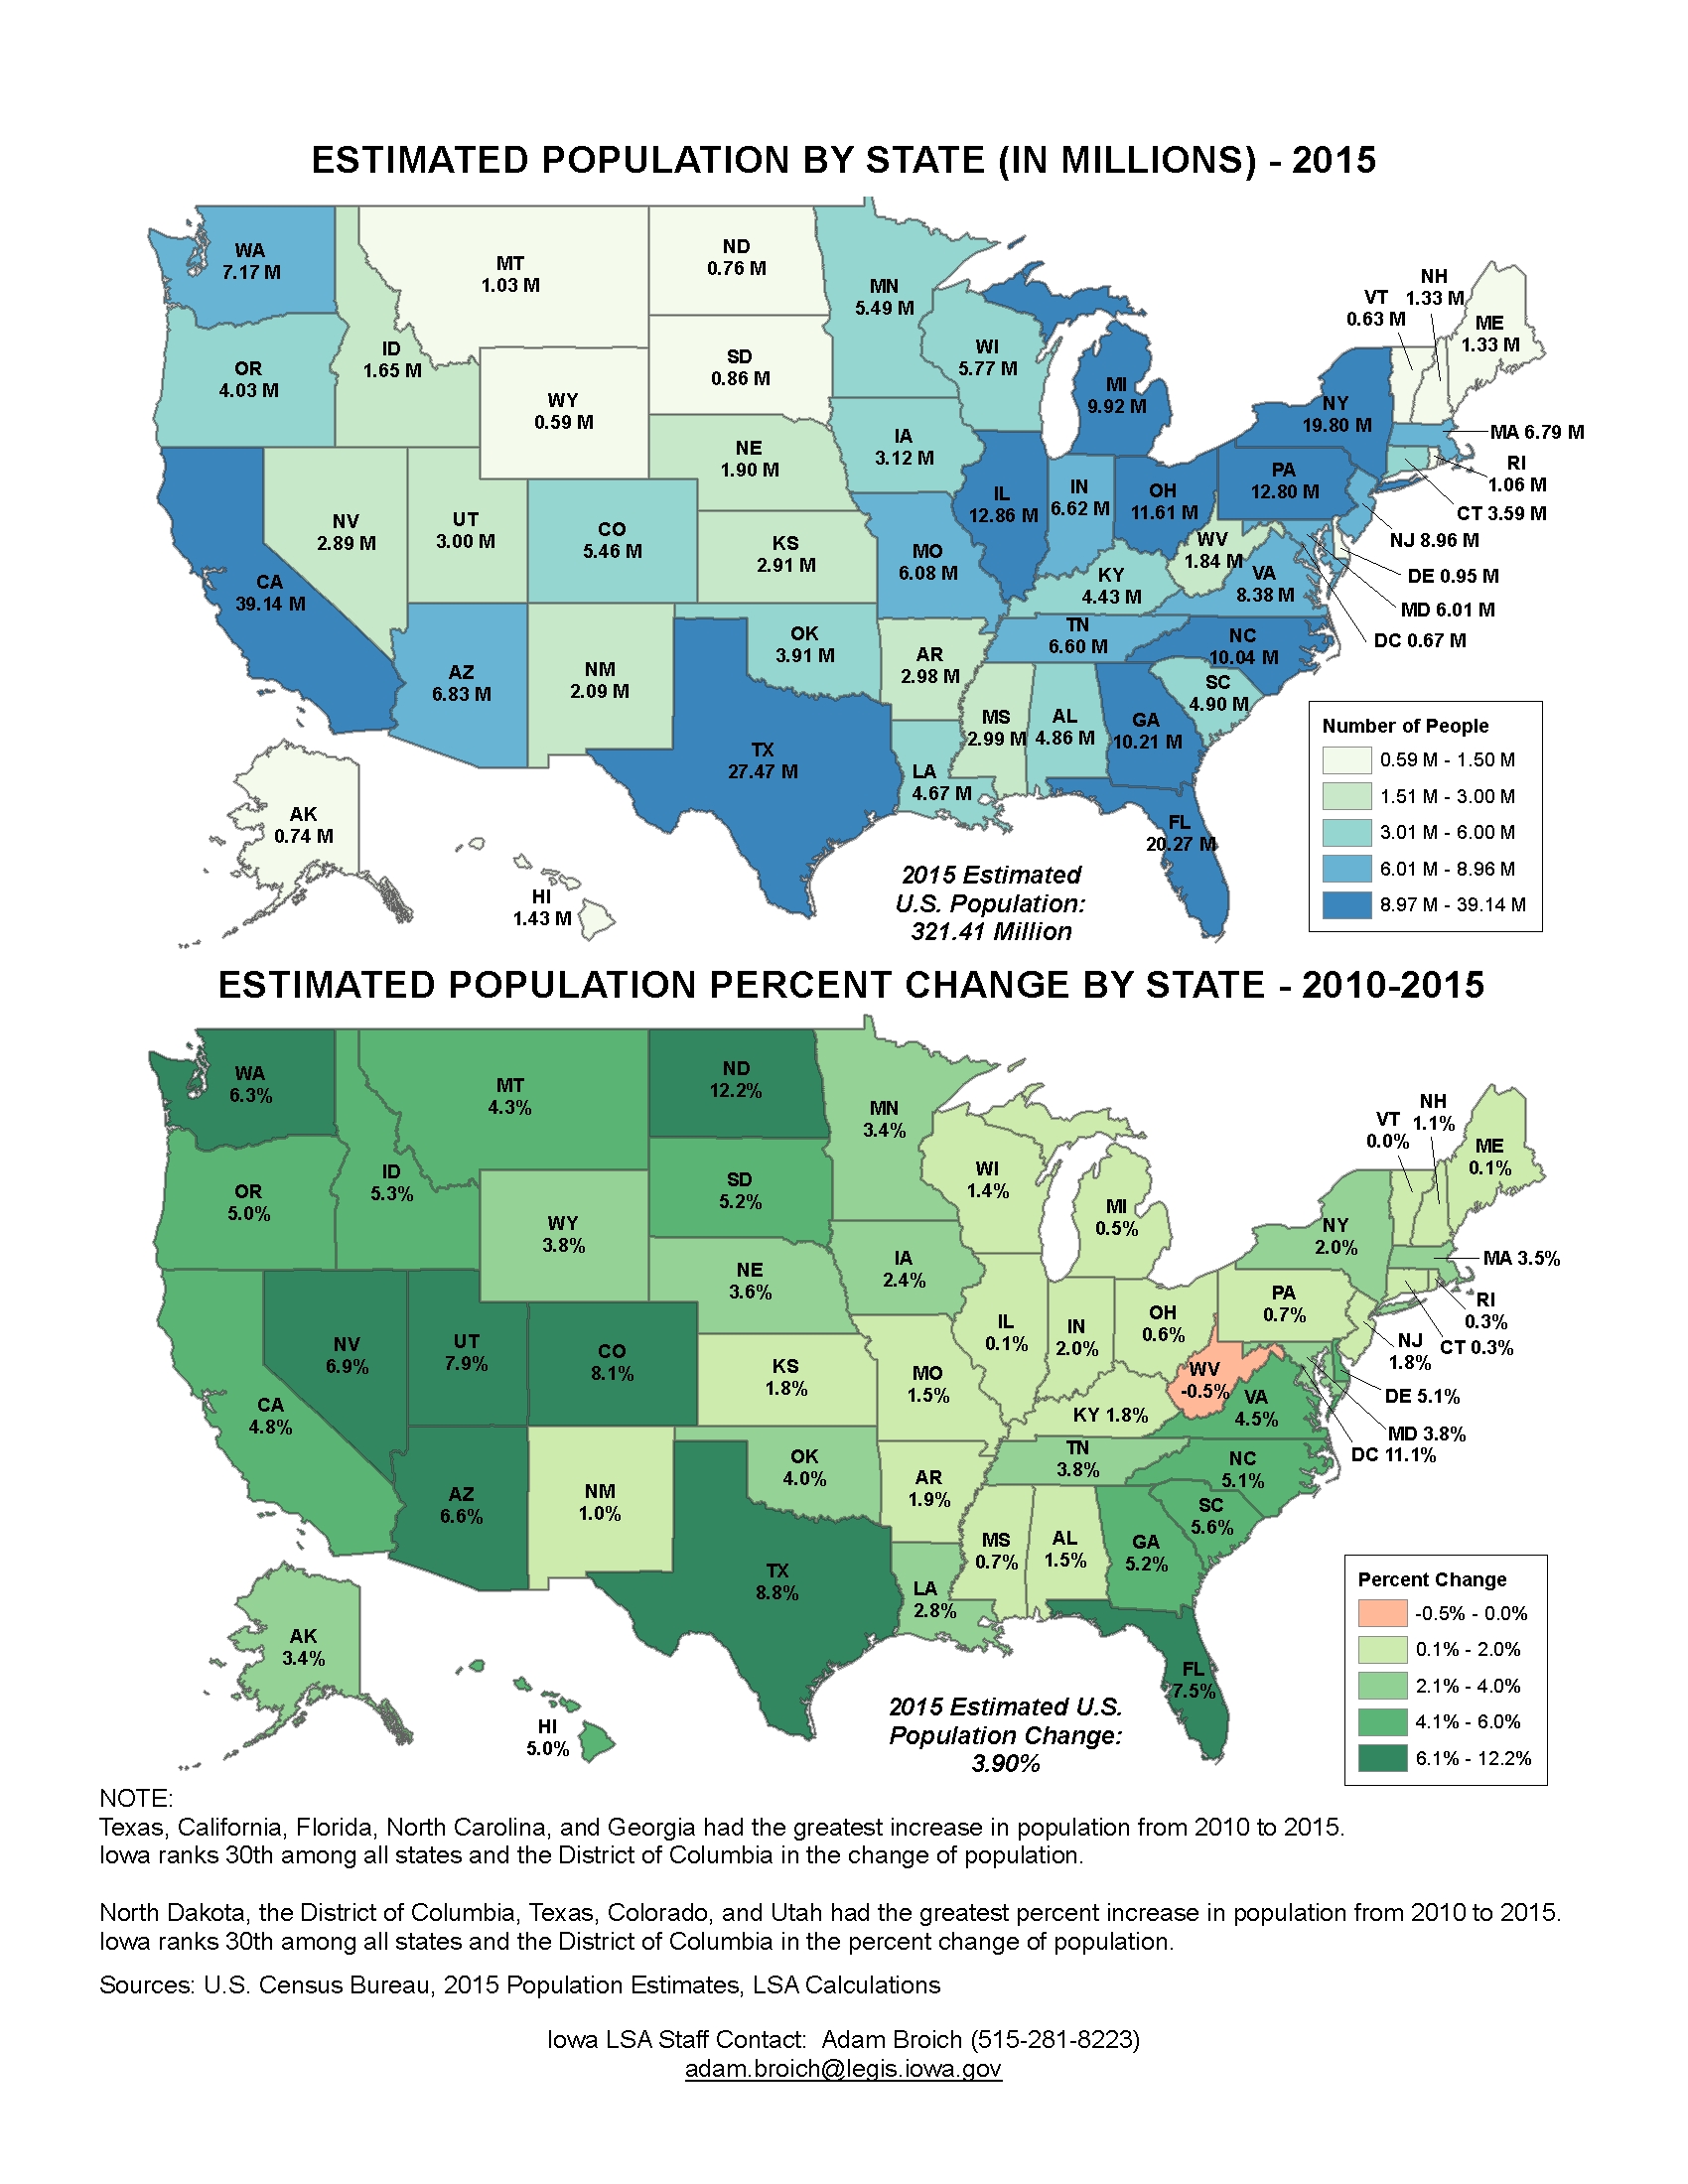
Population by State and Percent Change – 2010-2015
|
|
|
|
|
| 01/09/2017 |
Iowa Insights |
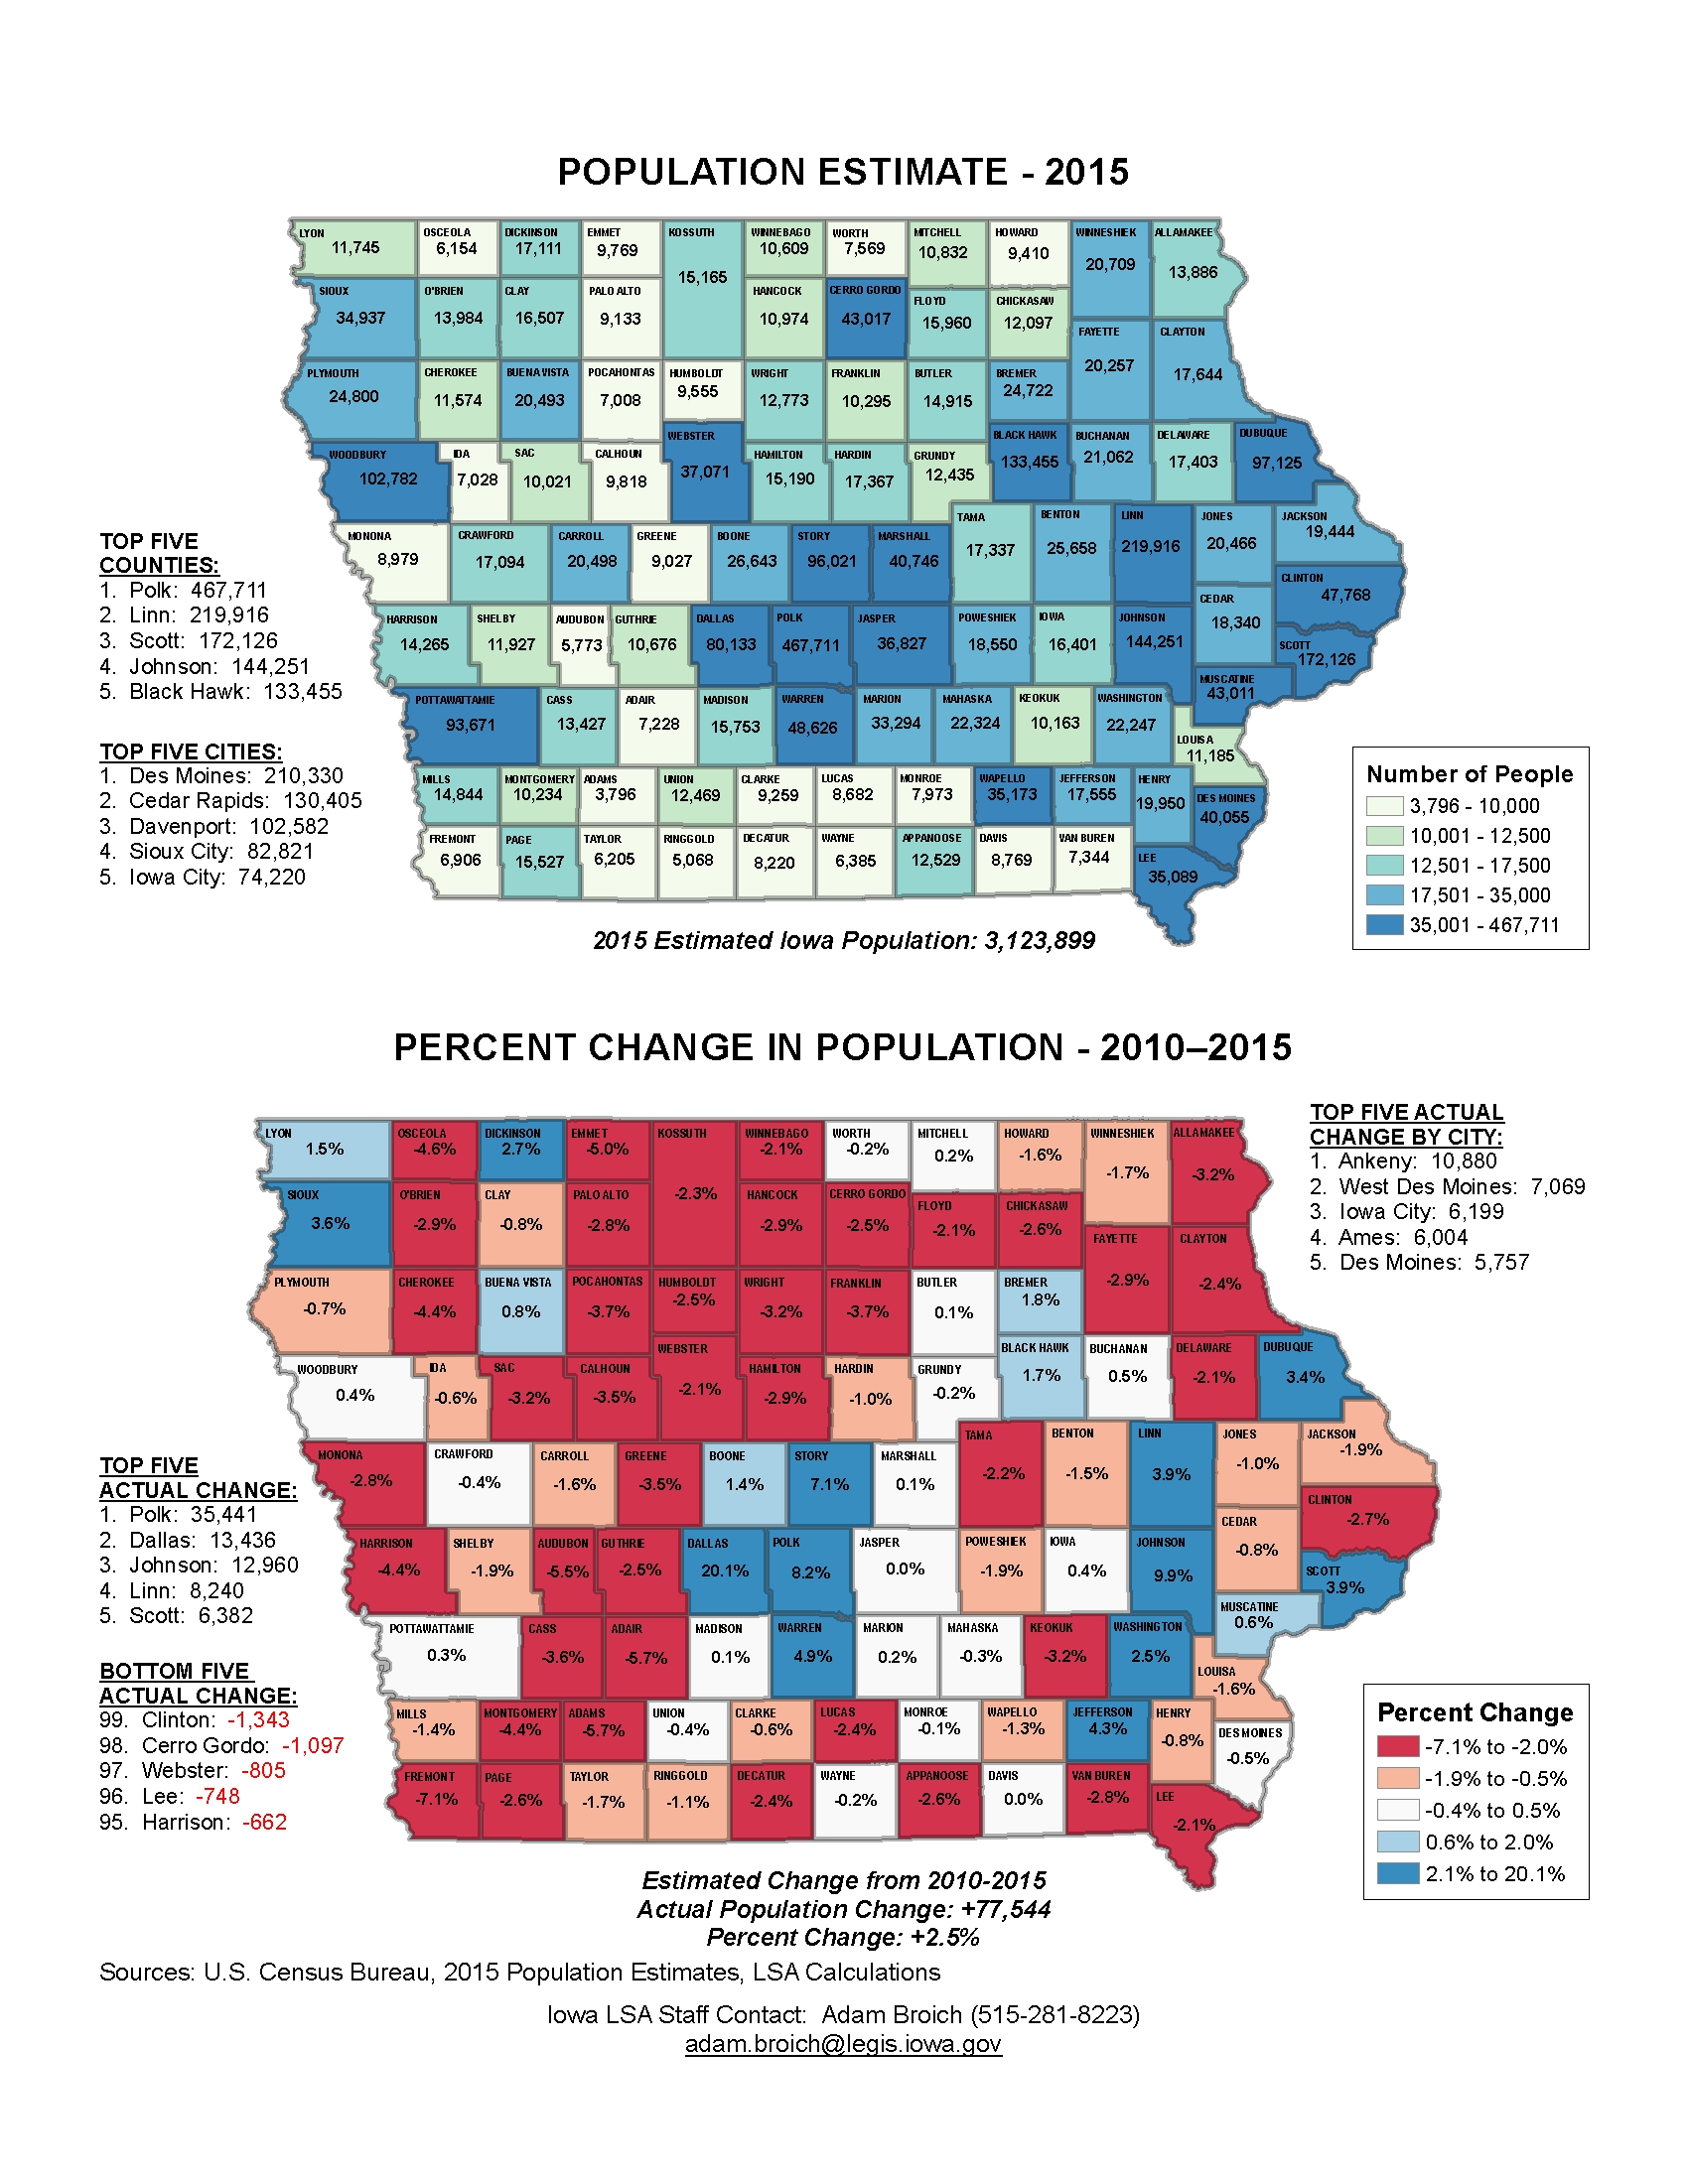
Population Estimate – 2015 and Population Change – 2010-2015 by County
|
|
|
|
|
| 01/02/2017 |
Iowa Insights |
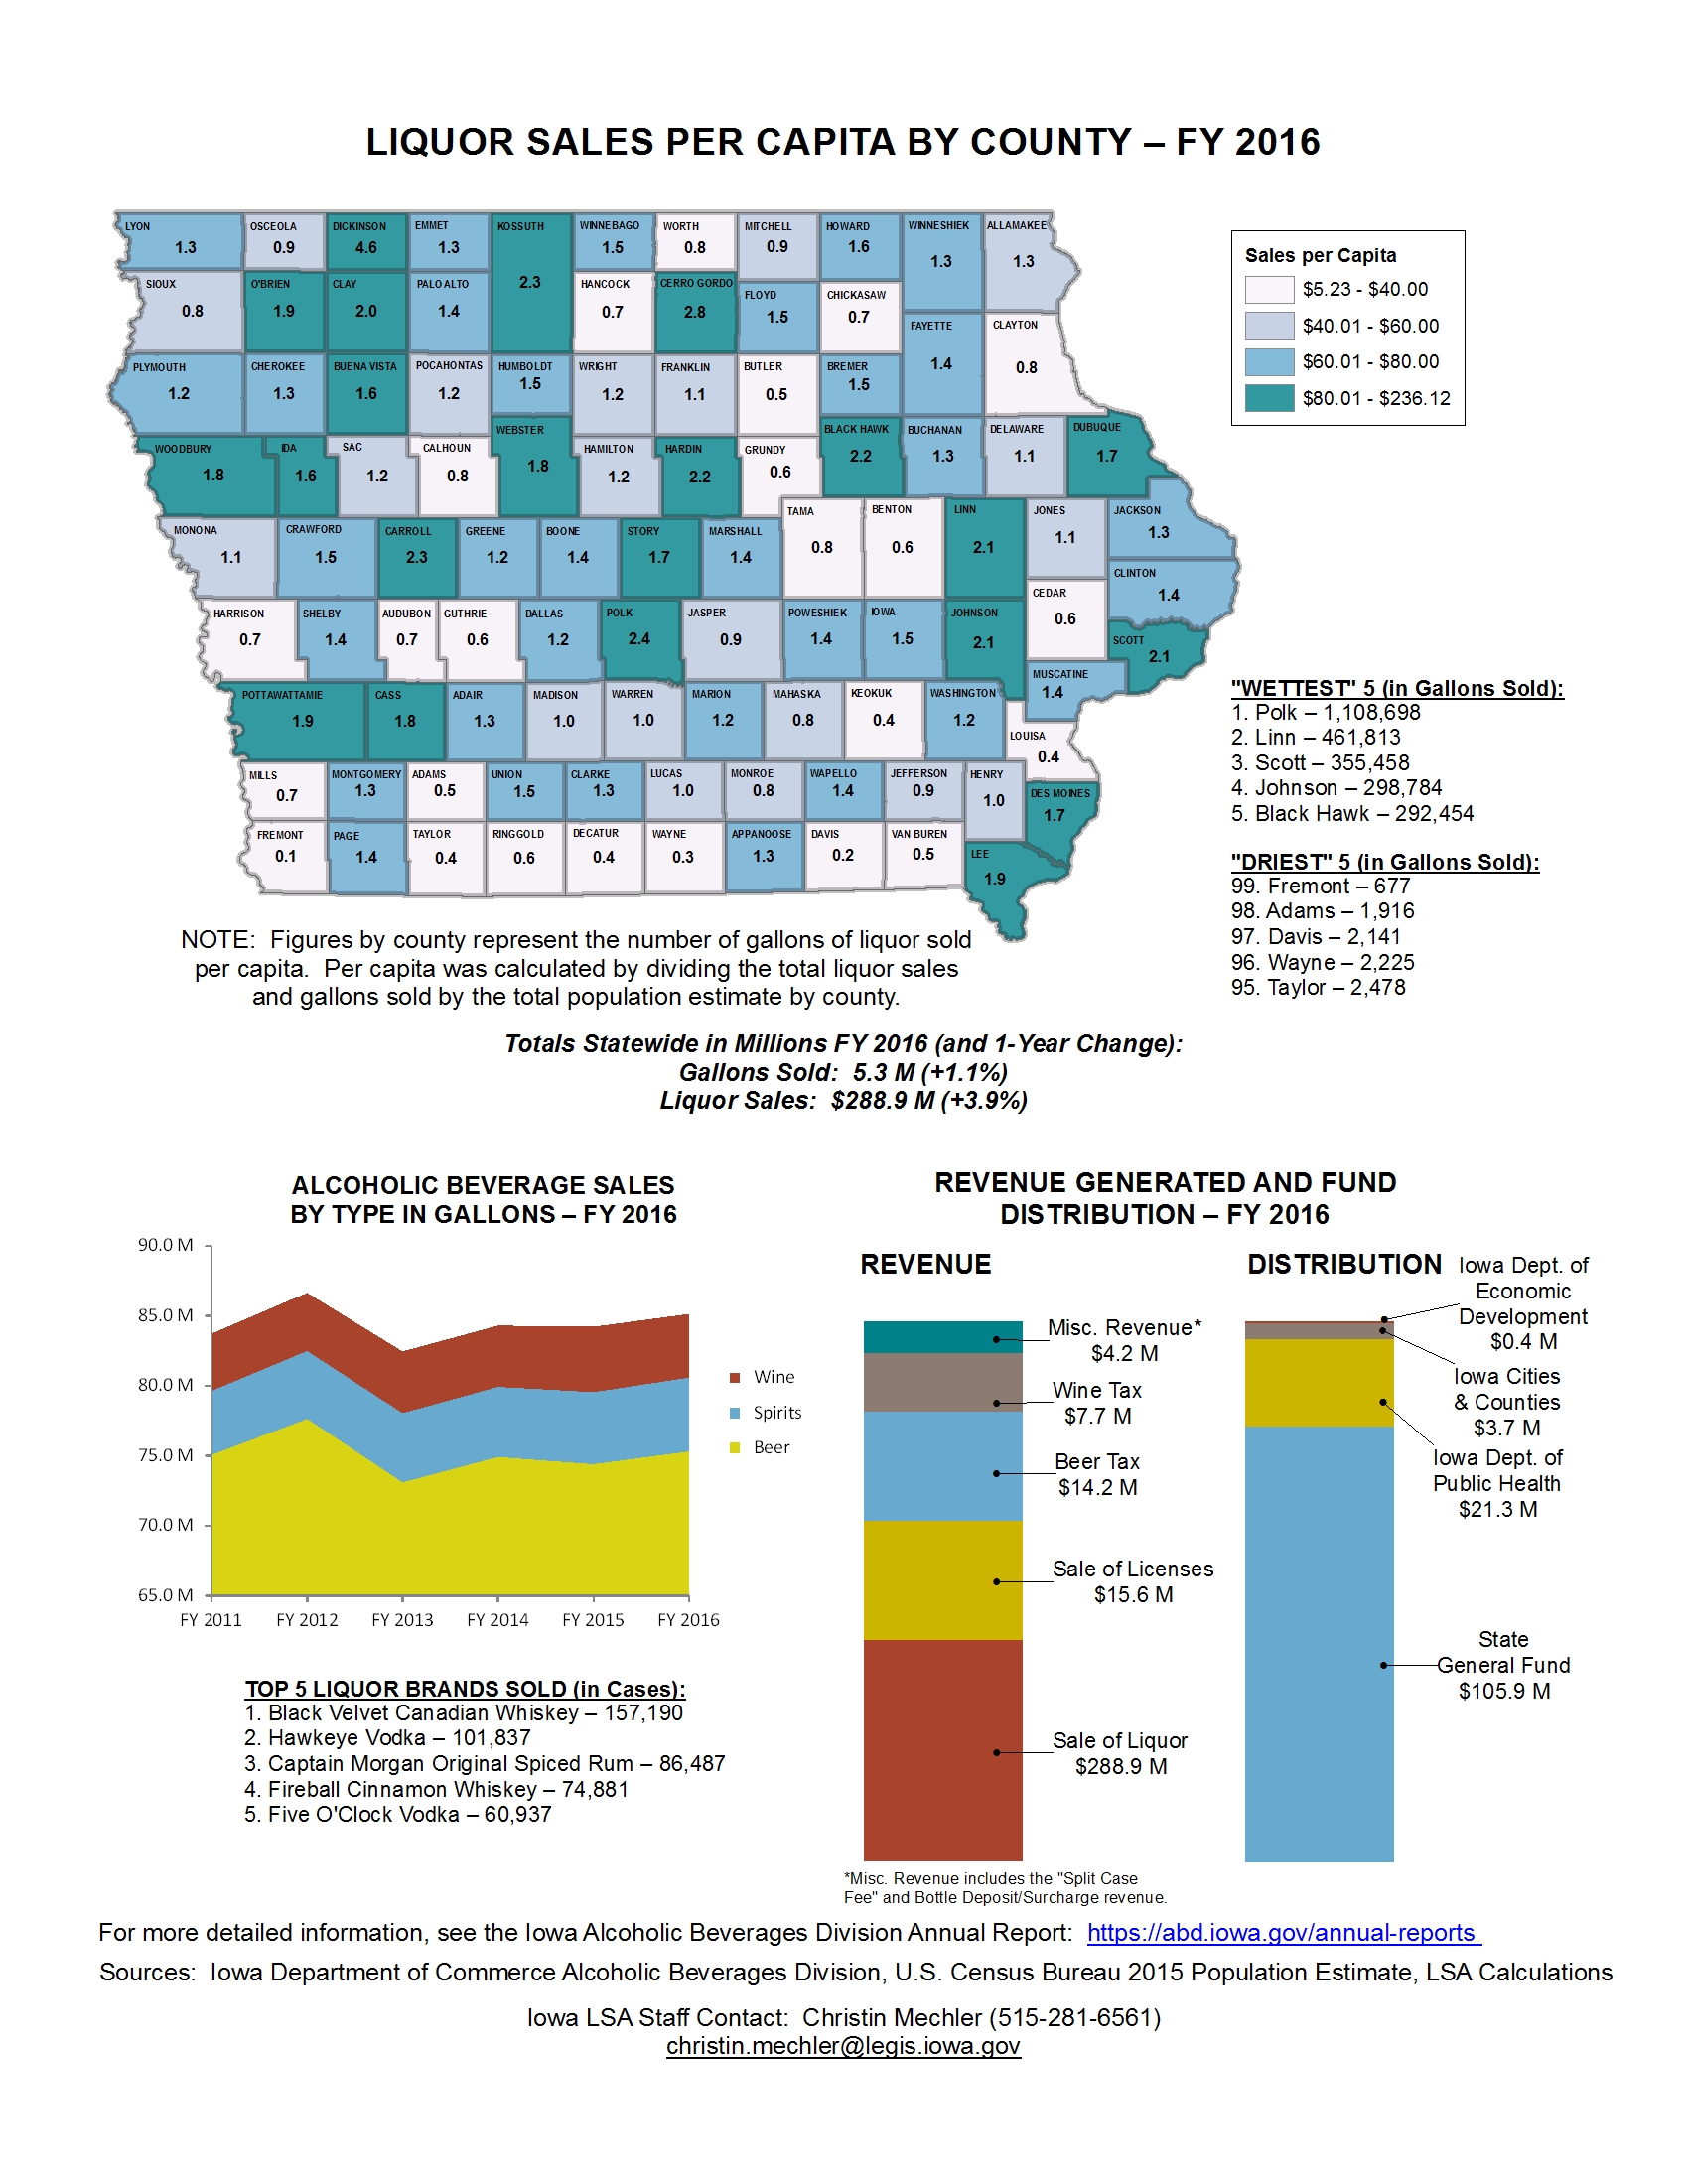
Liquor Sales per Capita by County – FY 2016
|
|
|
|
|
| 12/19/2016 |
Iowa Insights |
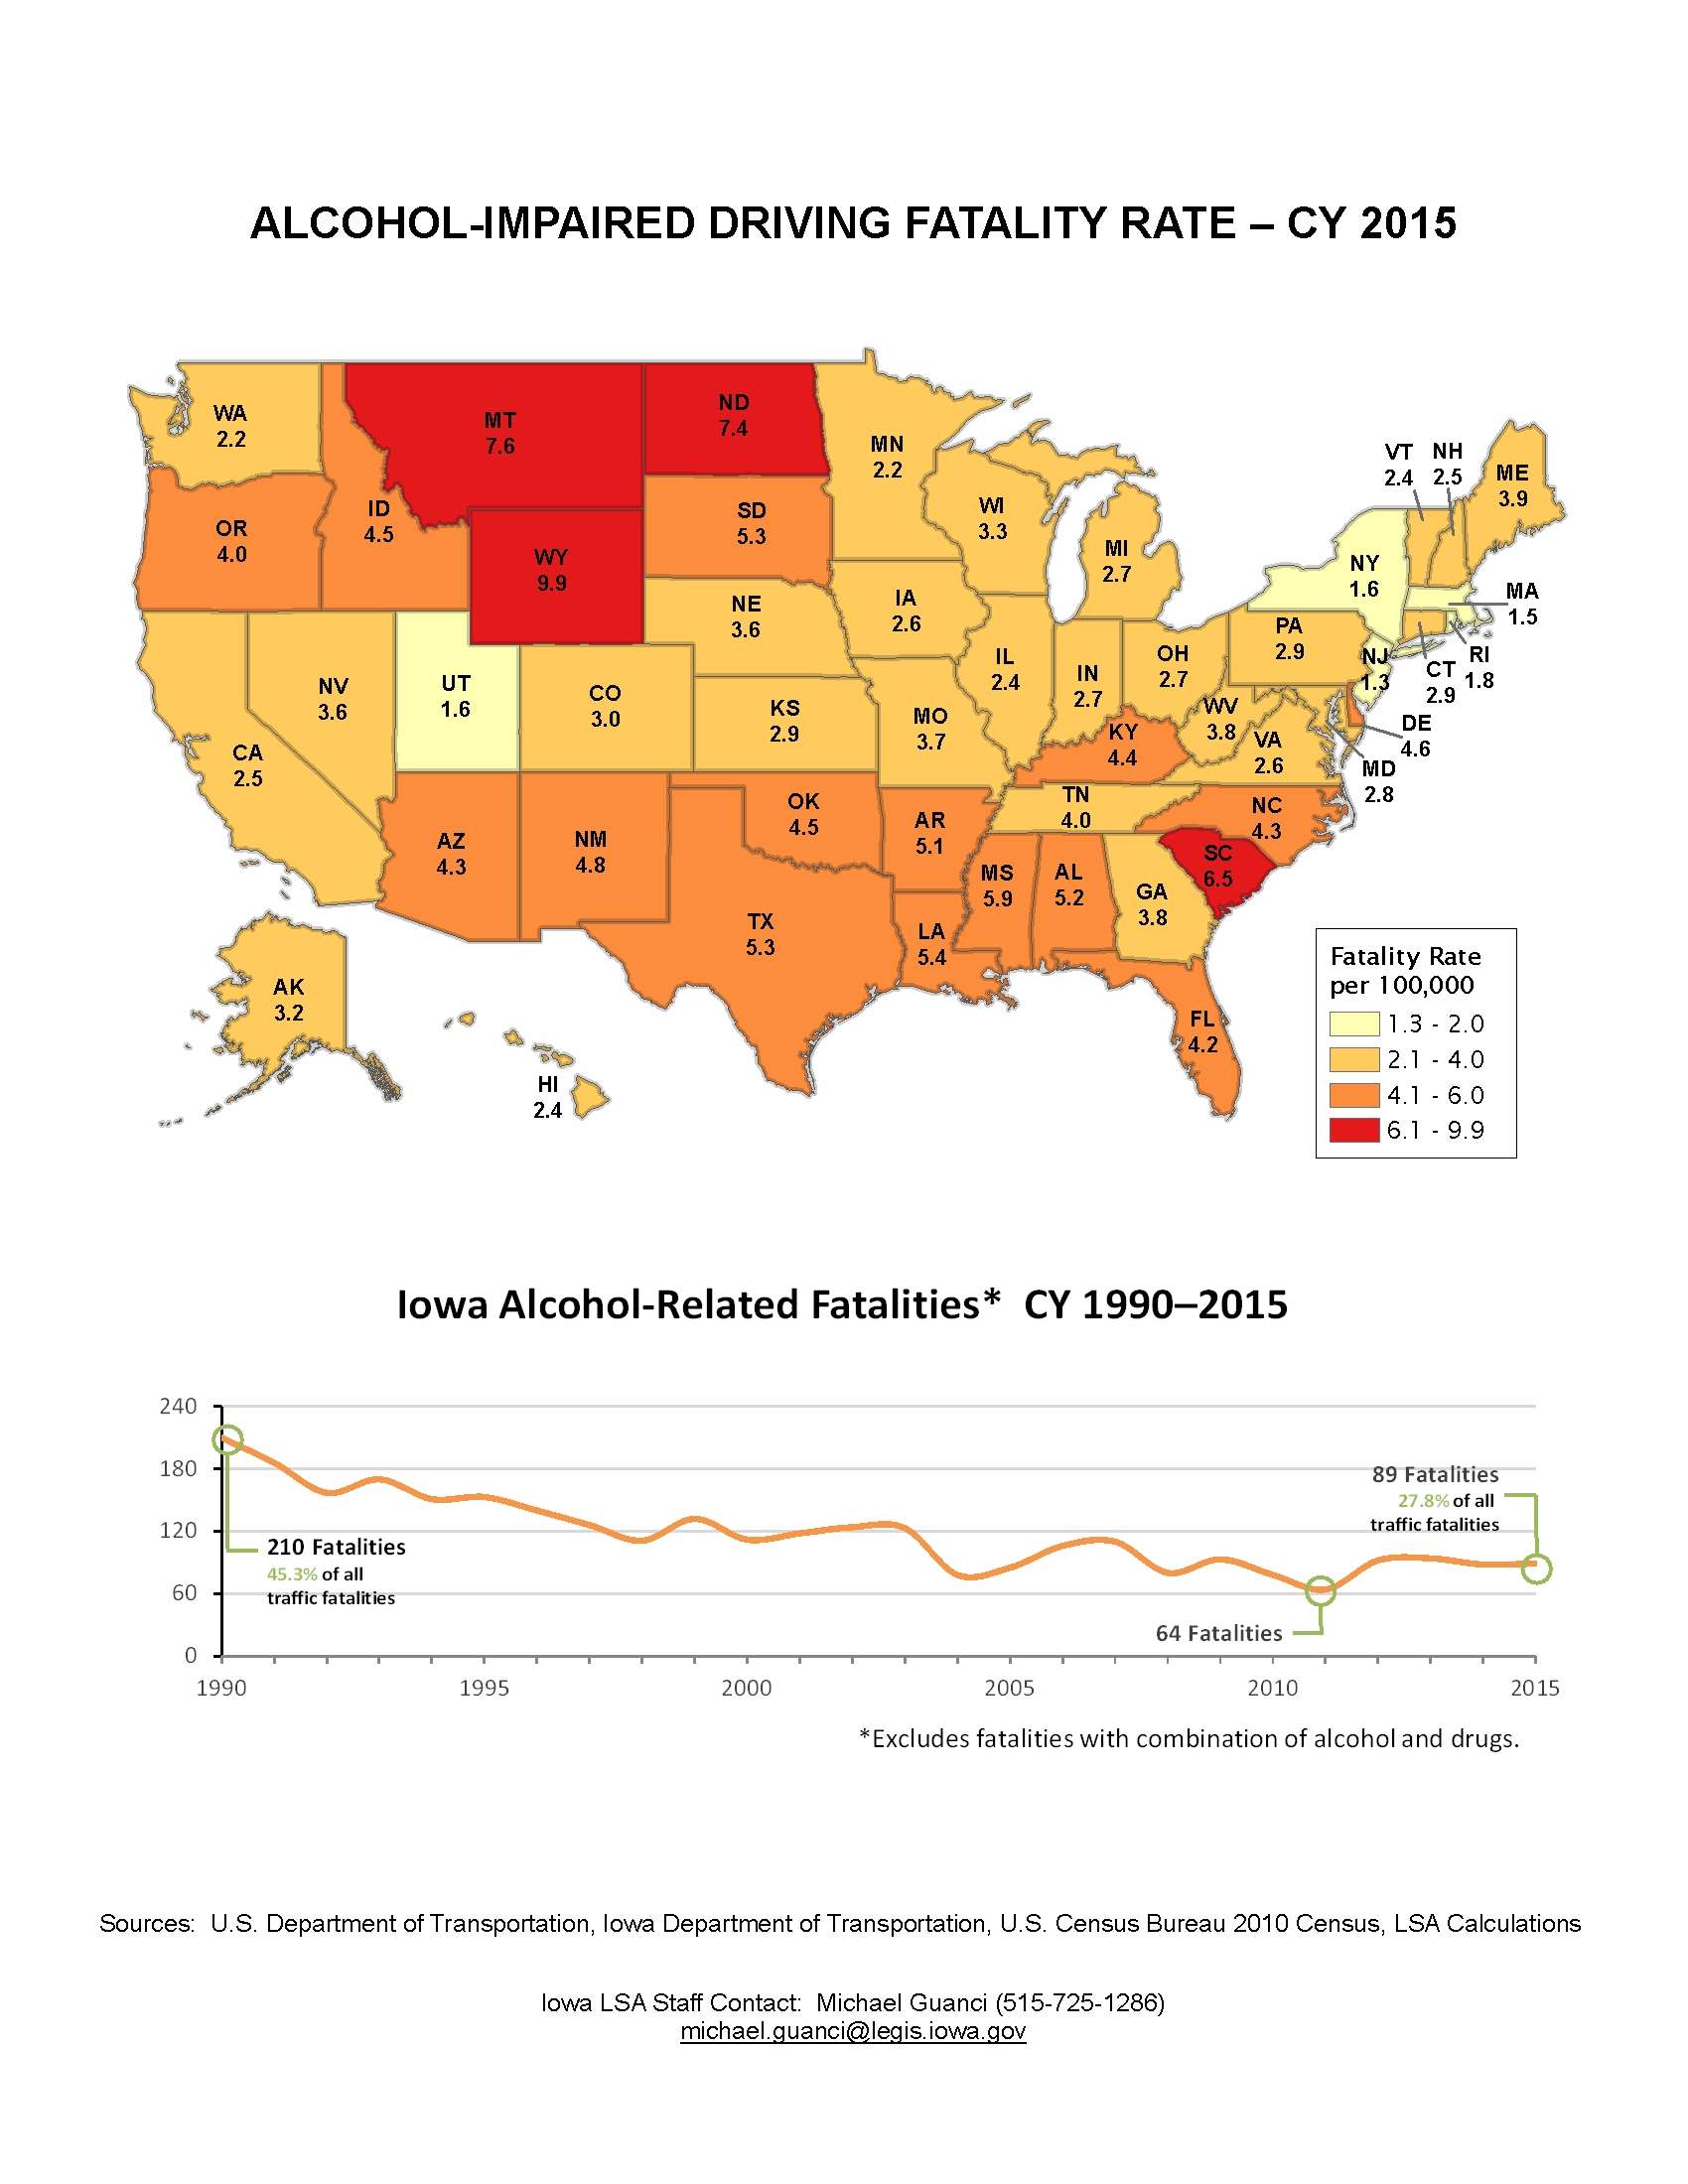
Alcohol-Impaired Driving Fatality Rate by State – CY 2015
|
|
|
|
|
| 12/12/2016 |
Iowa Insights |
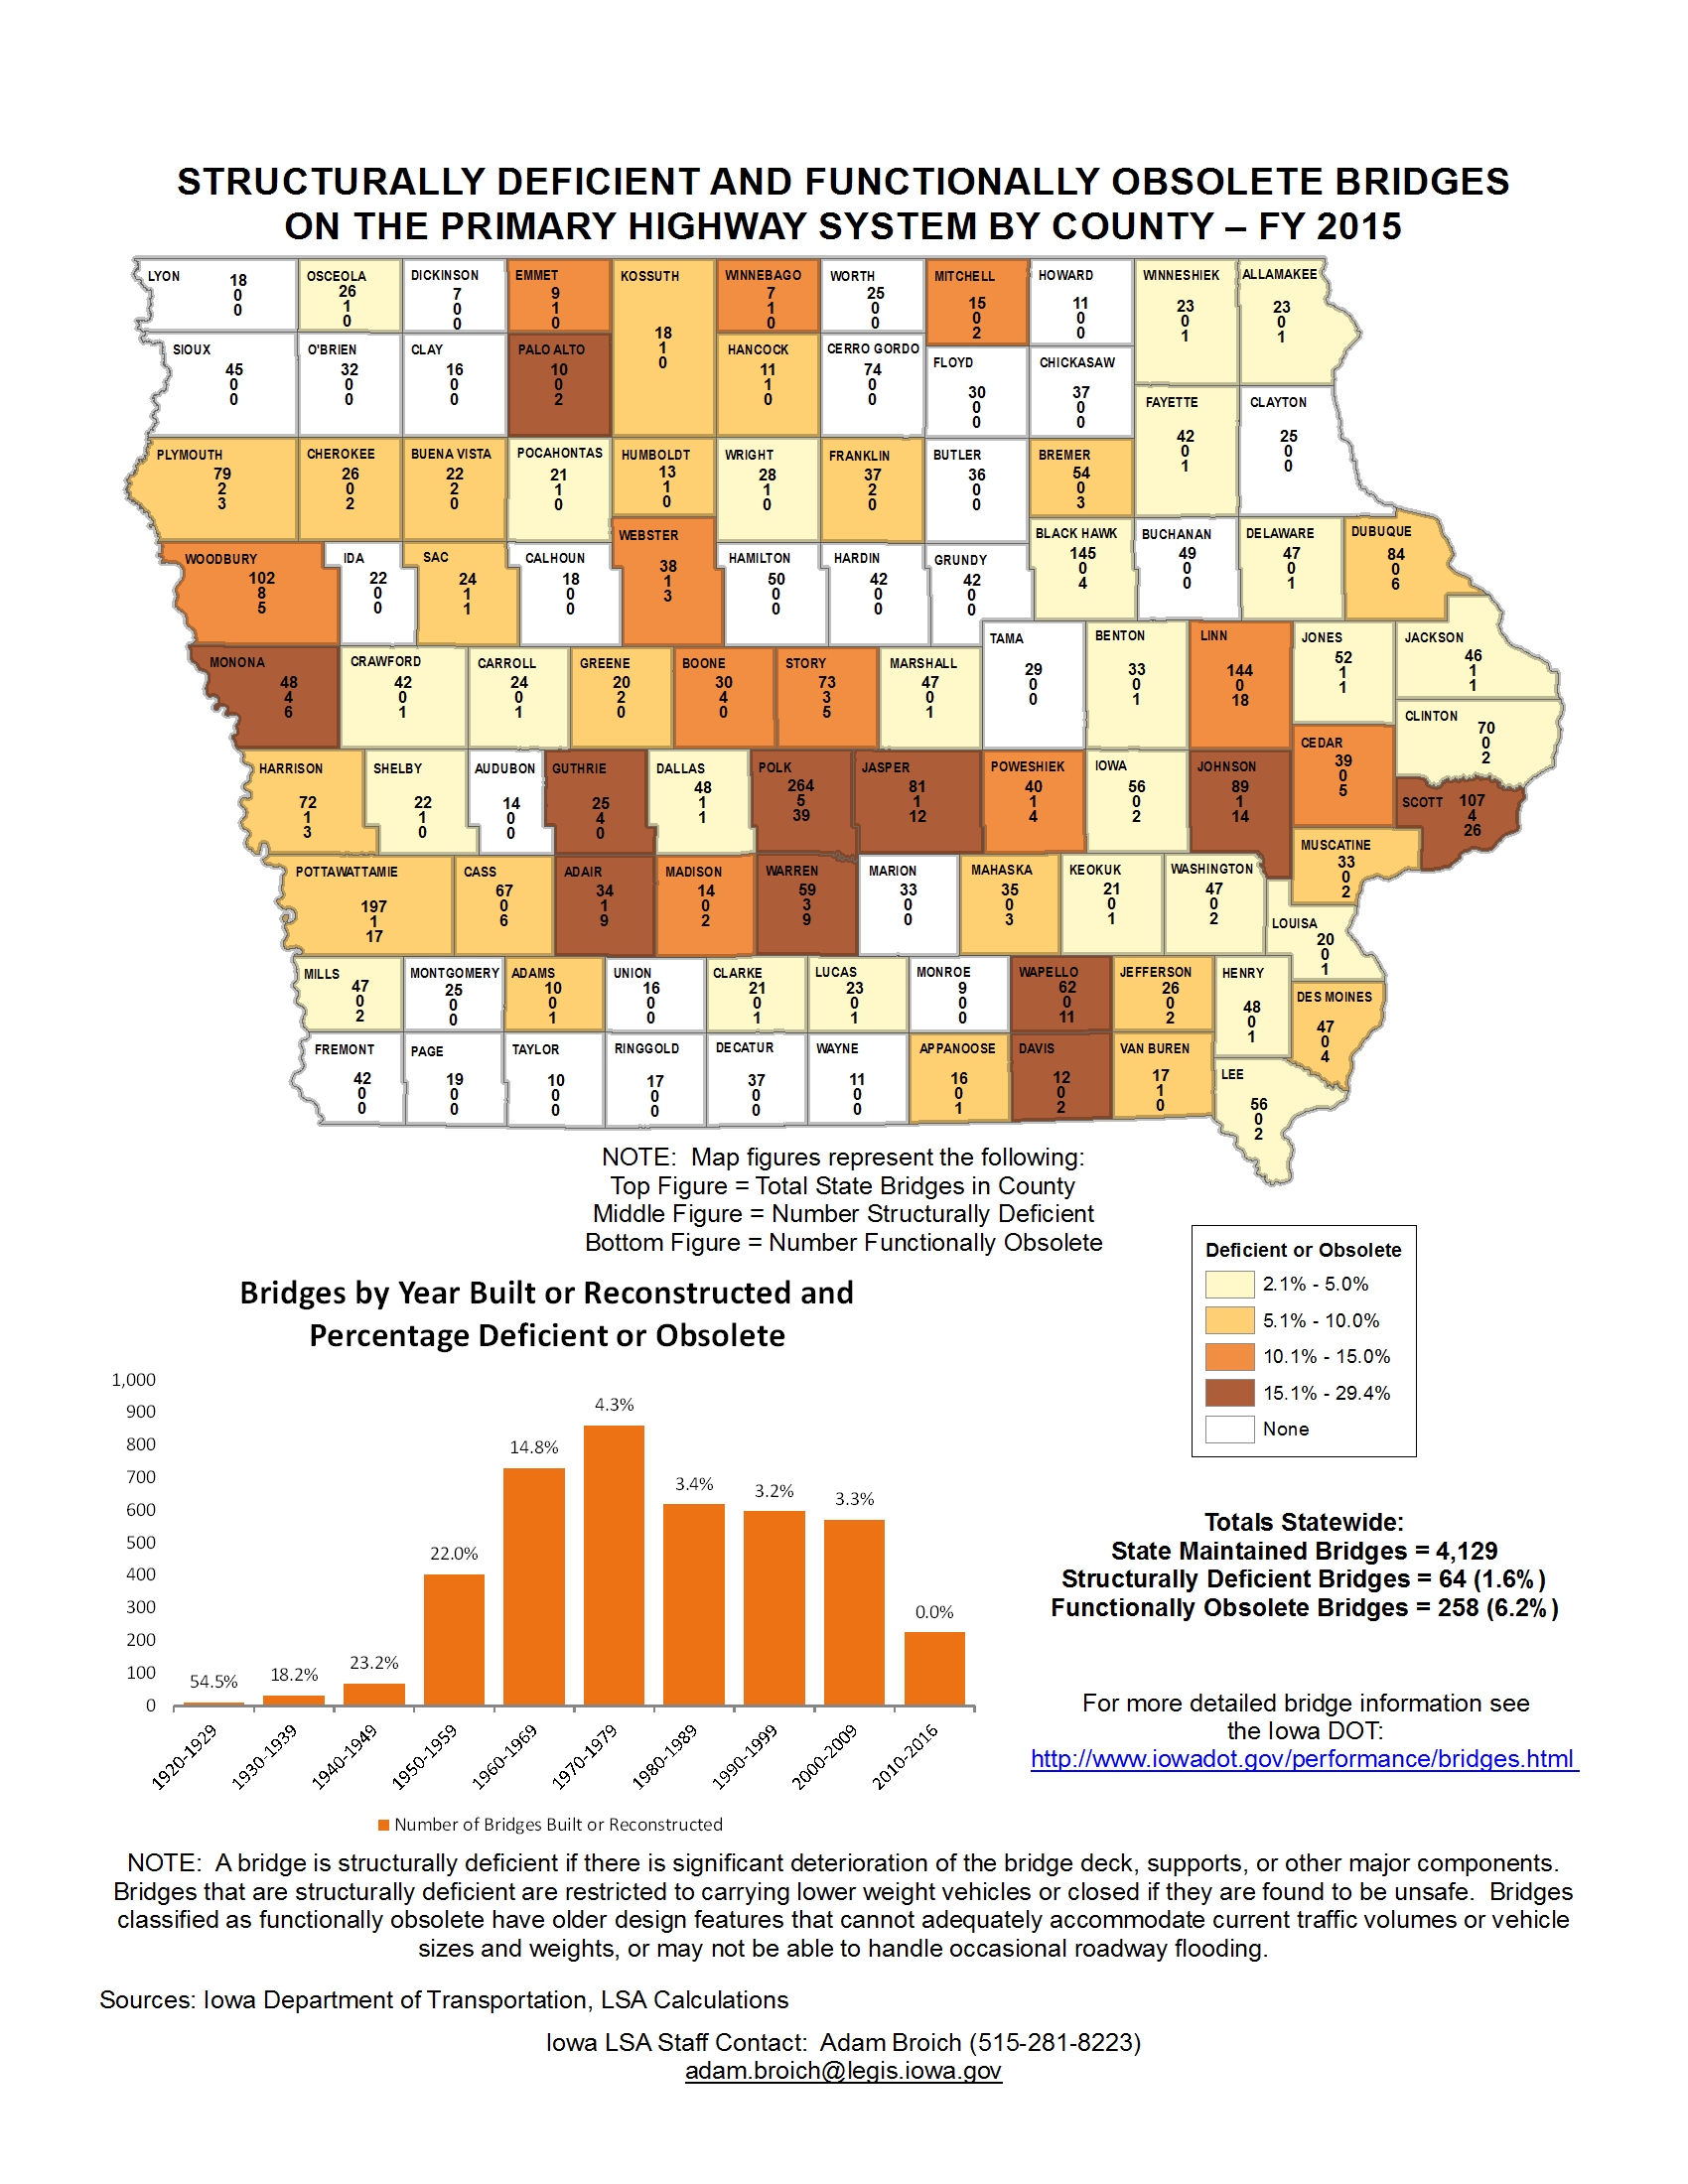
Map - Structurally Deficient and Functionally Obsolete Bridges by County - FY 2015
|
|
|
|
|
| 12/05/2016 |
Iowa Insights |
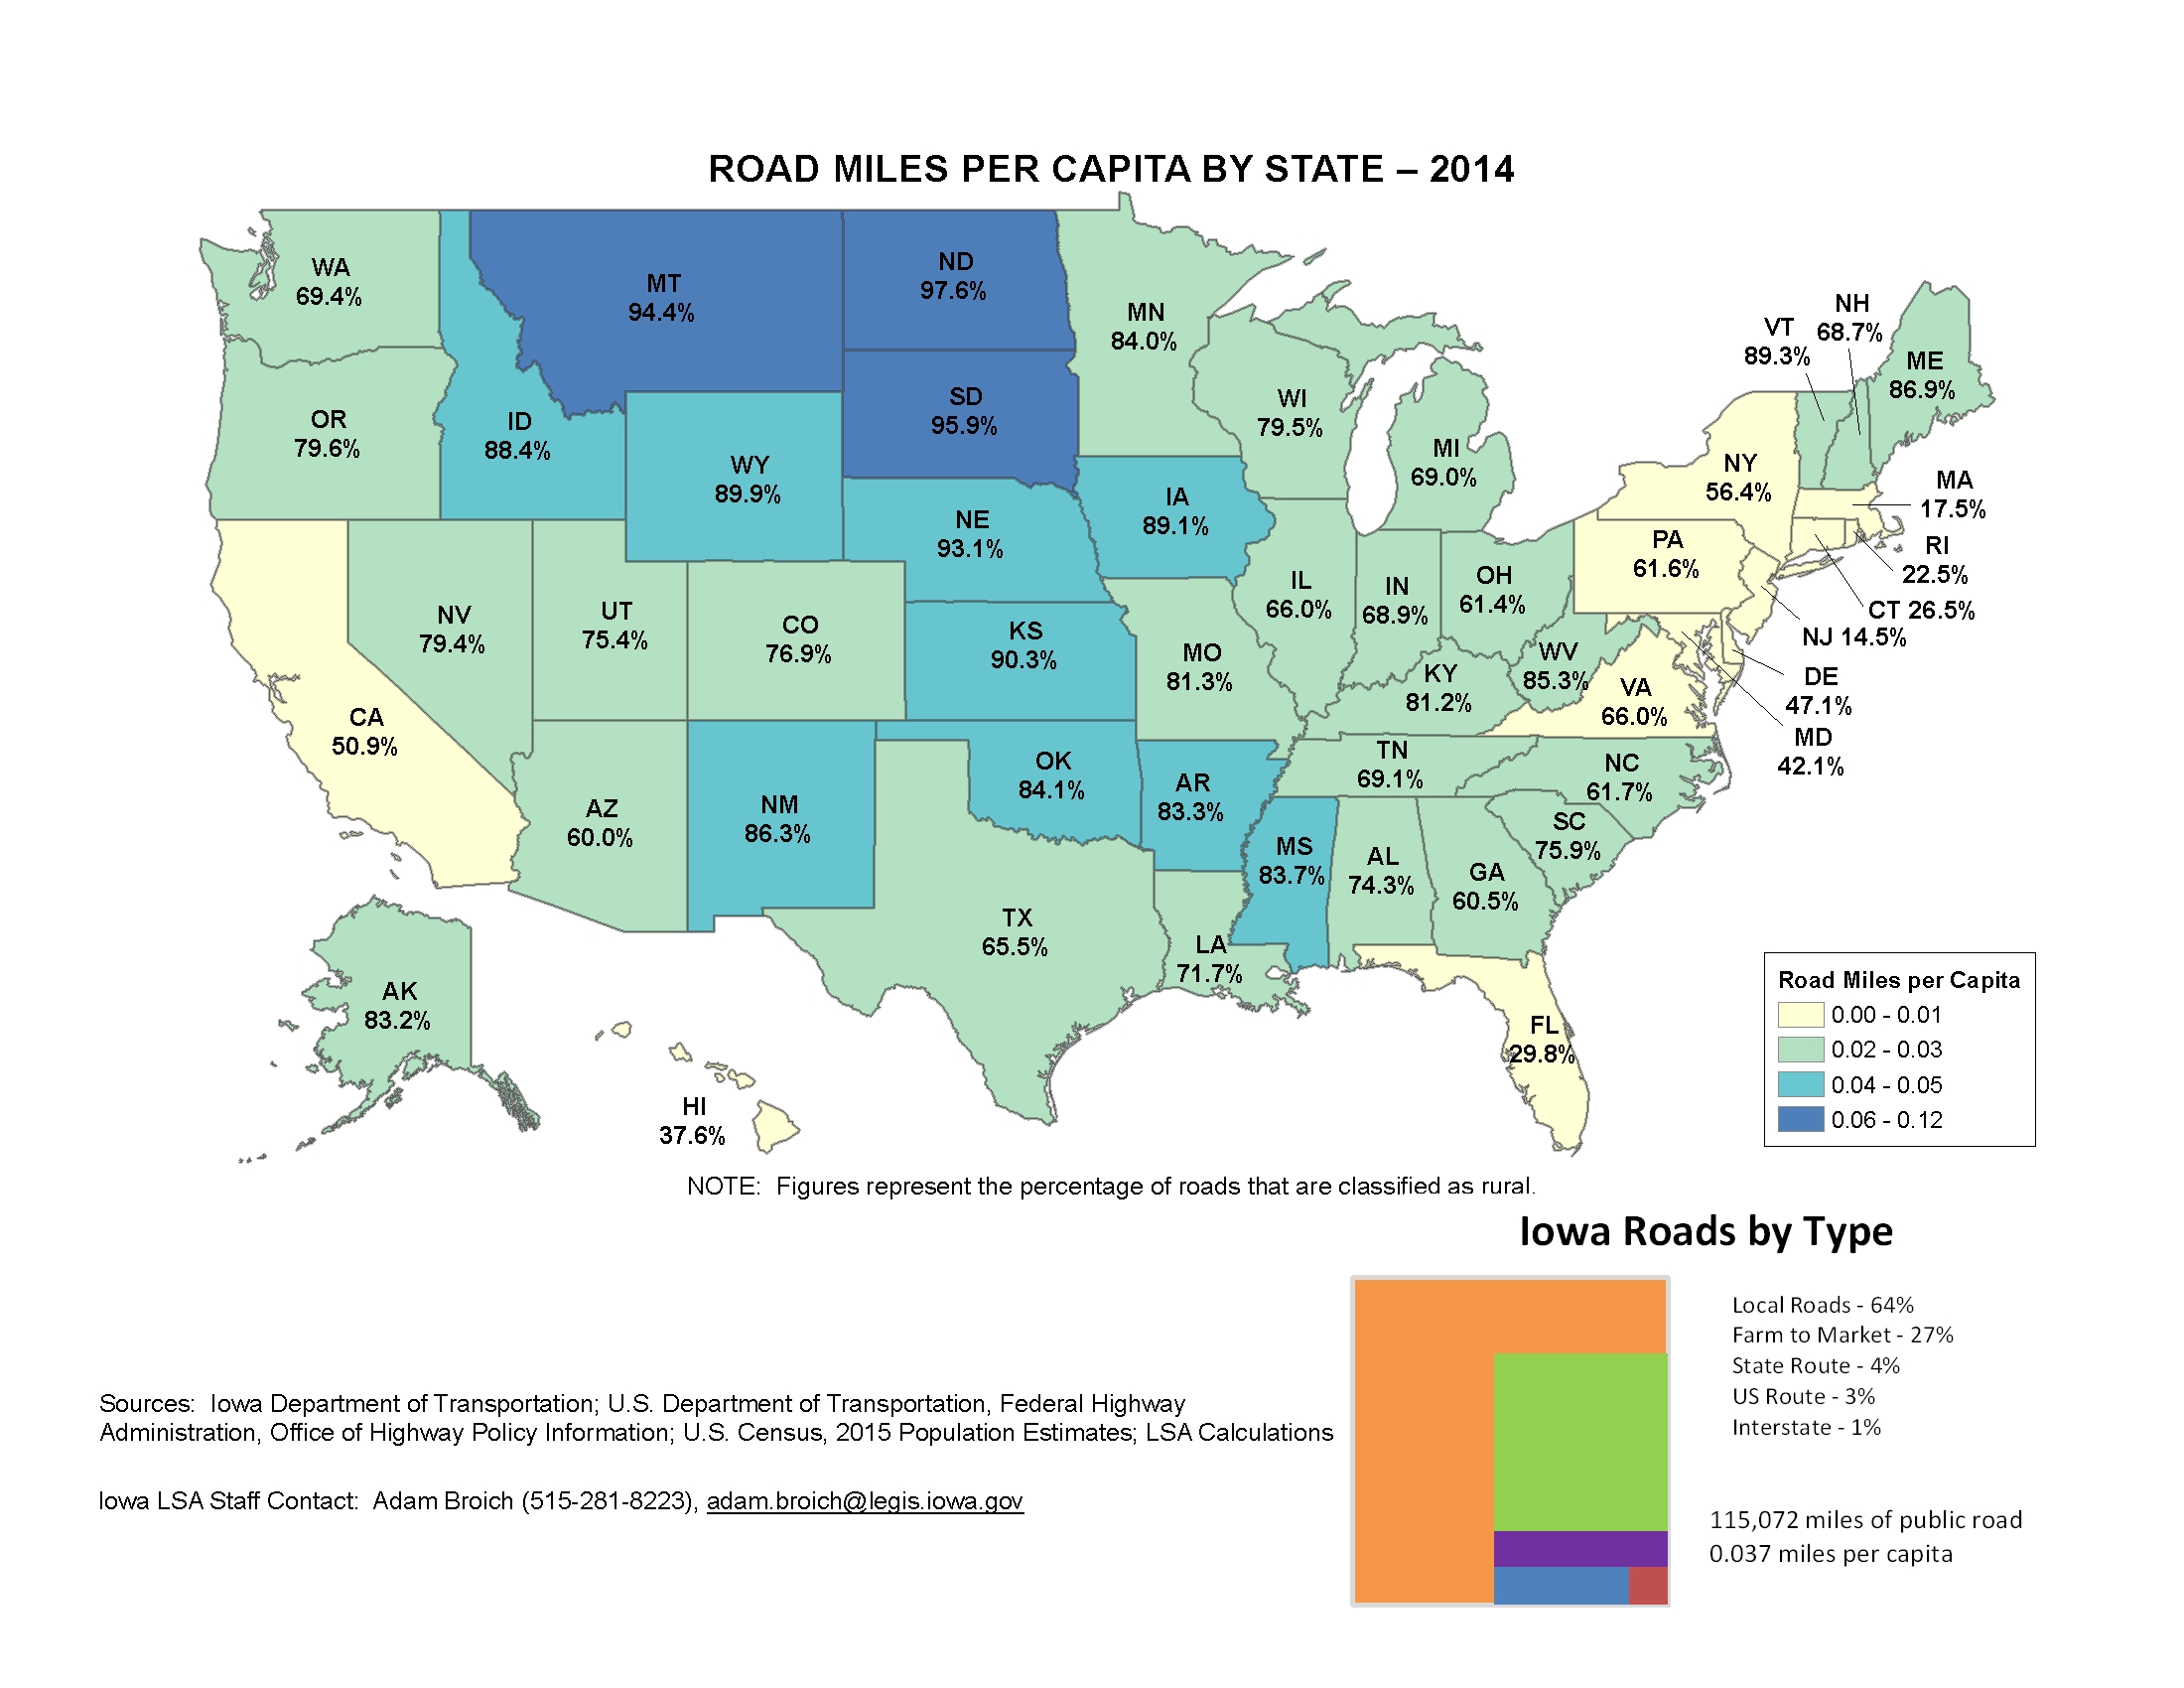
Road Miles Per Capita by State - 2014
|
|
|
|
|
| 11/21/2016 |
Iowa Insights |
Exports From Iowa - CY 2015

|
|
|
|
|
| 11/14/2016 |
Iowa Insights |
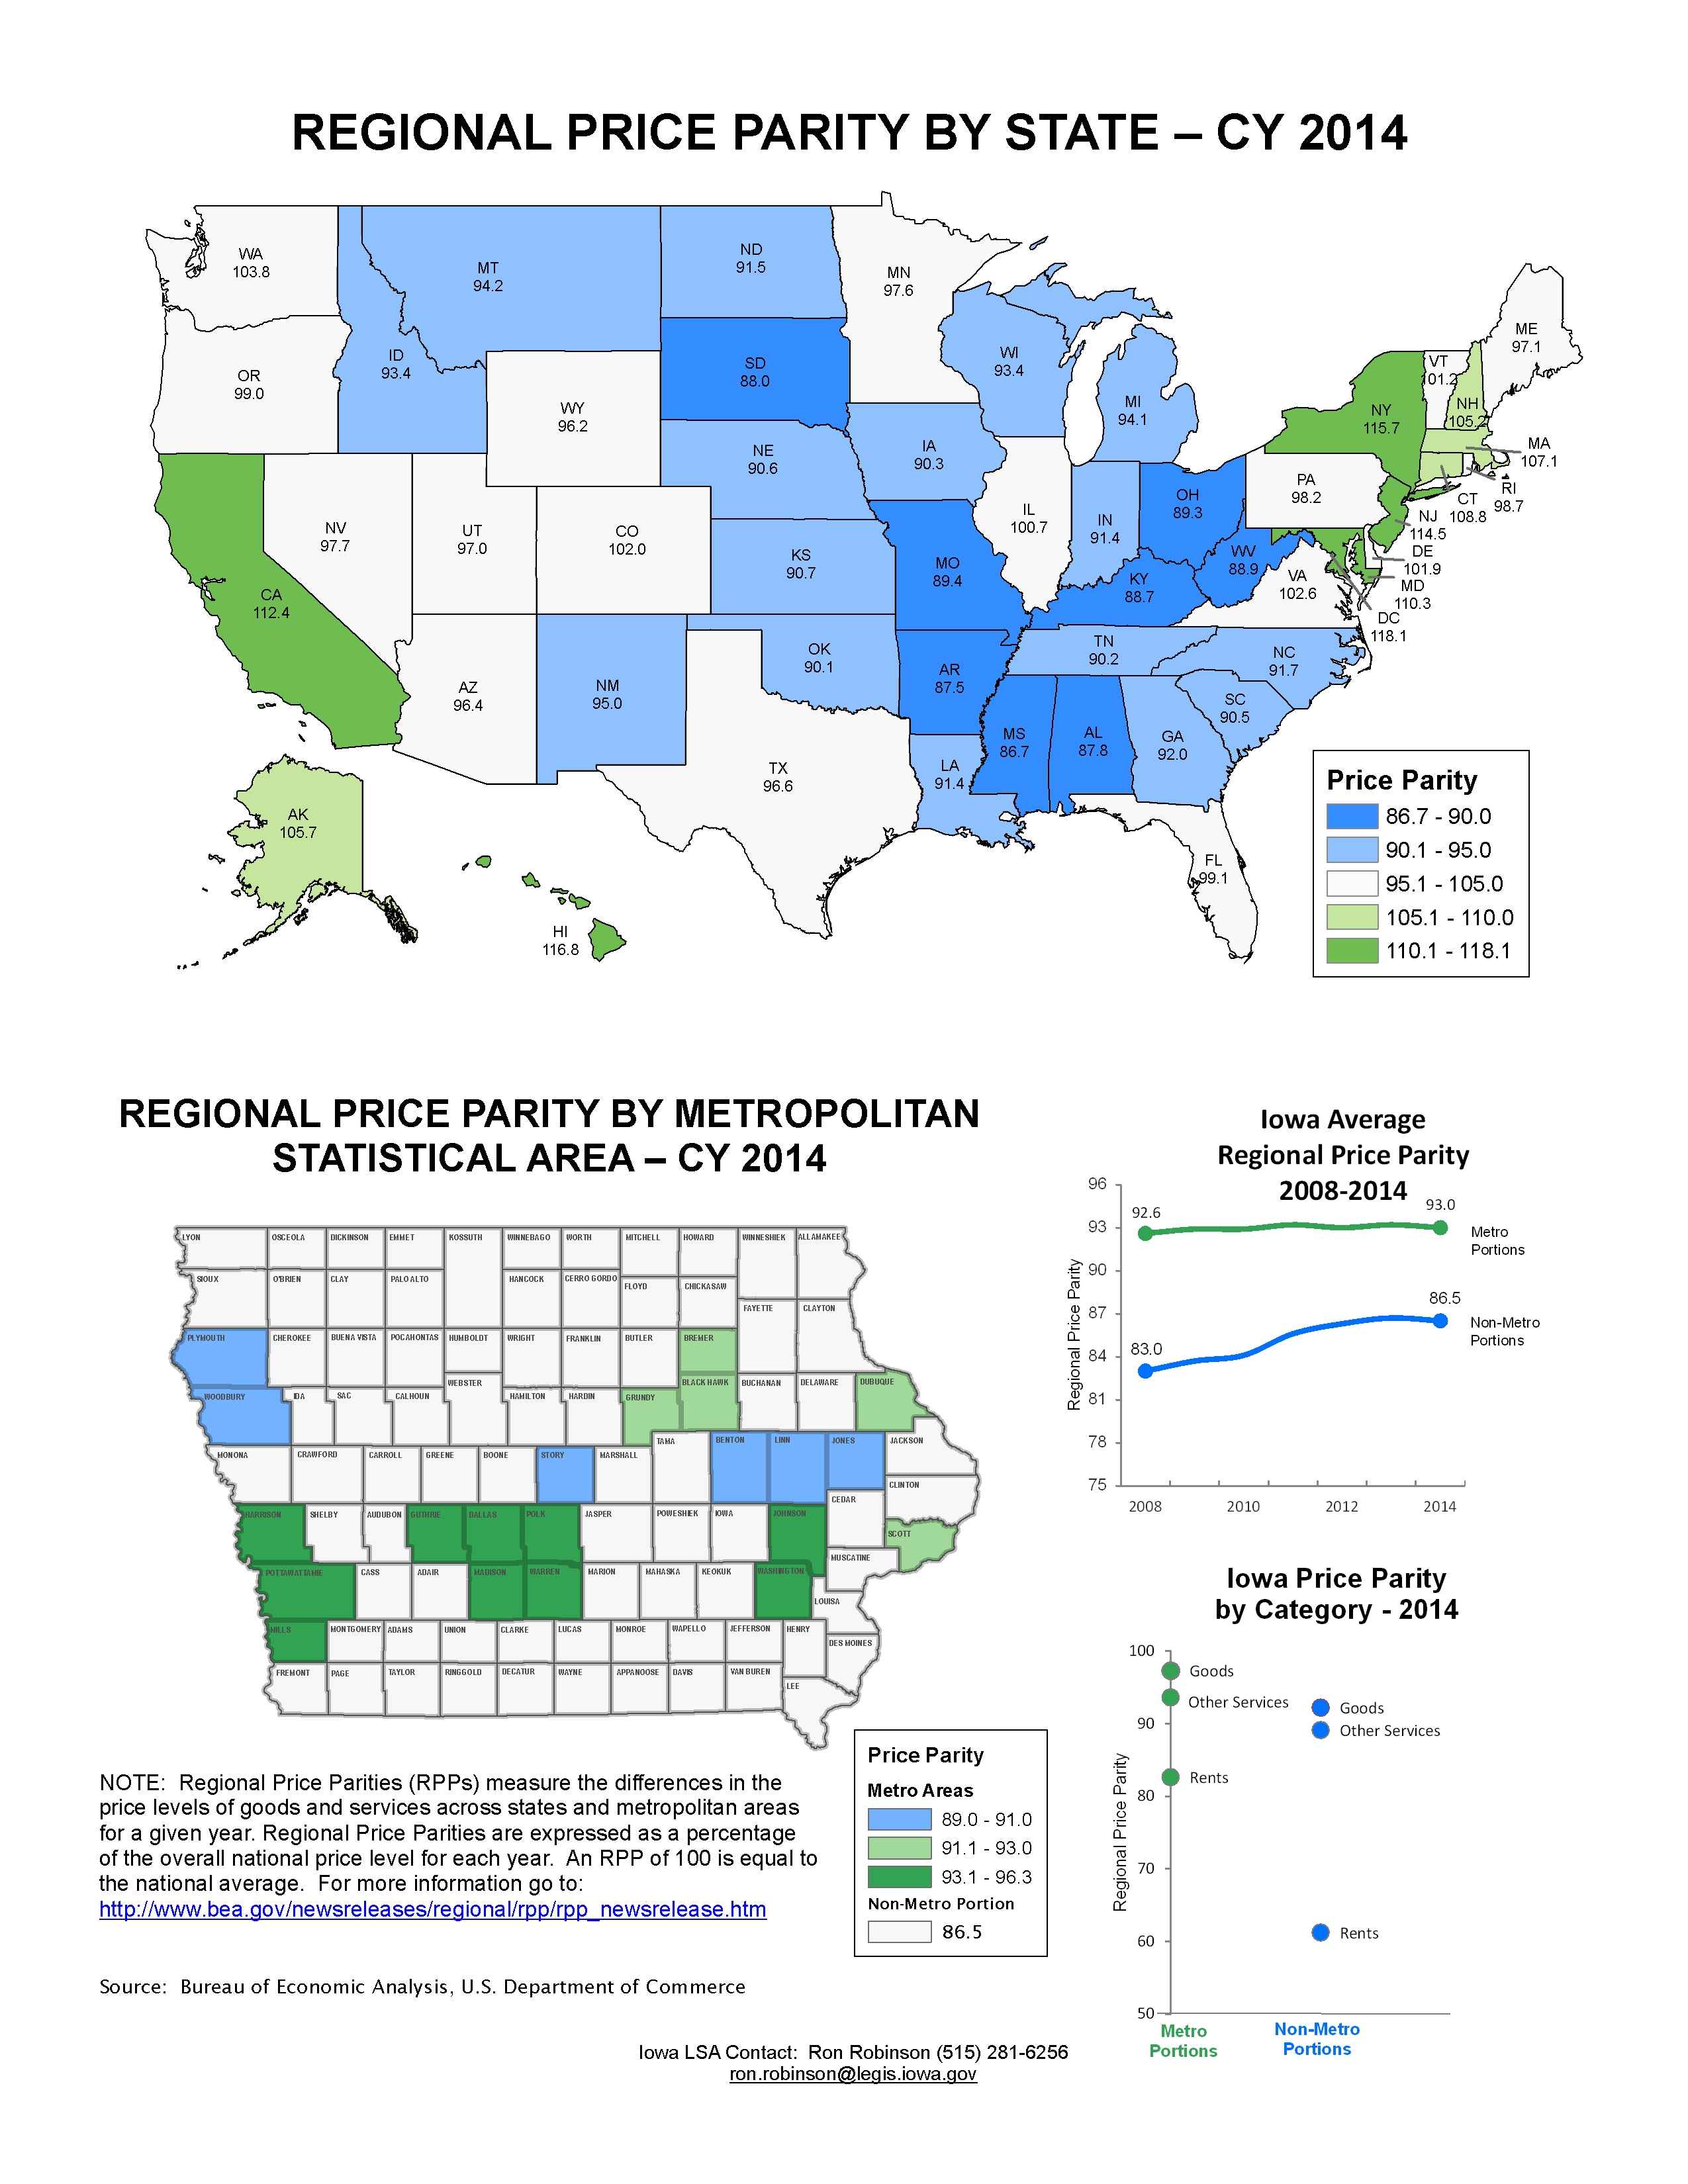
Regional Price Parity by State - 2014
|
|
|
|
|
| 11/07/2016 |
Iowa Insights |
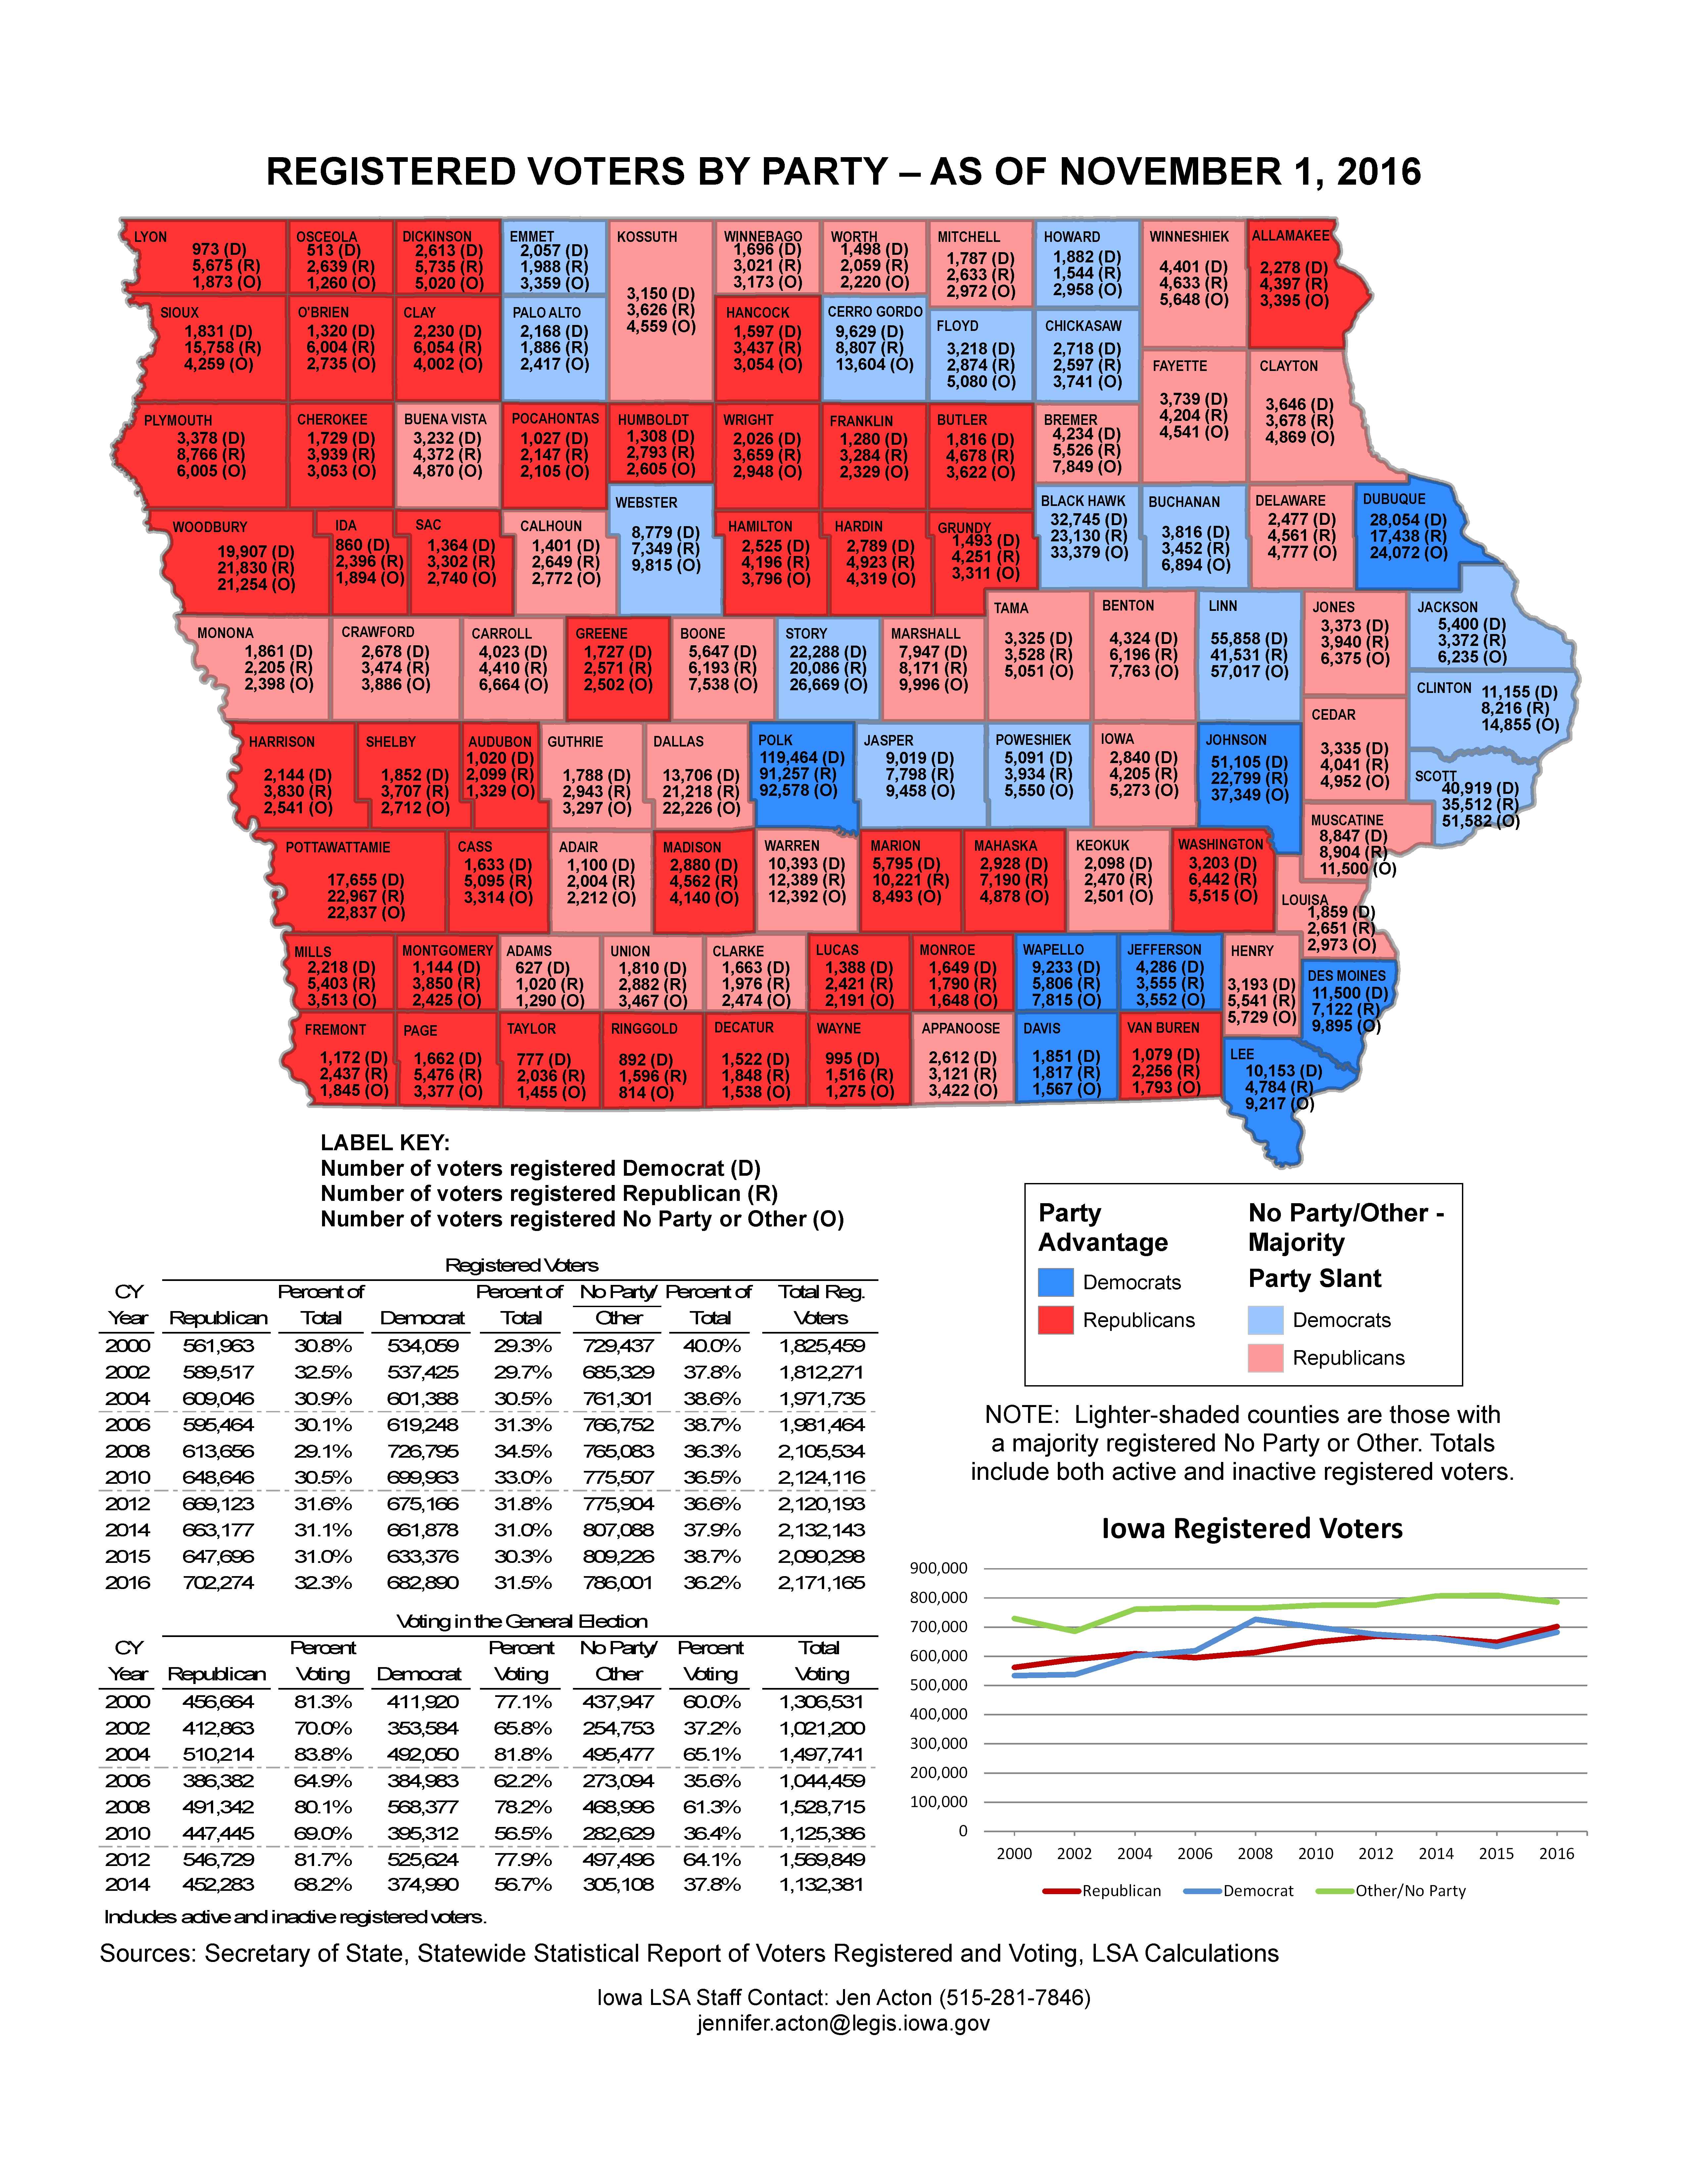
Registered Voters by Party - as of Nov. 1, 2016
|
|
|
|
|
| 10/31/2016 |
Iowa Insights |
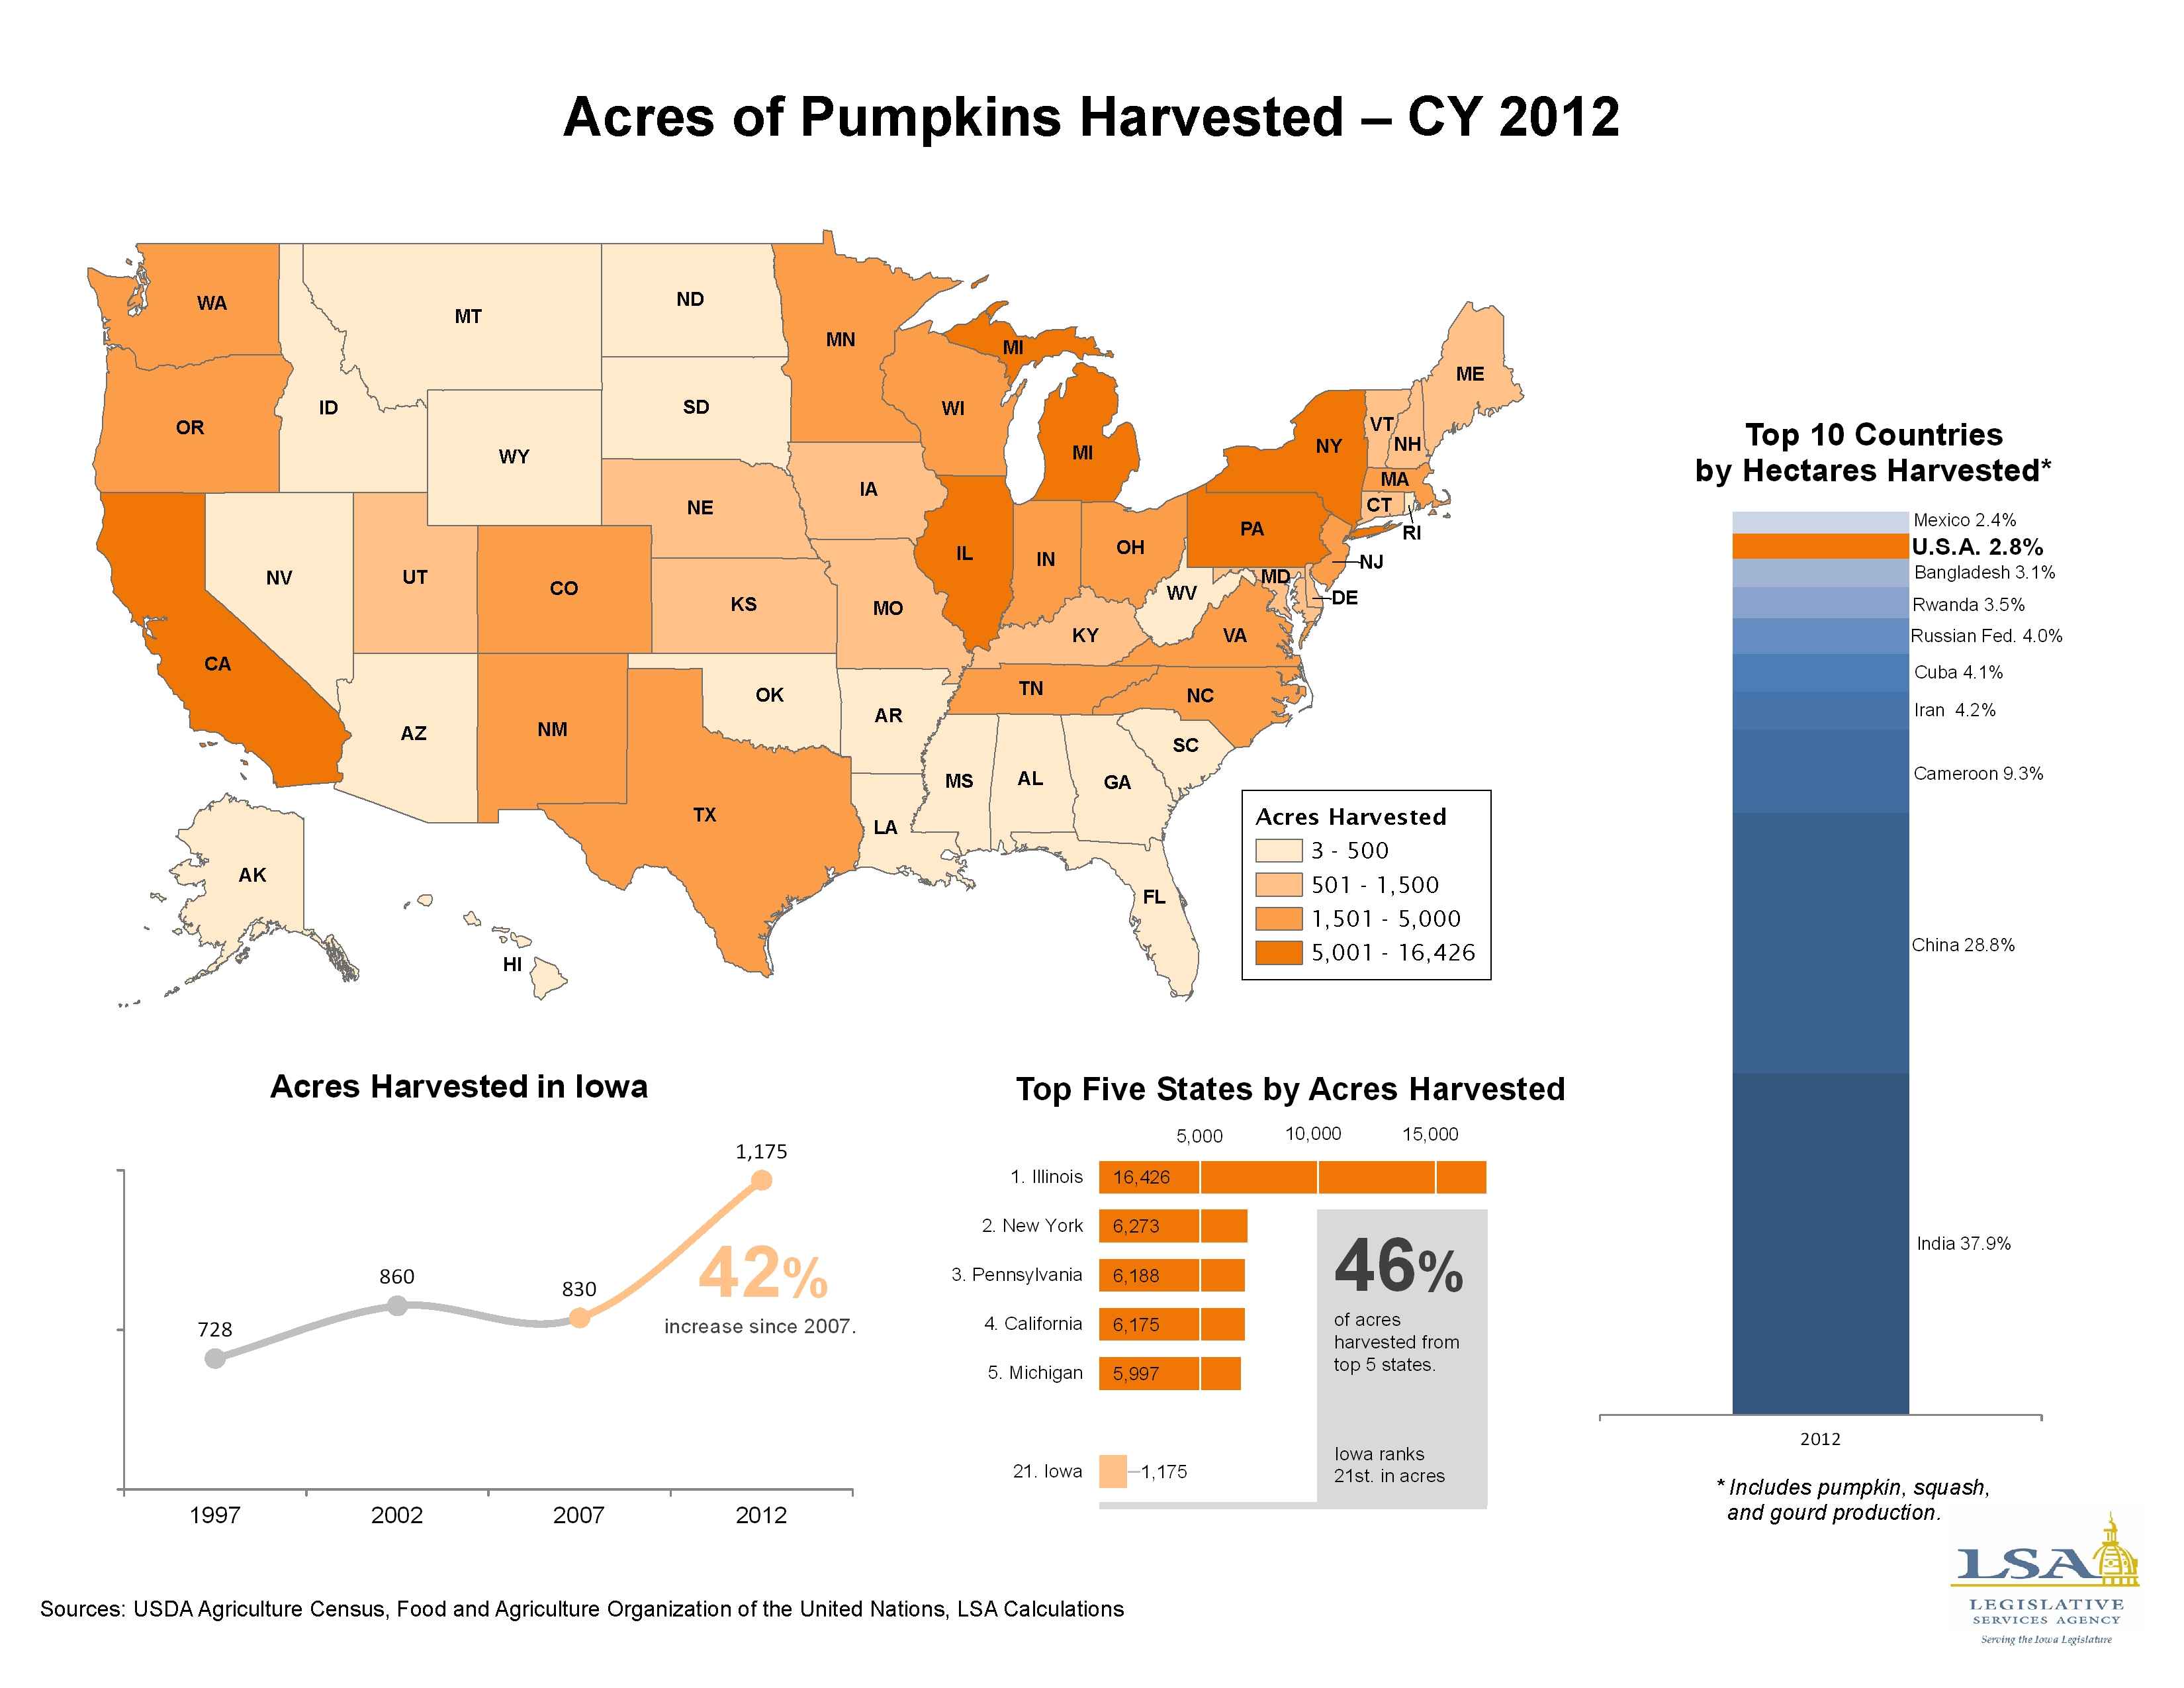
Acres of Pumpkins Harvested by State - CY 2012
|
|
|
|
|
| 10/24/2016 |
Iowa Insights |
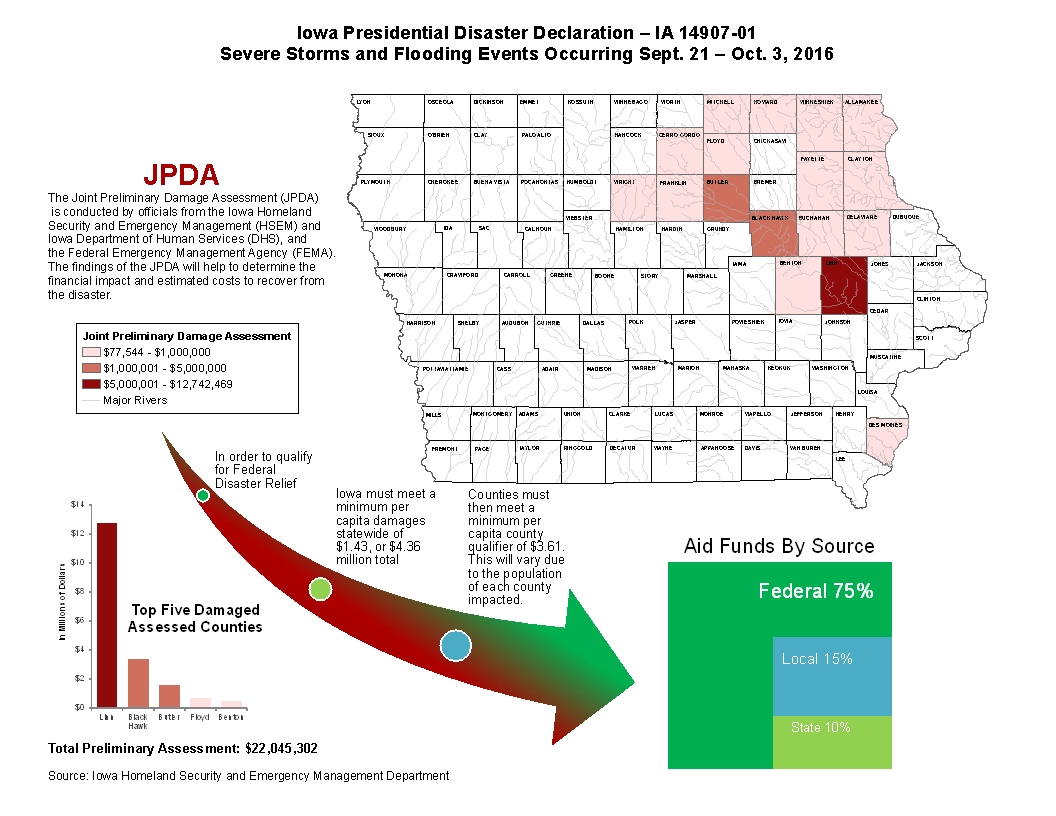
Iowa Presidential Disaster Declaration – IA 14907-01
|
|
|
|
|
| 10/17/2016 |
Iowa Insights |
Wage by Iowa Workforce Development Region and Wage and Employment by Occupation Type in Iowa - CY 2015
|
|
|
|
|
| 10/10/2016 |
Iowa Insights |
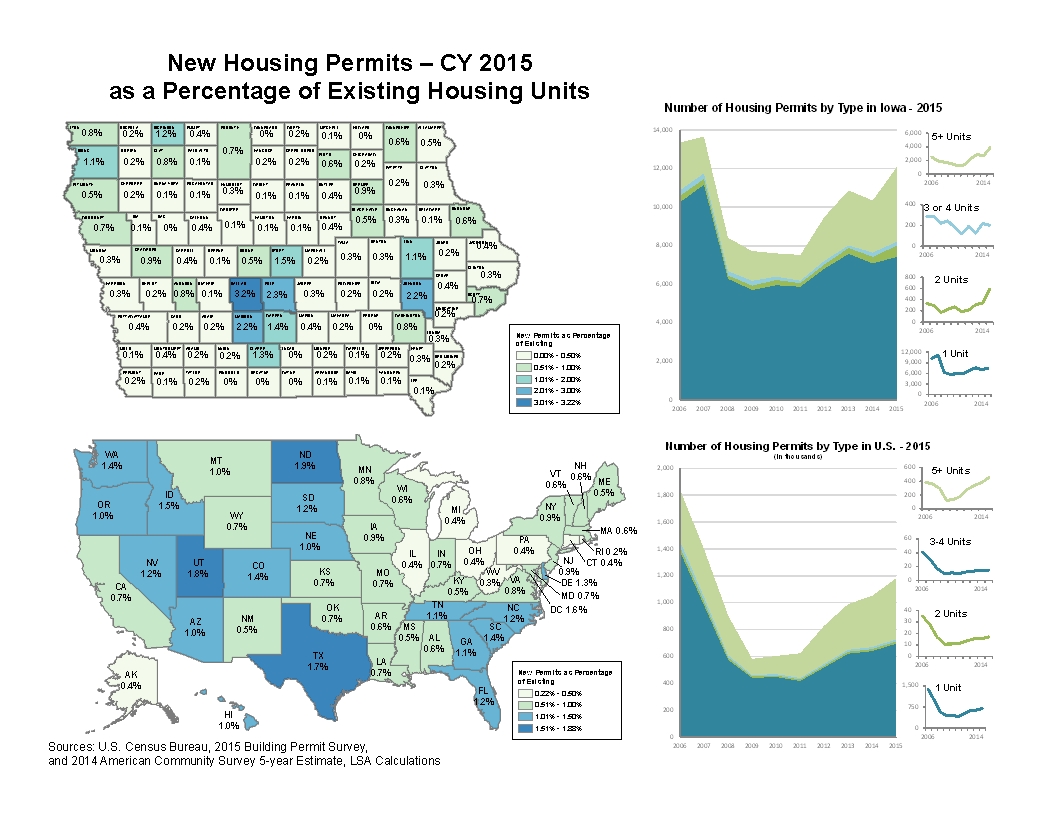
New Building Permits as a Percentage of Existing Units - CY 2015
|
|
|
|
|
| 10/03/2016 |
Iowa Insights |
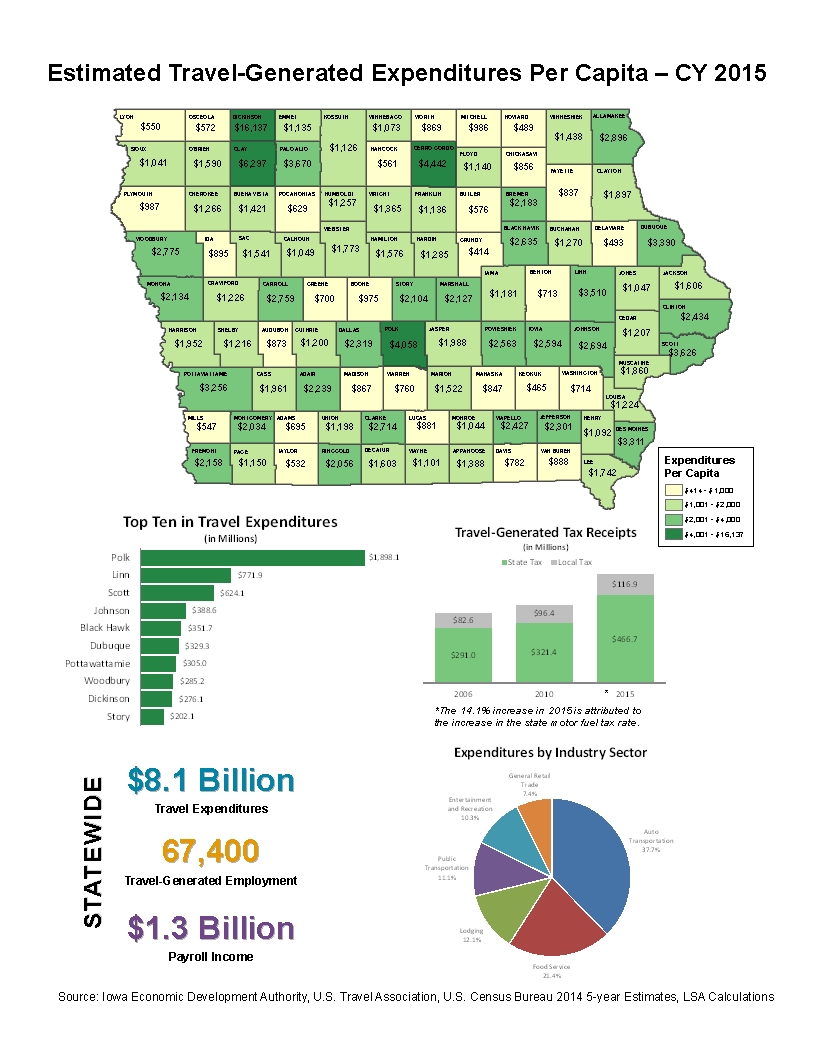
Iowa Tourism Expenditures
|
|
|
|
|
| 09/26/2016 |
Iowa Insights |
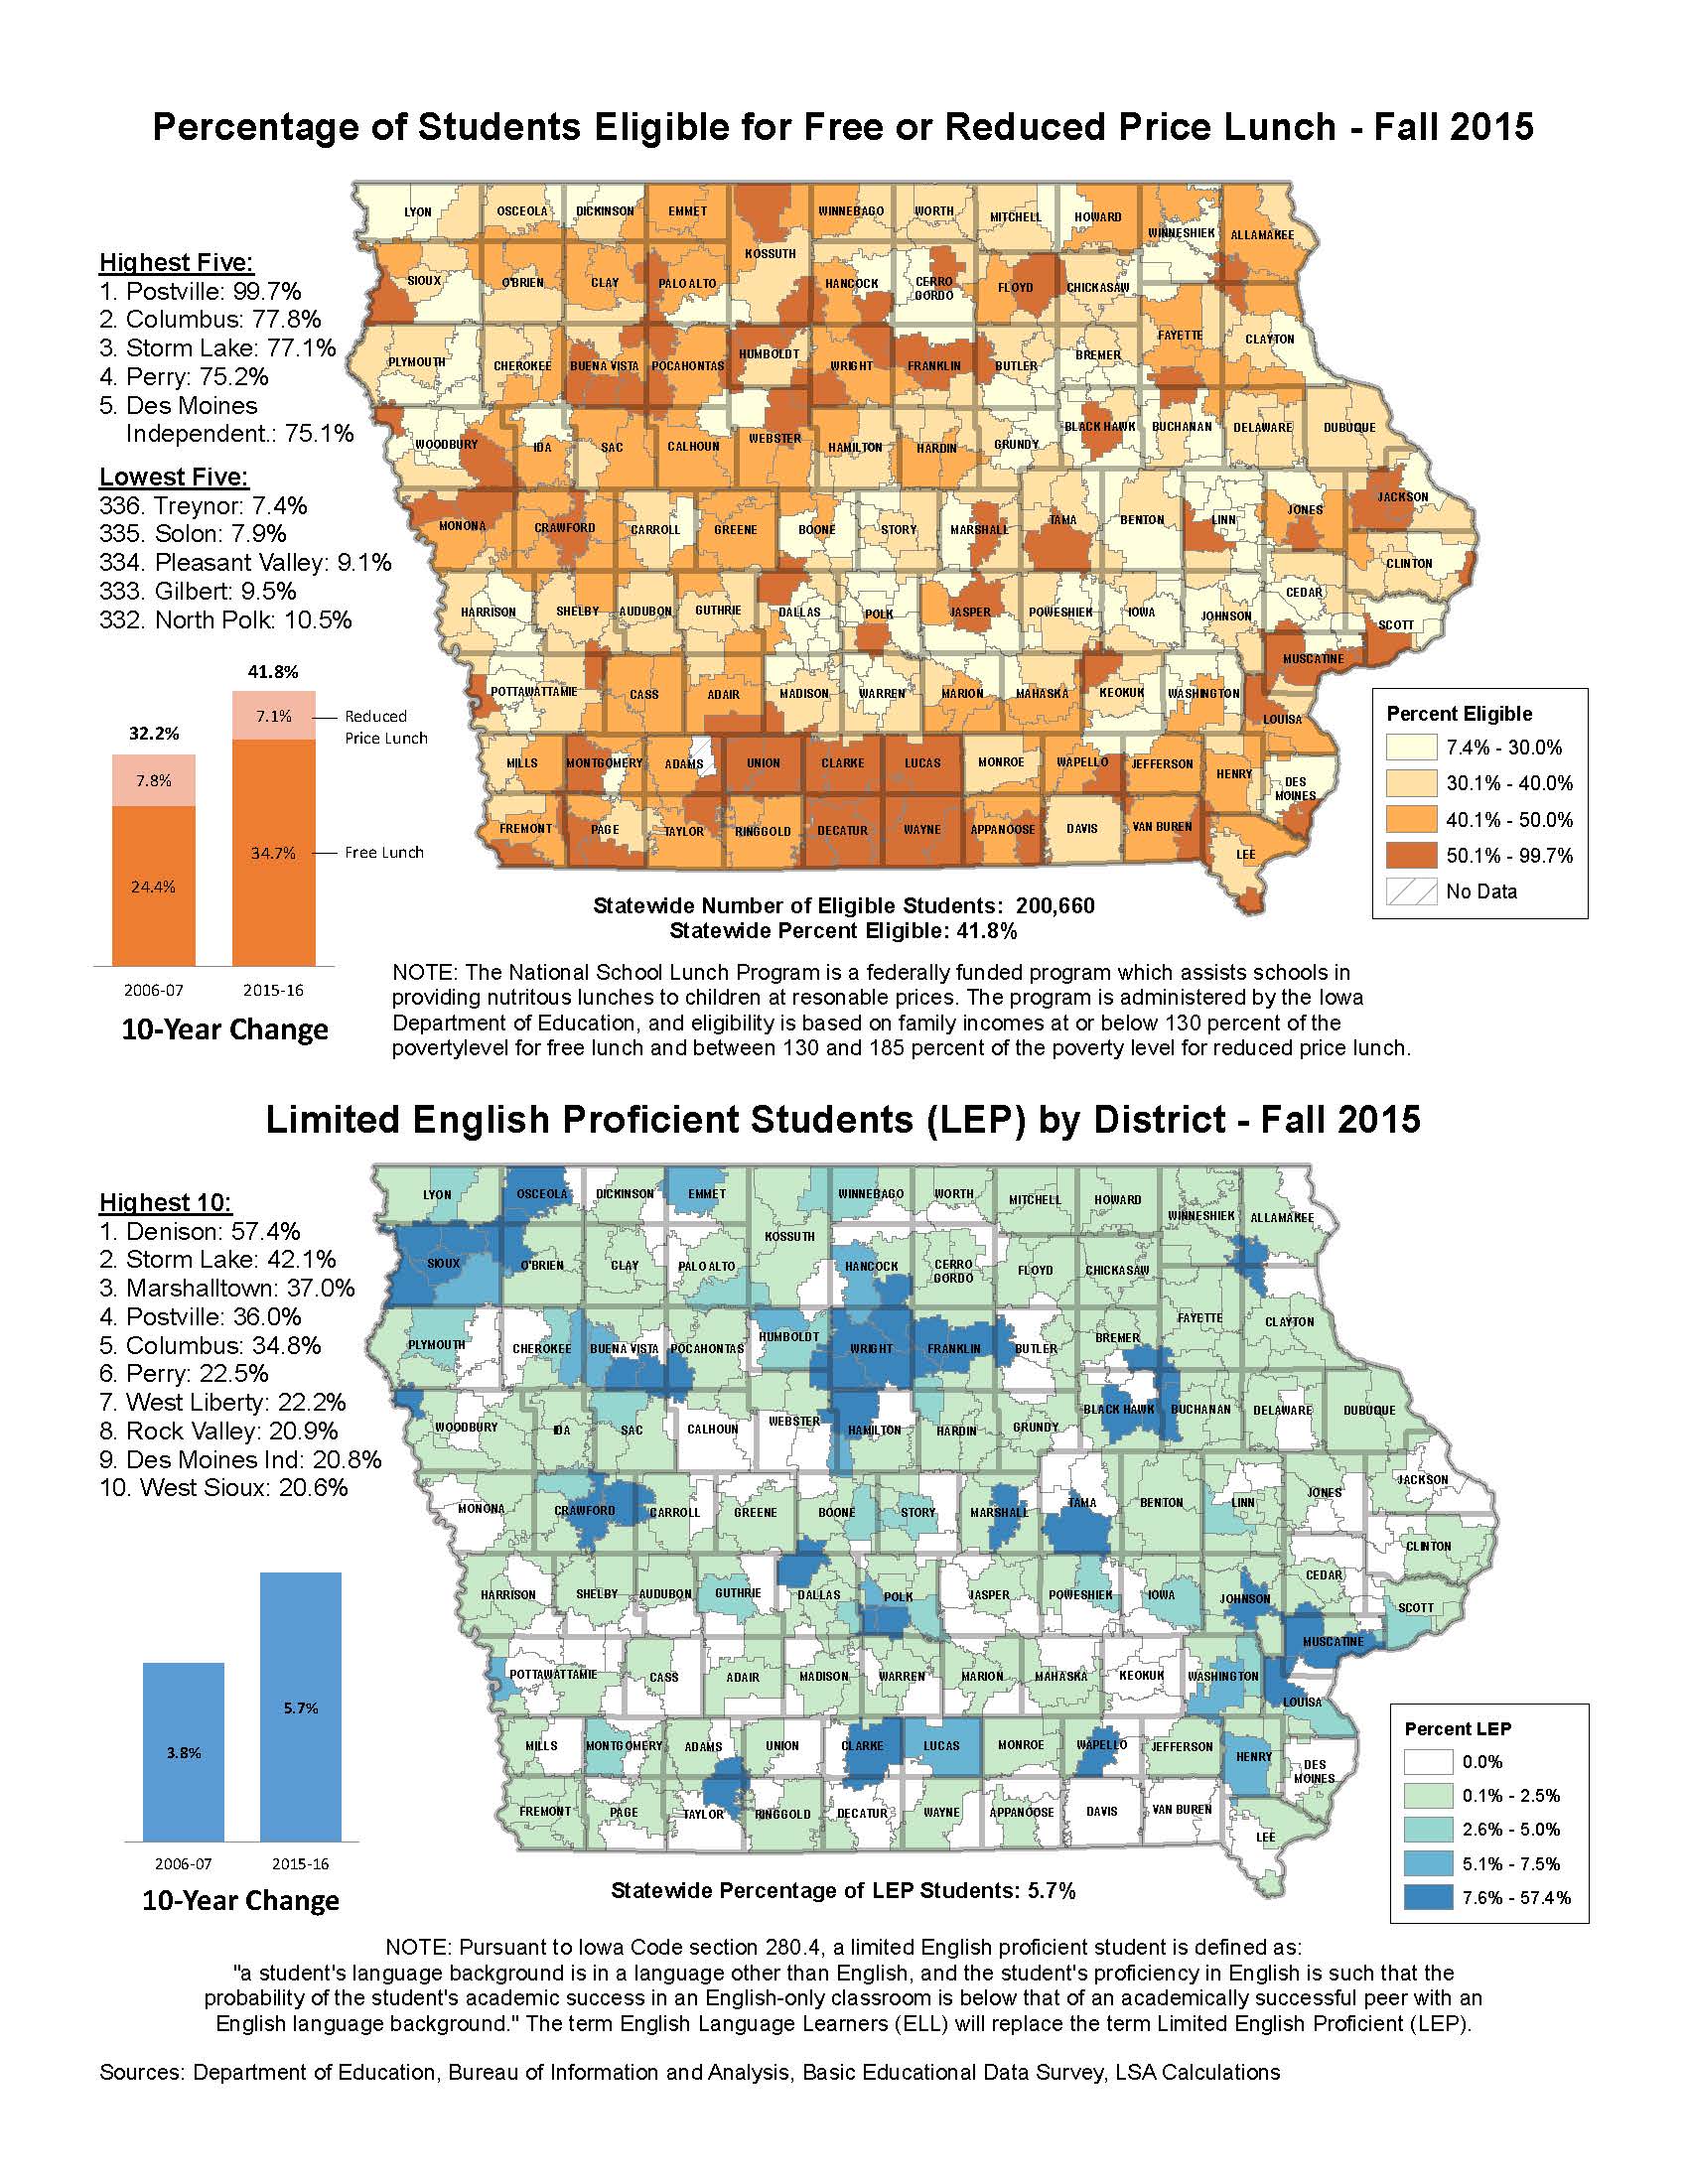
Students Eligible for Free/Reduced Lunch and English Proficient Students
|
|
|
|
|
| 09/19/2016 |
Iowa Insights |
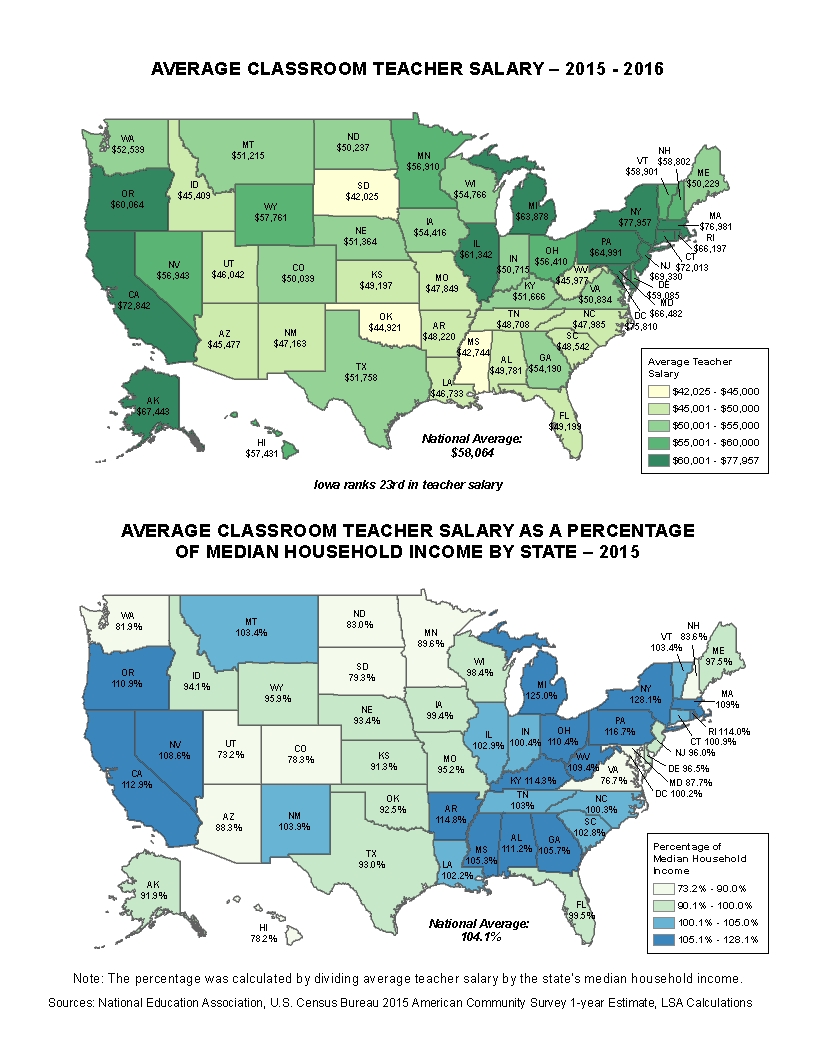
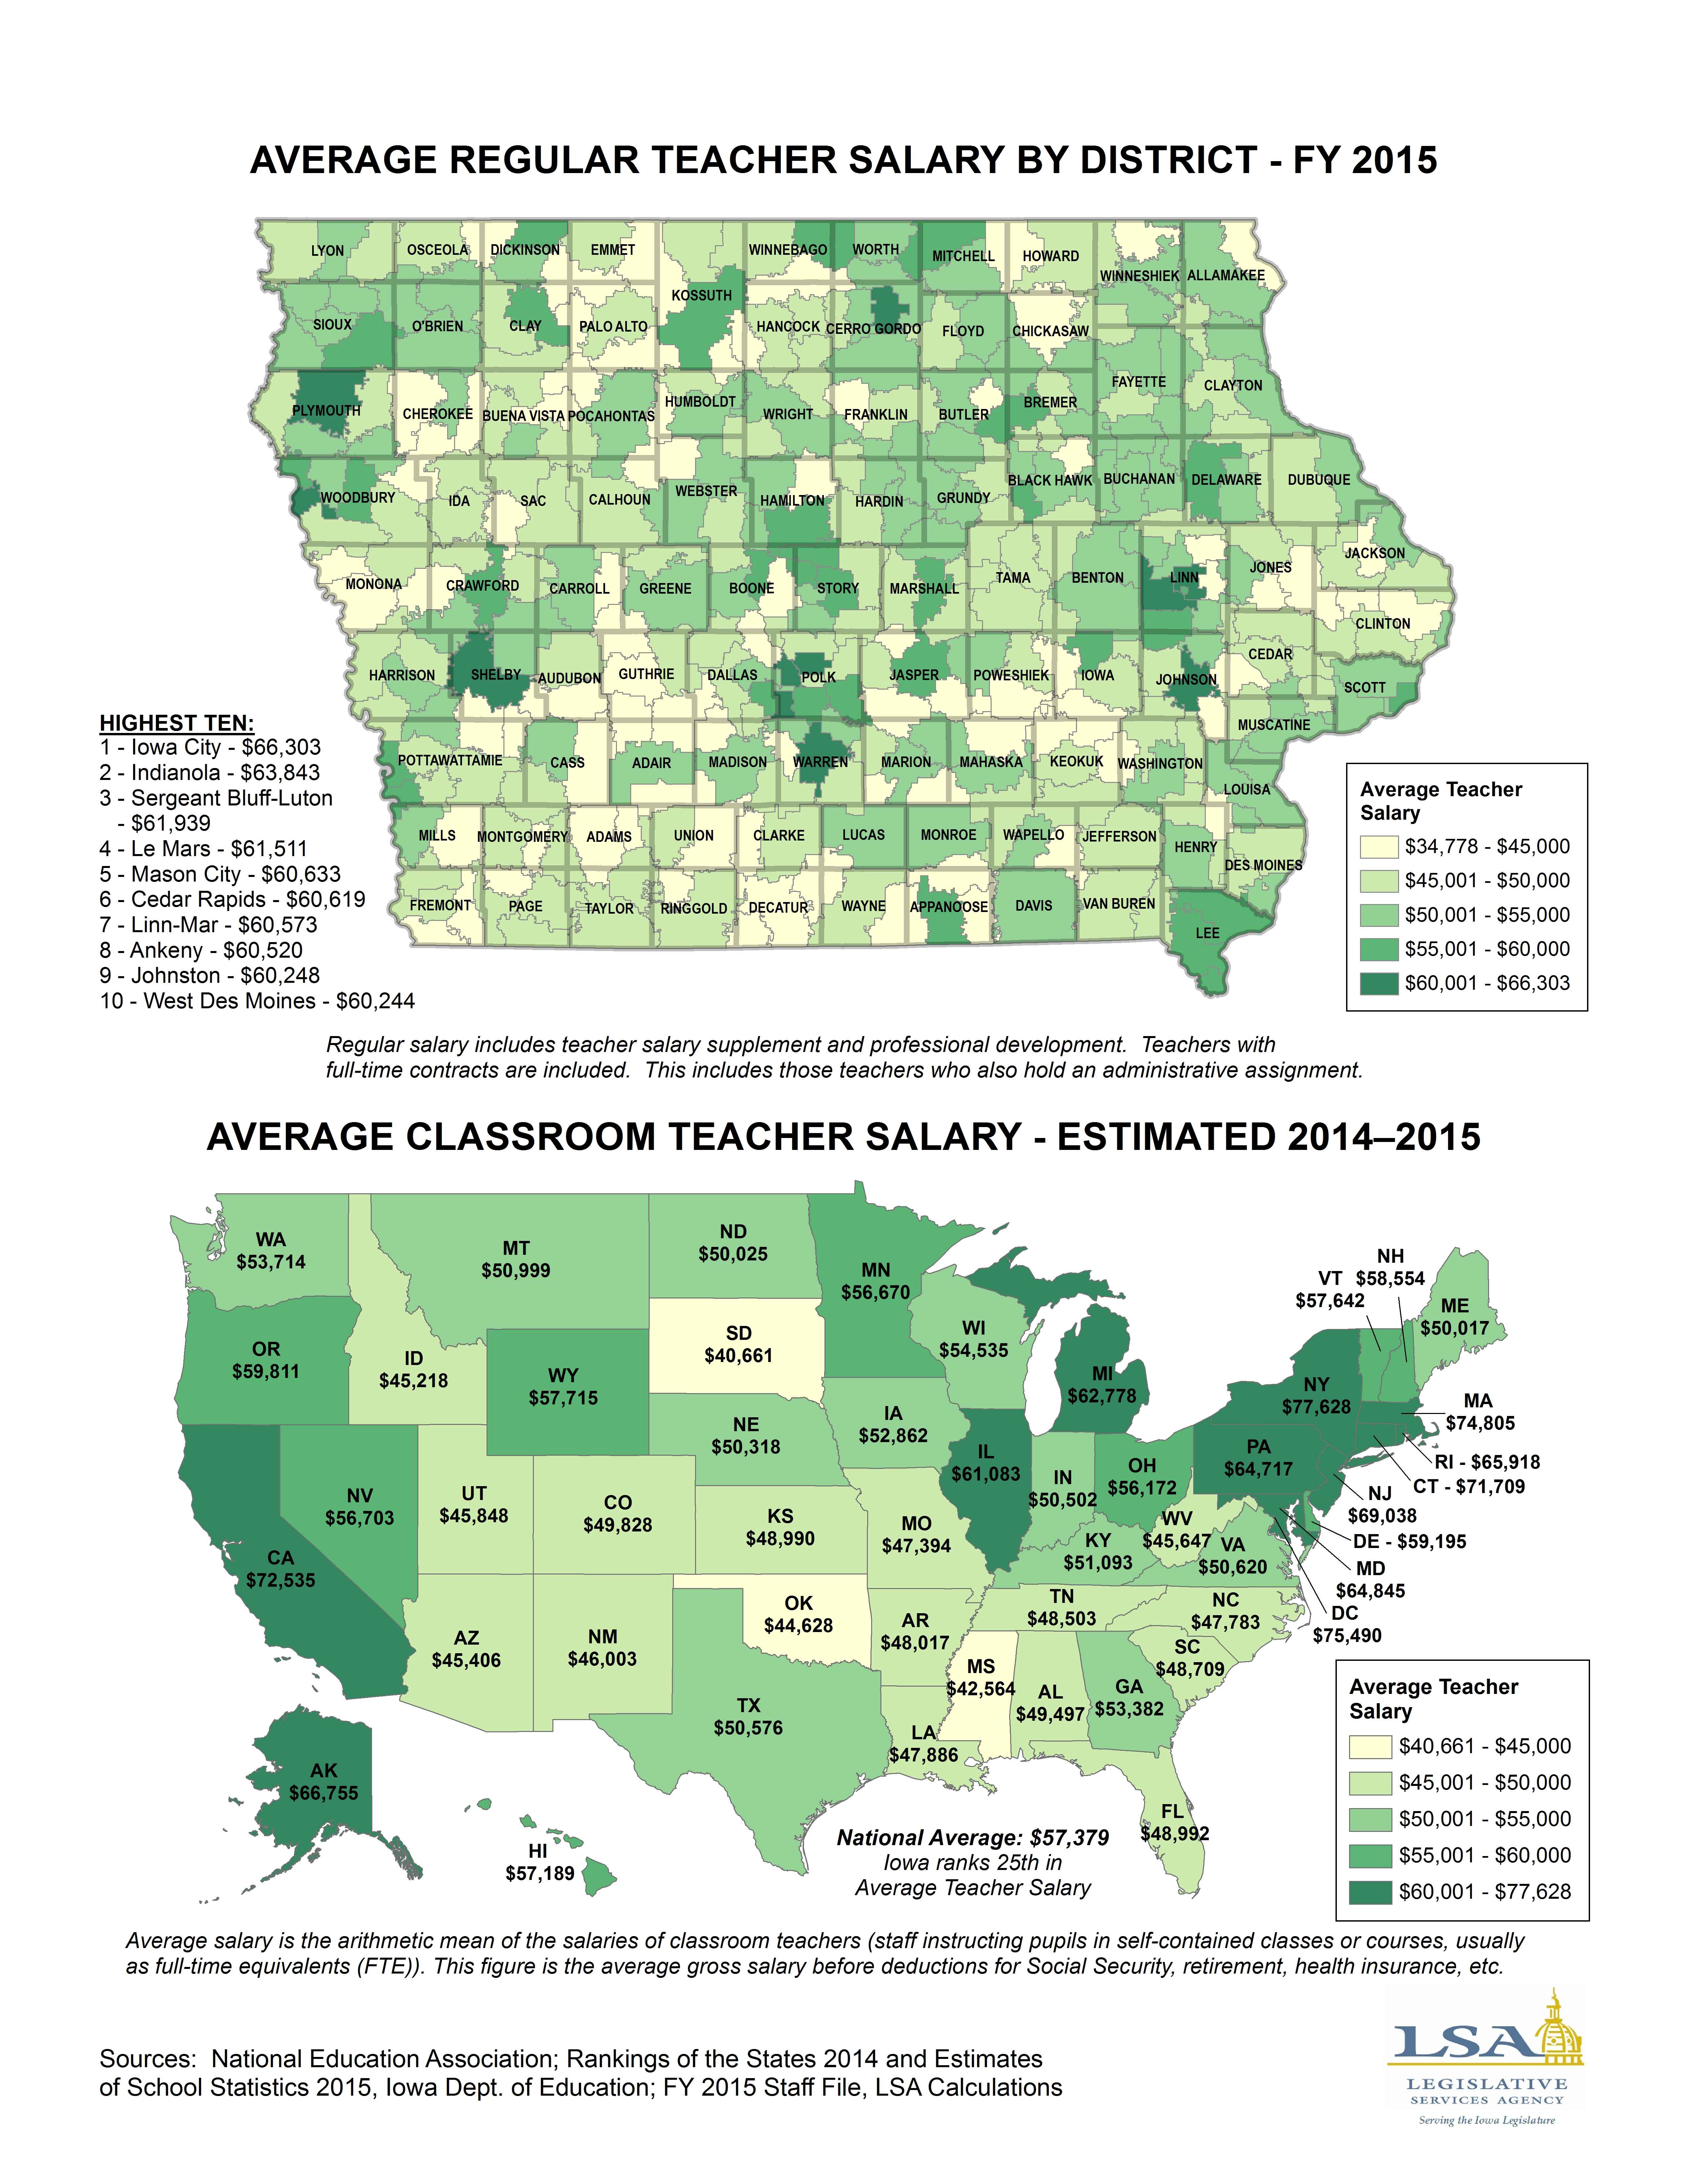
Average Teacher Salary and Teacher Salary as a Percentage of Household Income by State
|
|
|
|
|
| 09/12/2016 |
Iowa Insights |
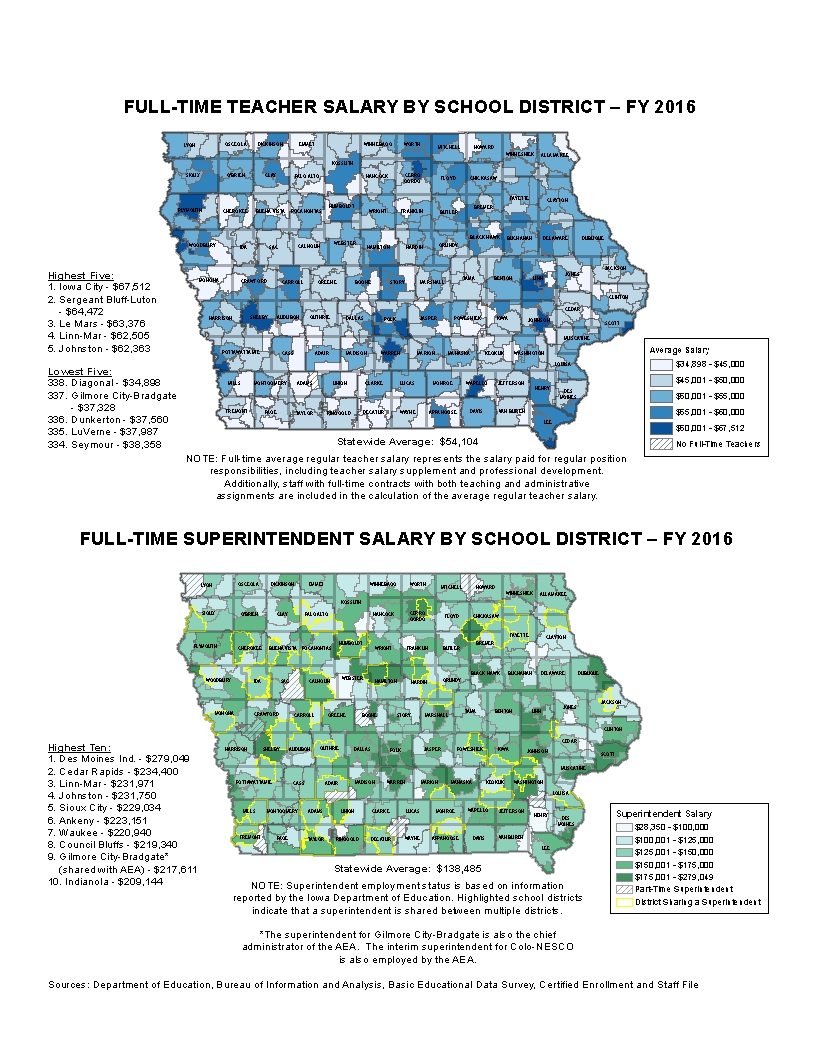
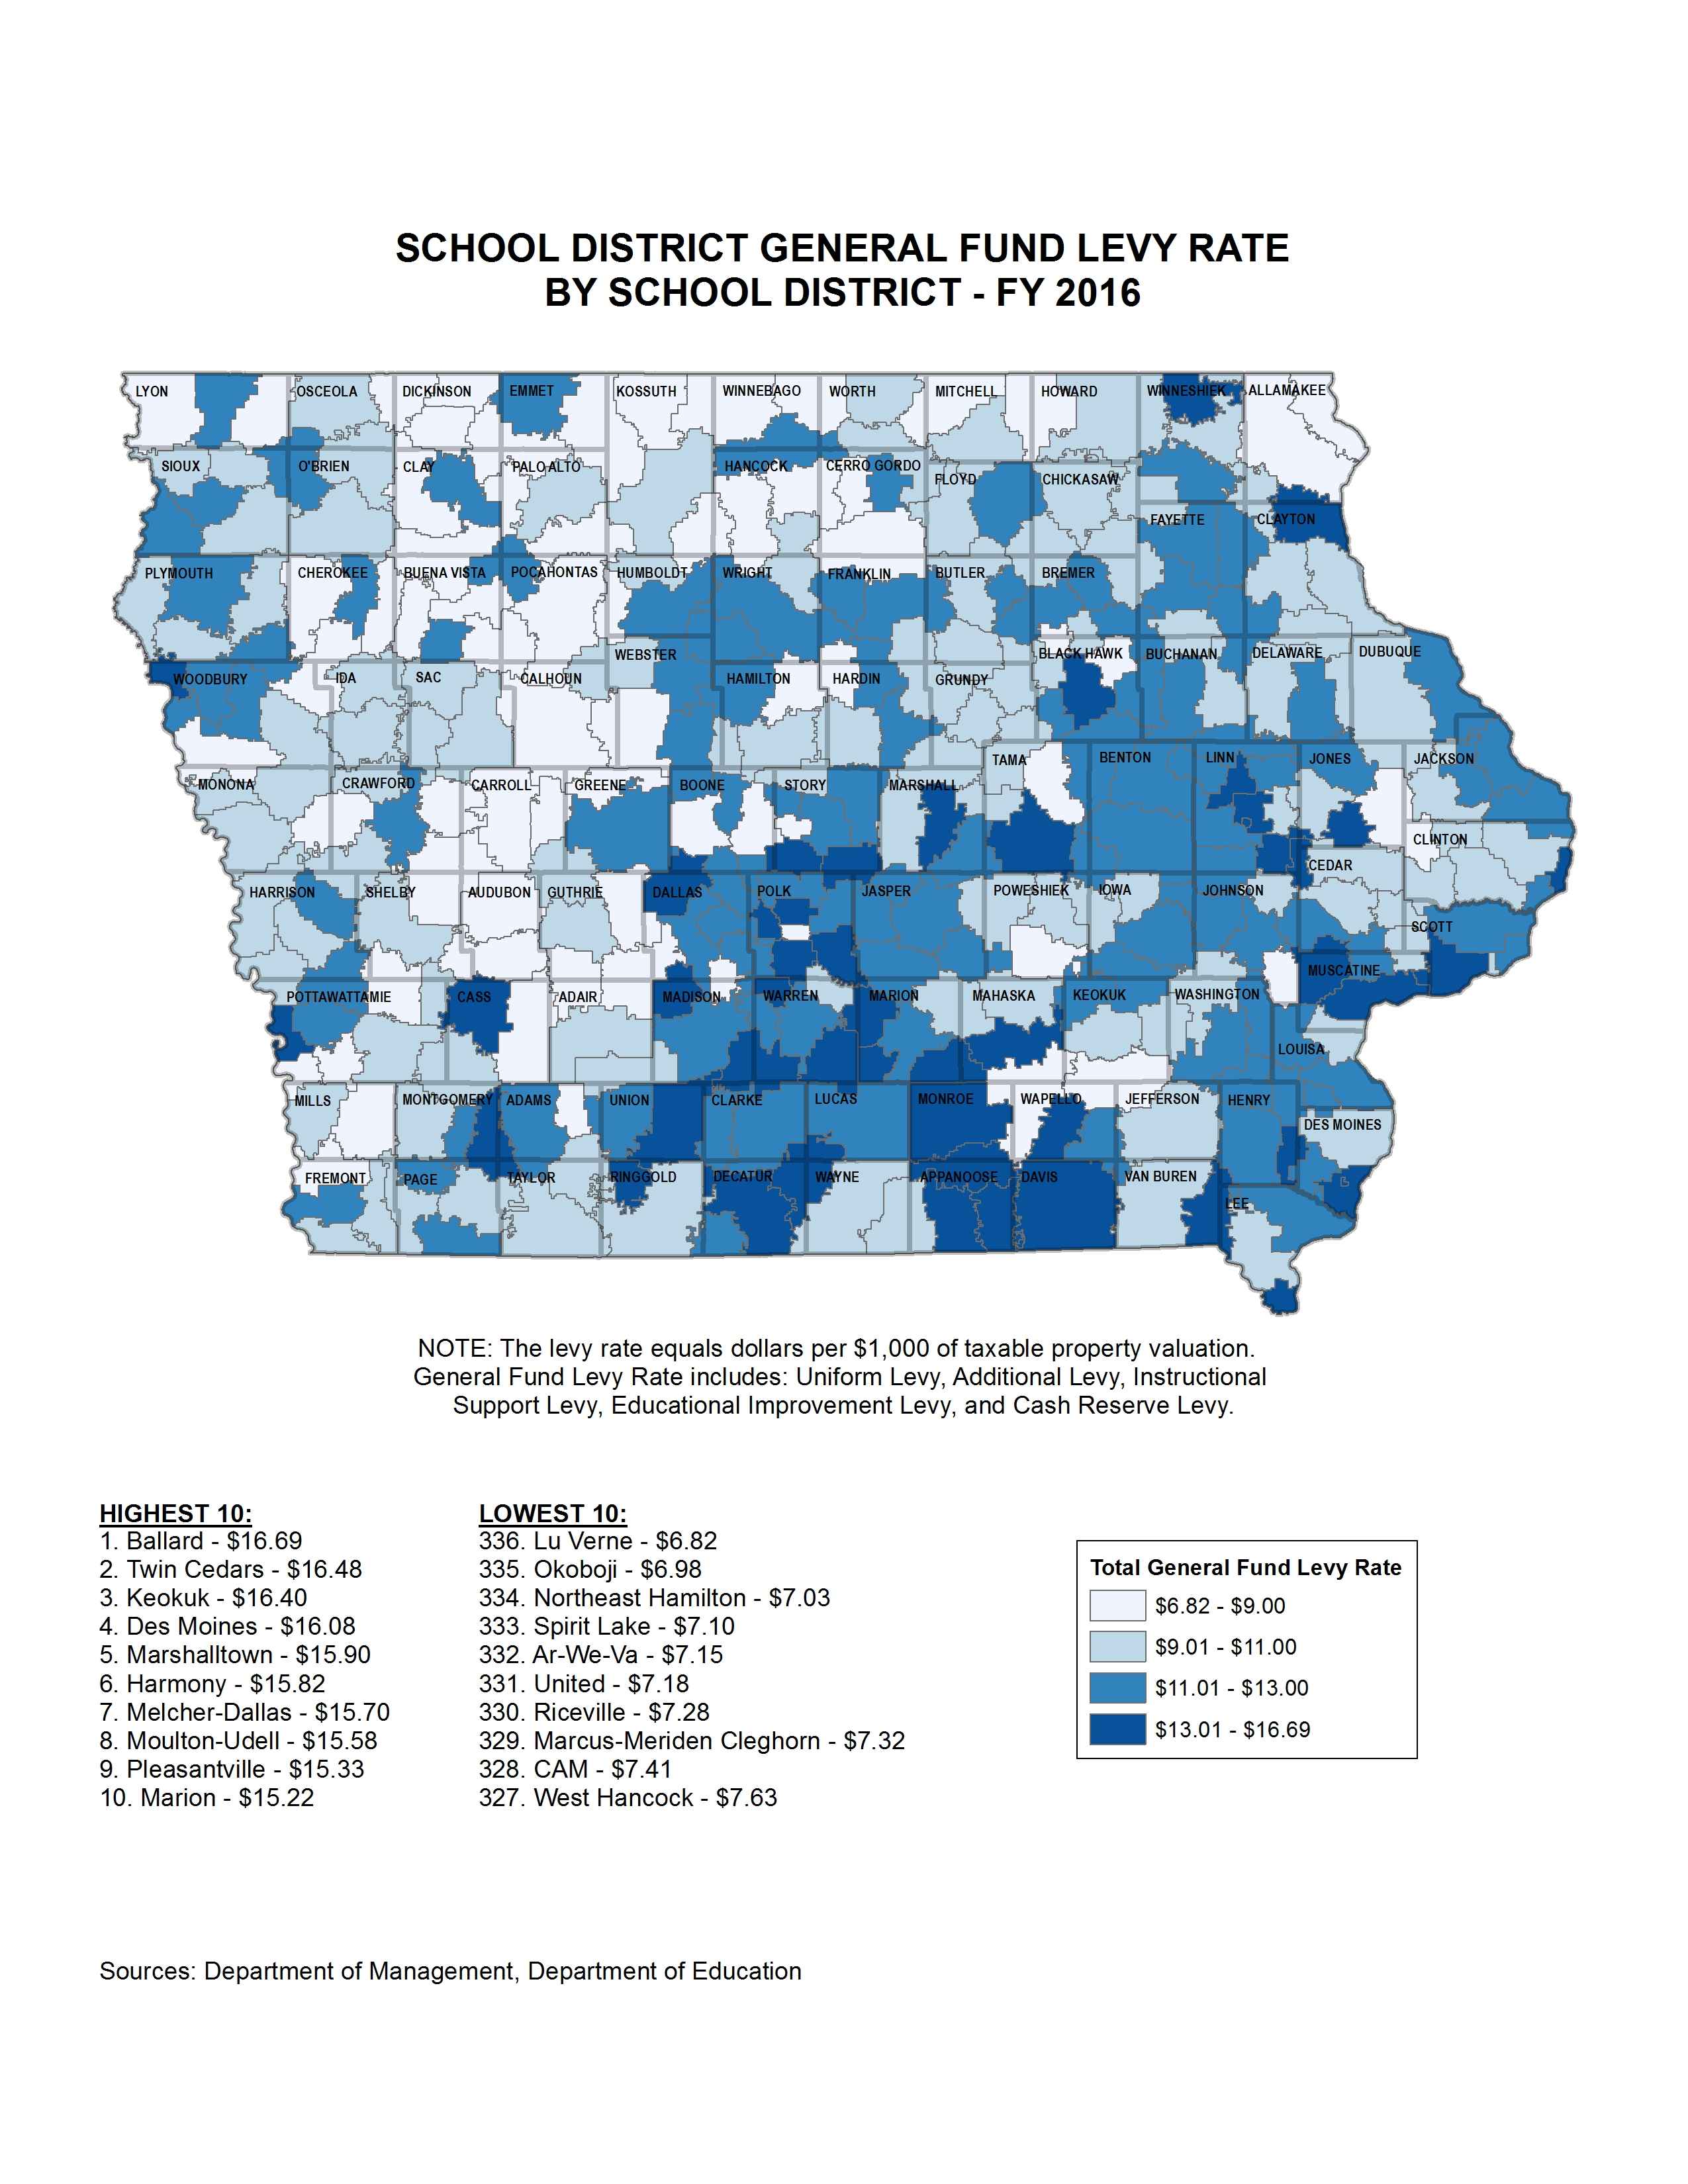
Teacher and Superintendent Salary by School District - FY 2016
|
|
|
|
|
| 09/06/2016 |
Iowa Insights |
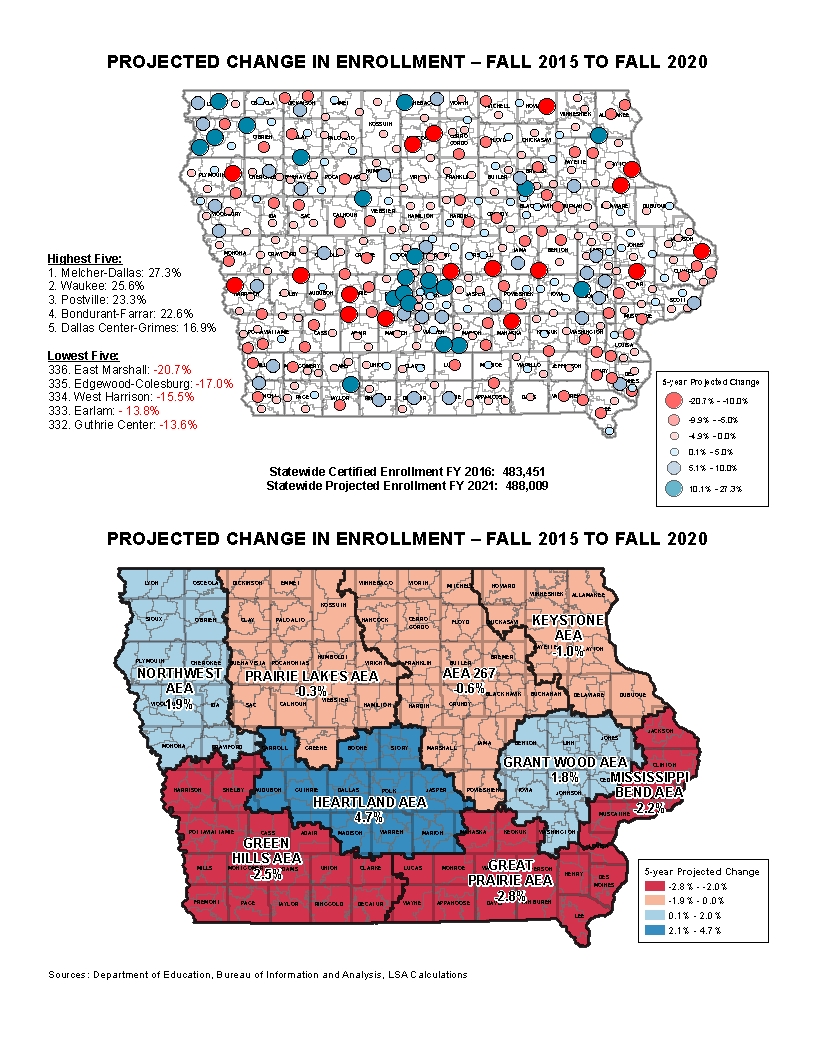
Projected Change in Enrollment Fall 2015 To Fall 2020
|
|
|
|
|
| 08/29/2016 |
Iowa Insights |
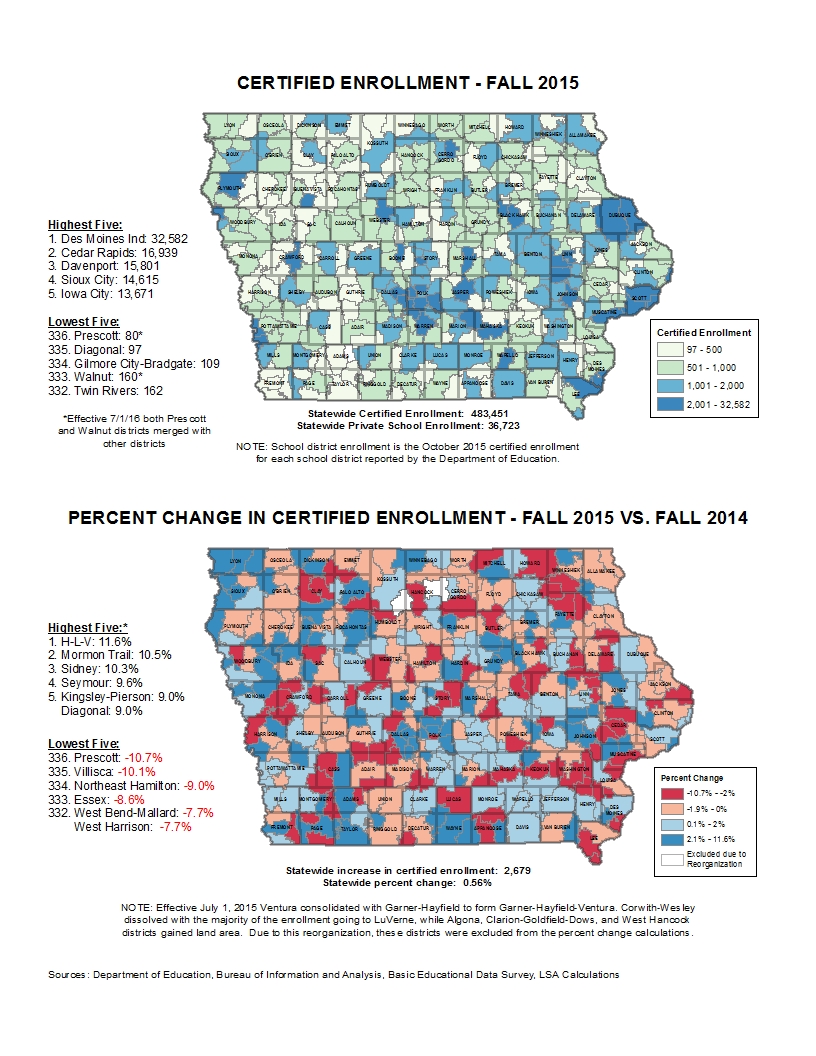
Certified Enrollment Fall 2015 and 1-Year Percent Change
|
|
|
|
|
| 08/22/2016 |
Iowa Insights |
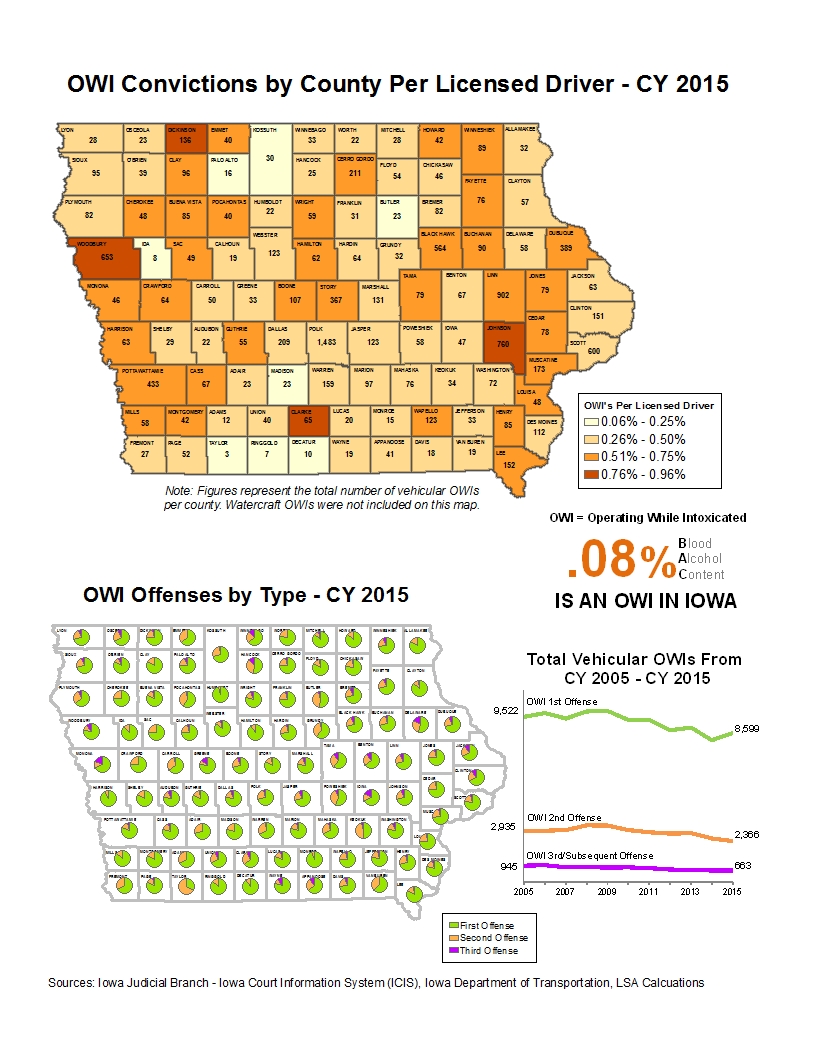
OWI Convictions by County Per Licensed Driver and by Offense - CY 2015
|
|
|
|
|
| 08/15/2016 |
Iowa Insights |
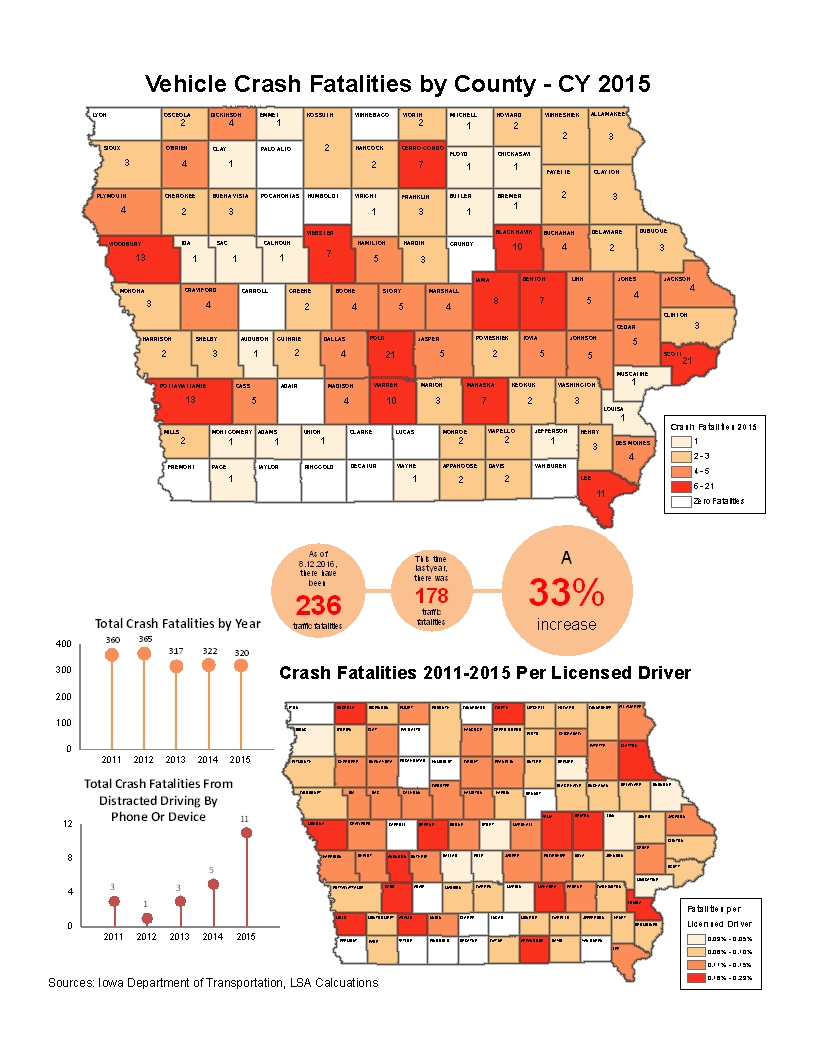
Vehicle Crash Fatalities by County - 2015
|
|
|
|
|
| 08/08/2016 |
Iowa Insights |
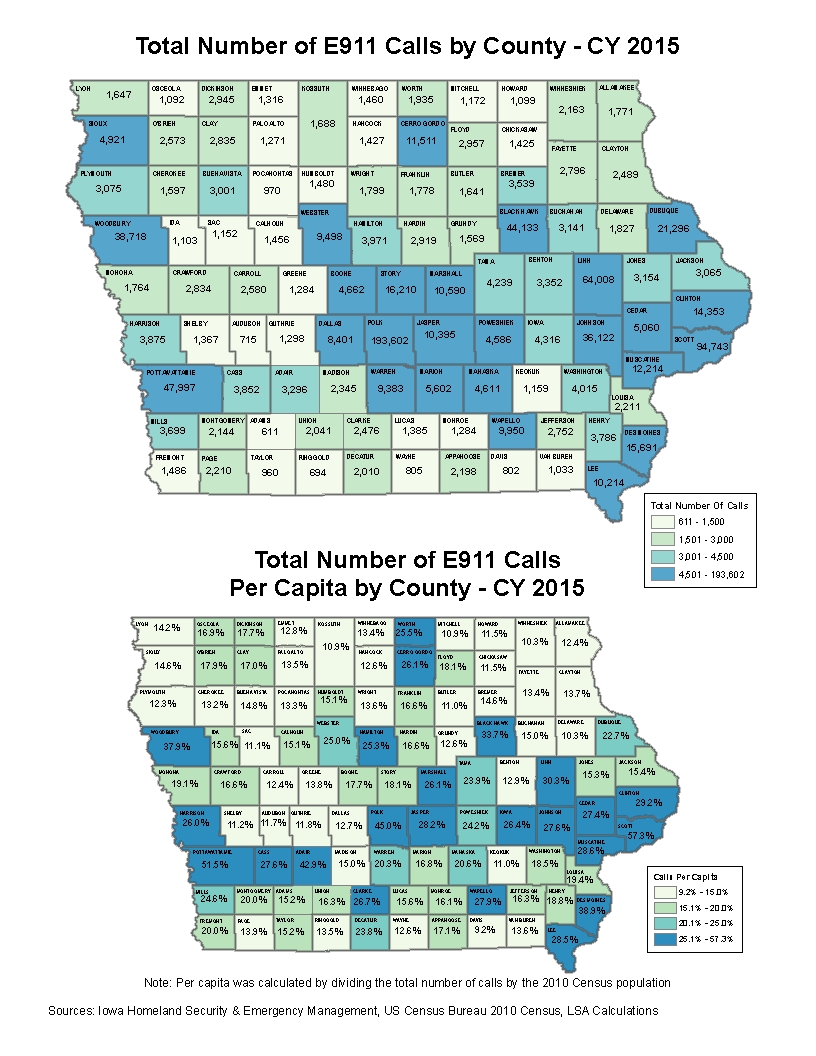
Total Number of E911 Calls and Per Capita Calls by County - CY 2015
|
|
|
|
|
| 08/01/2016 |
Iowa Insights |
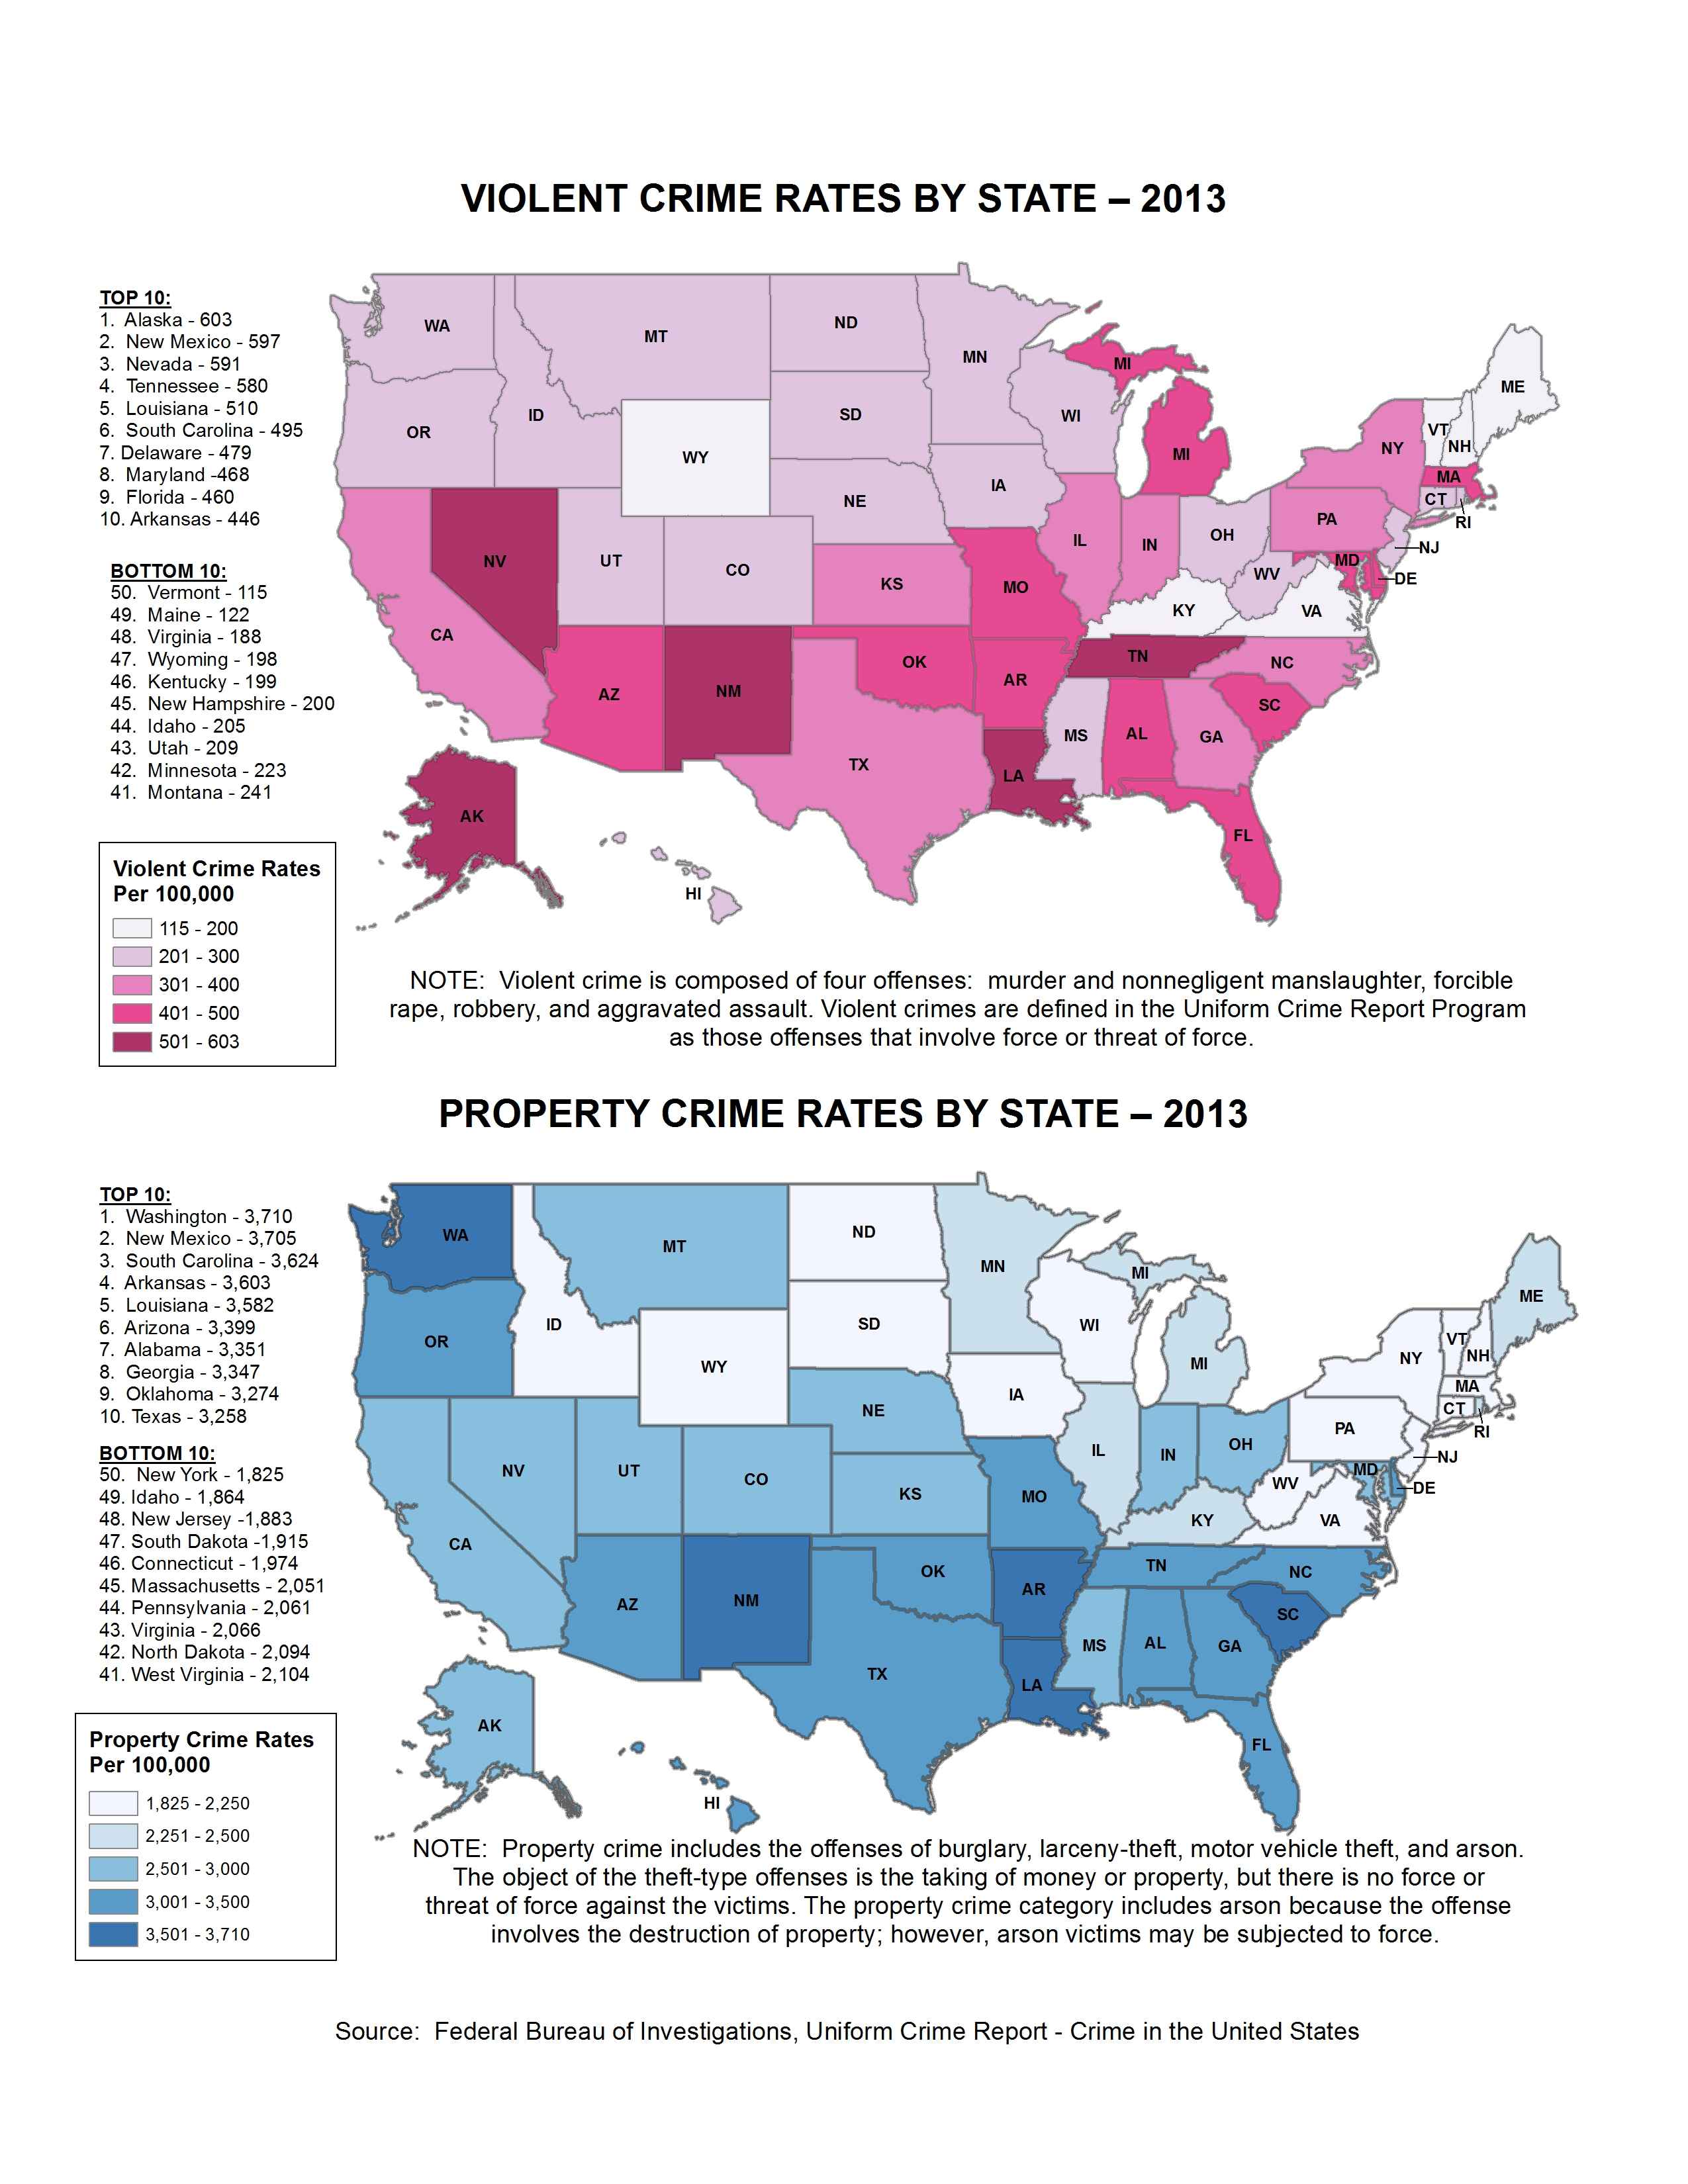
Violent and Property Crime Rates by State - 2013
|
|
|
|
|
| 07/25/2016 |
Iowa Insights |
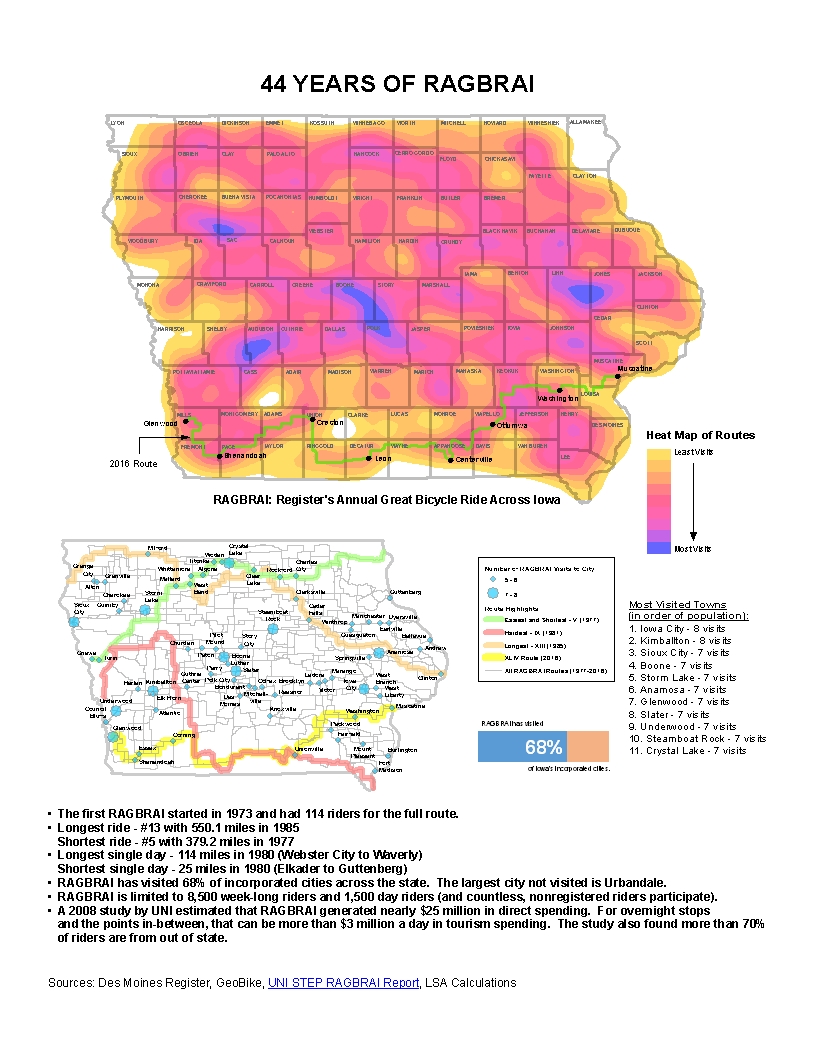
44 Years of RAGBRAI
|
|
|
|
|
| 07/18/2016 |
Iowa Insights |
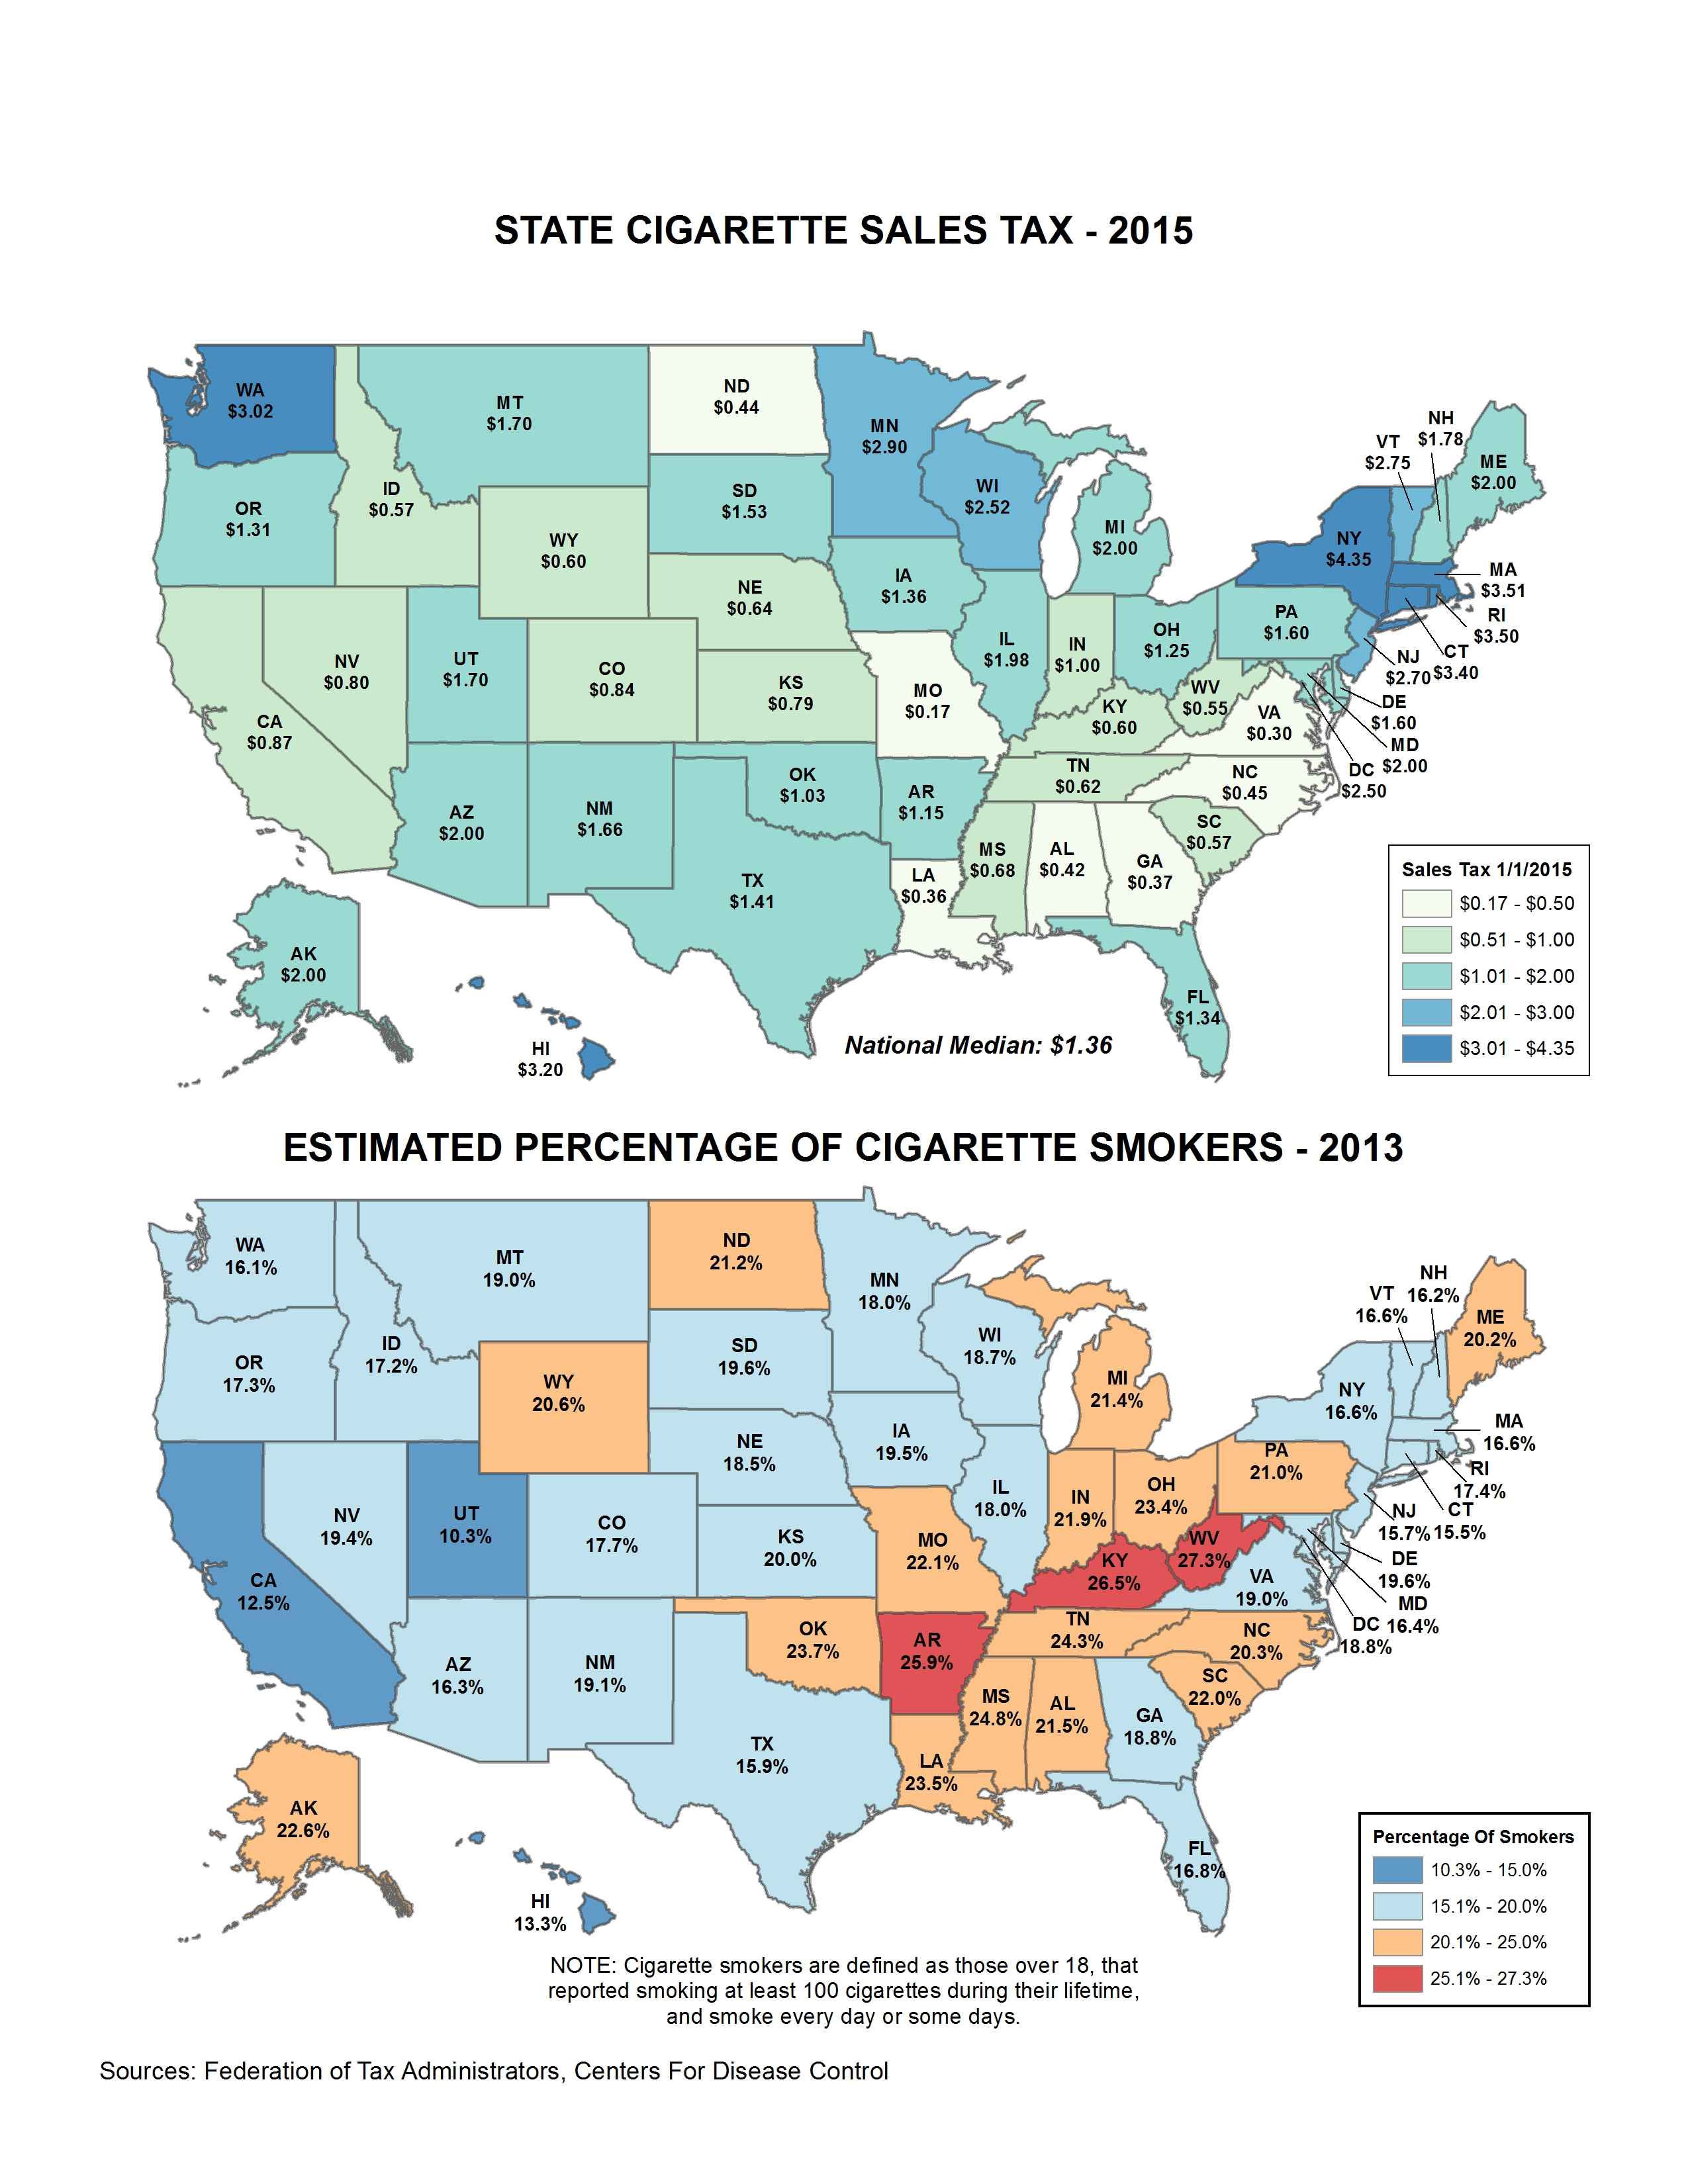
State Cigarette Sales Tax - 2015
|
|
|
|
|
| 07/11/2016 |
Iowa Insights |
State Gasoline Tax - 2015

|
|
|
|
|
| 07/05/2016 |
Iowa Insights |
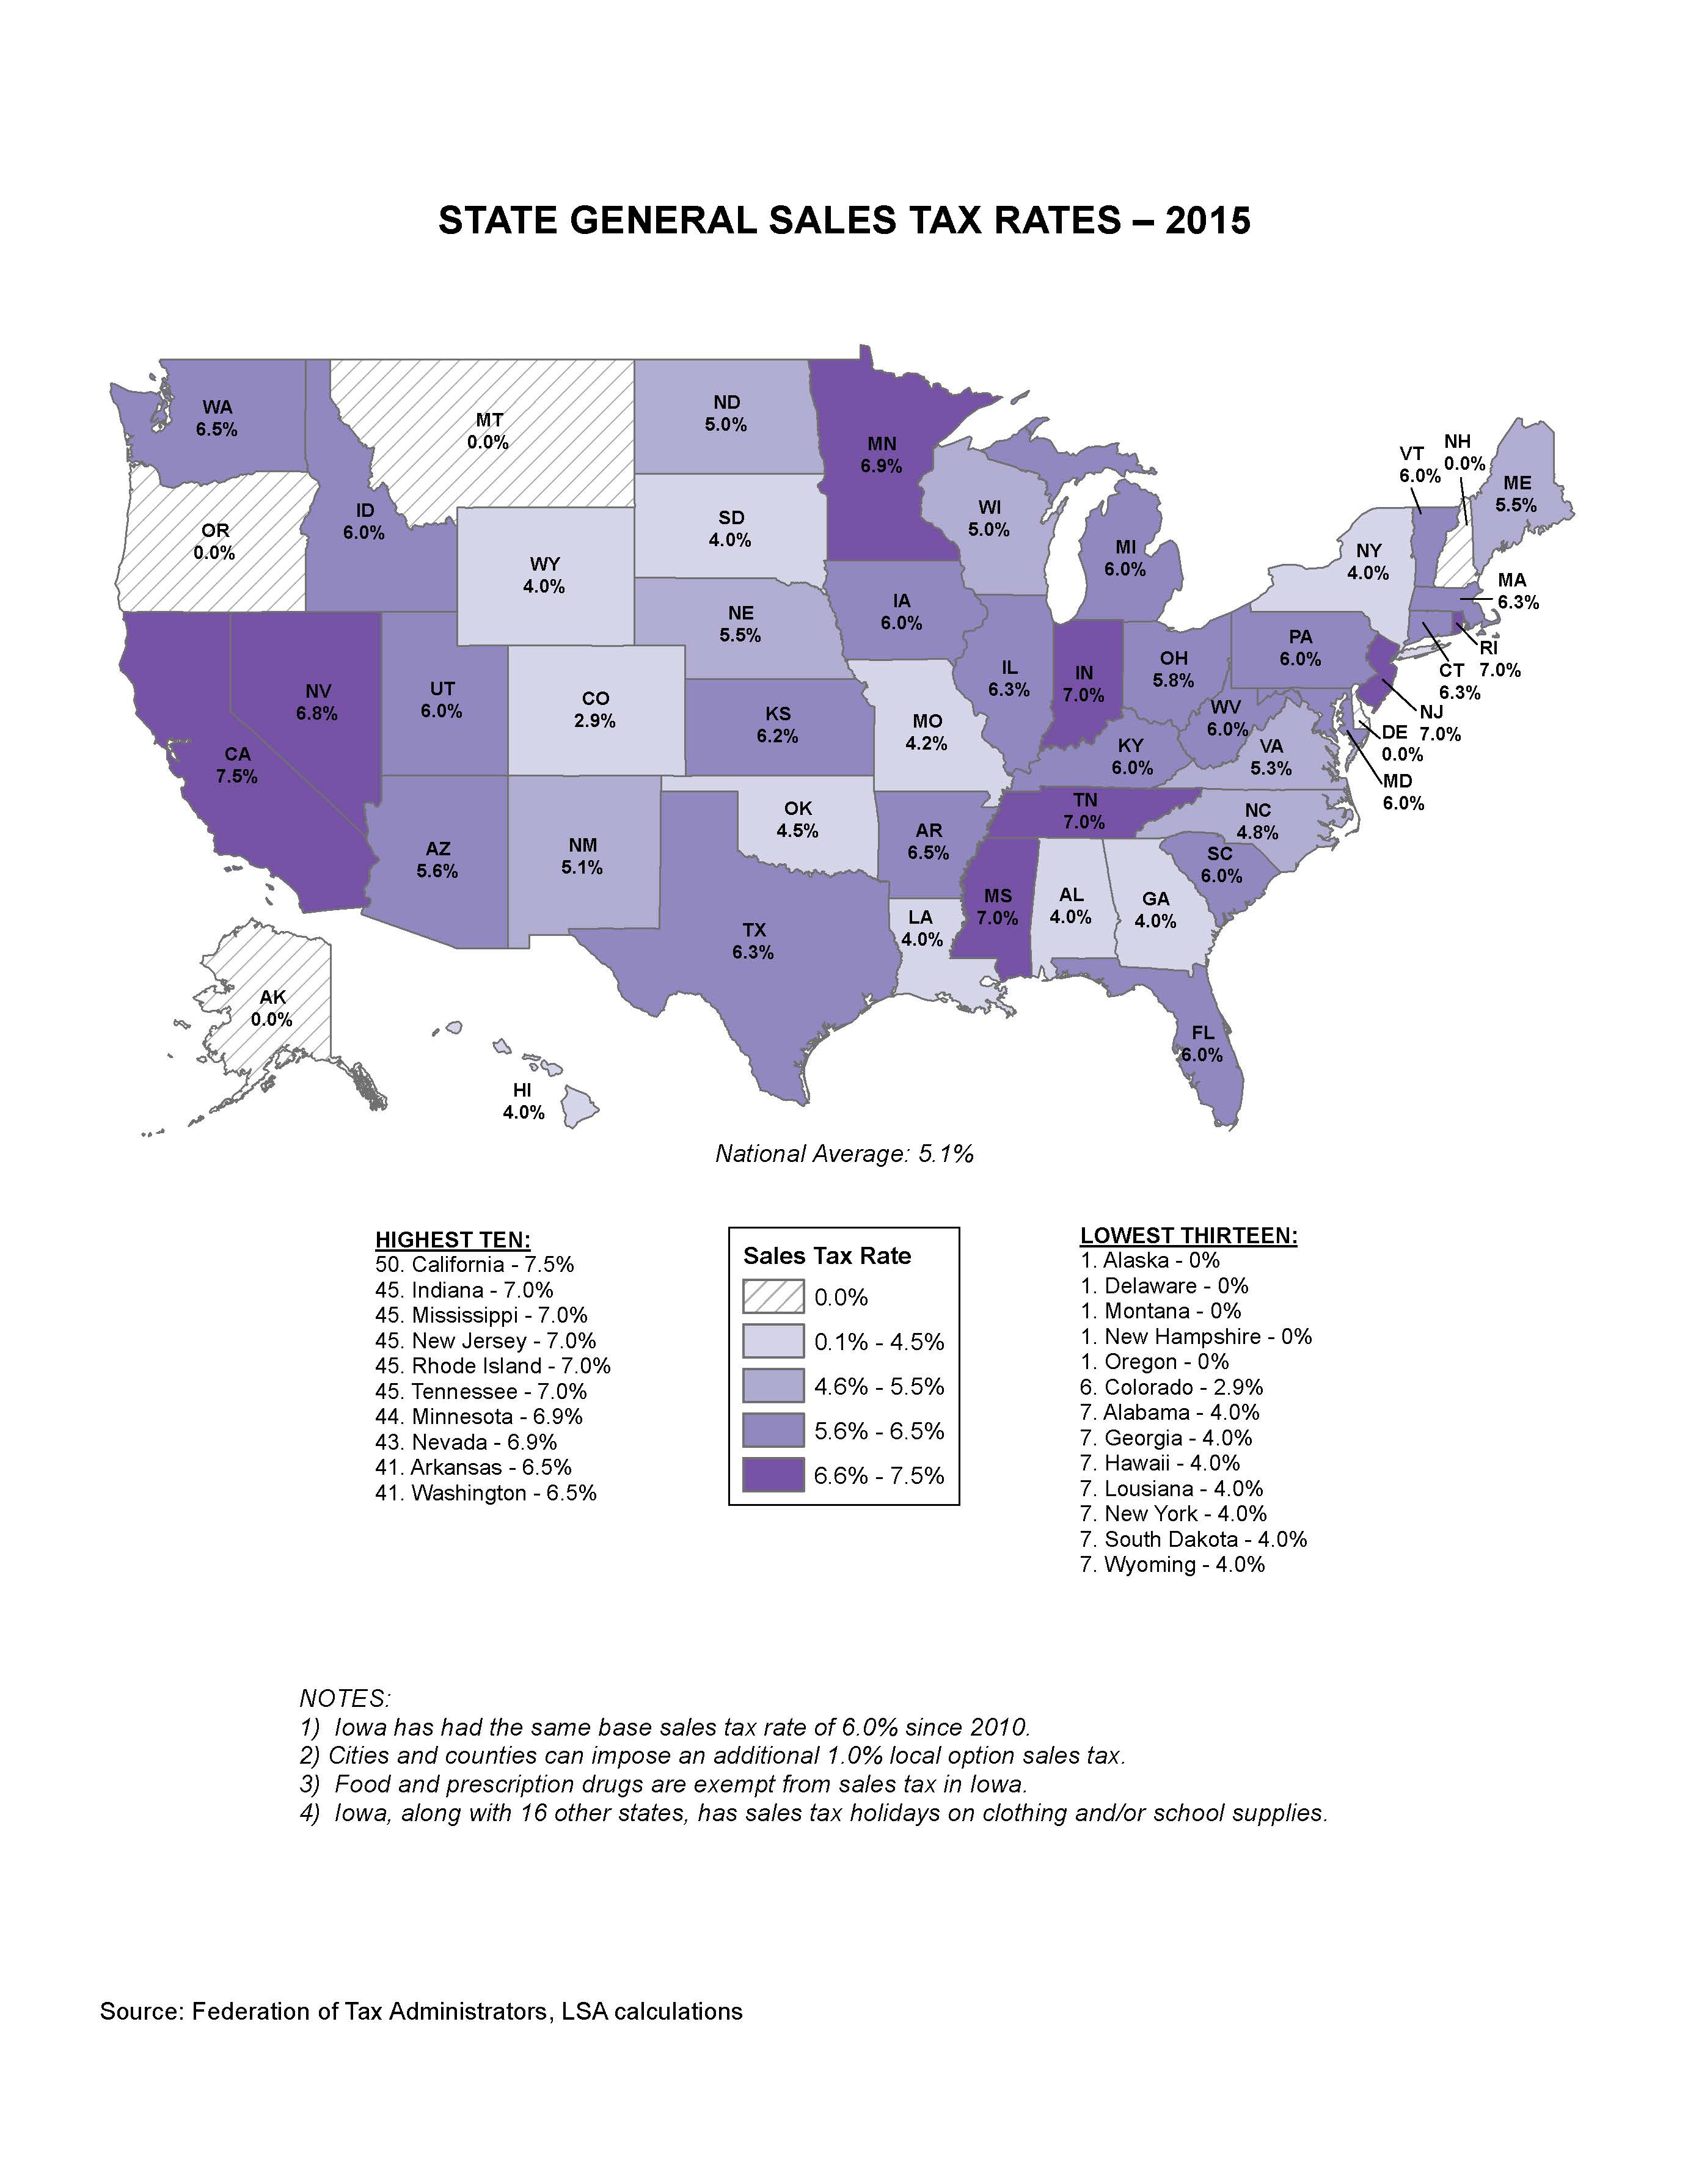
State General Sales Tax Rates - 2015
|
|
|
|
|
| 06/27/2016 |
Iowa Insights |
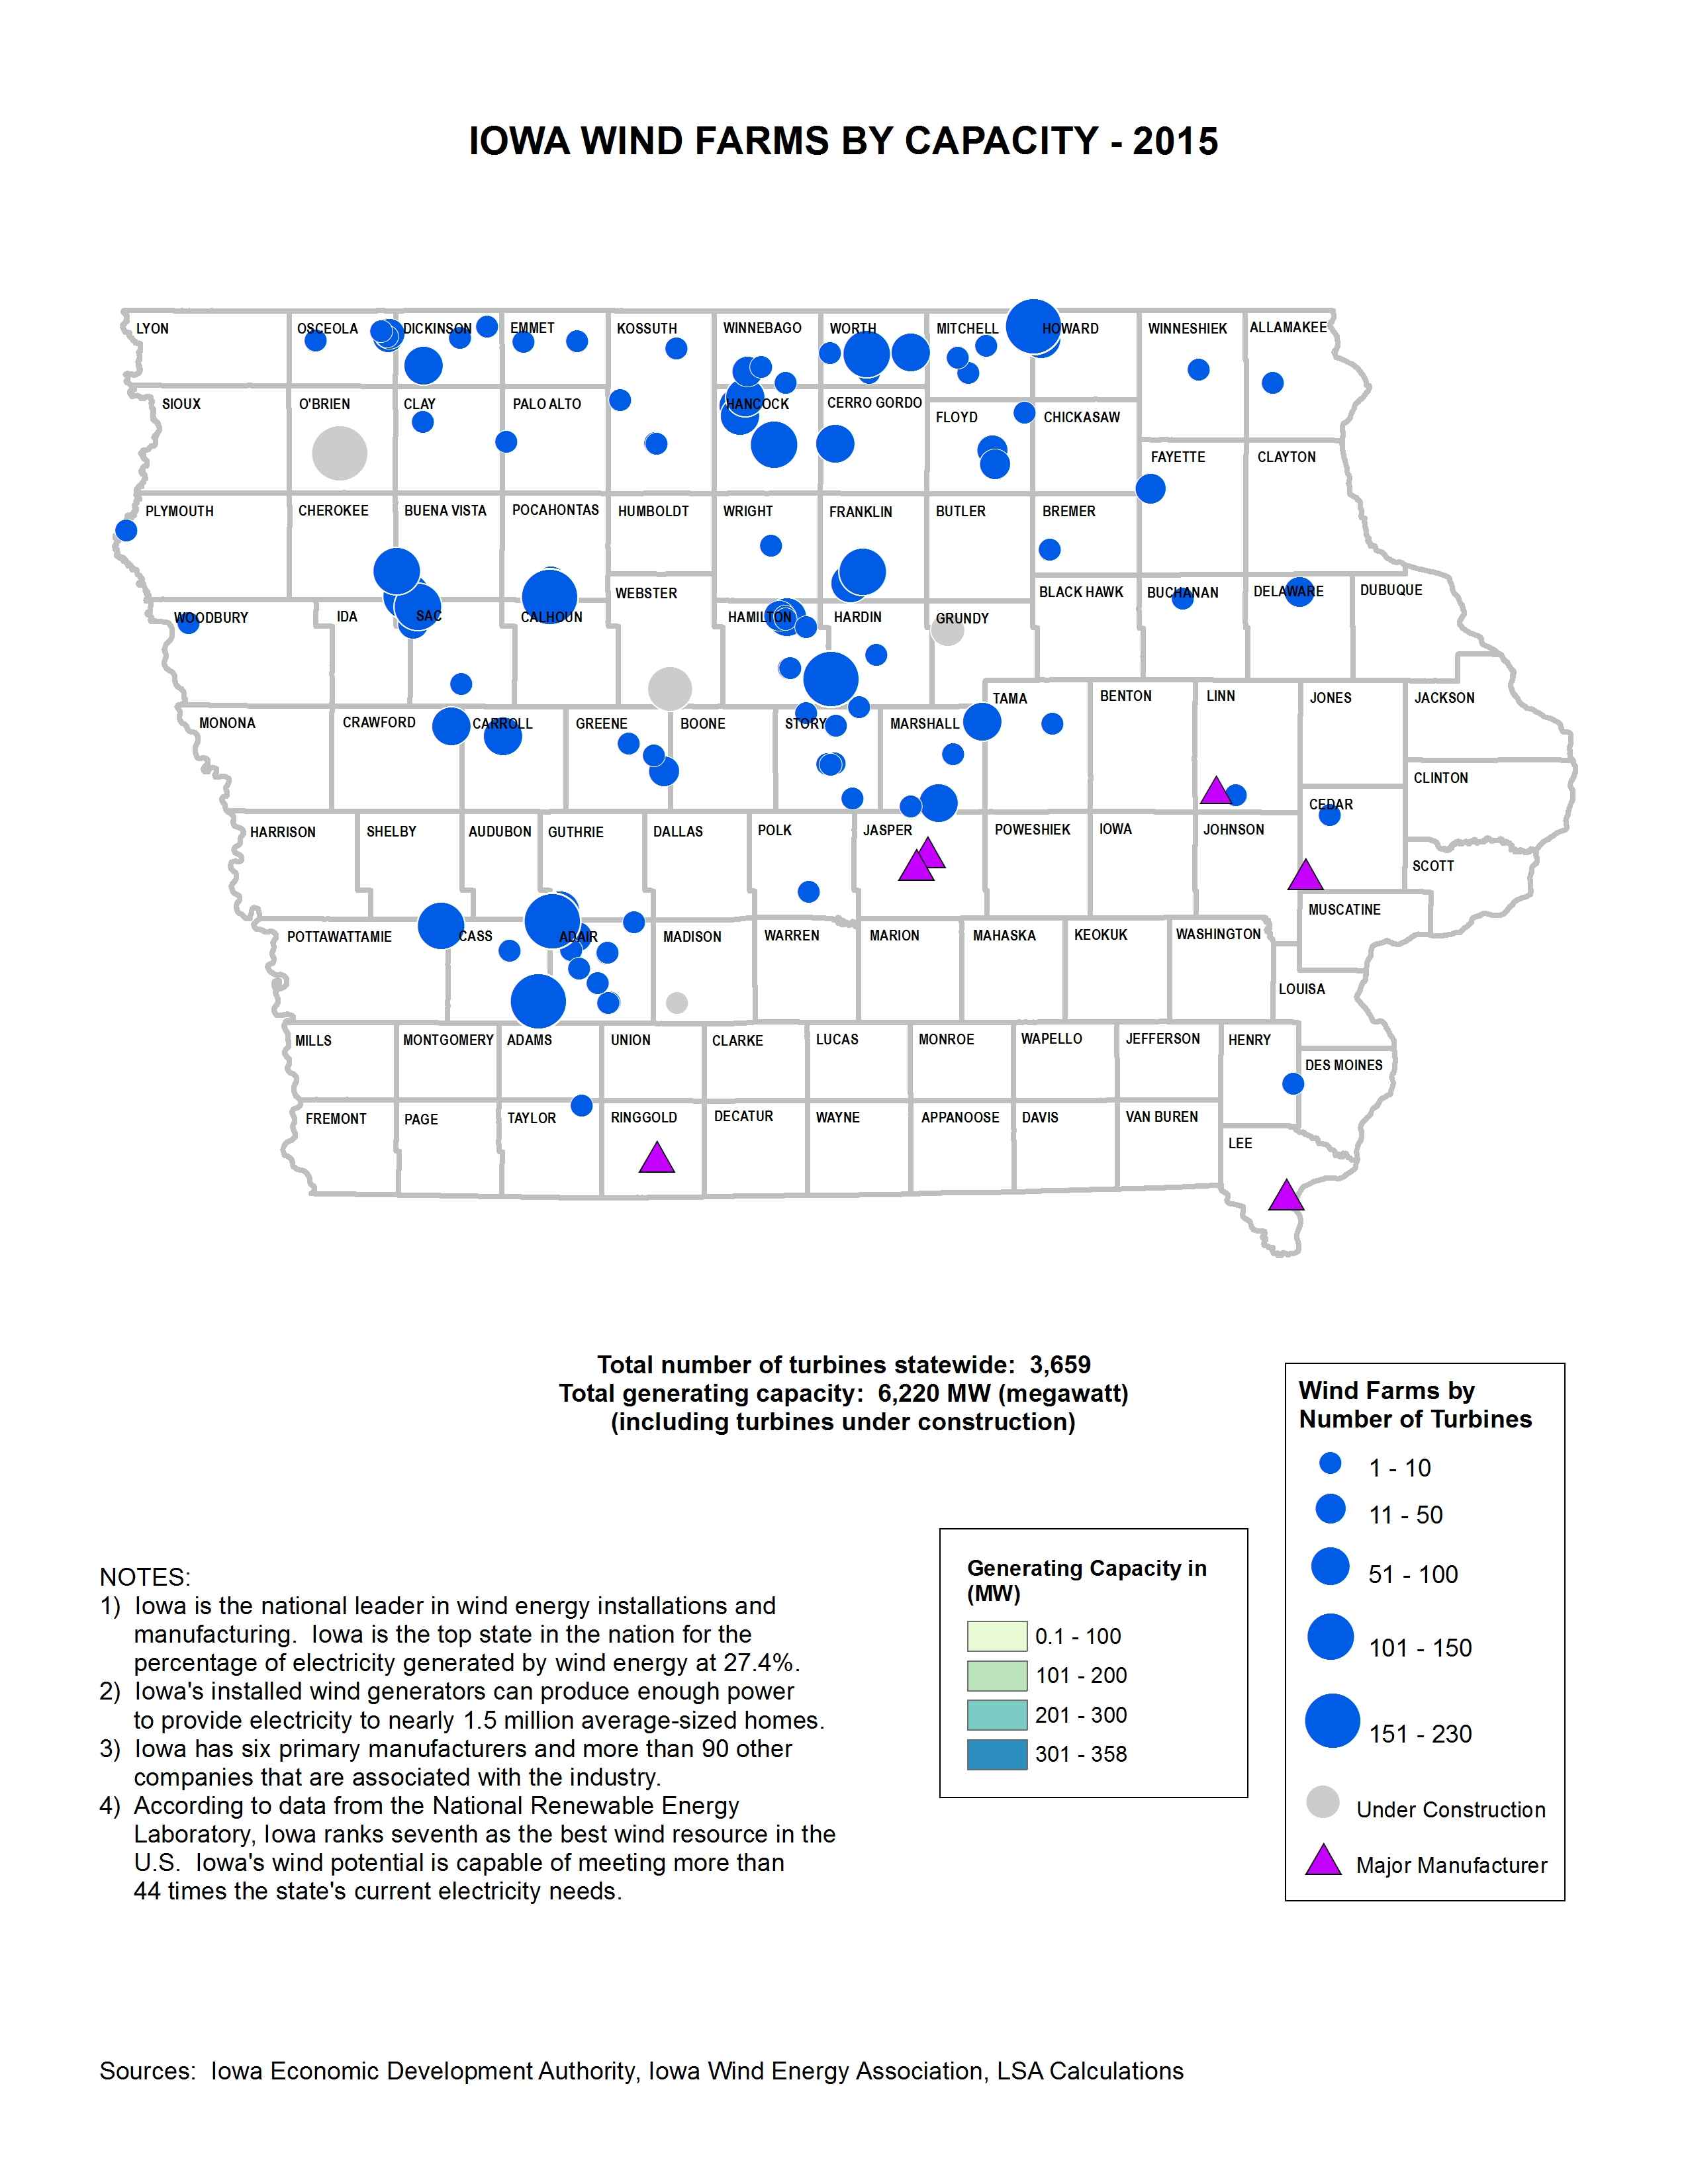
Iowa Wind Farms by Capacity - 2015
|
|
|
|
|
| 06/20/2016 |
Iowa Insights |
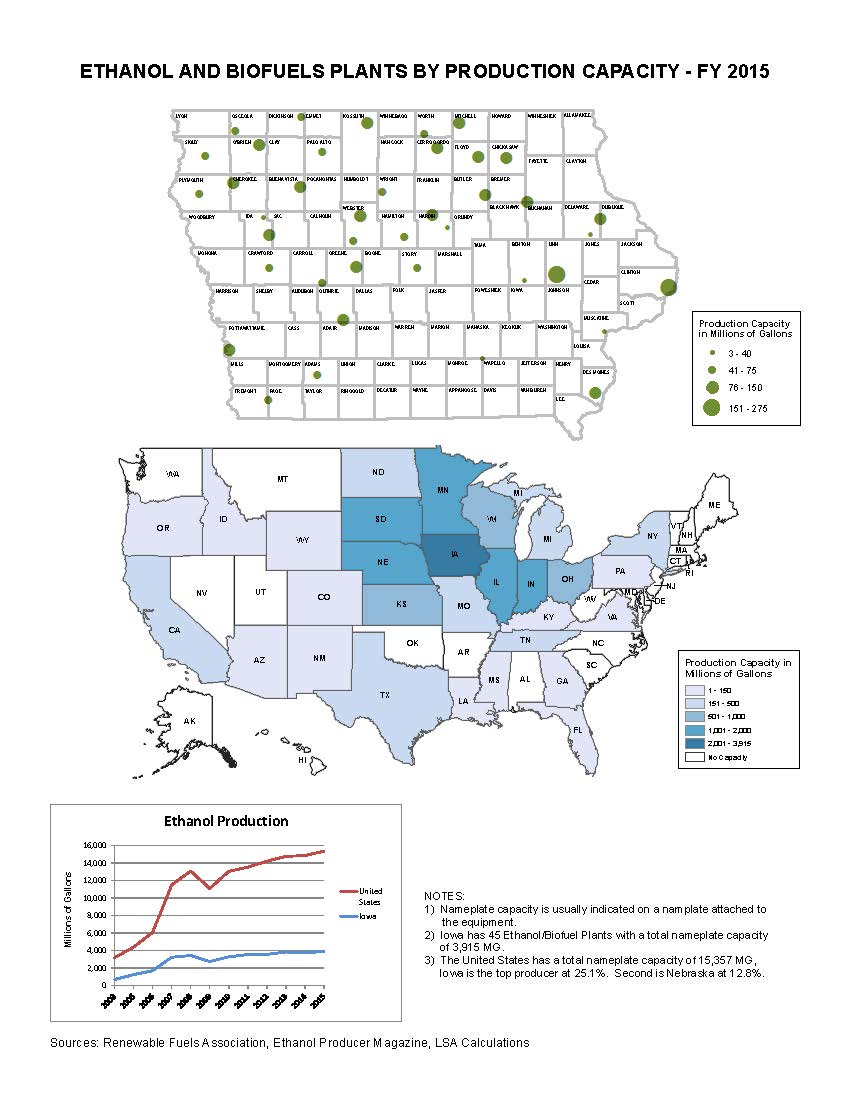
Ethanol and Biofuels Plants by Production Capacity - FY 2015
|
|
|
|
|
| 06/13/2016 |
Iowa Insights |
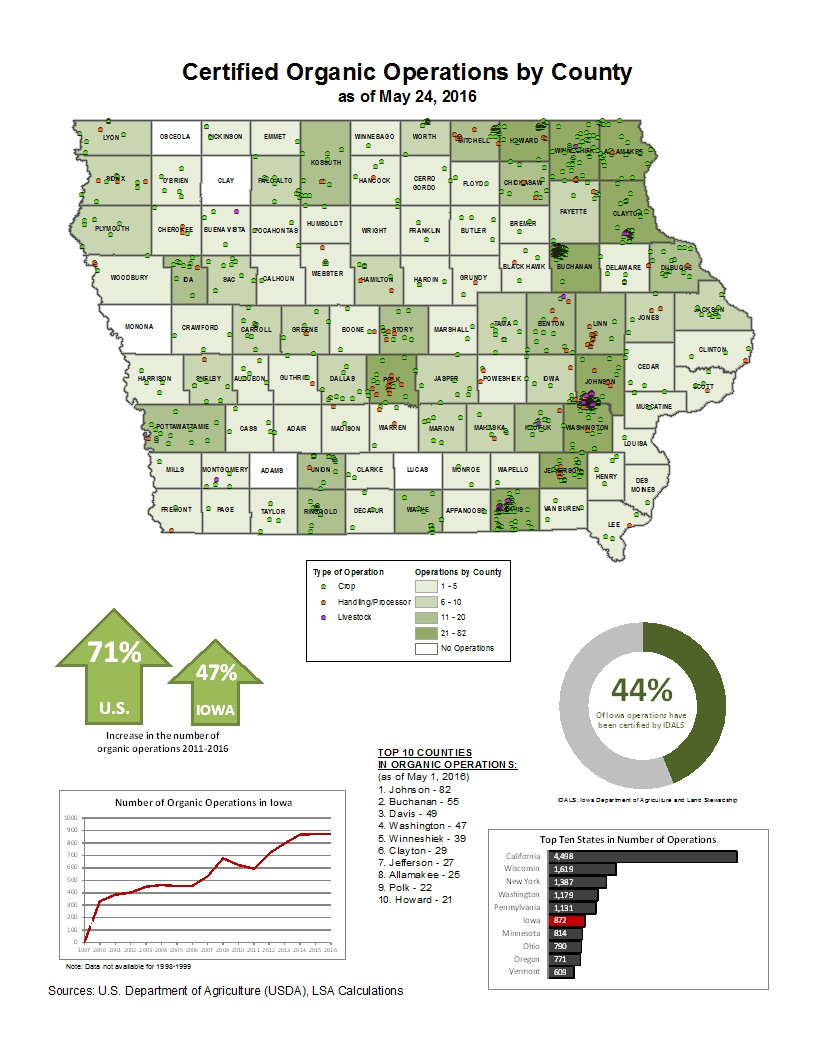
Certified Organic Operations by County - May 24, 2016
|
|
|
|
|
| 06/06/2016 |
Iowa Insights |
Resource Enhancement and Protection (REAP) Funding by County FY 1989-2015

|
|
|
|
|
| 05/31/2016 |
Iowa Insights |
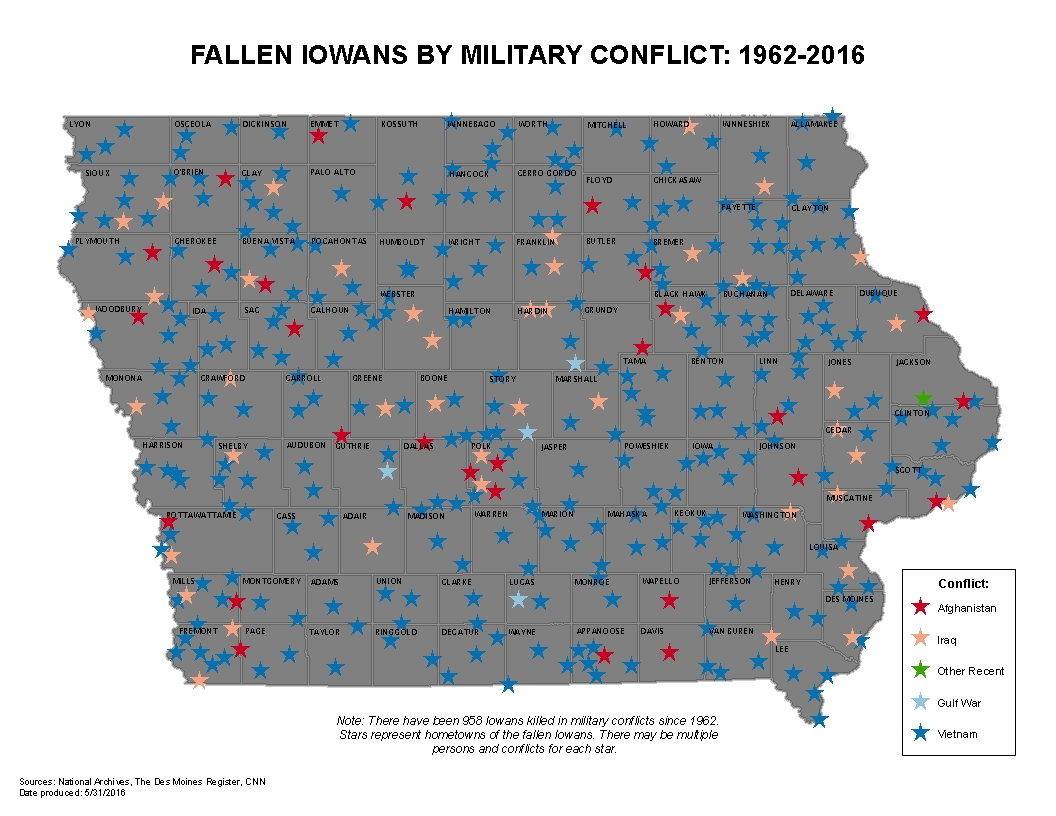
Fallen Iowans By Military Conflict: 1962-2016
|
|
|
|
|
| 05/23/2016 |
Iowa Insights |
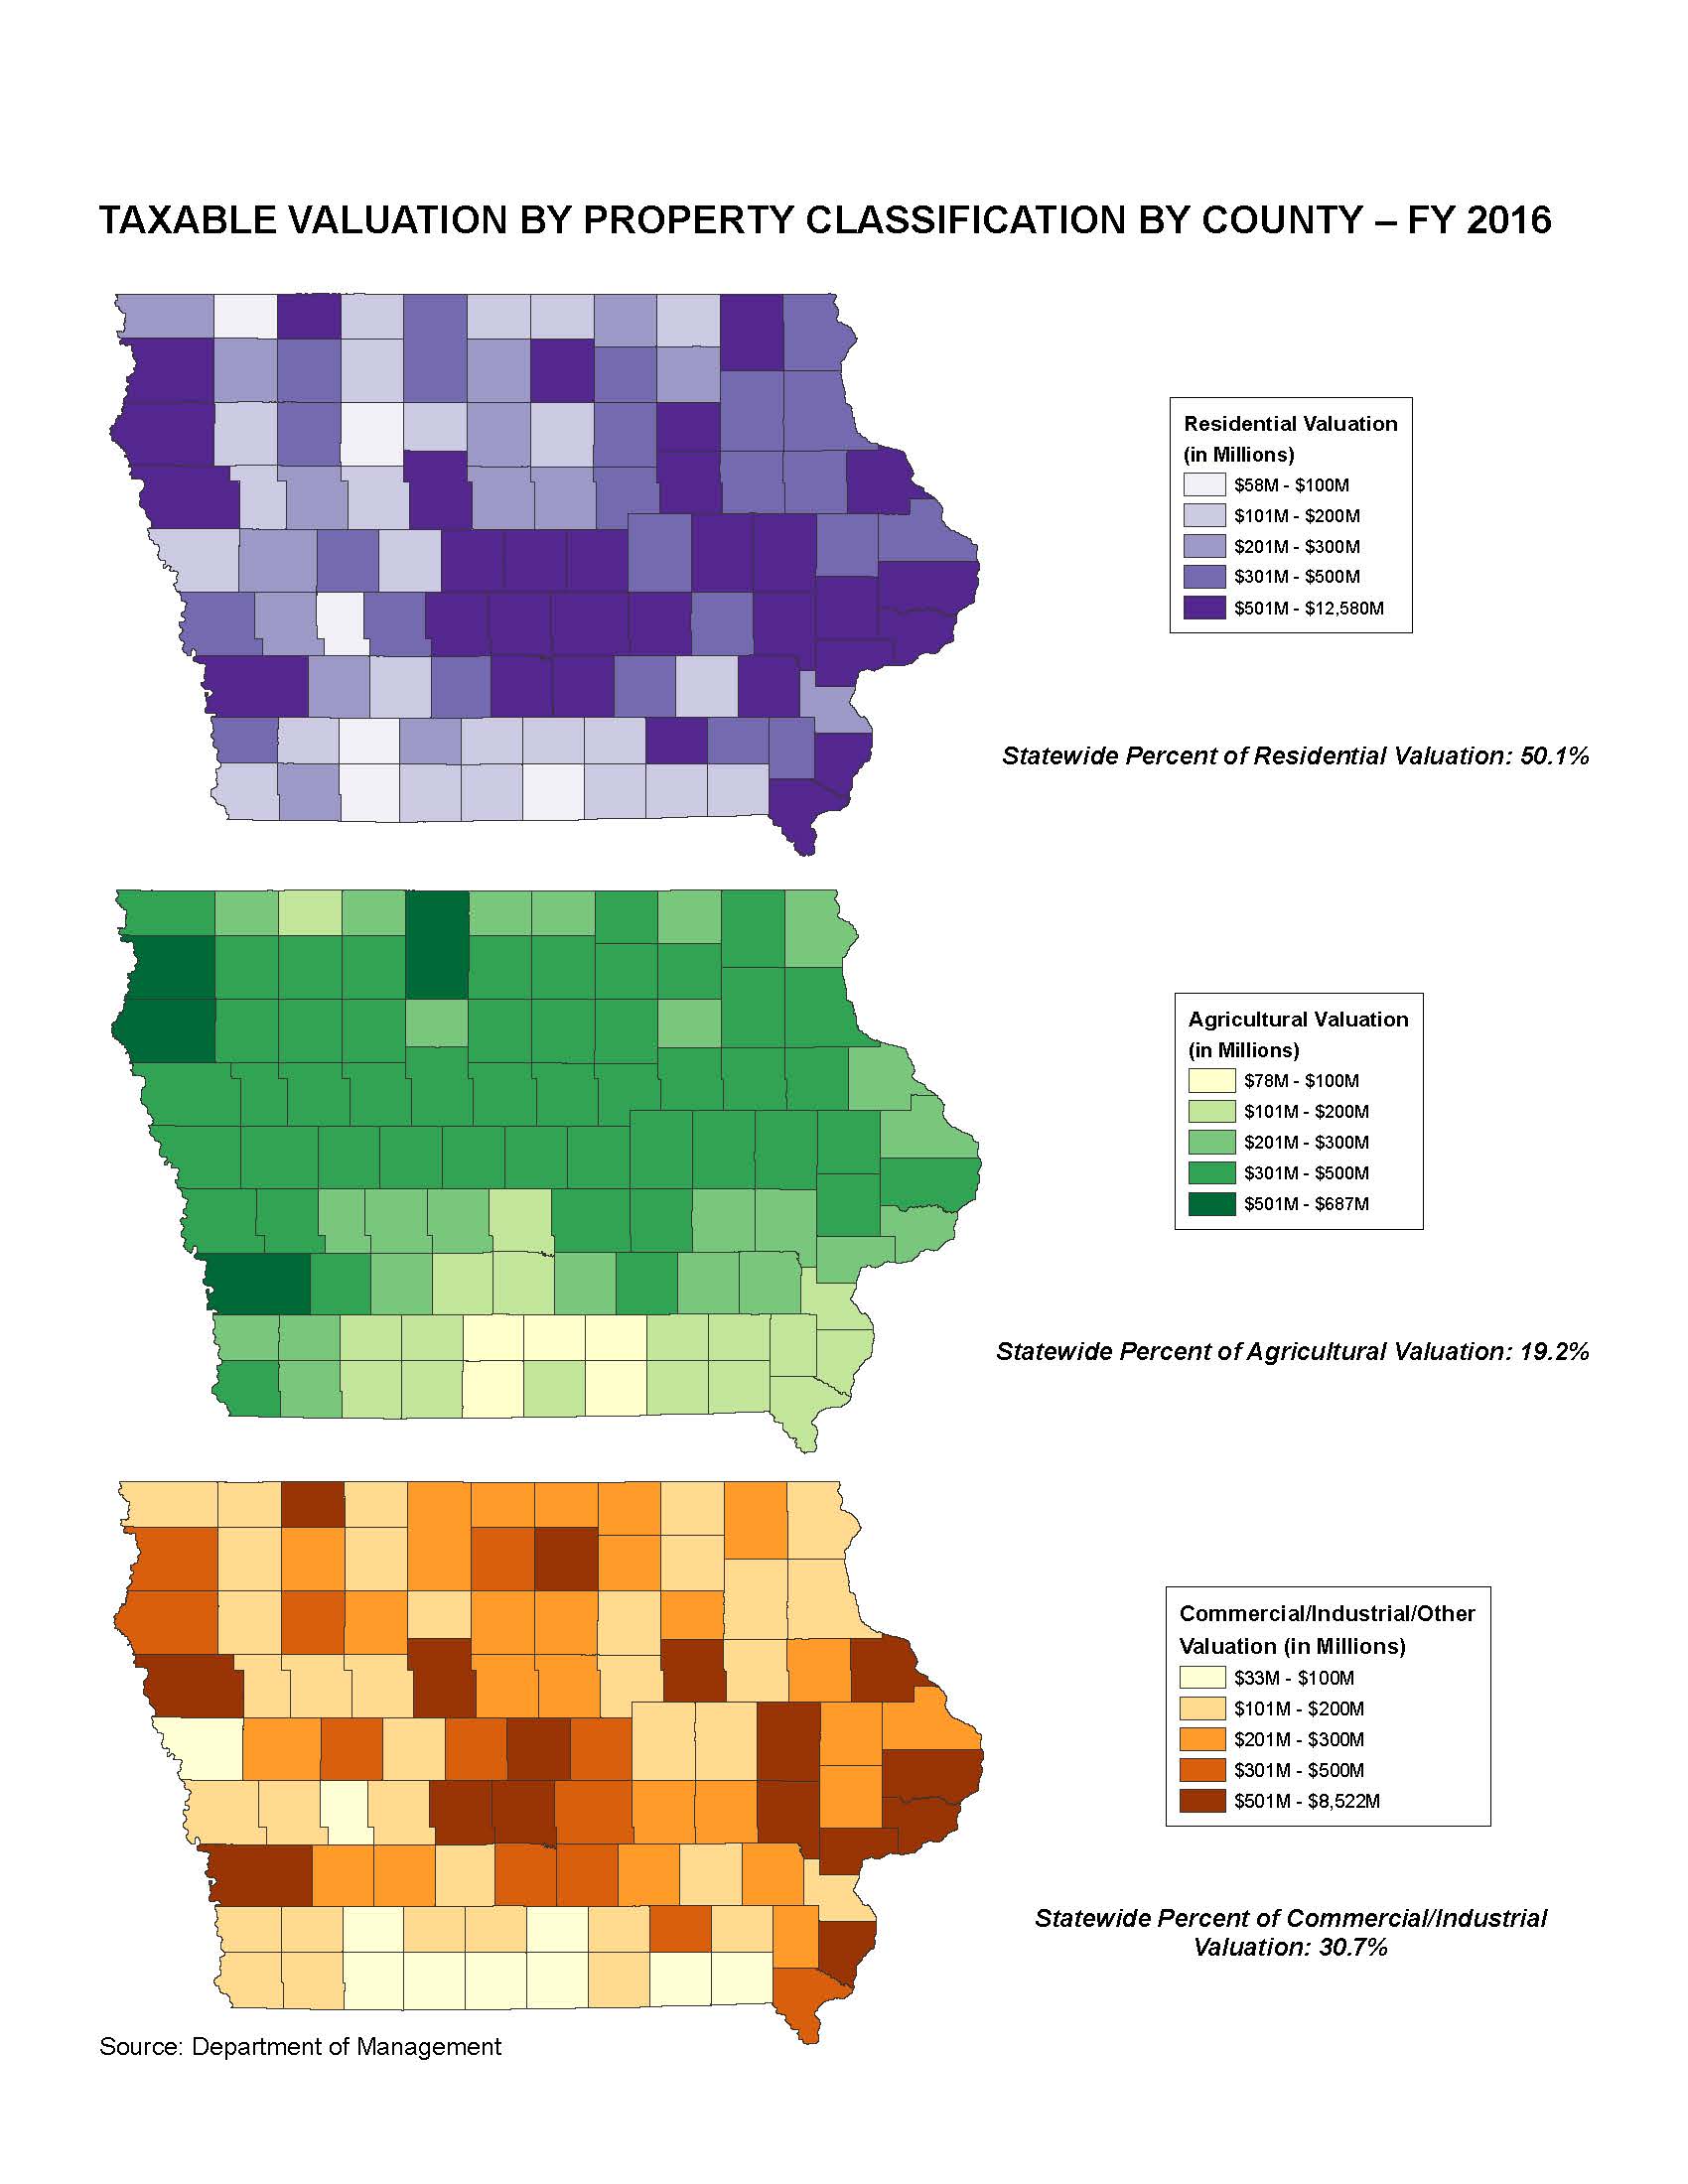
Taxable Valuation by Property Classification by County - FY 2016
|
|
|
|
|
| 05/16/2016 |
Iowa Insights |
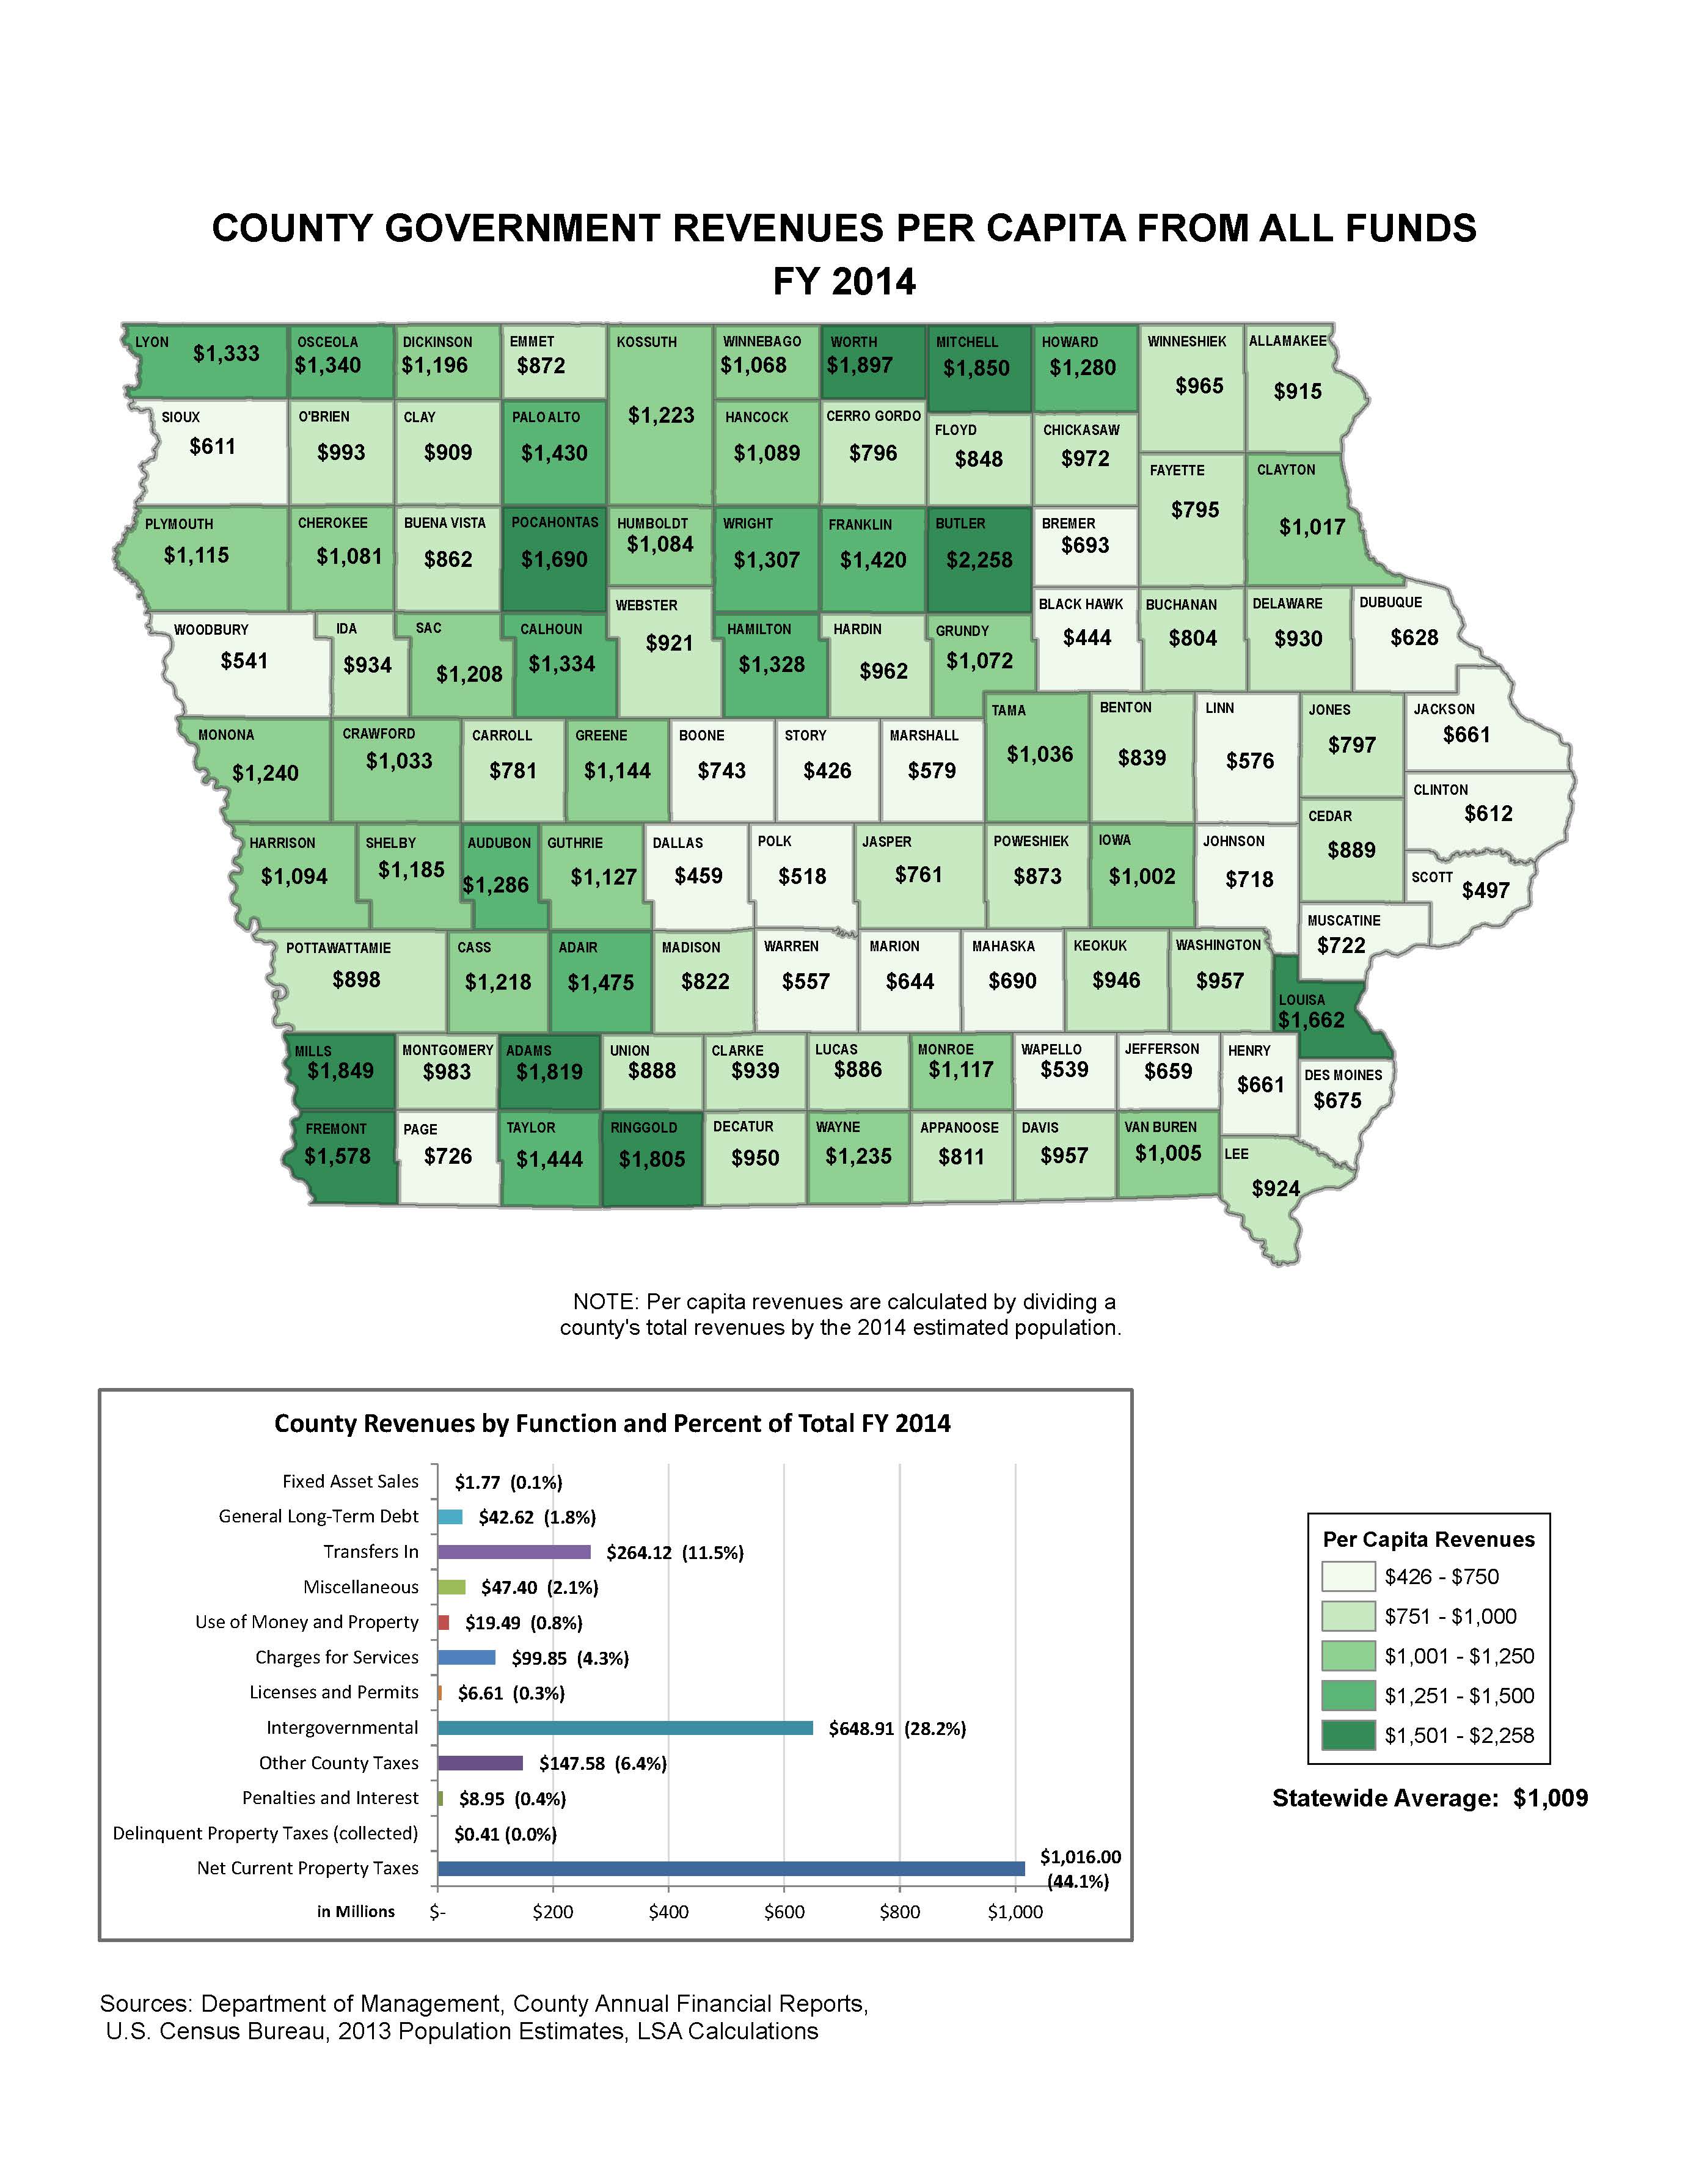
County Government Revenues Per Capita - FY 2014
|
|
|
|
|
| 05/09/2016 |
Iowa Insights |
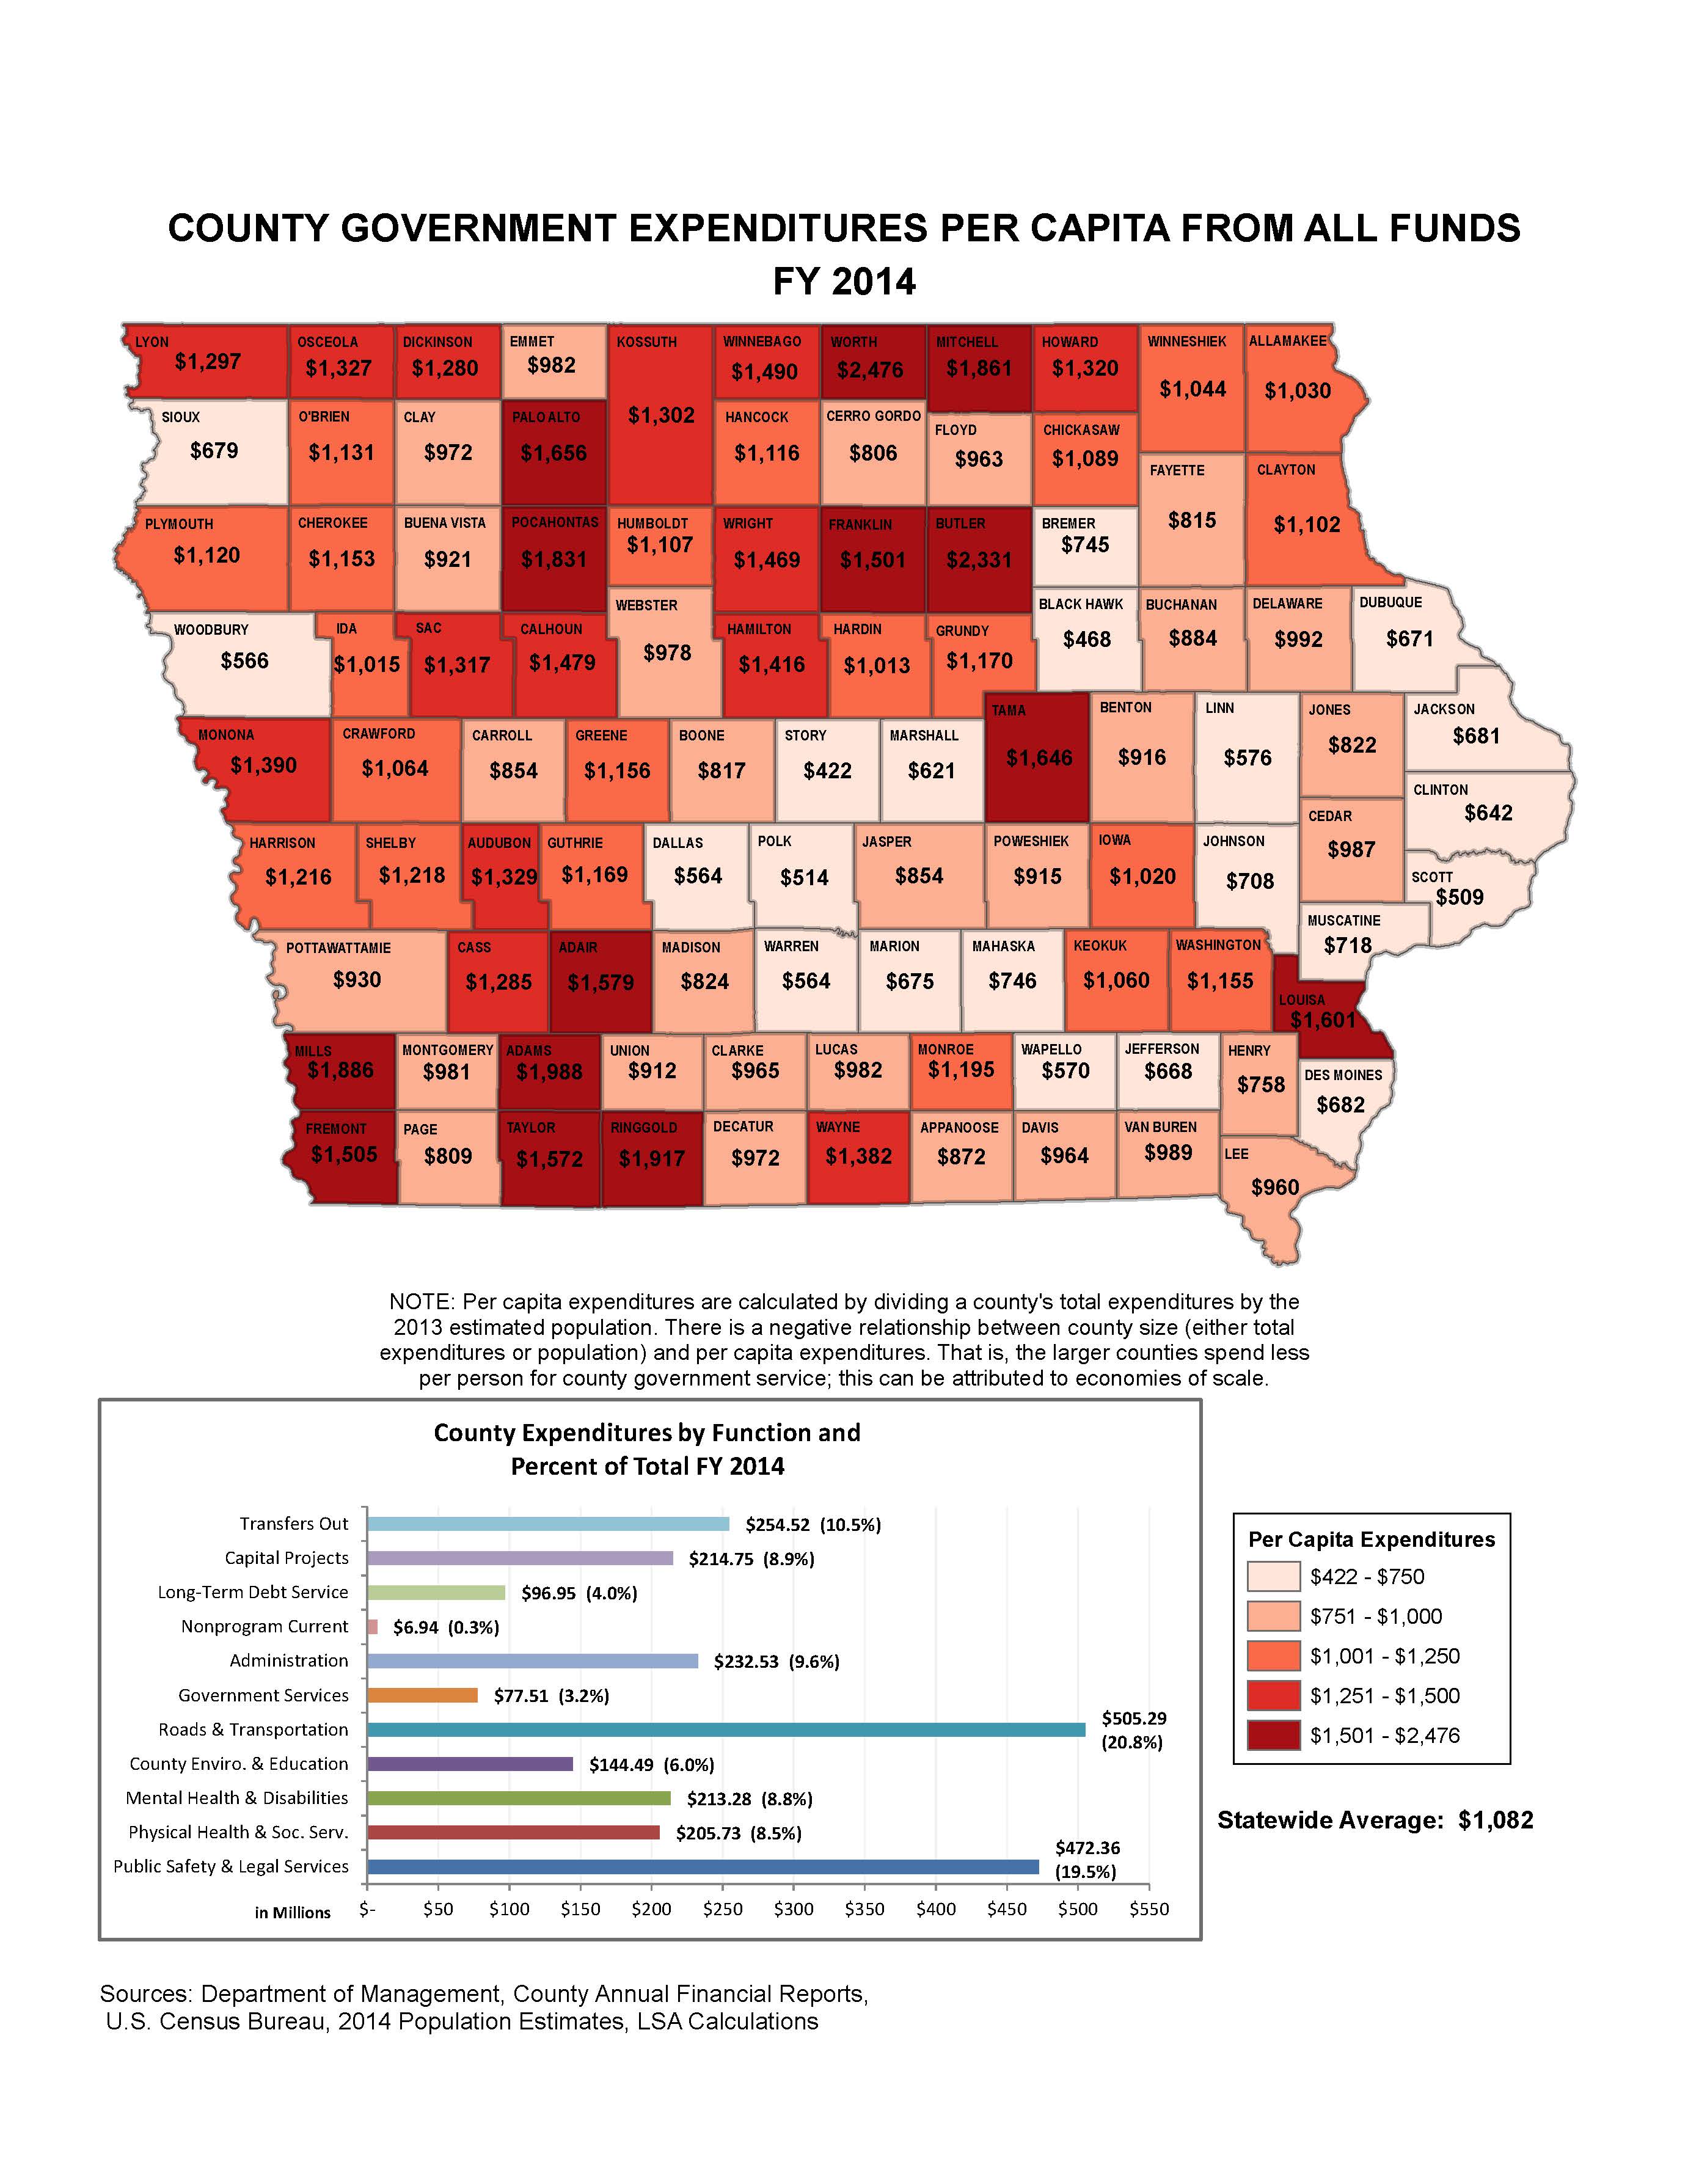
County Government Expenditures Per Capita - FY 2014
|
|
|
|
|
| 05/02/2016 |
Iowa Insights |
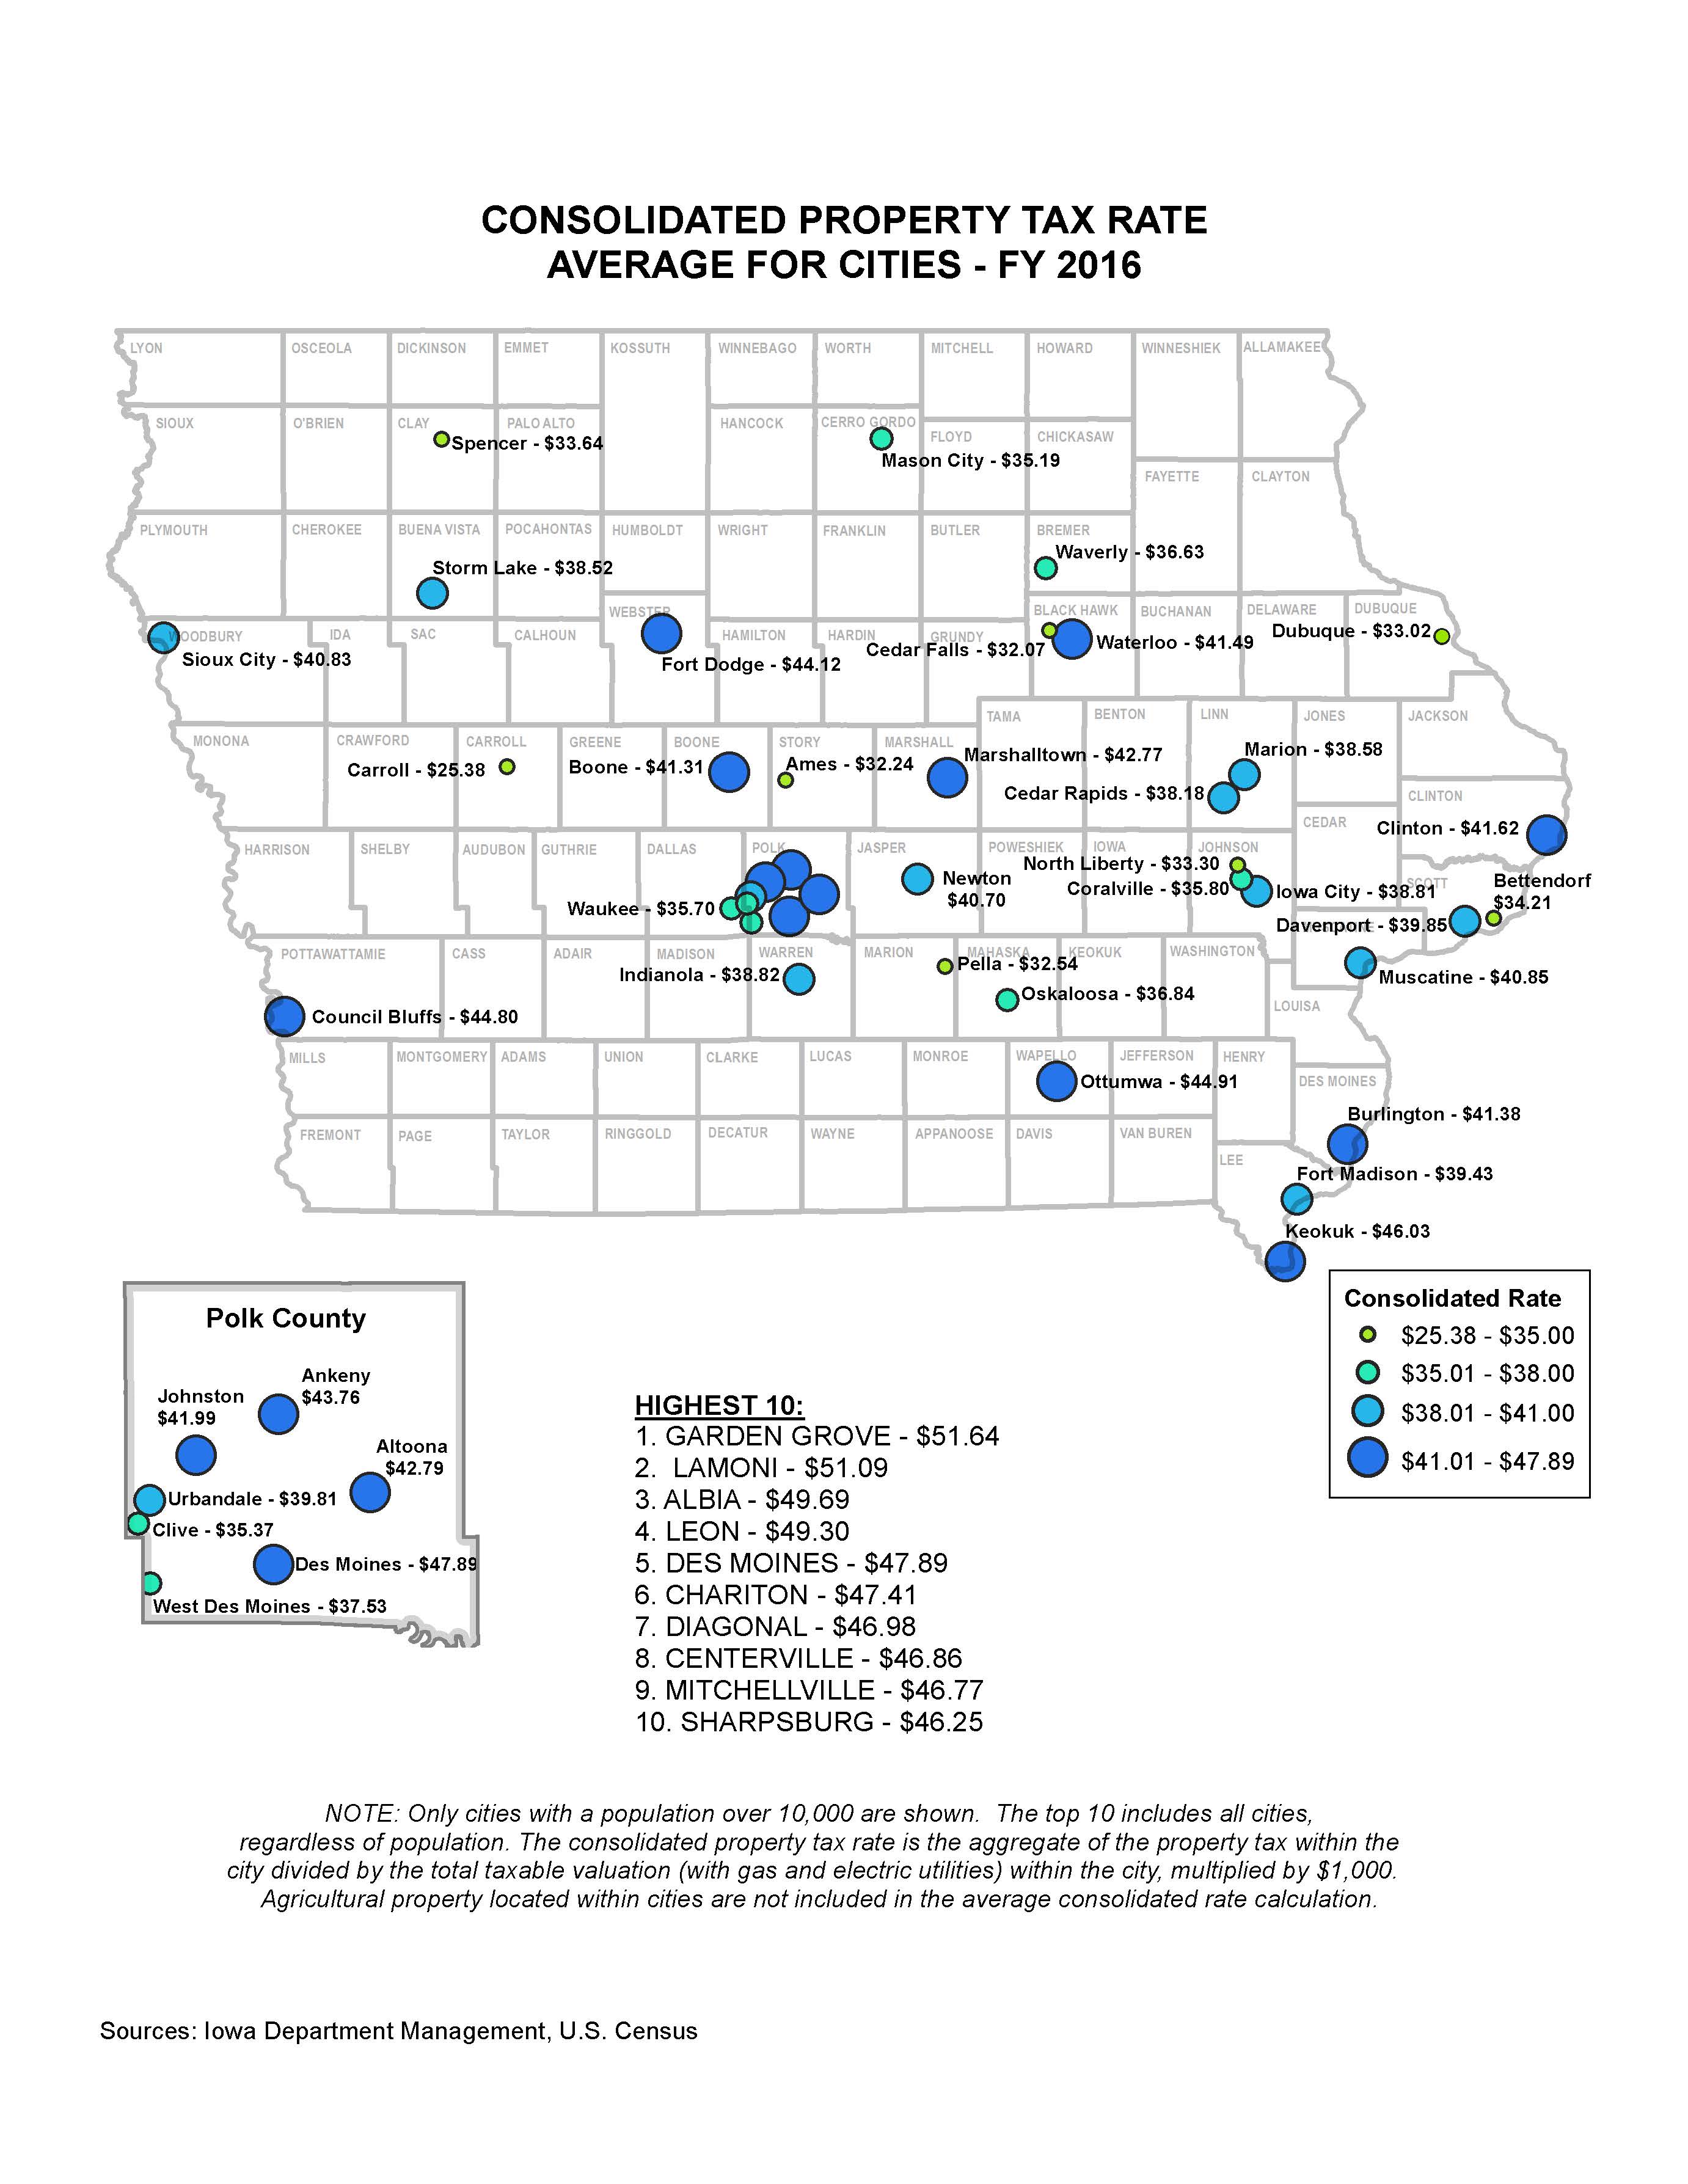
Consolidated Property Tax Rate Average for Cities - FY 2016
|
|
|
|
|
| 04/25/2016 |
Iowa Insights |
Iowa Water Quality Initiative (WQI) Projects - 2013-2106

|
|
|
|
|
| 04/18/2016 |
Iowa Insights |
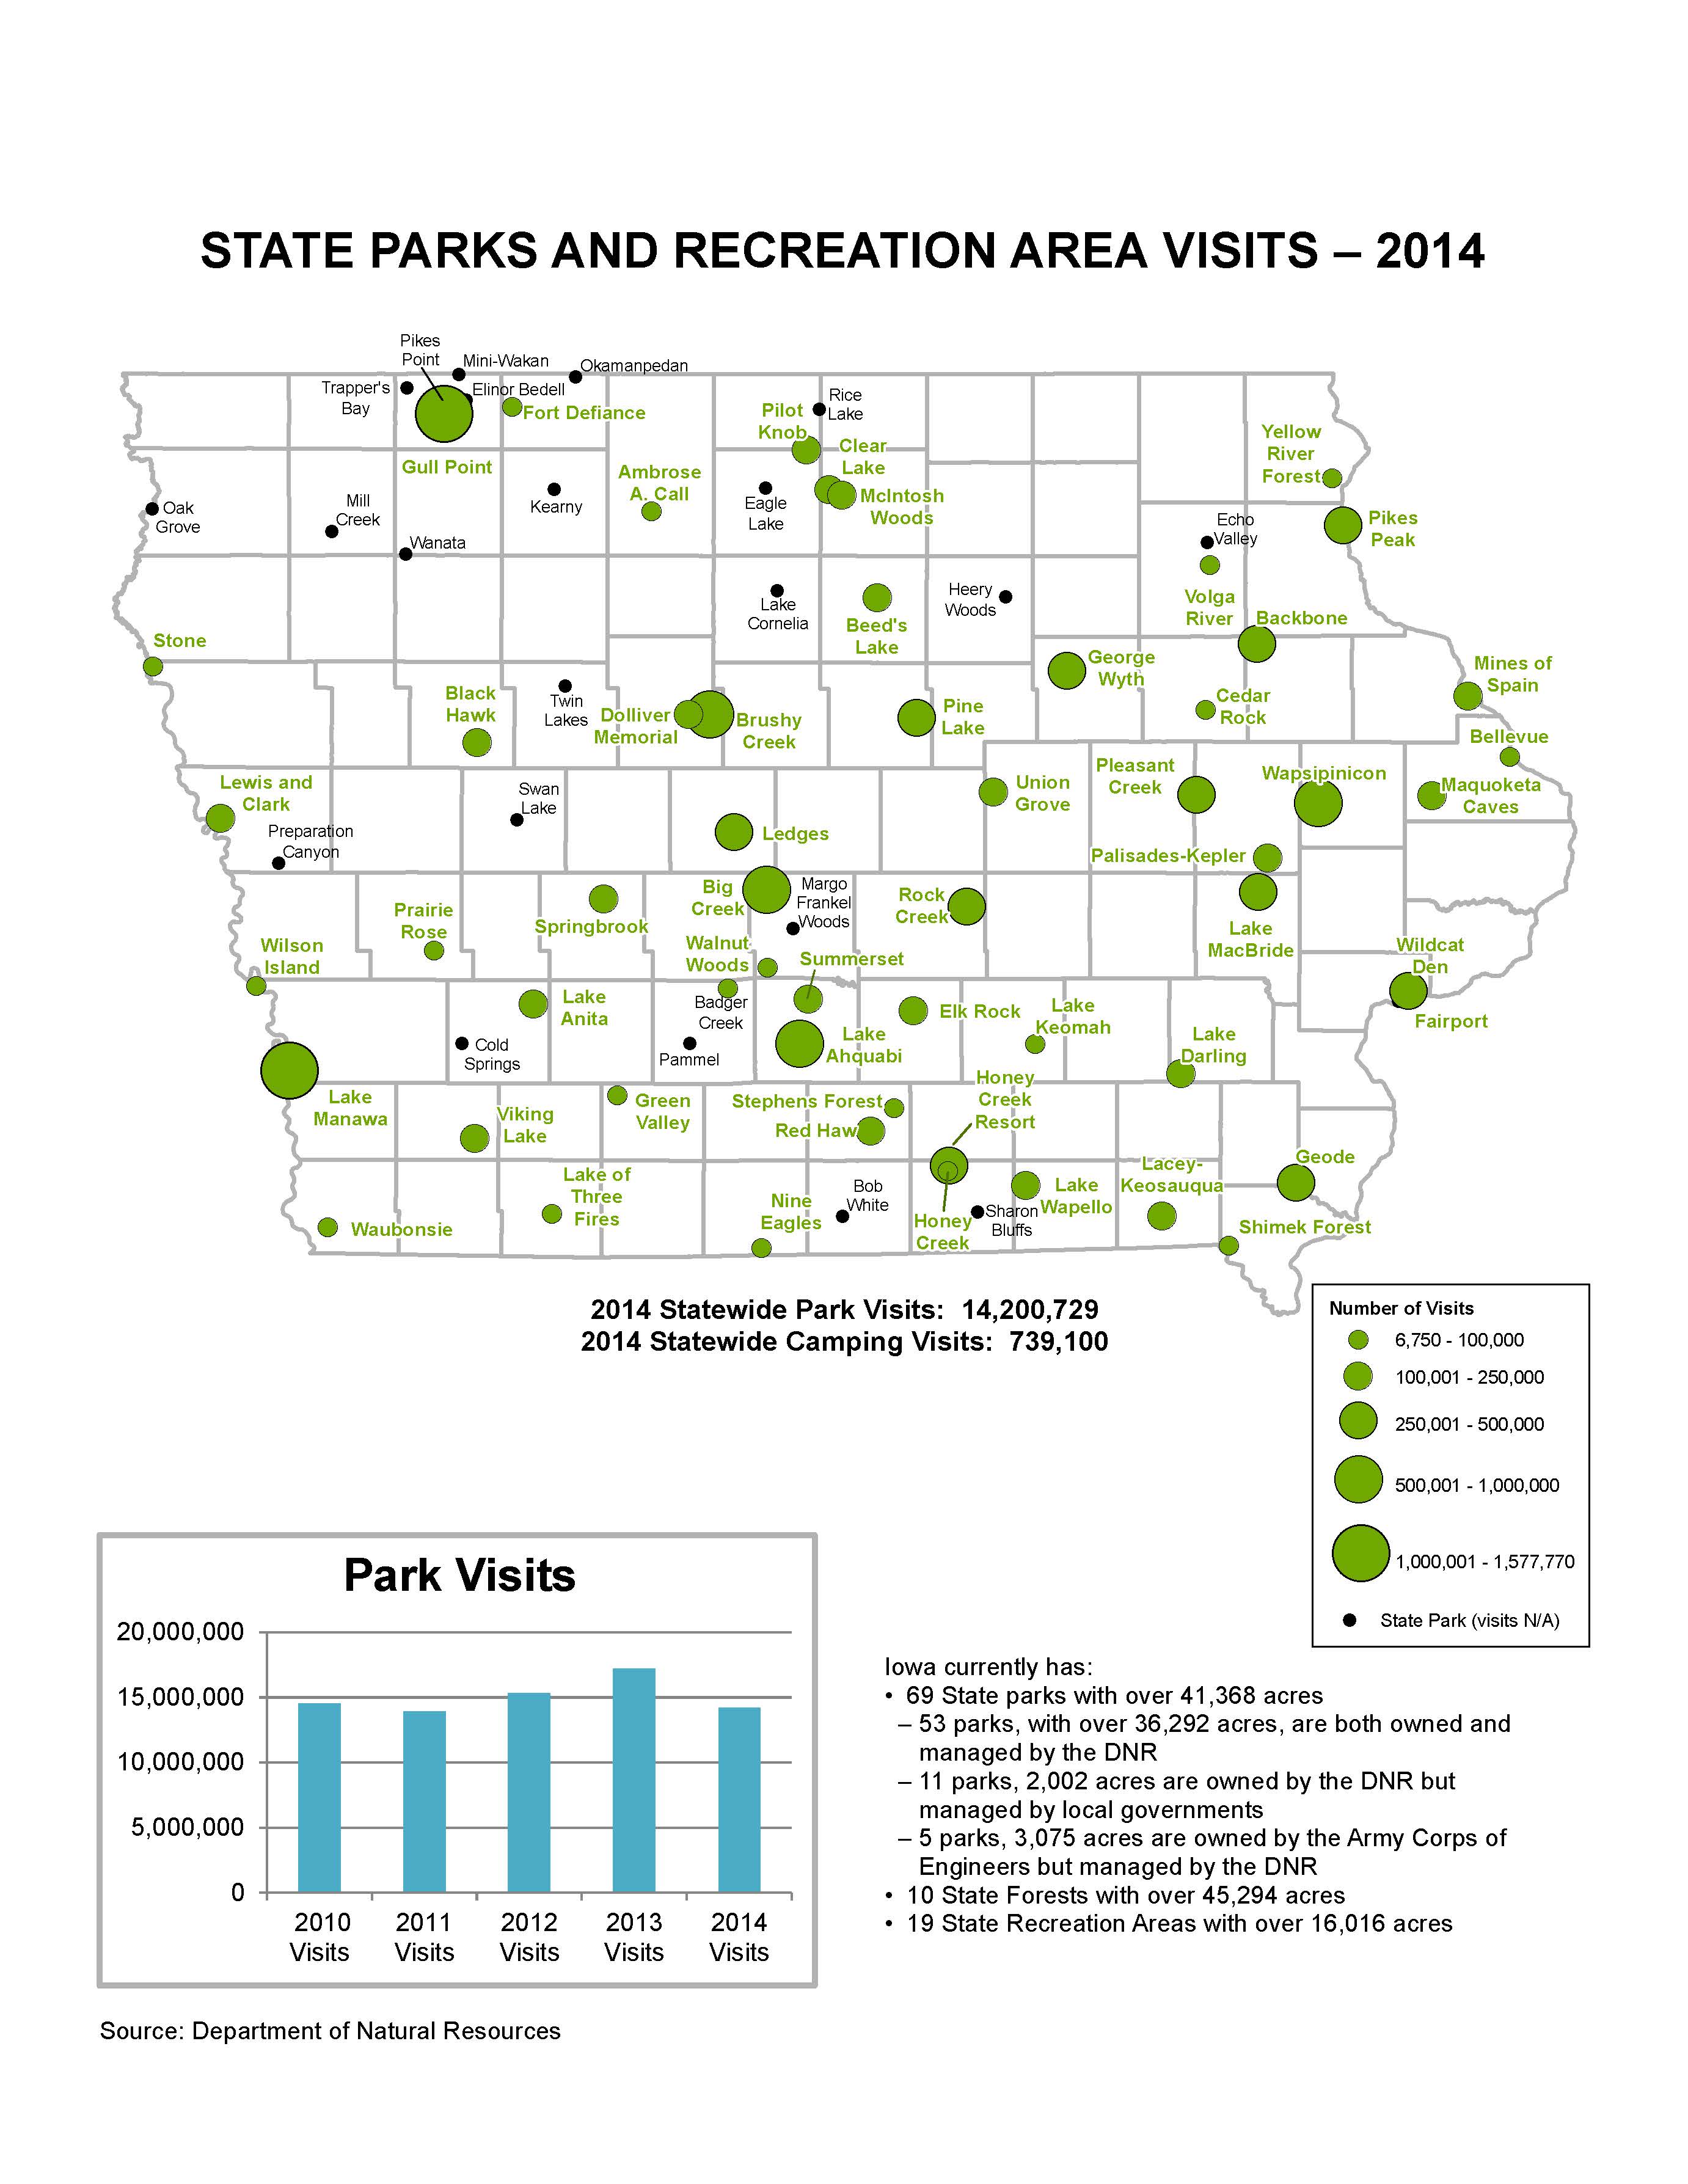
State Parks and Recreation Area Visits - 2014
|
|
|
|
|
| 04/11/2016 |
Iowa Insights |
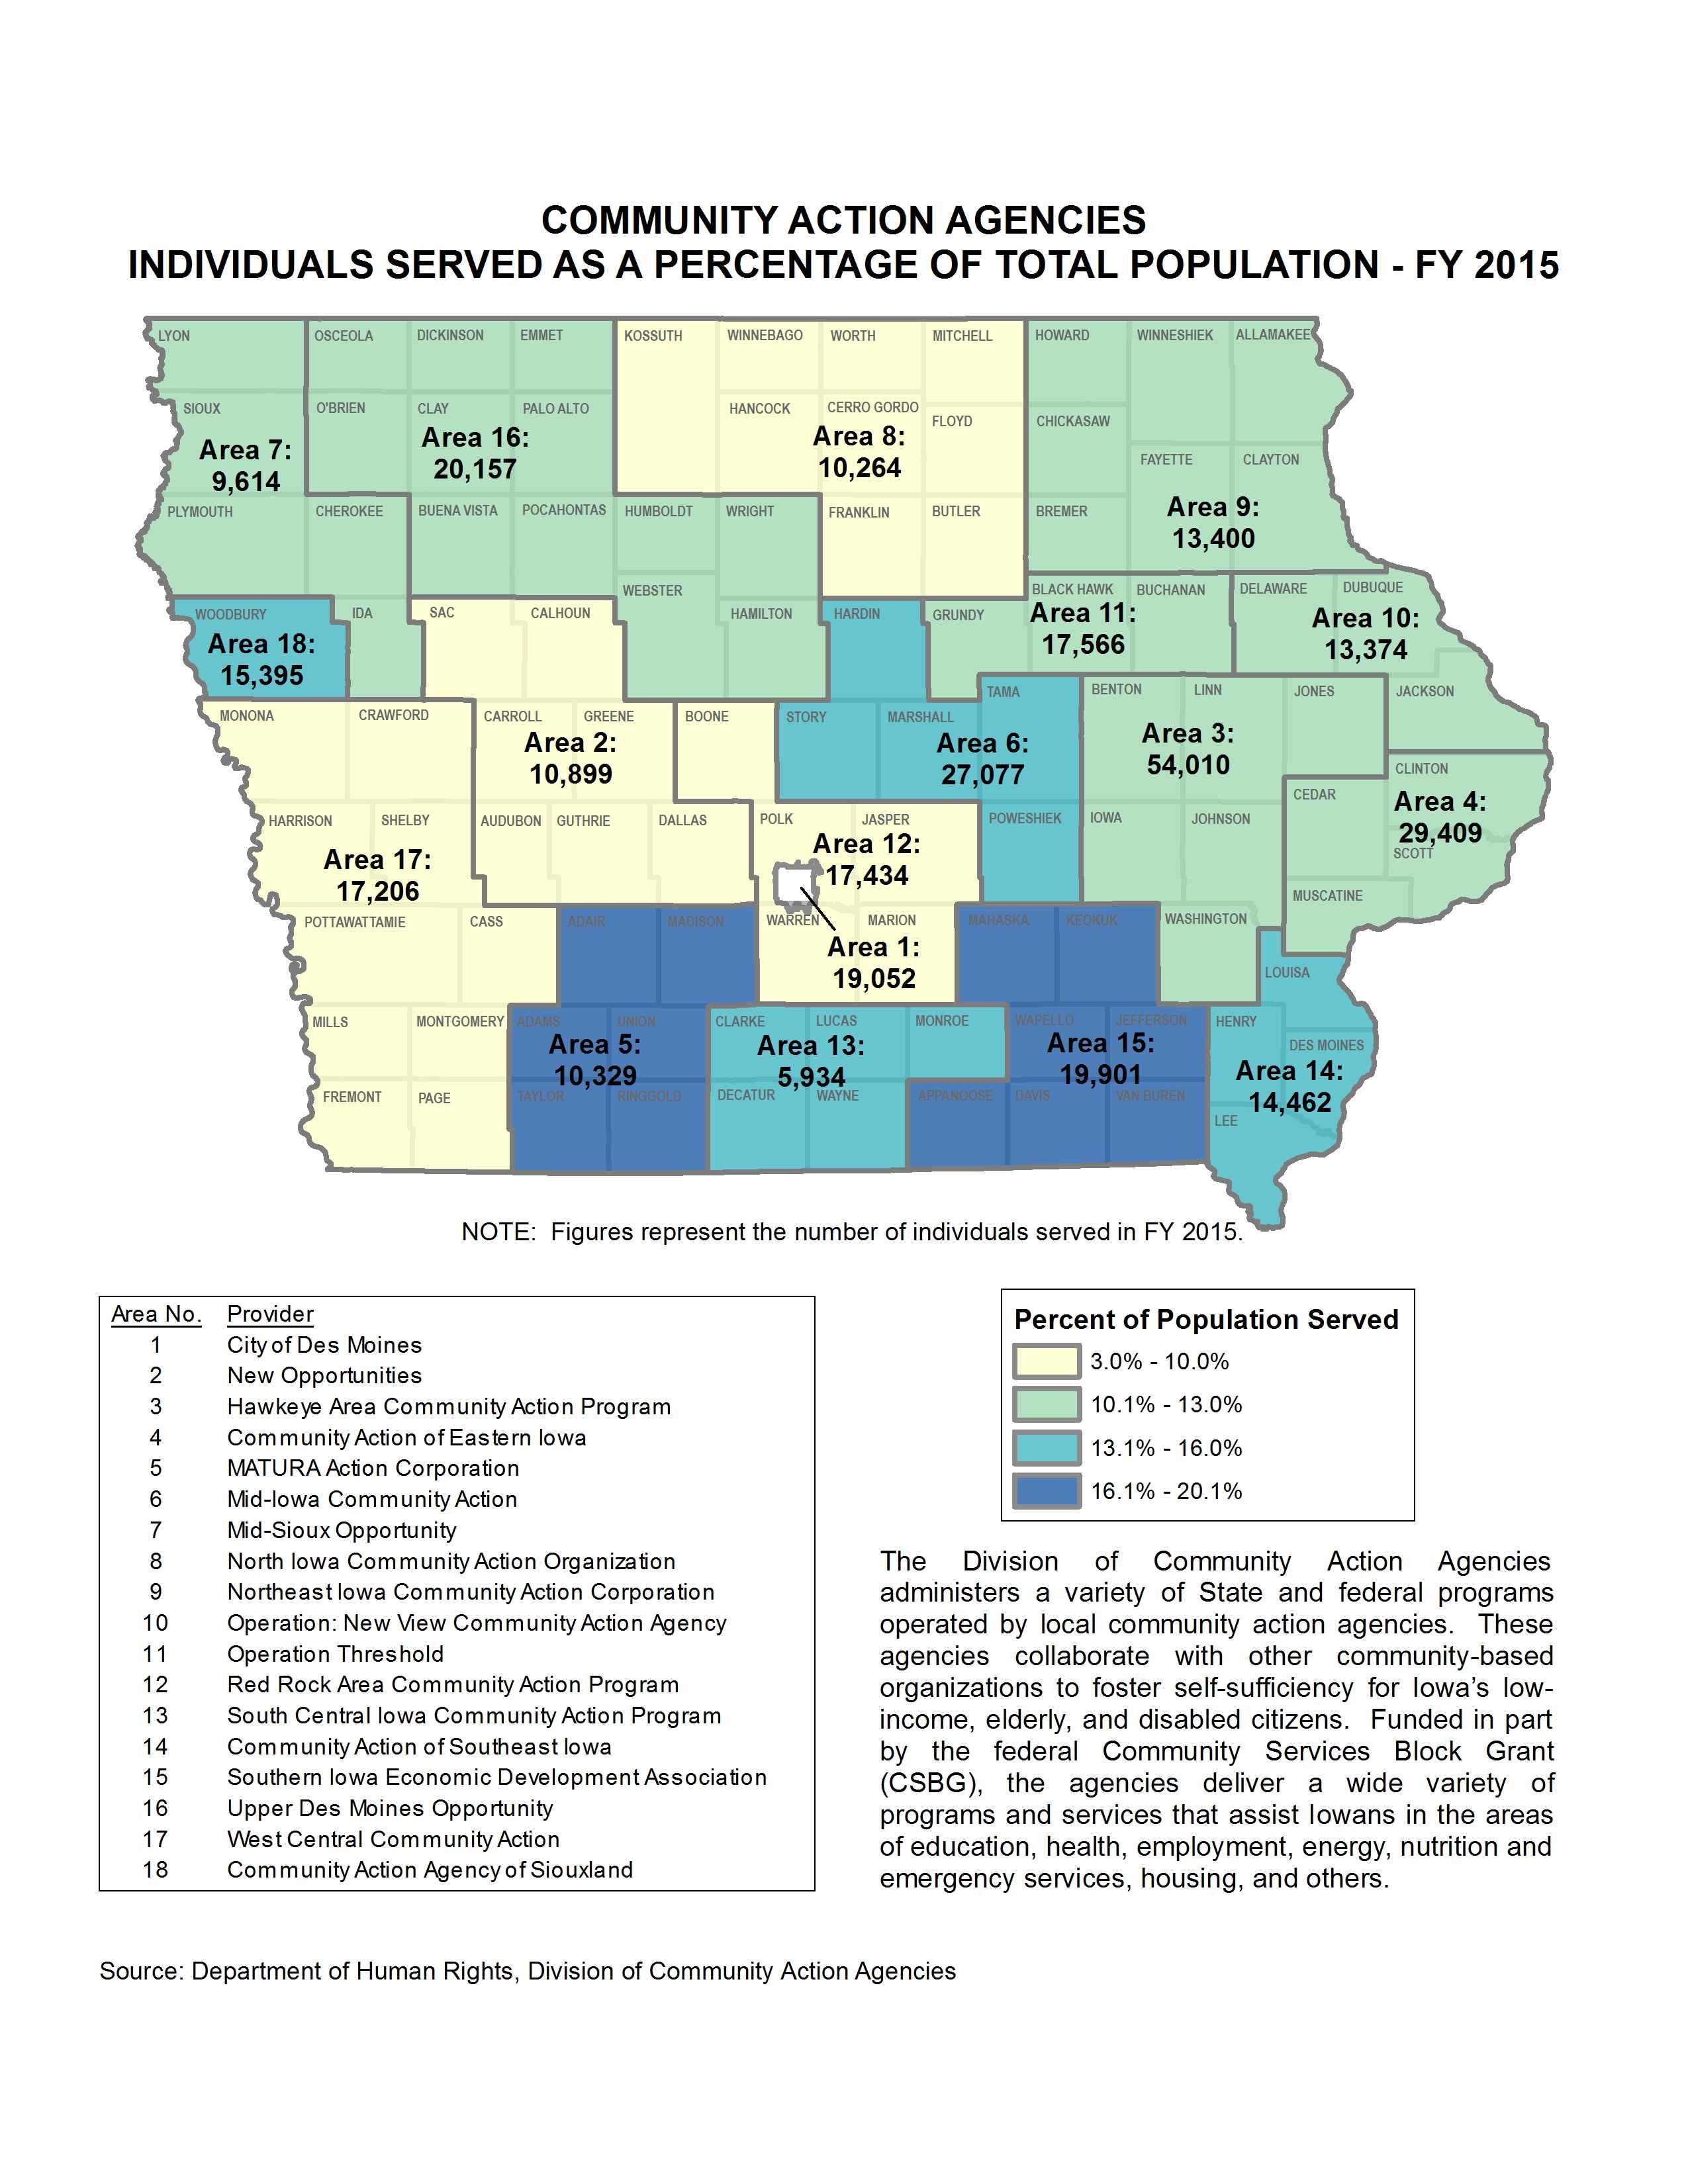
Population Served by Community Action Agencies
|
|
|
|
|
| 04/04/2016 |
Iowa Insights |
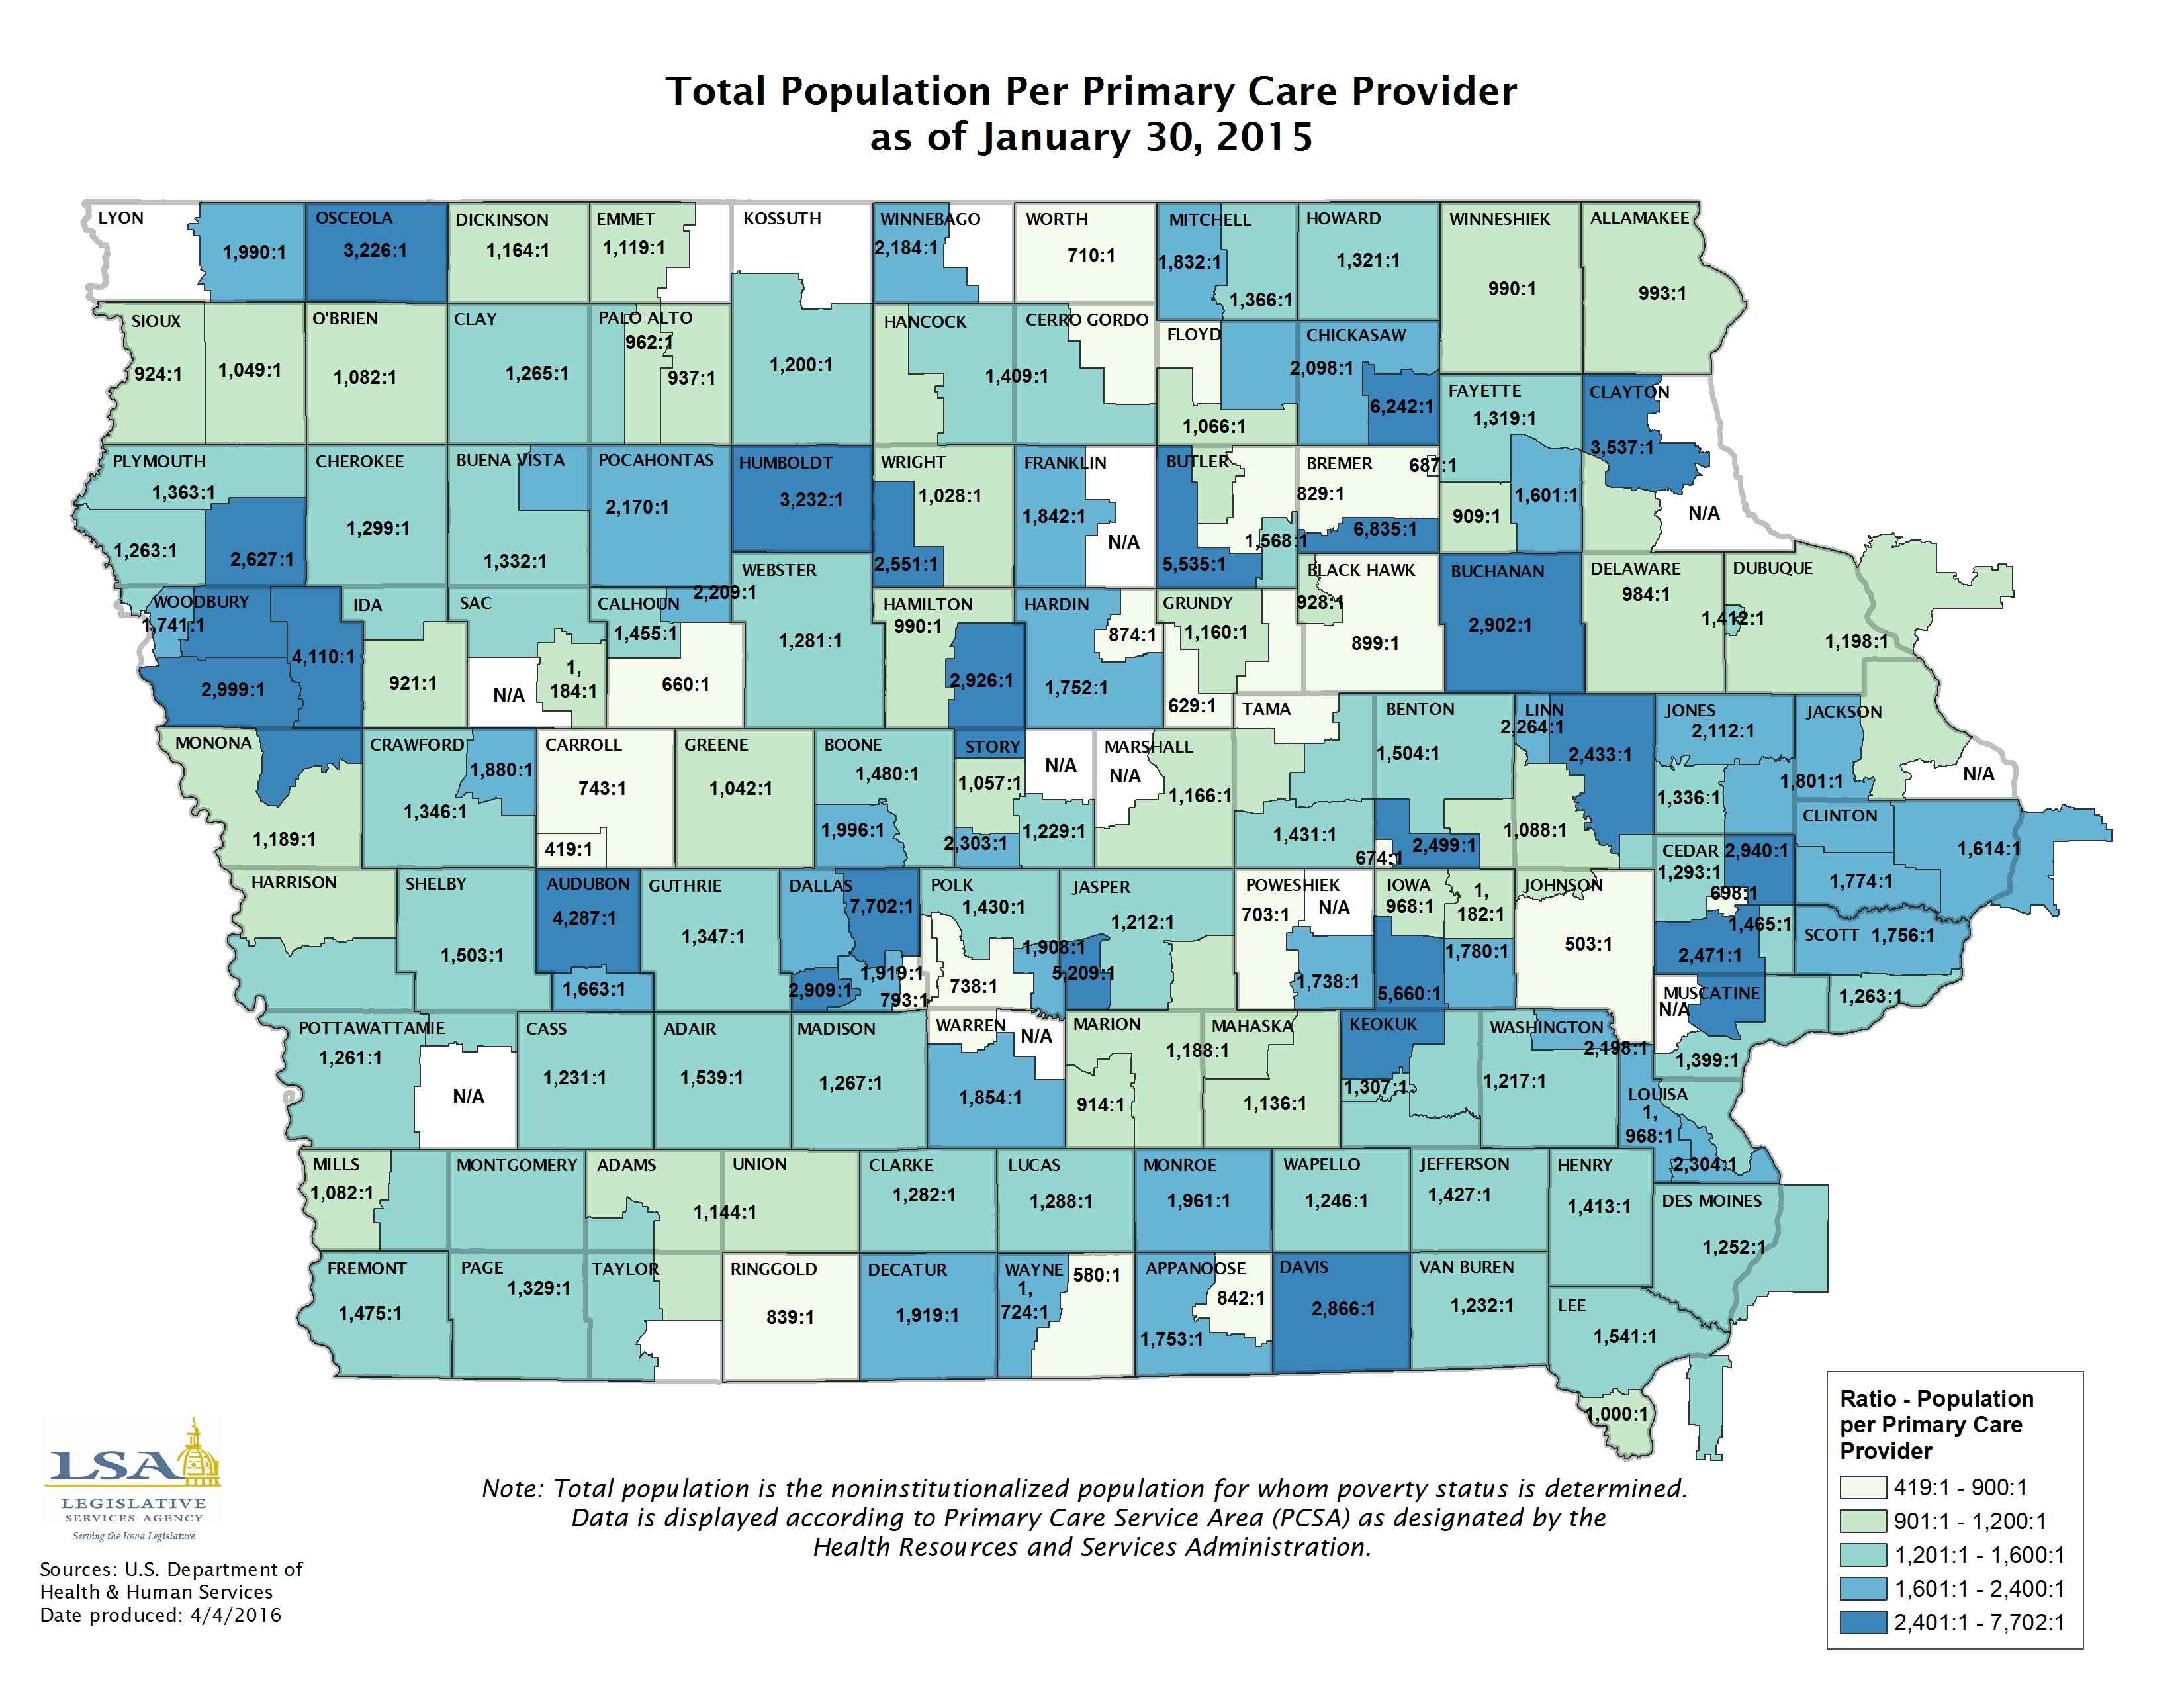
Total Population Per Primary Care Provider
|
|
|
|
|
| 03/28/2016 |
Iowa Insights |
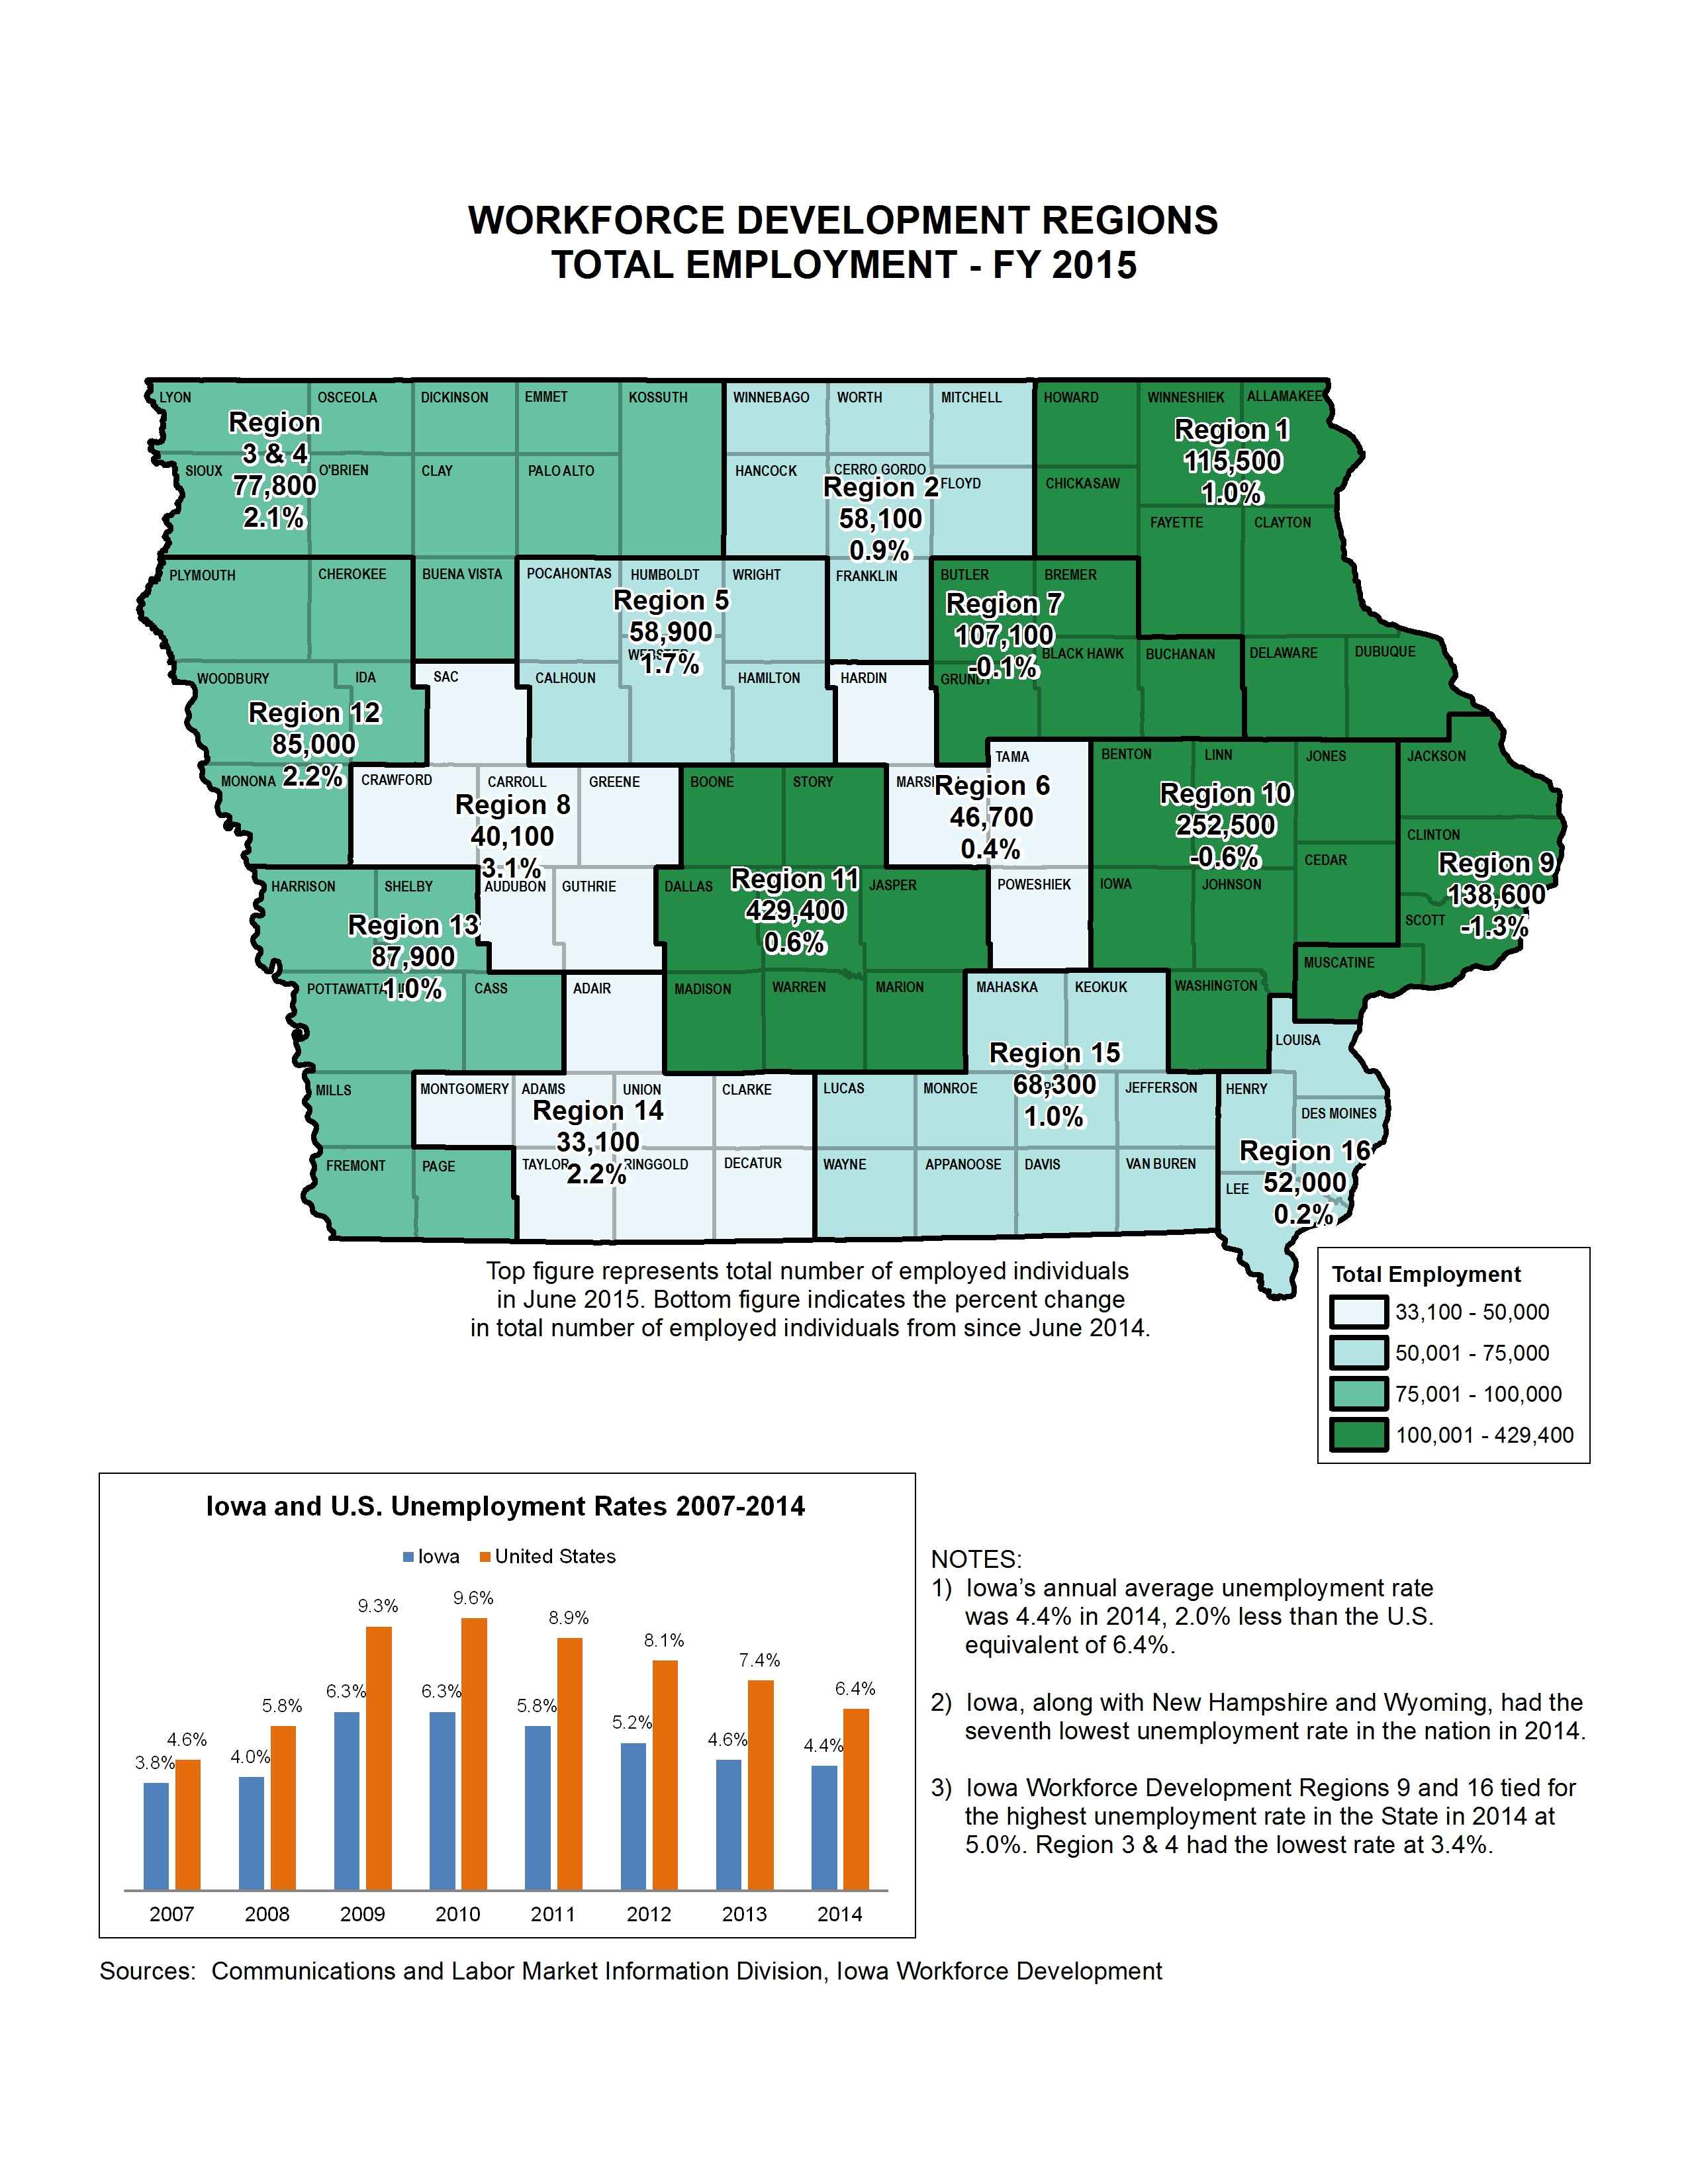
Workforce Development Regions Total Employment
|
|
|
|
|
| 03/21/2016 |
Iowa Insights |
Unemployment Rate in Iowa

|
|
|
|
|
| 03/14/2016 |
Iowa Insights |
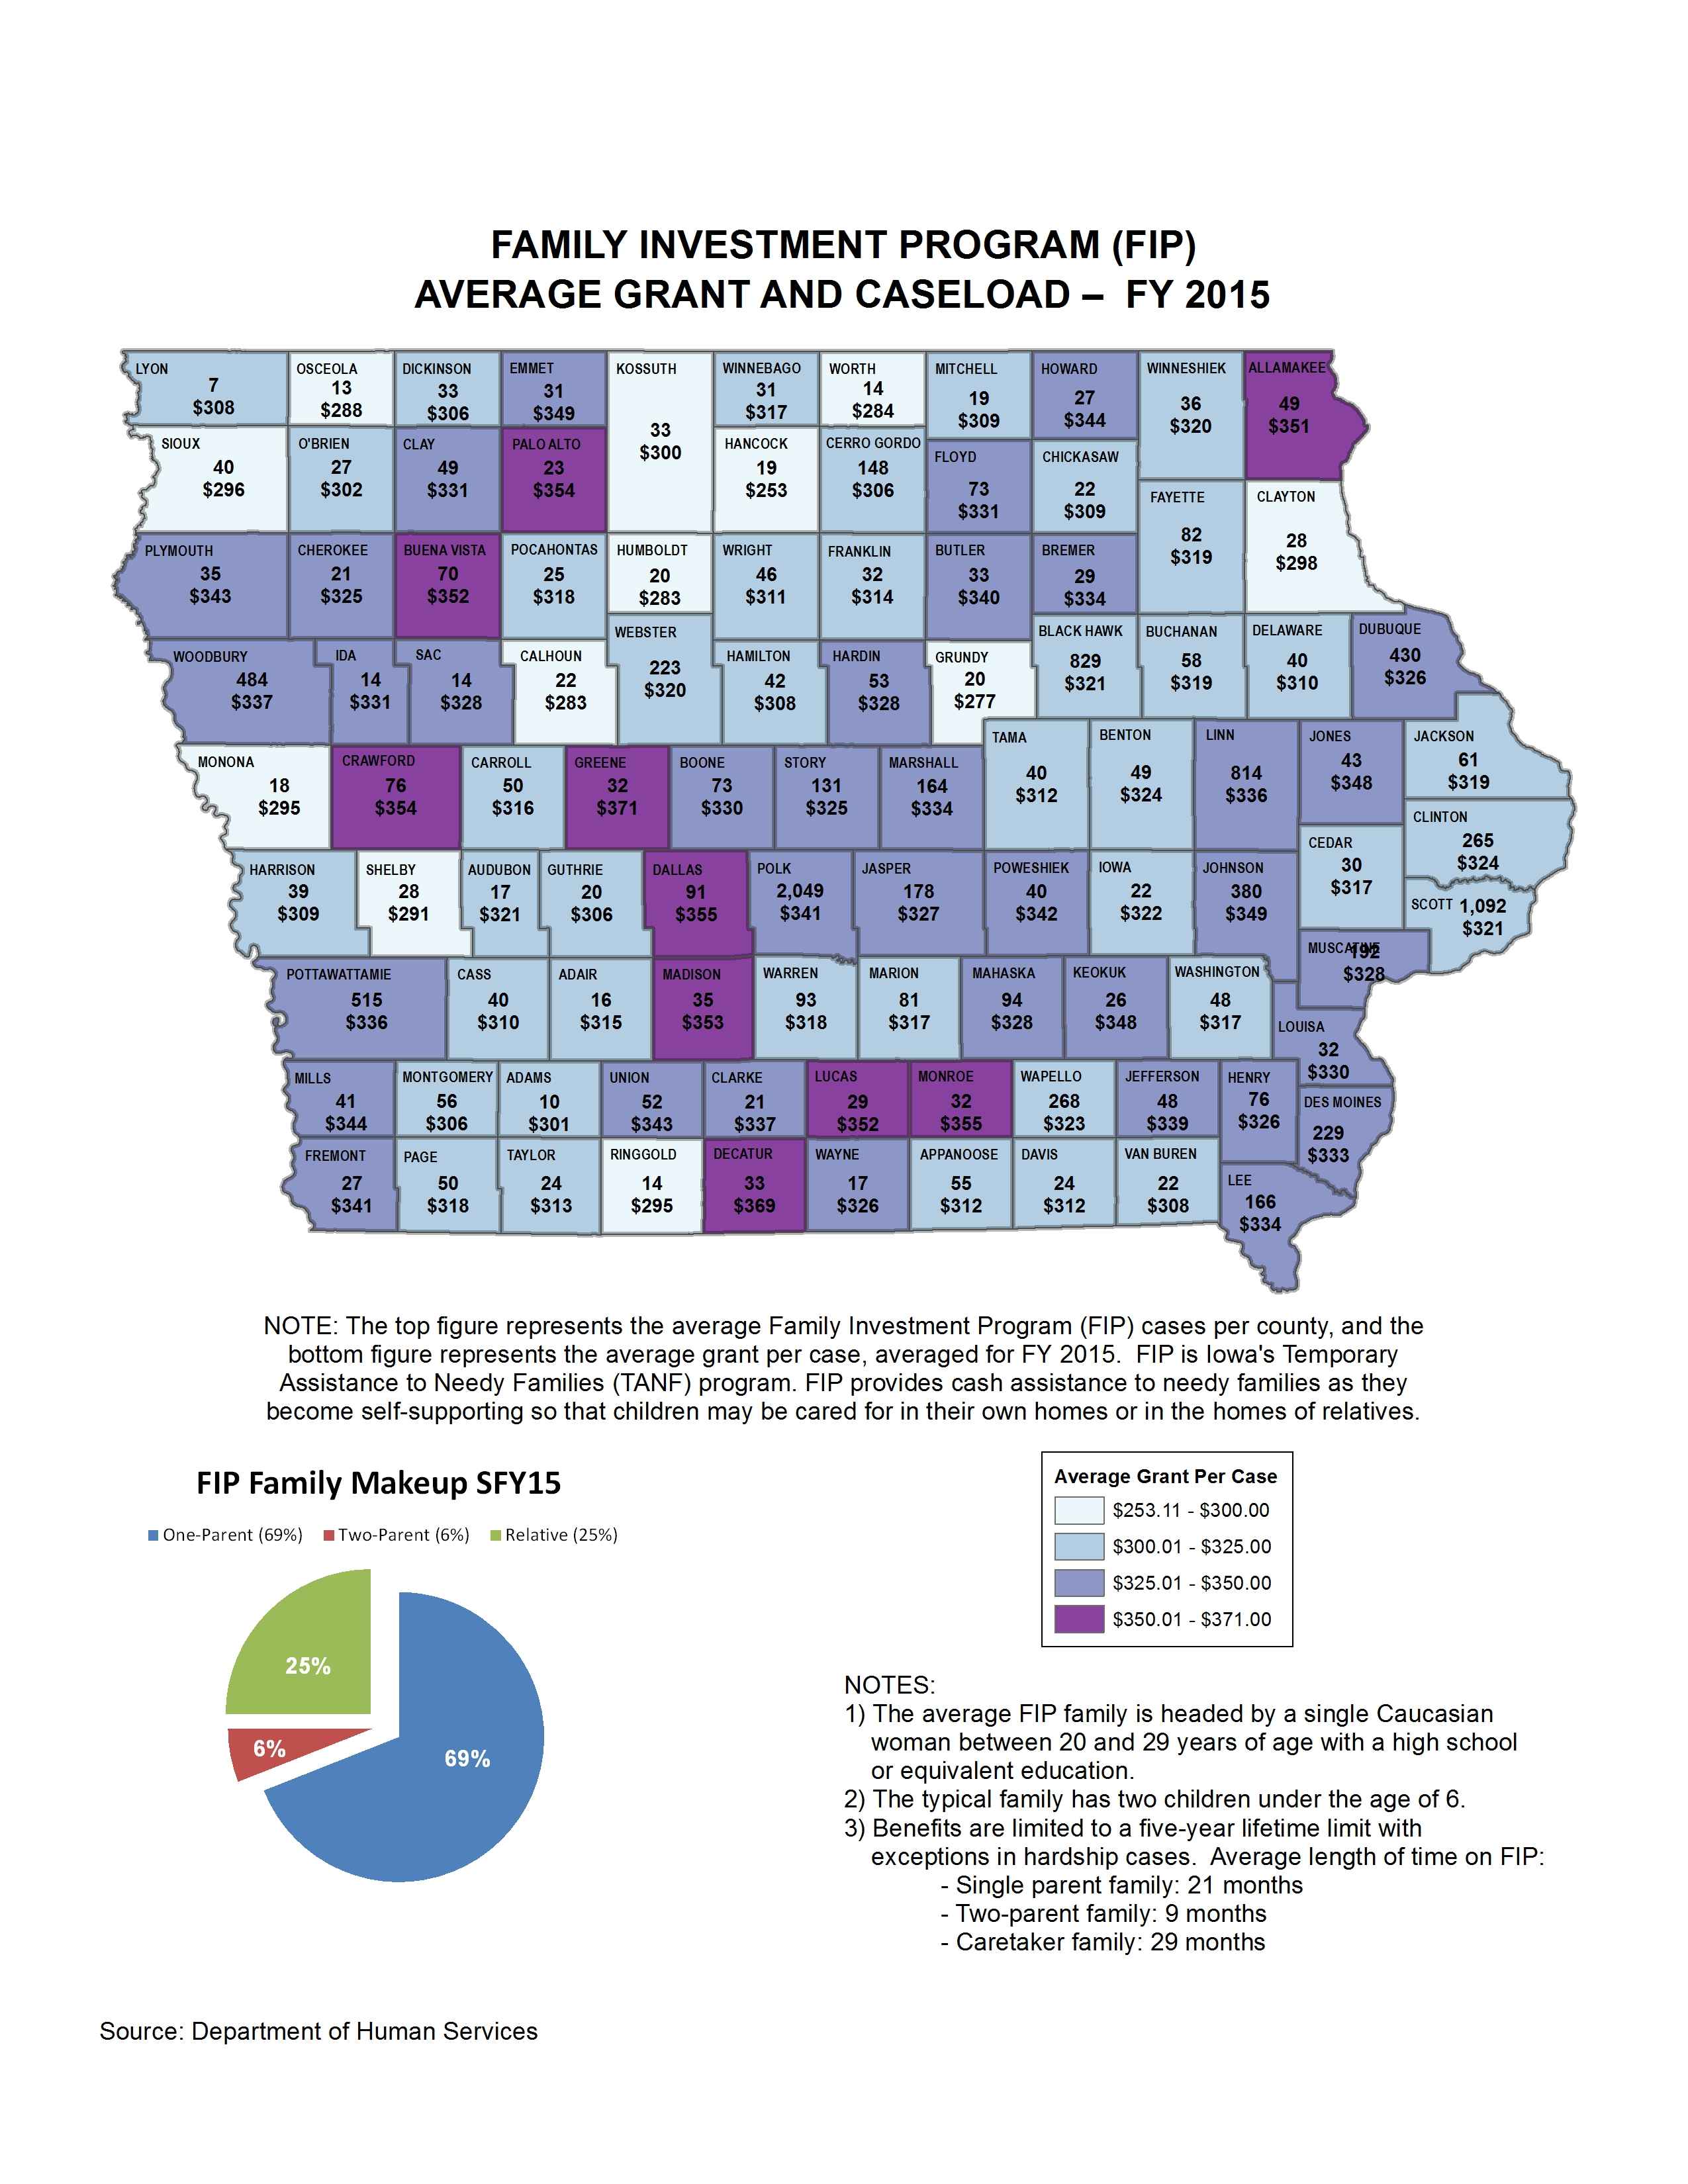
Family Investment Program (FIP) - FY 2015
|
|
|
|
|
| 03/07/2016 |
Iowa Insights |
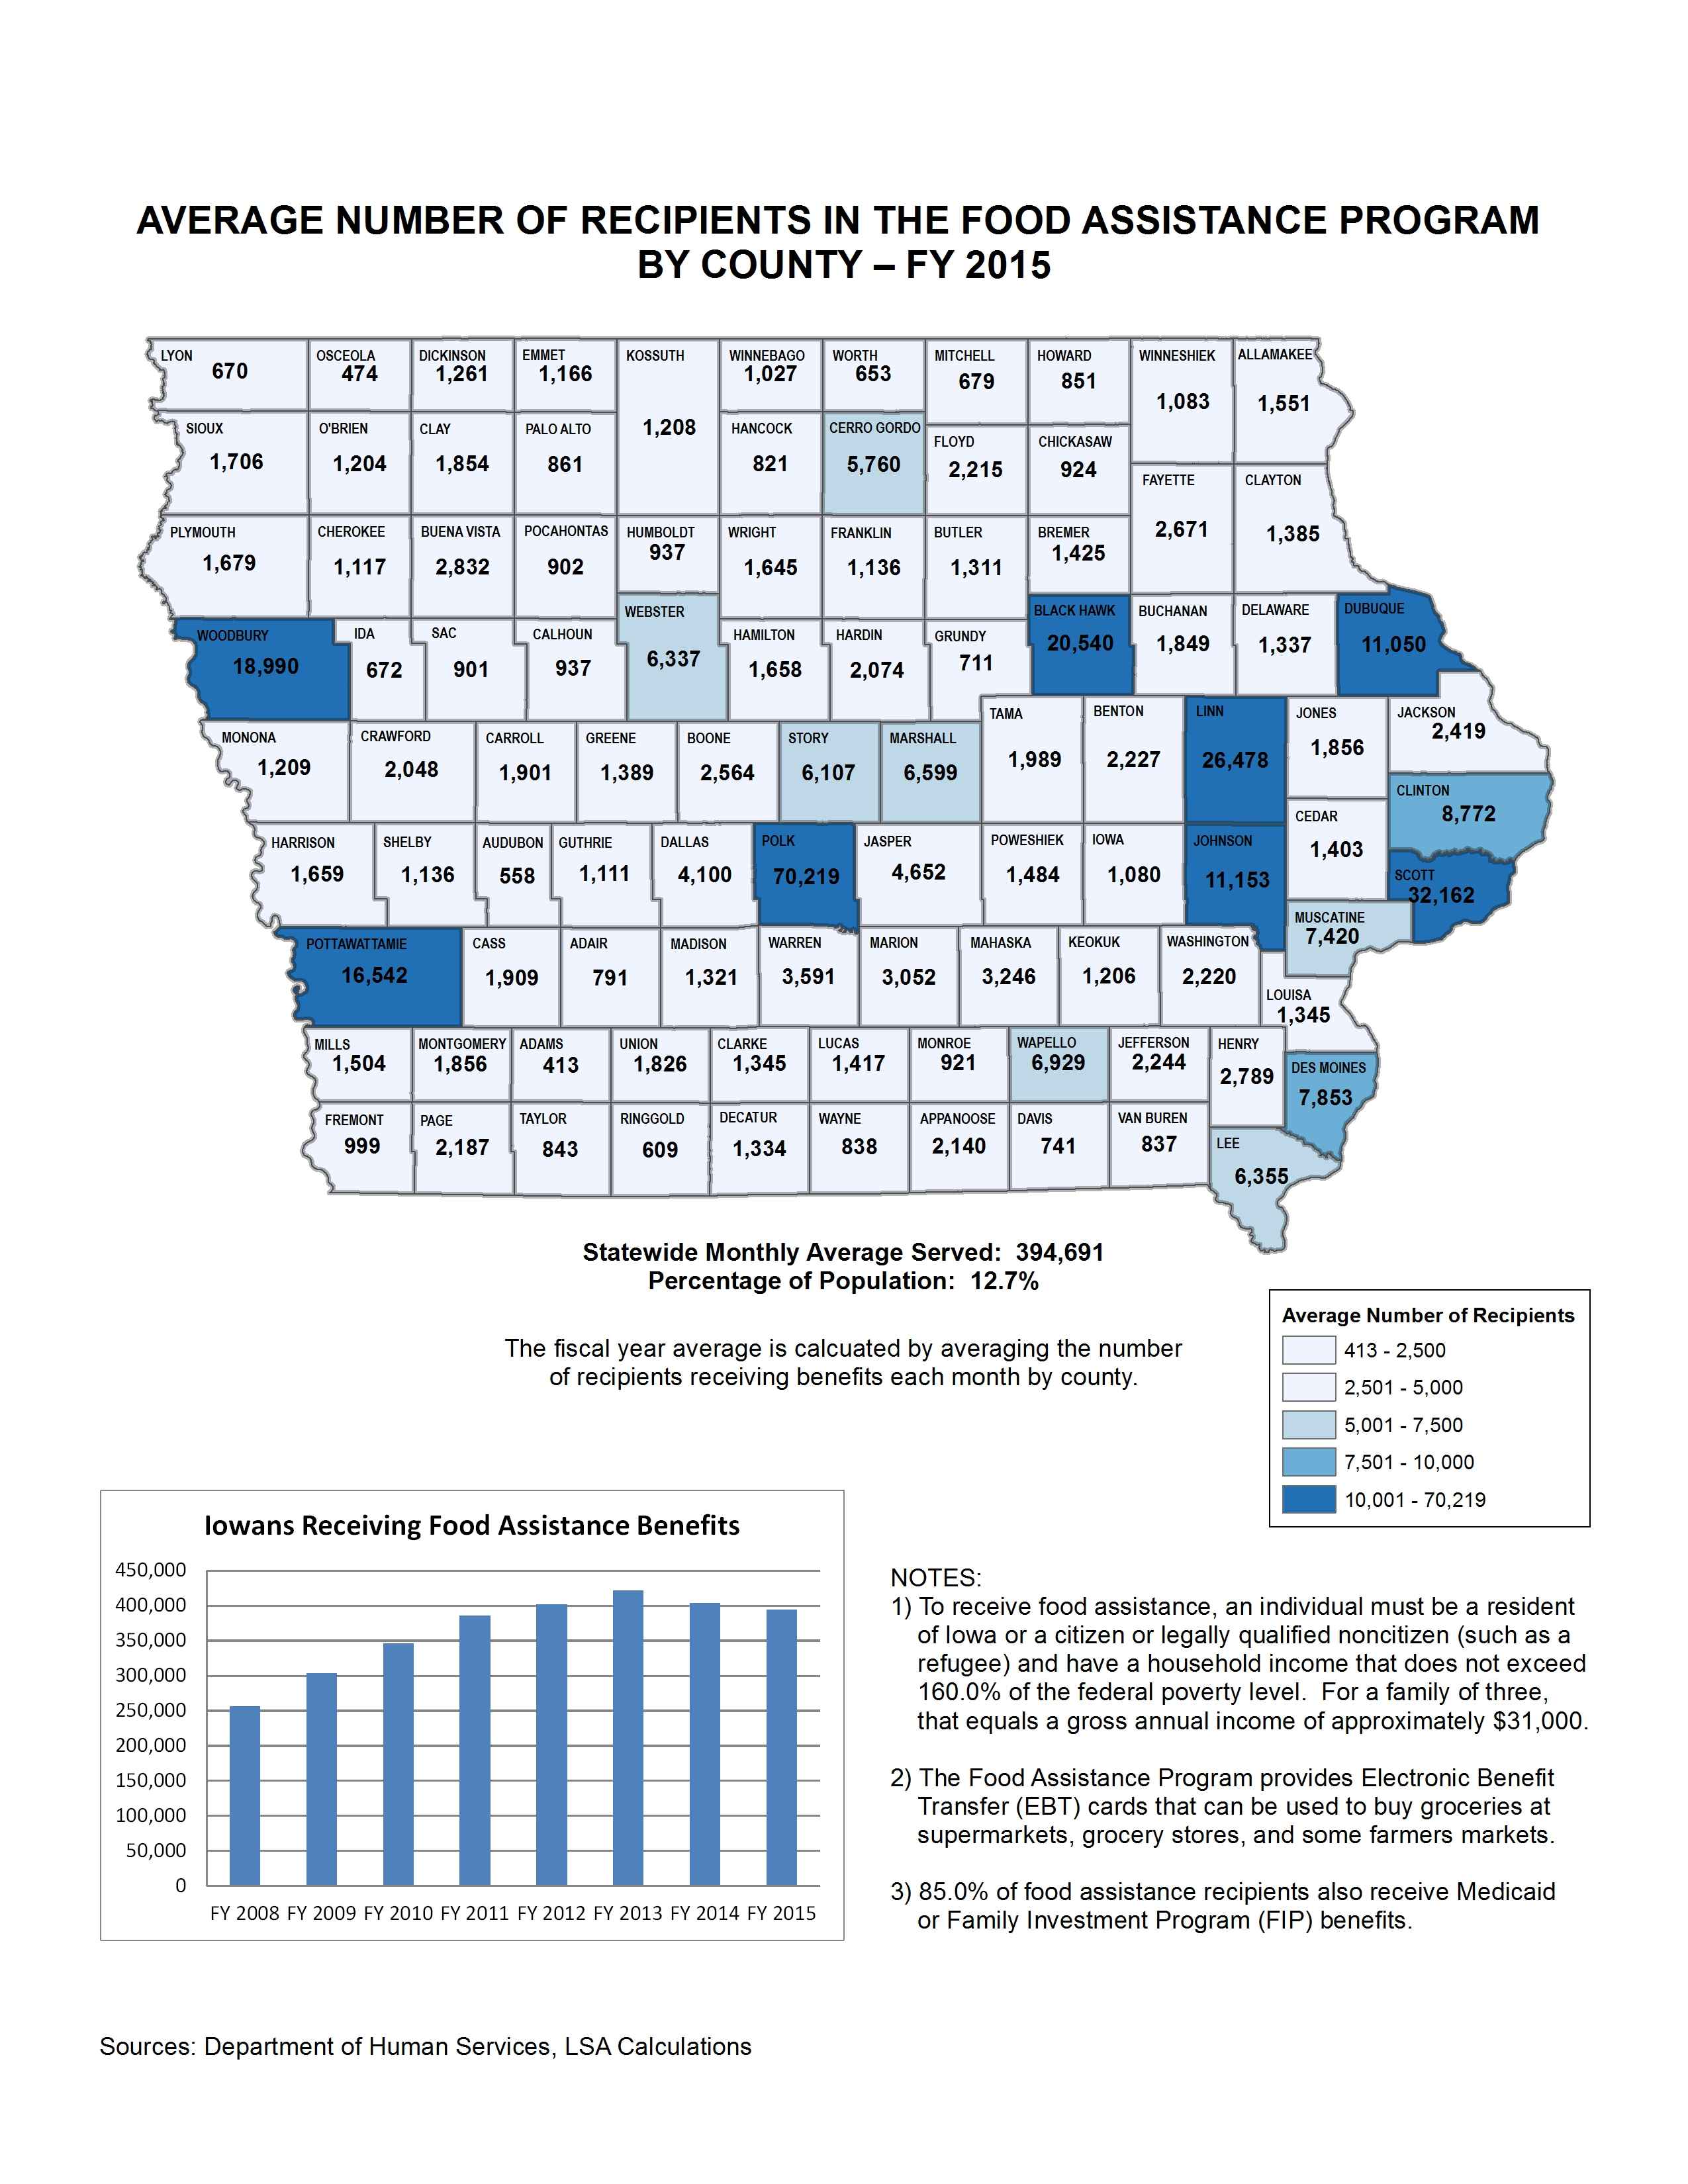
Average Number of Recipients in the Food Assistance Program by County - FY 2015
|
|
|
|
|
| 02/29/2016 |
Iowa Insights |
CHIP Enrollment Per Capita
|
|
|
|
|
| 02/22/2016 |
Iowa Insights |
Iowa Health and Wellness Plan Enrollment
|
|
|
|
|
| 02/15/2016 |
Iowa Insights |
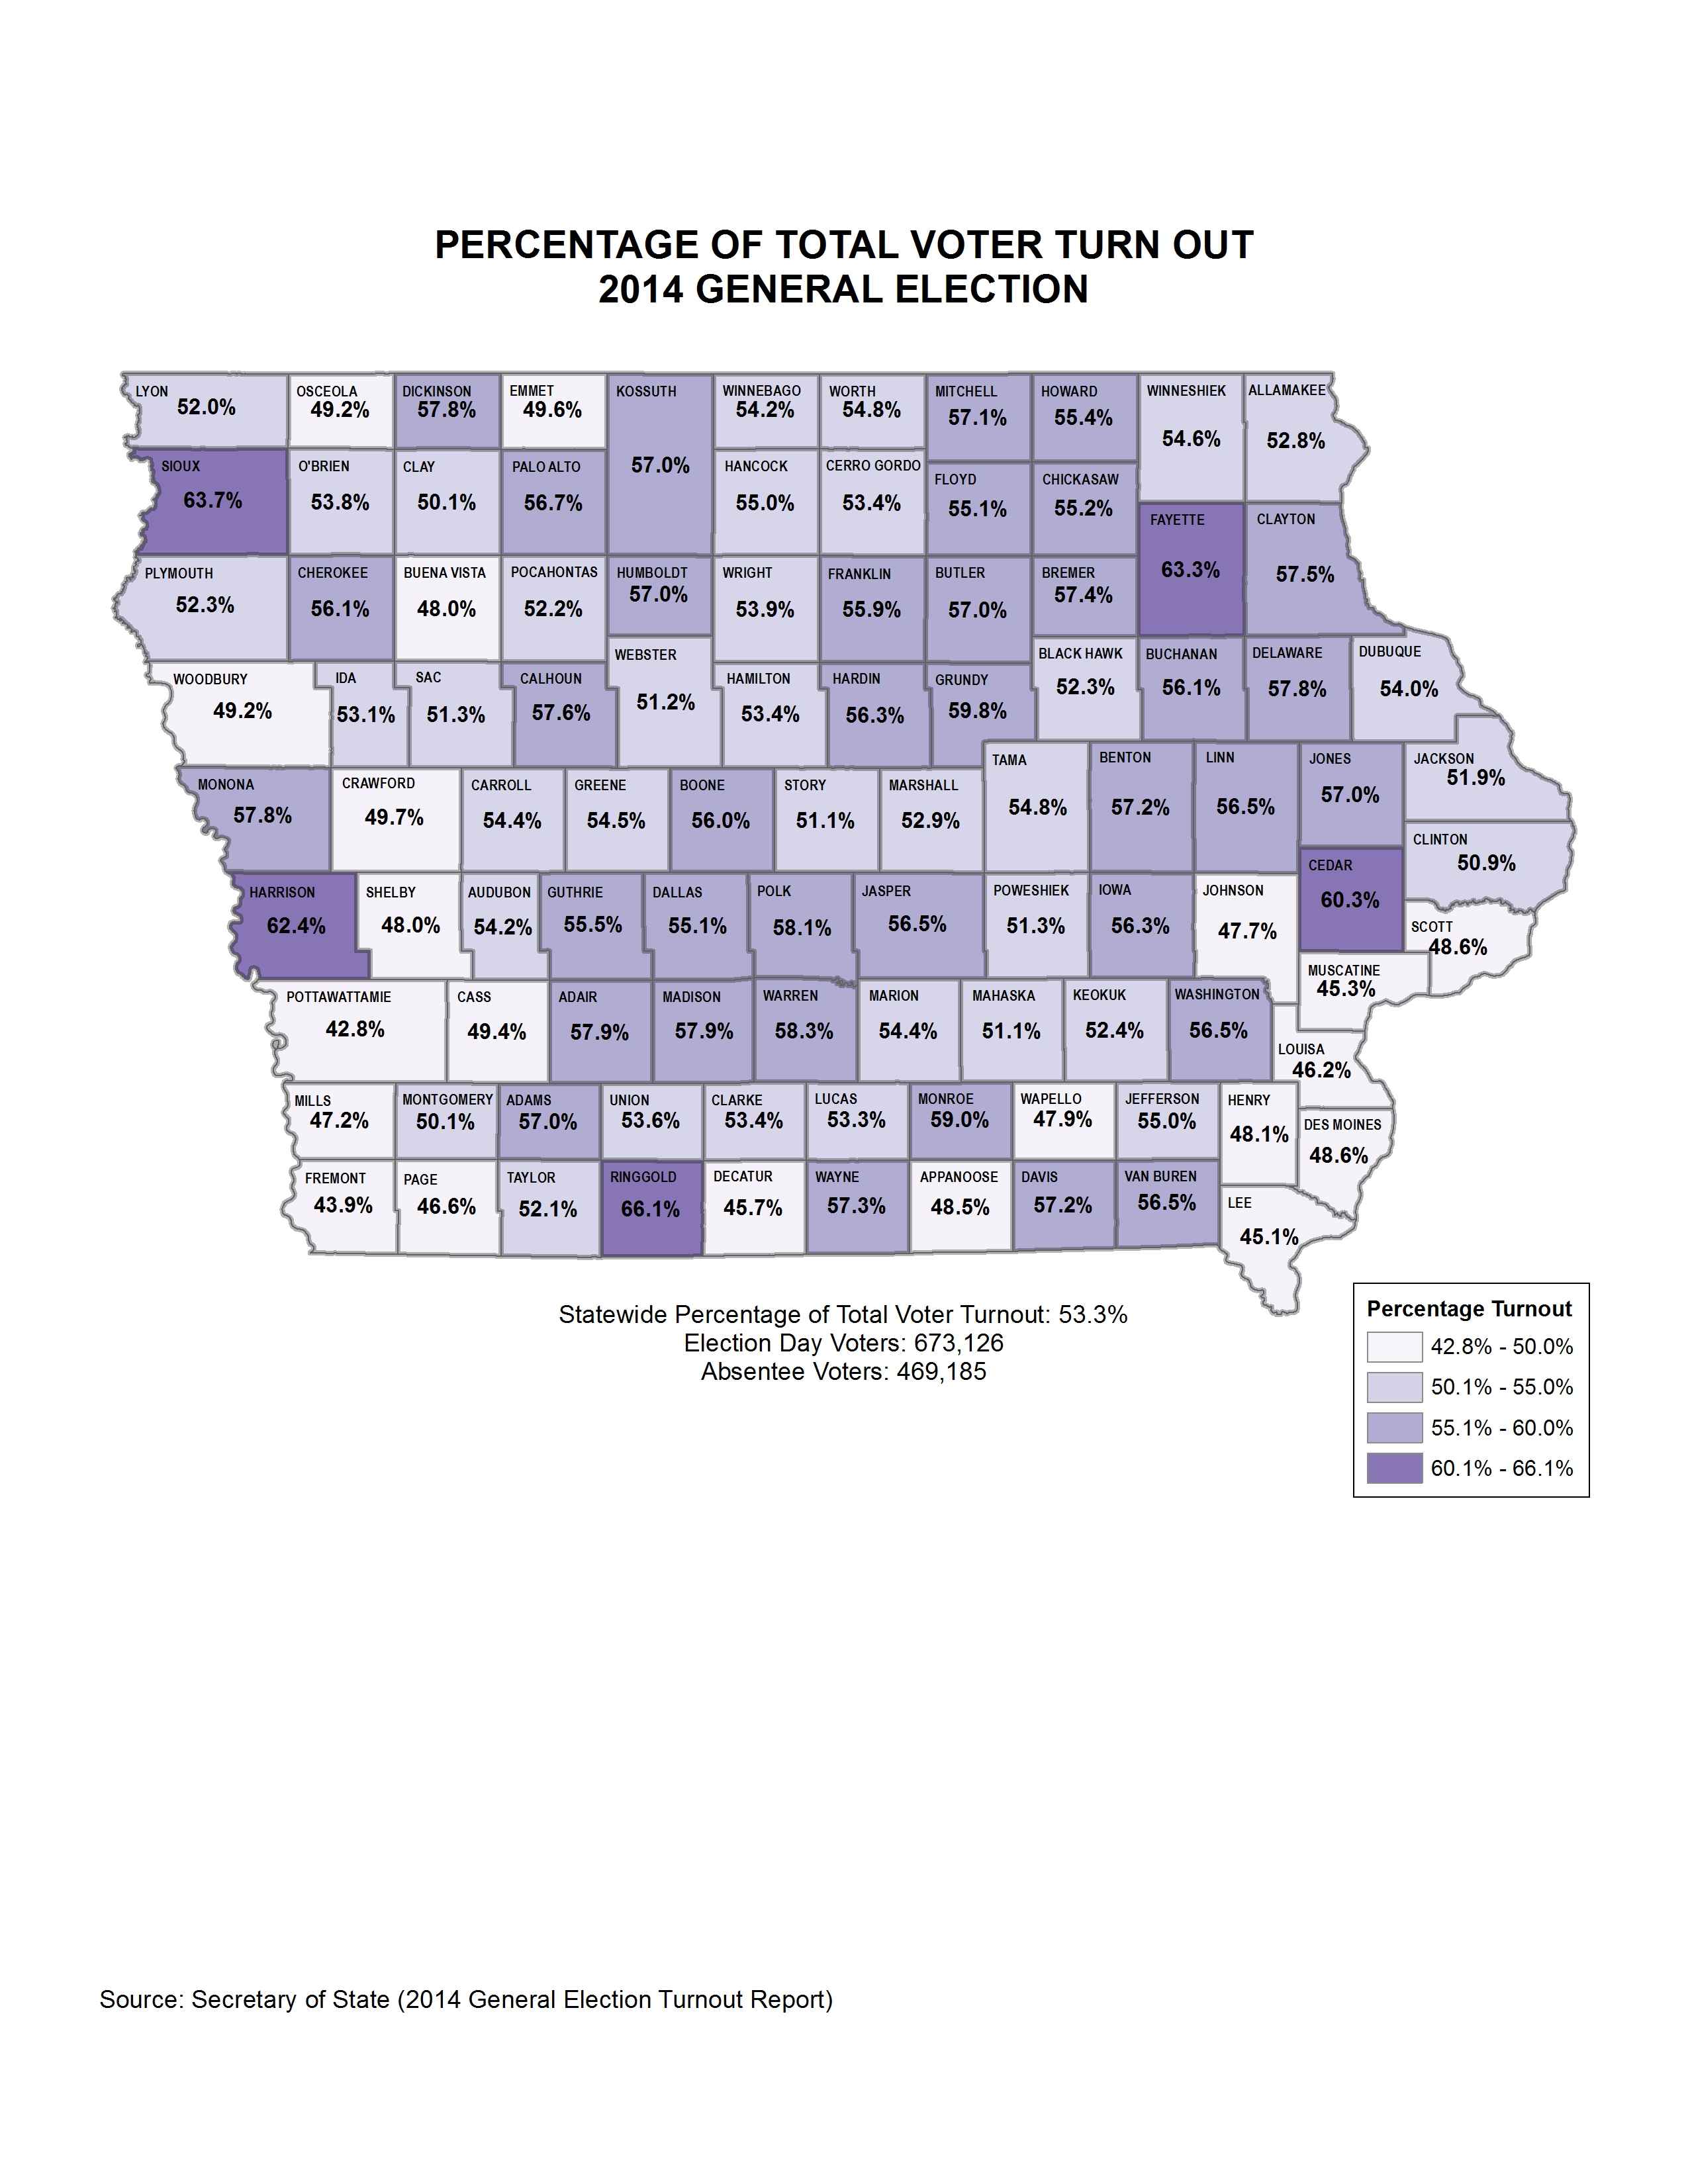
Voter Turn Out - 2014 General Election
|
|
|
|
|
| 02/08/2016 |
Iowa Insights |
Active Registered Voters as a Percentage of Voting Age Population

|
|
|
|
|
| 02/01/2016 |
Iowa Insights |
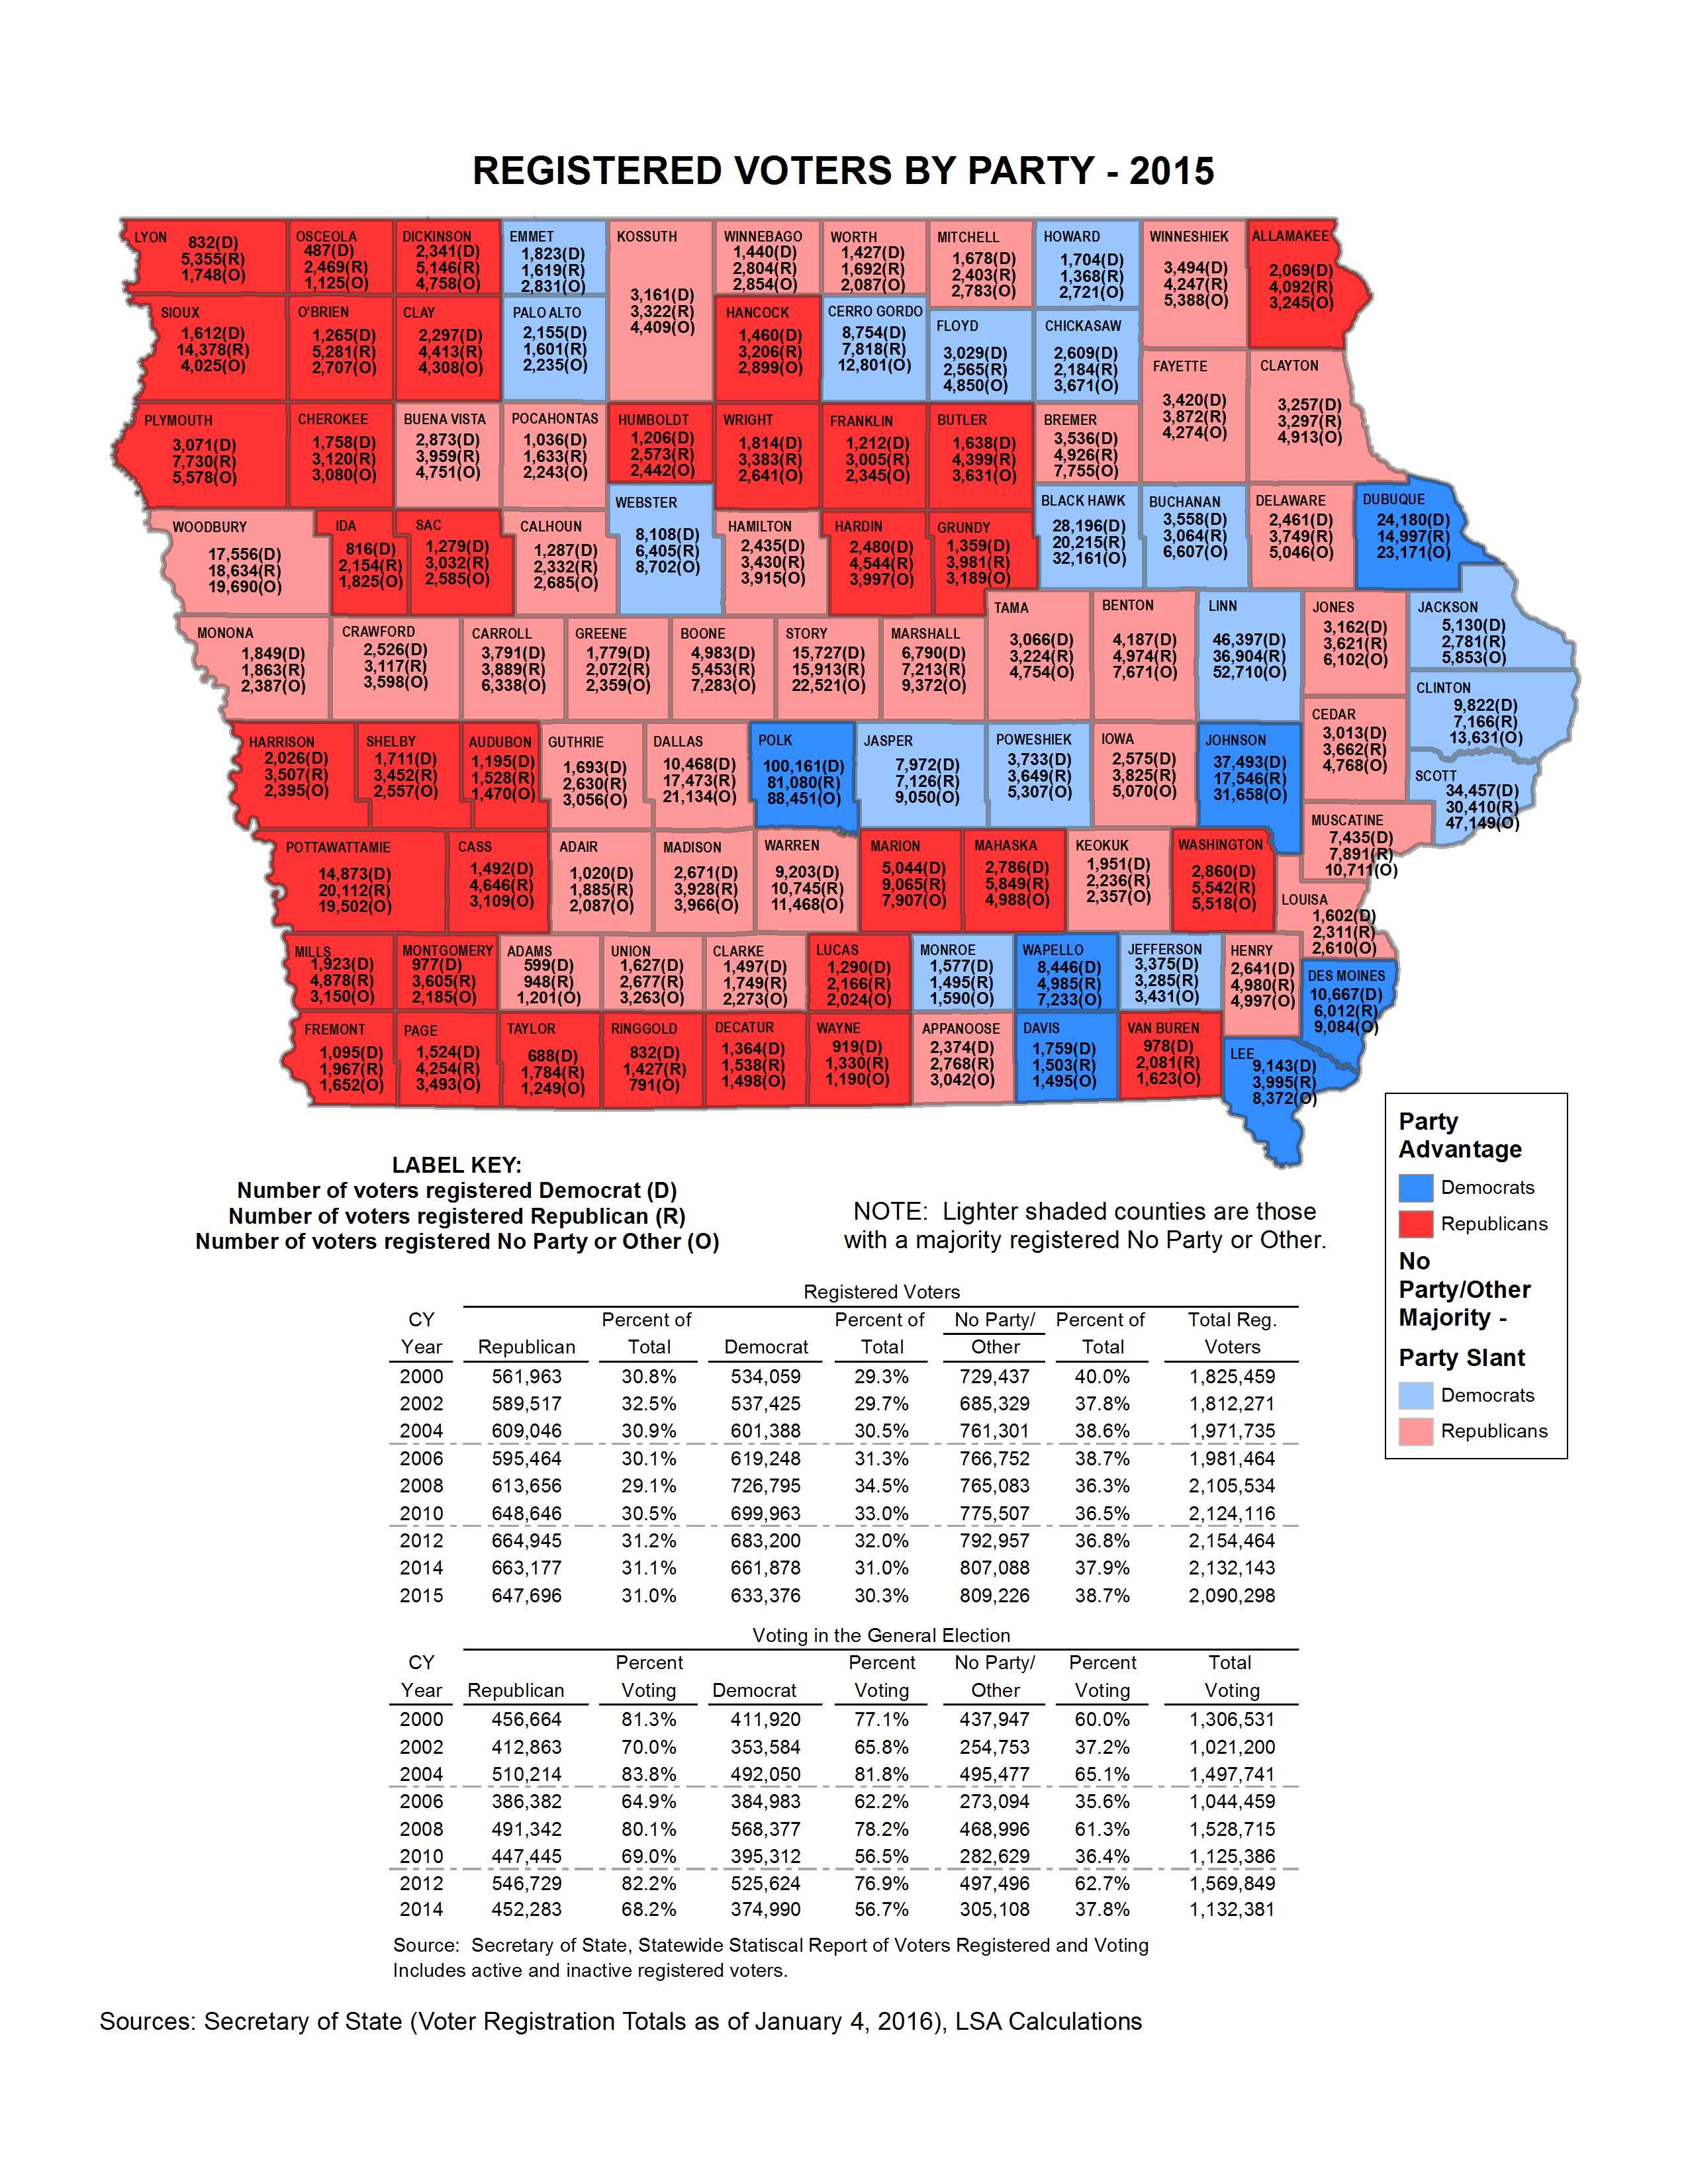
Registered Voters by Party - 2015
|
|
|
|
|
| 01/25/2016 |
Iowa Insights |
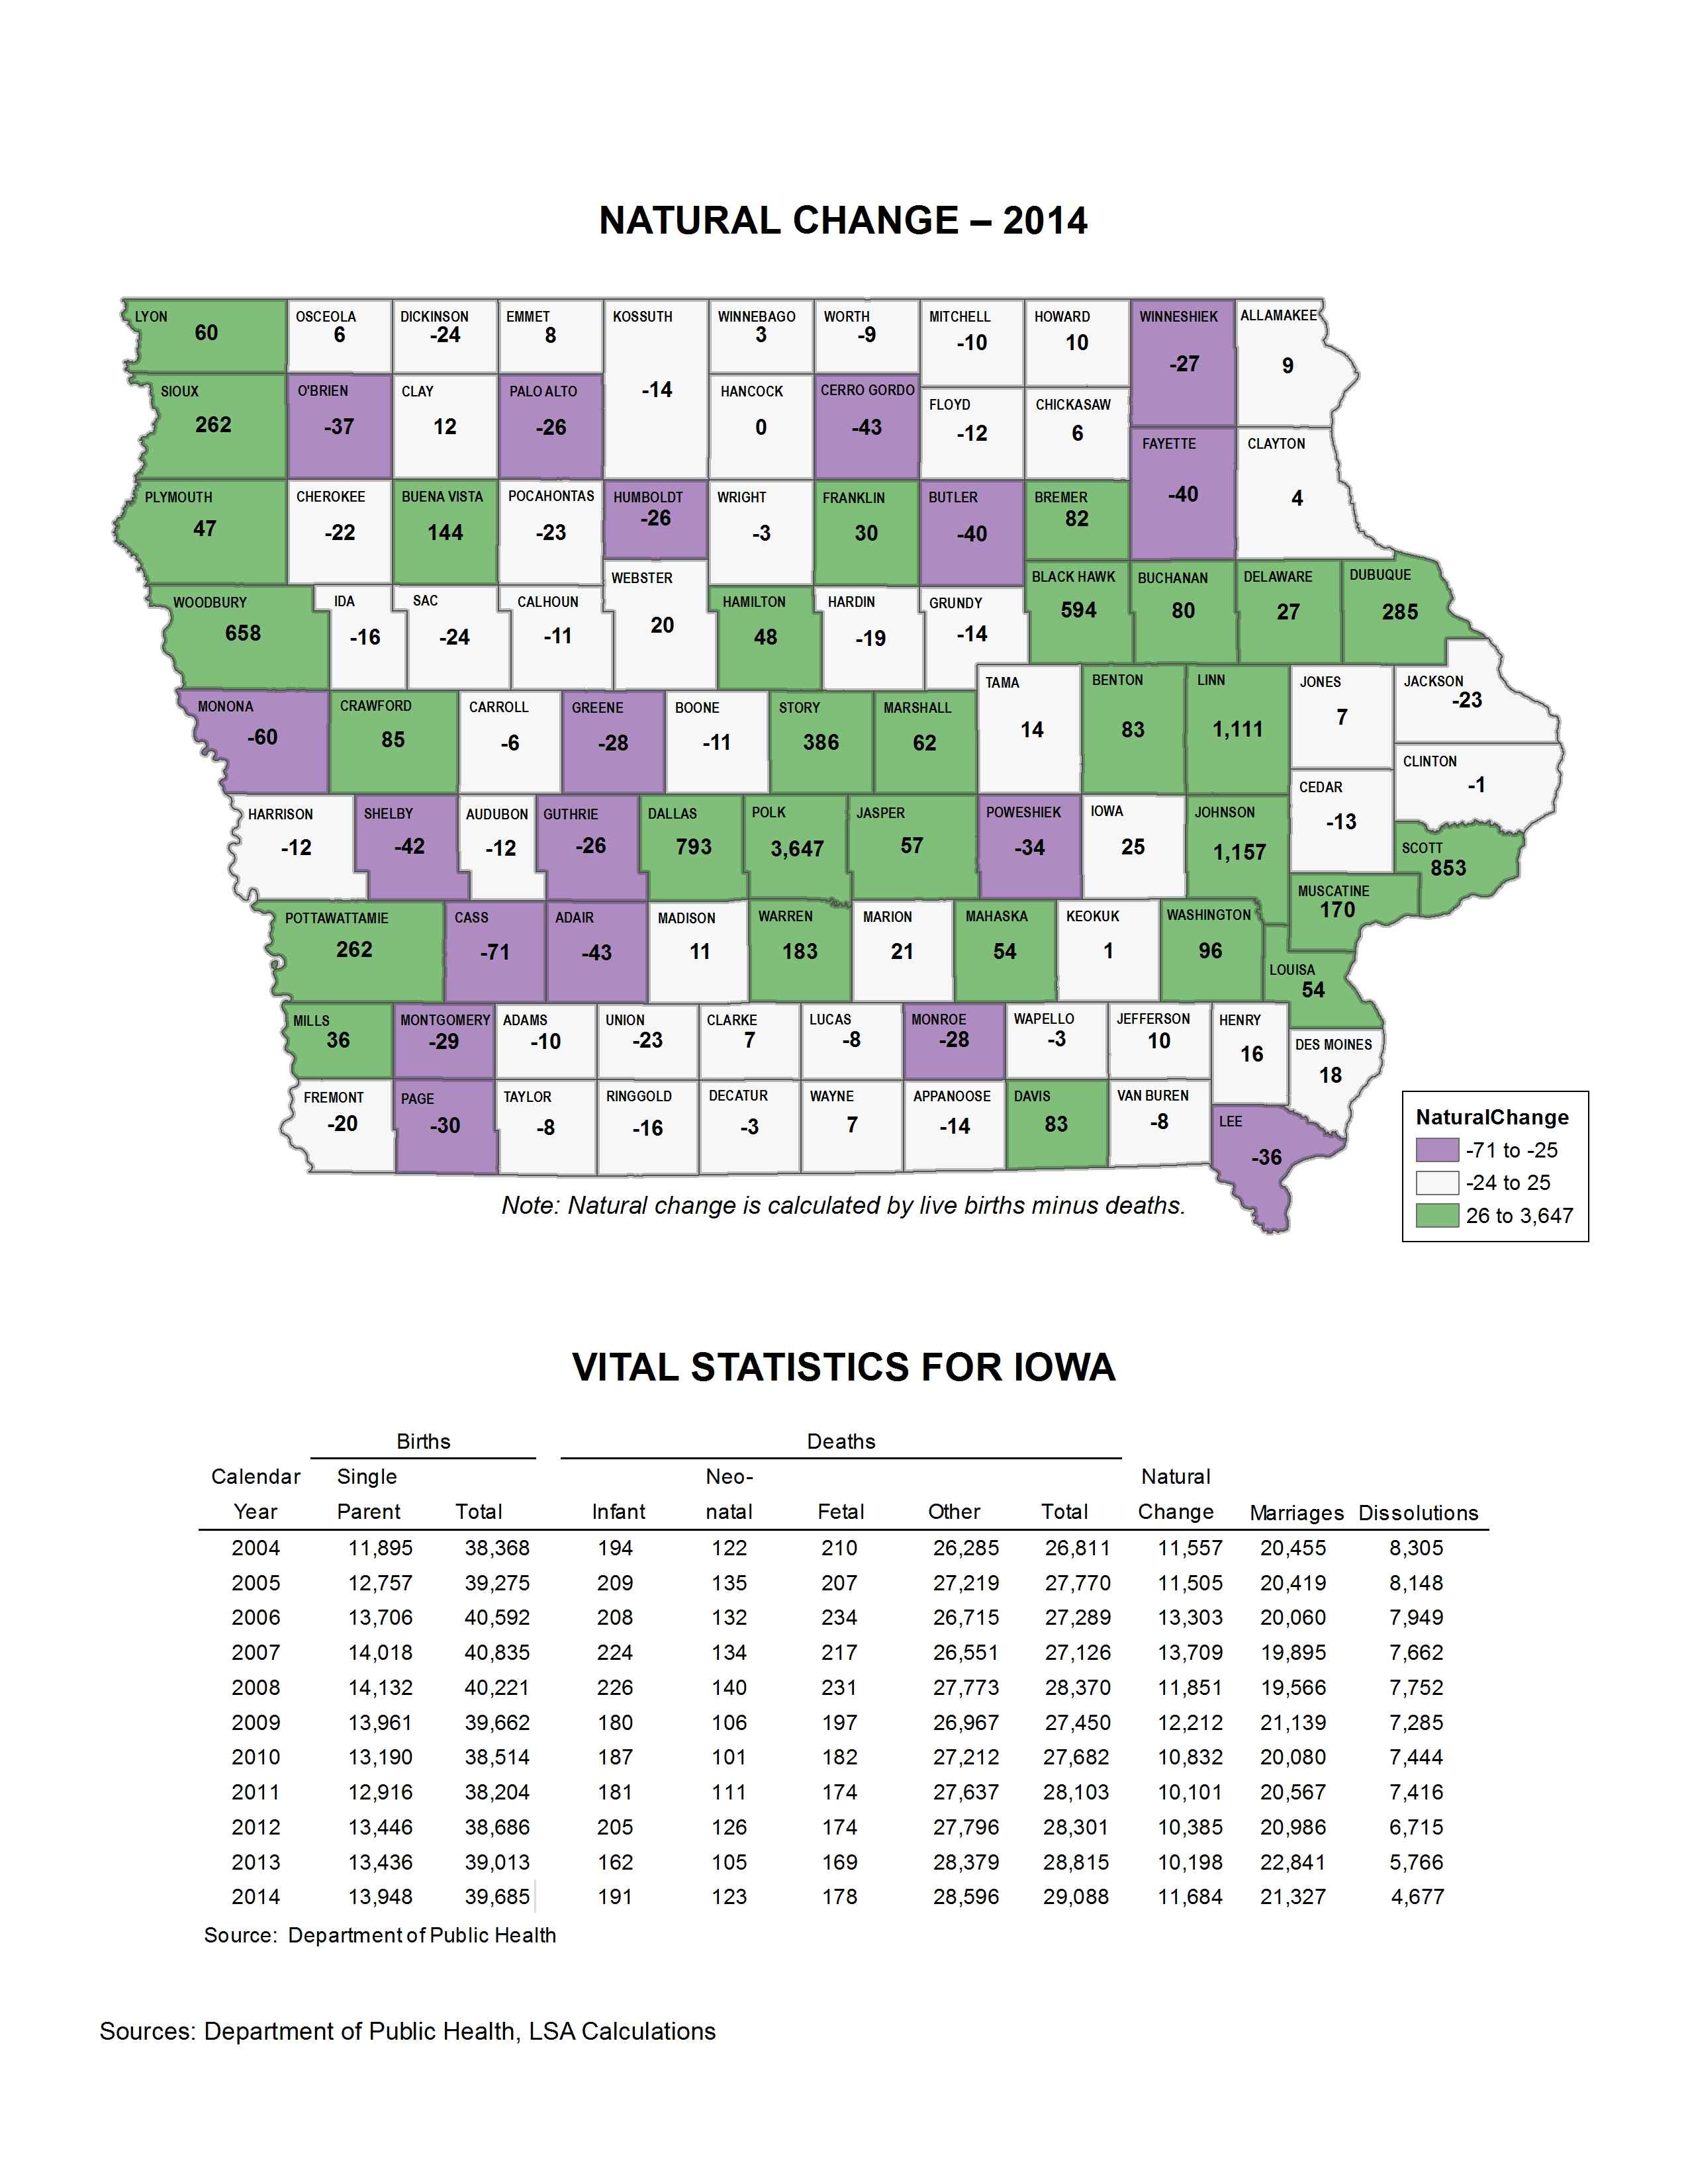
Natural Population Change by County
|
|
|
|
|
| 01/19/2016 |
Iowa Insights |
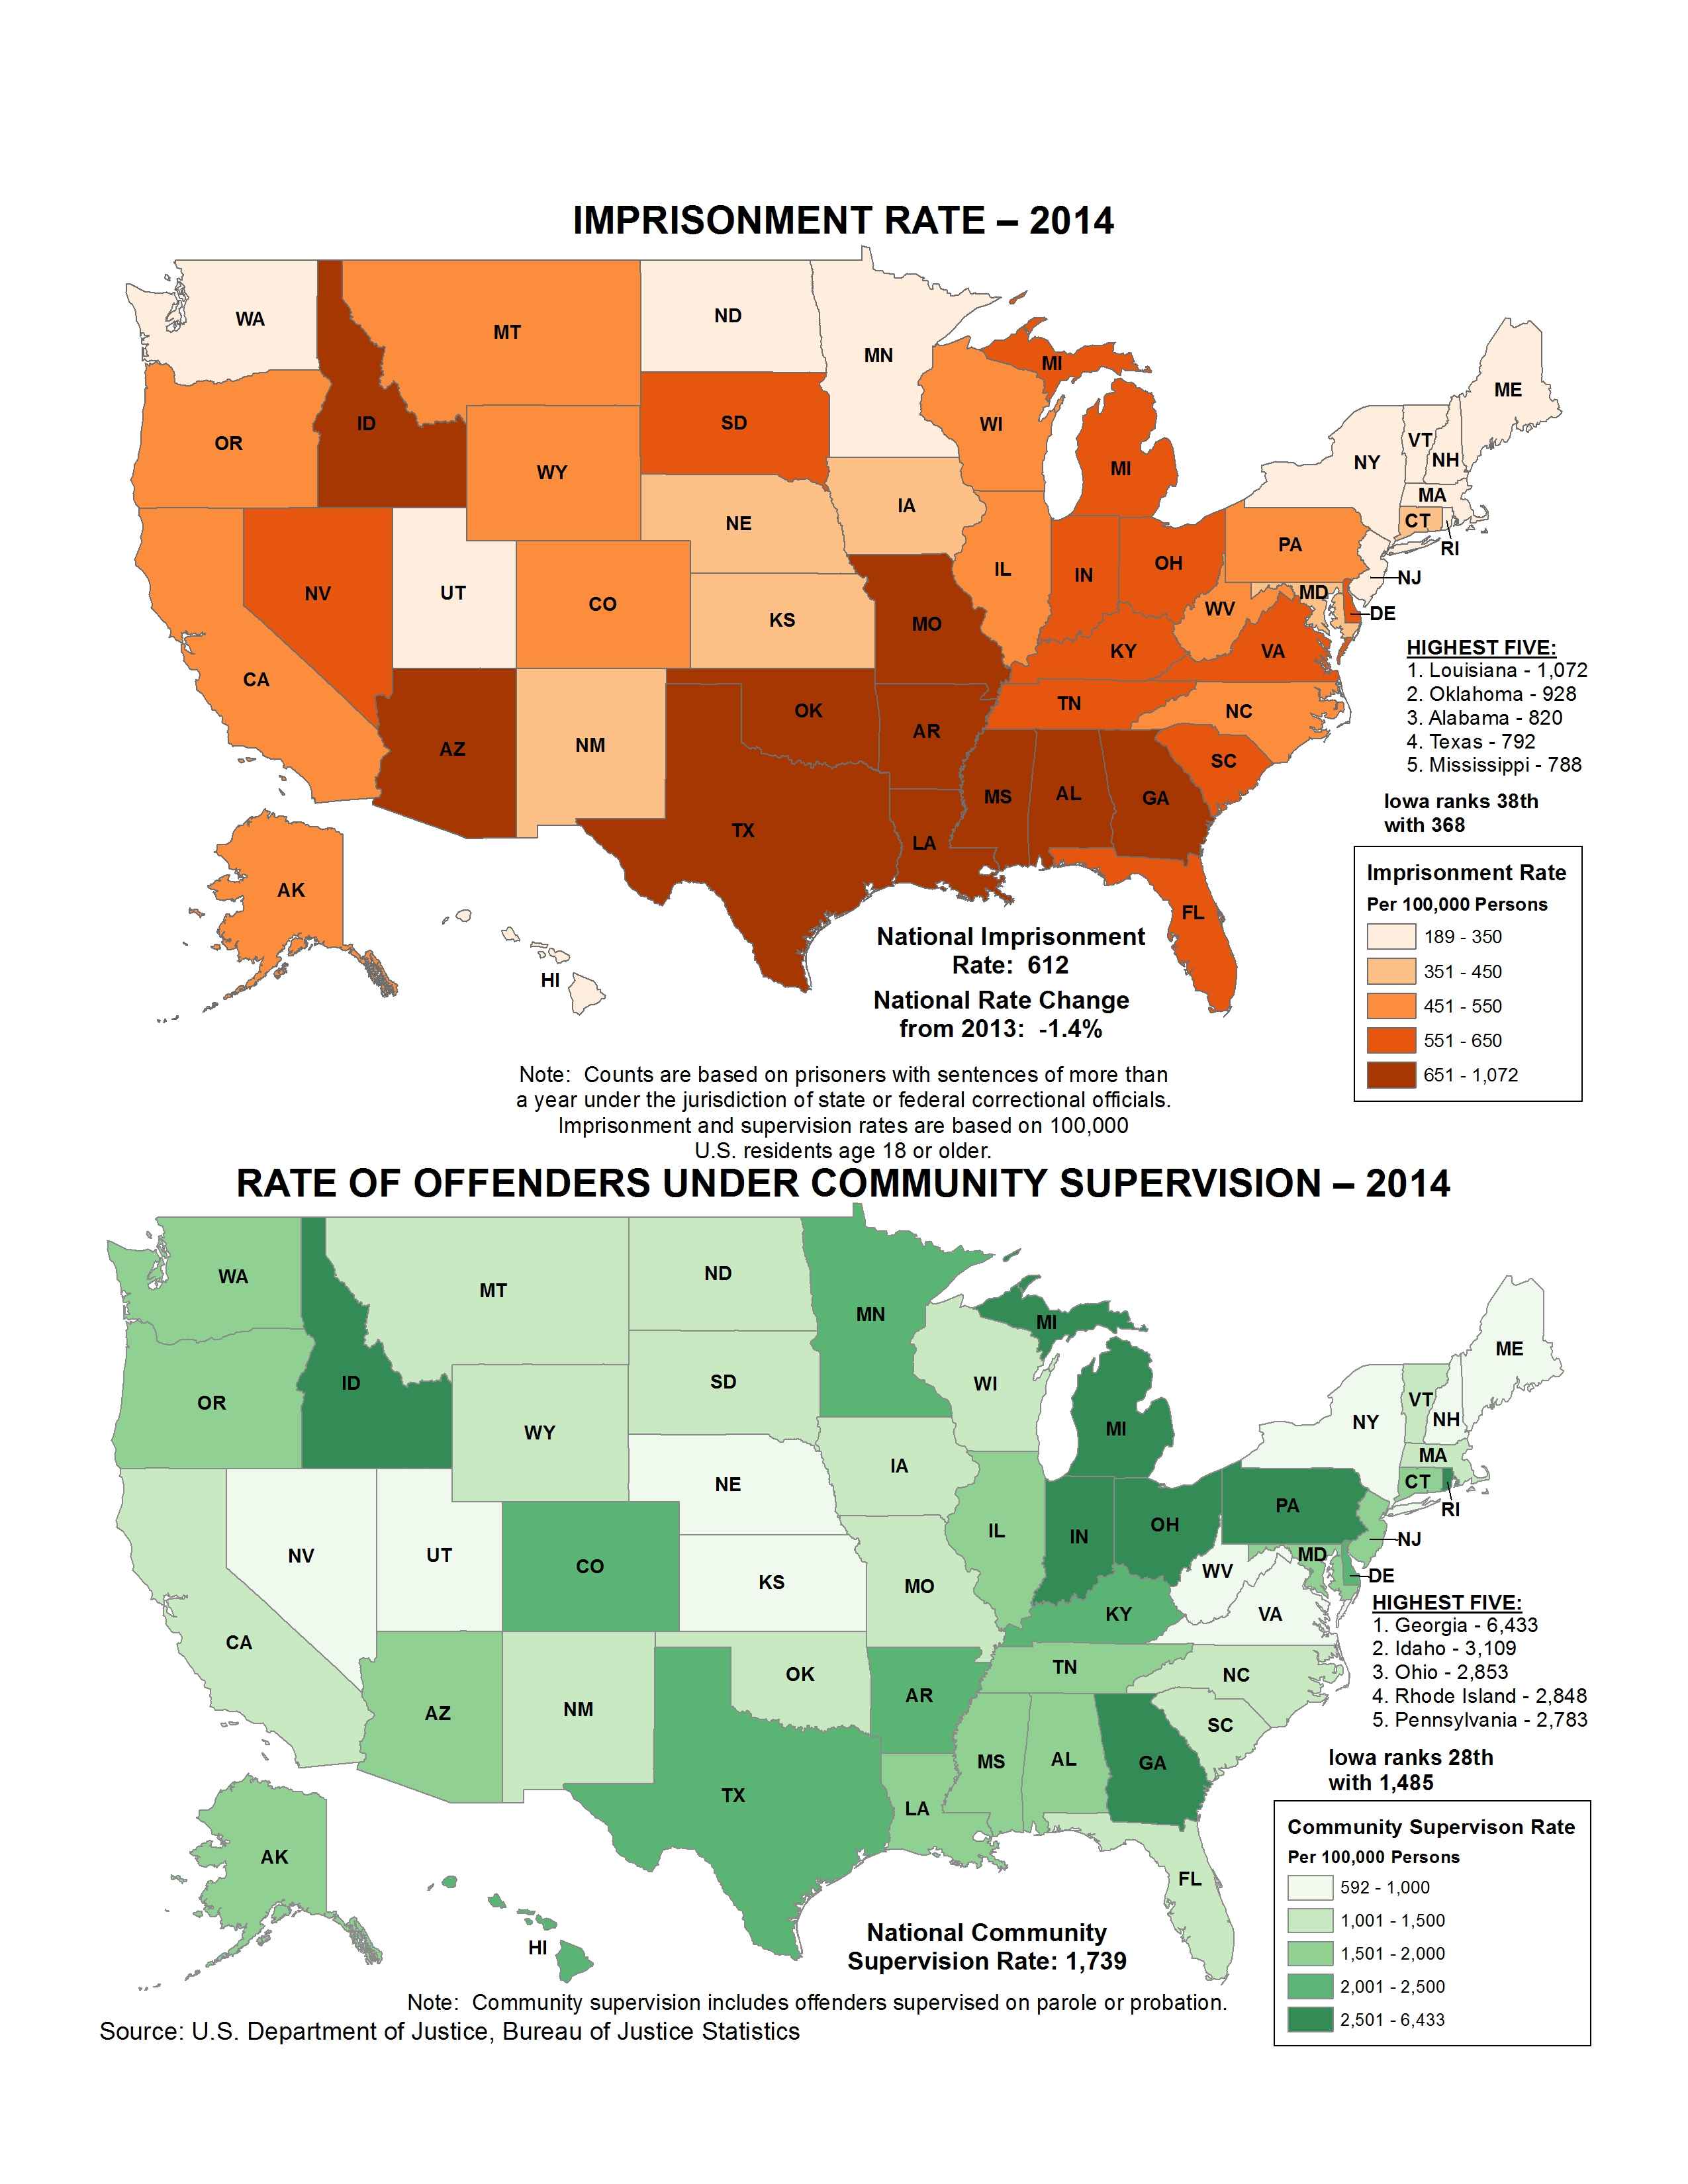
Imprisonment and Community Supervision
|
|
|
|
|
| 01/11/2016 |
Iowa Insights |
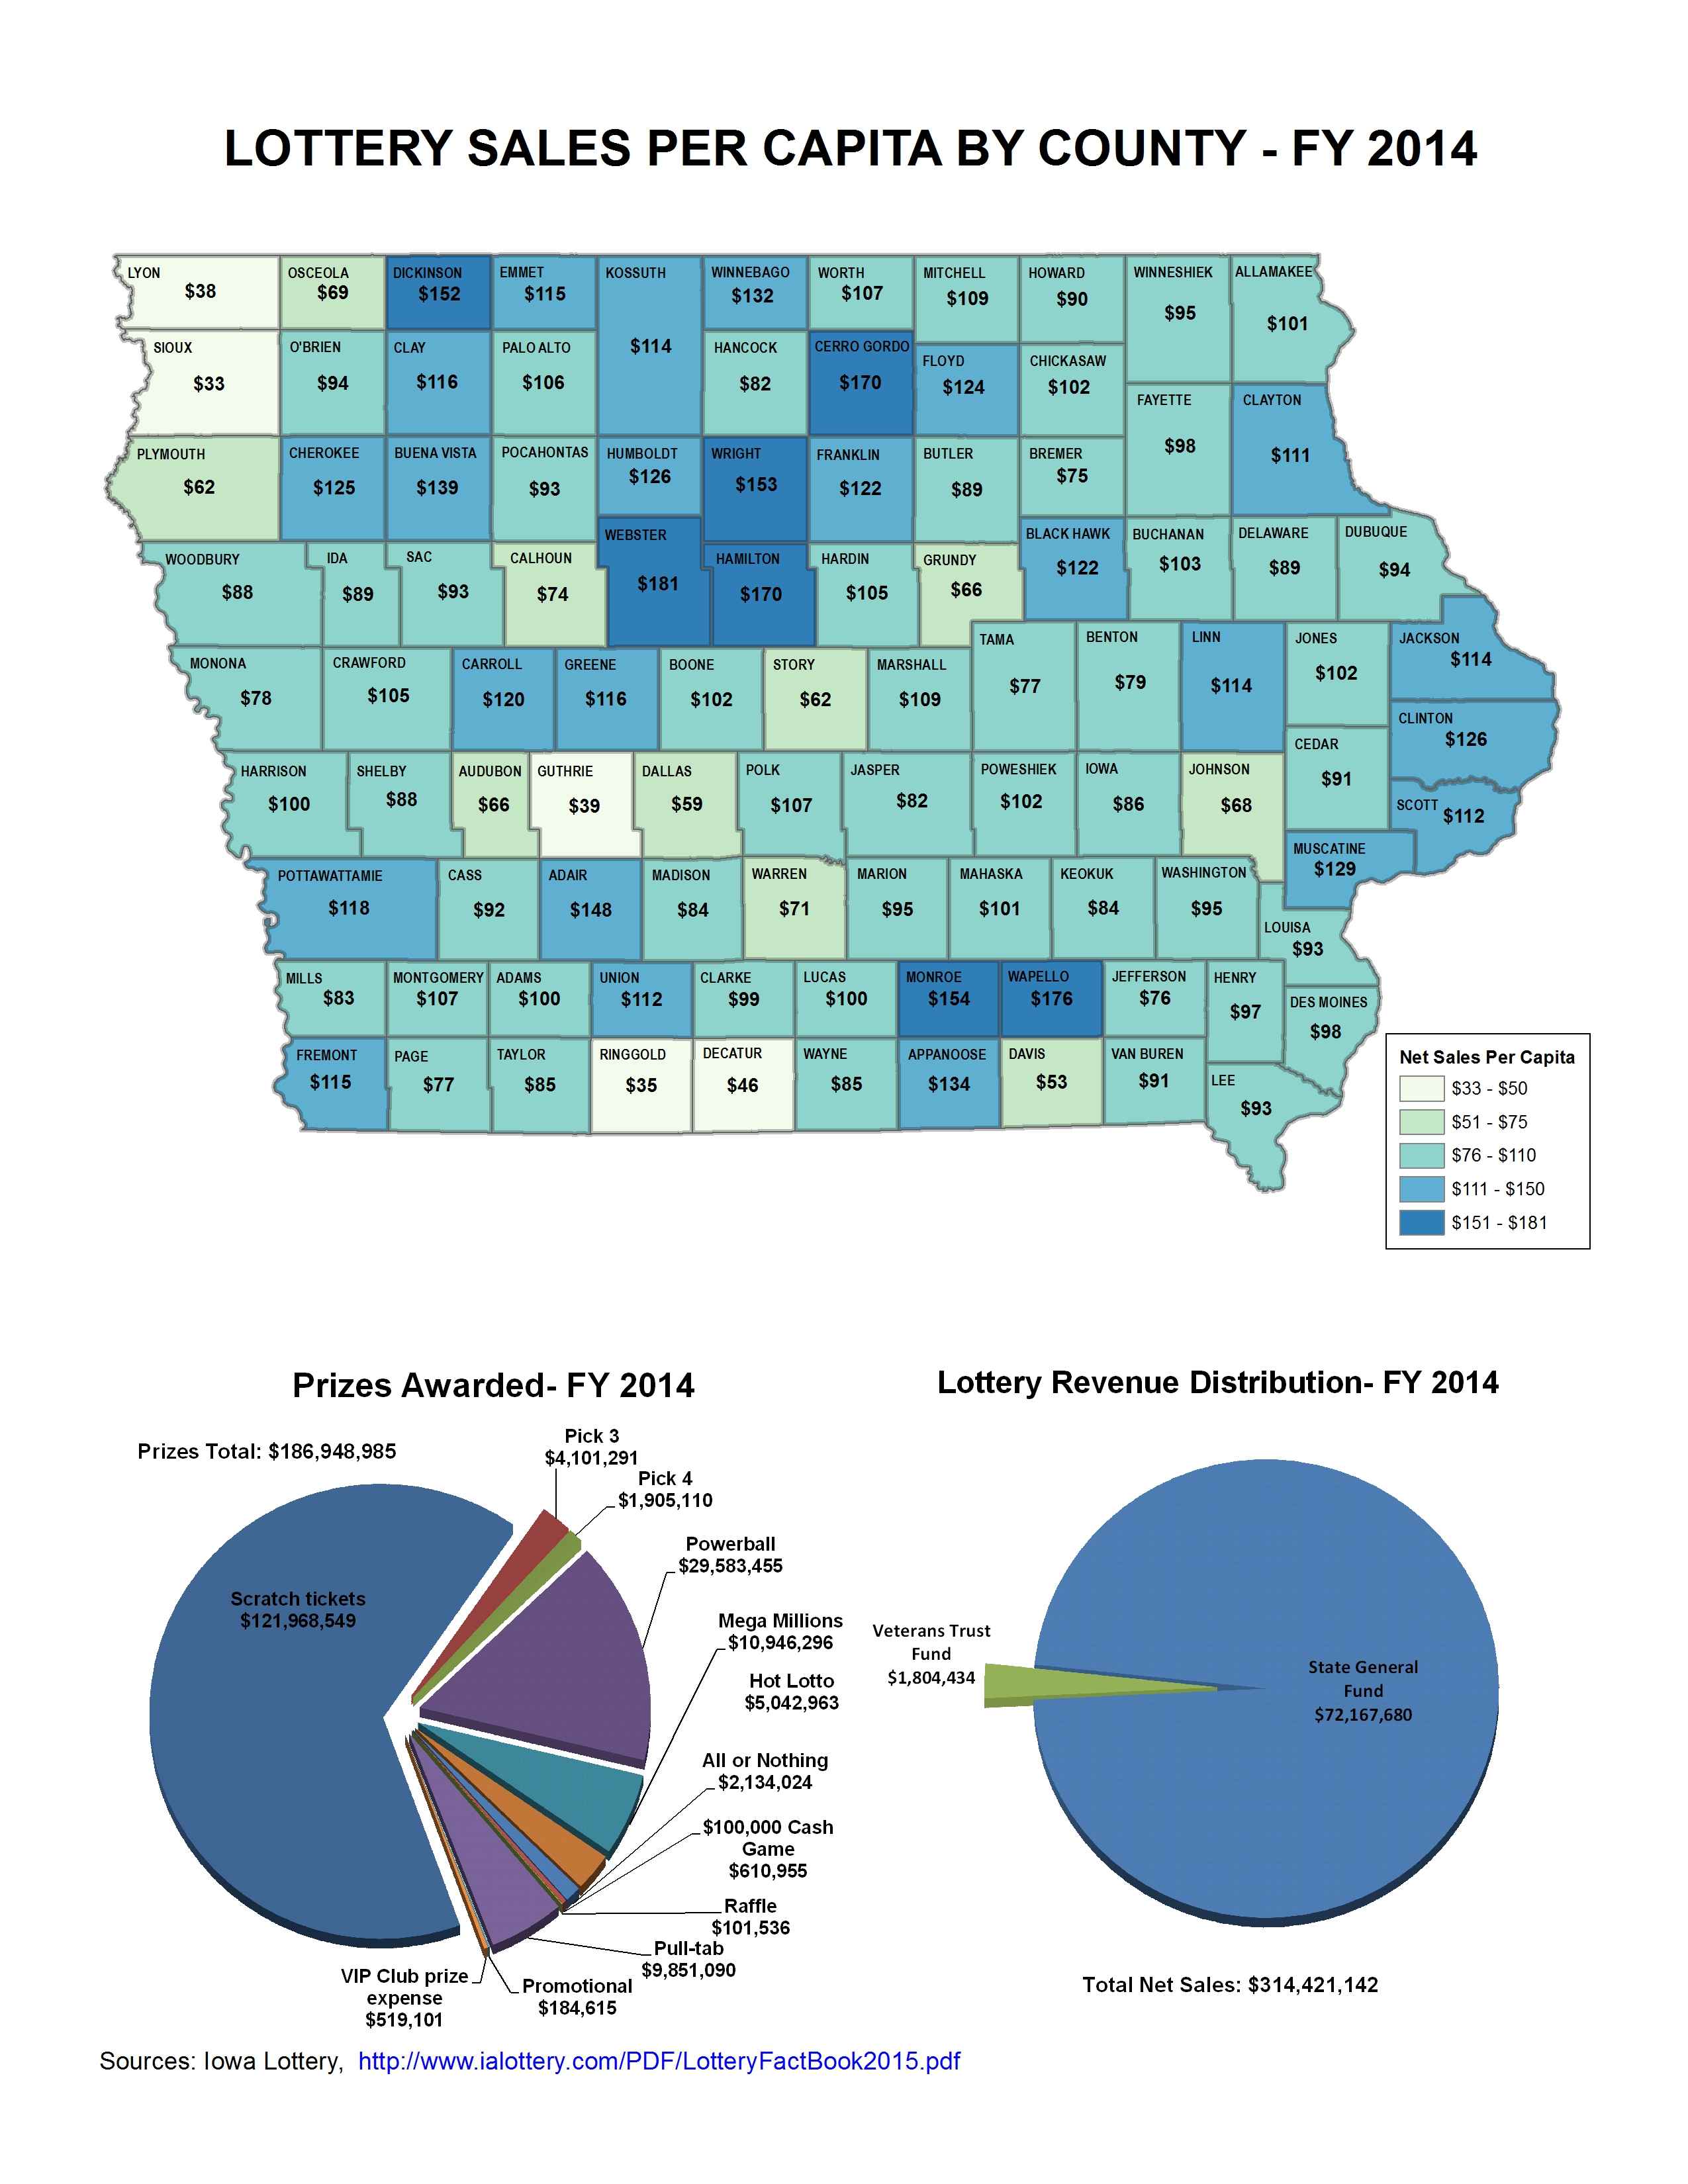
Lottery Sales Per Capita by County
|
|
|
|
|
| 01/04/2016 |
Iowa Insights |
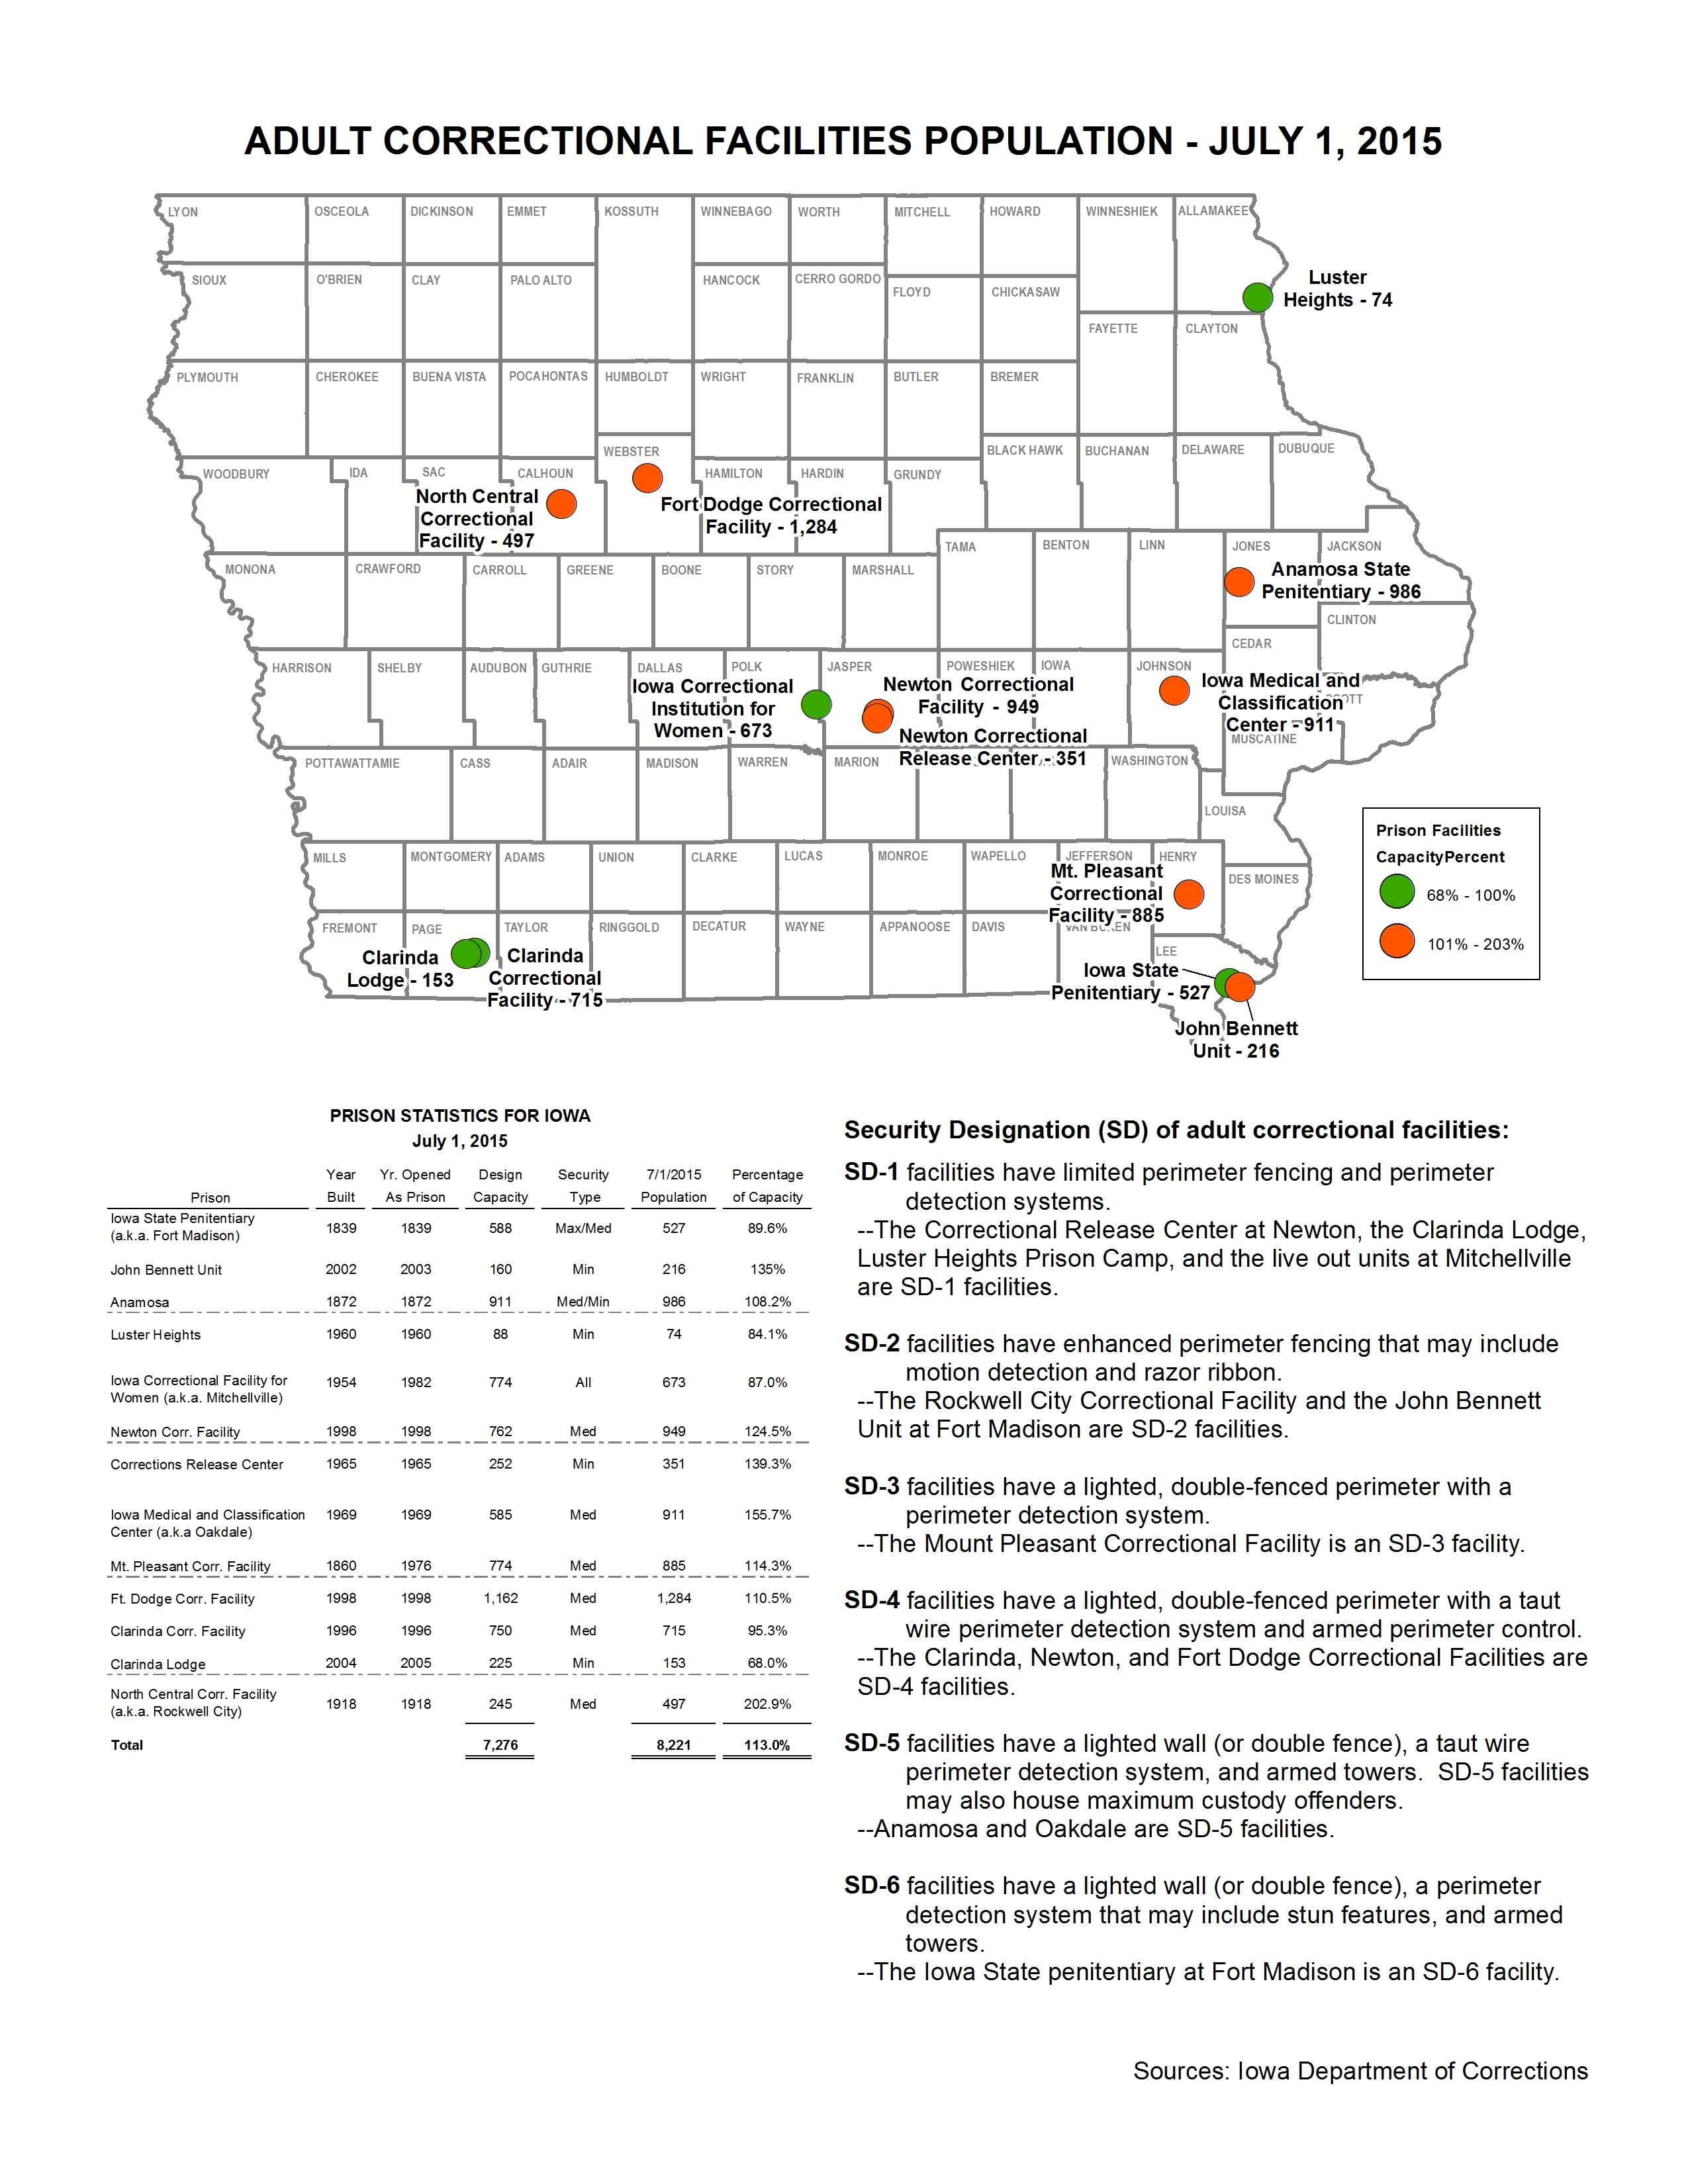
Adult Correctional Facilities Population - July 1, 2015
|
|
|
|
|
| 12/28/2015 |
Iowa Insights |
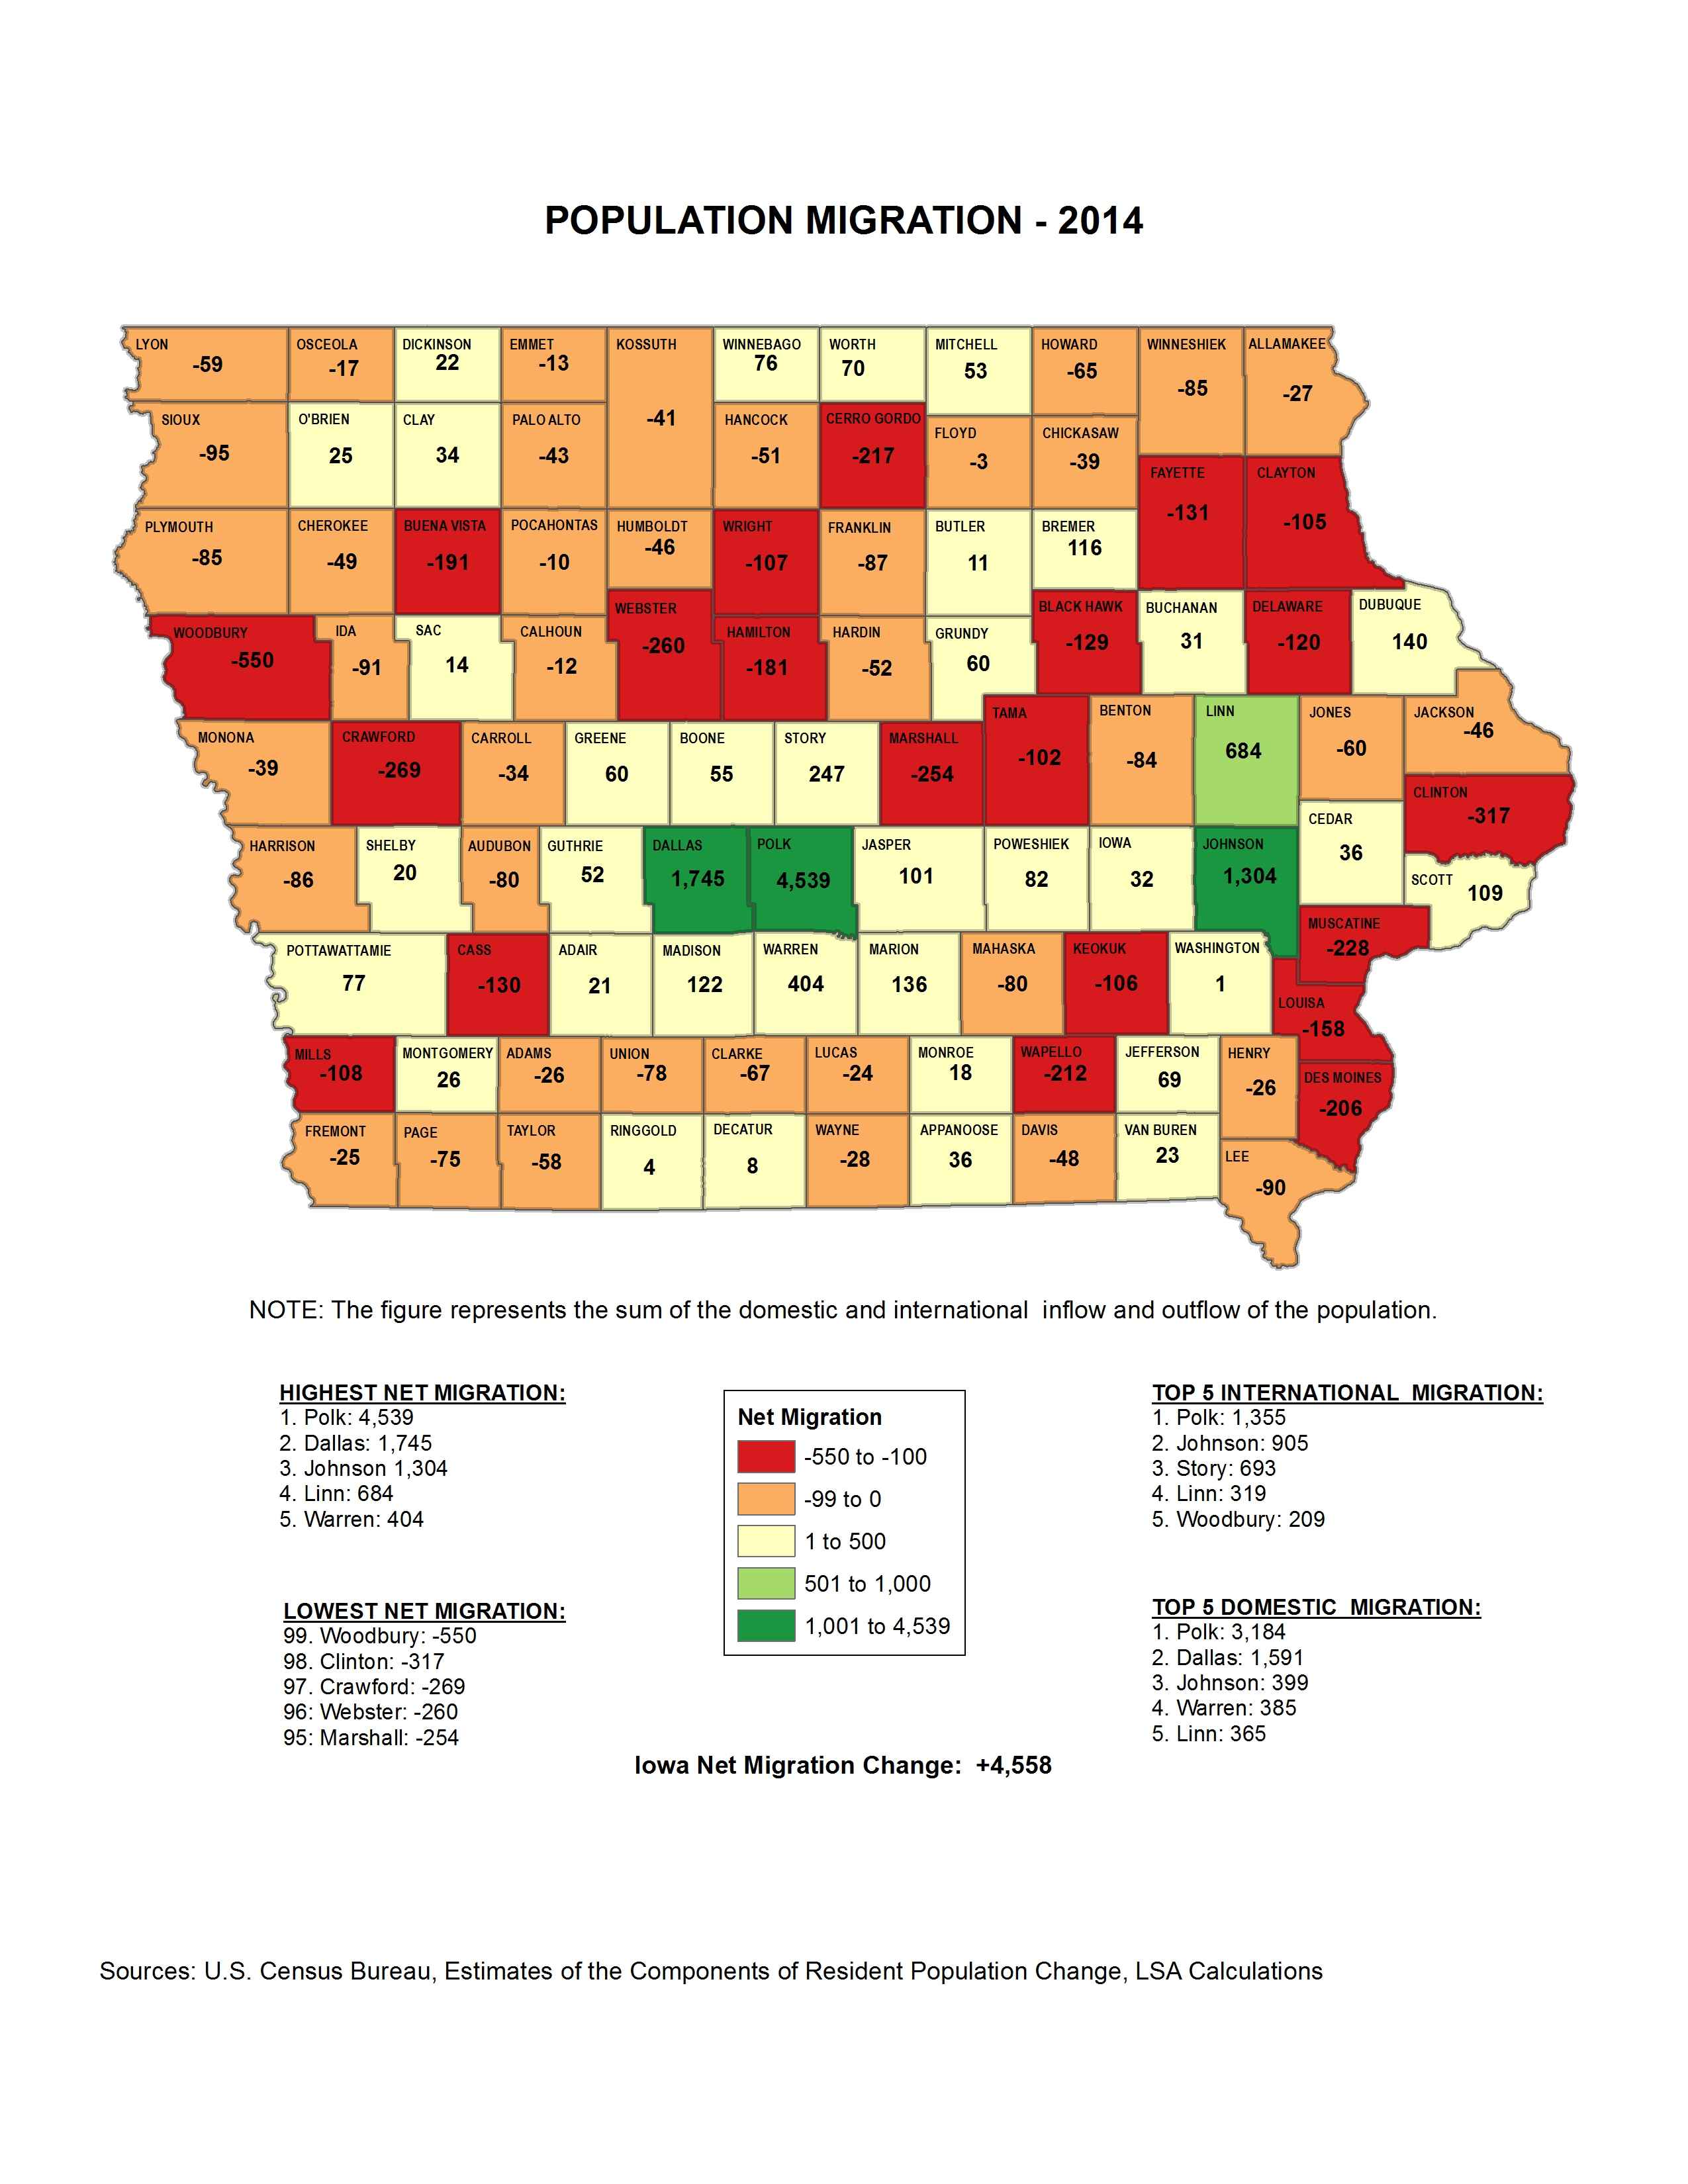
Population Migration - 2014
|
|
|
|
|
| 12/21/2015 |
Iowa Insights |
Median Age

|
|
|
|
|
| 12/14/2015 |
Iowa Insights |
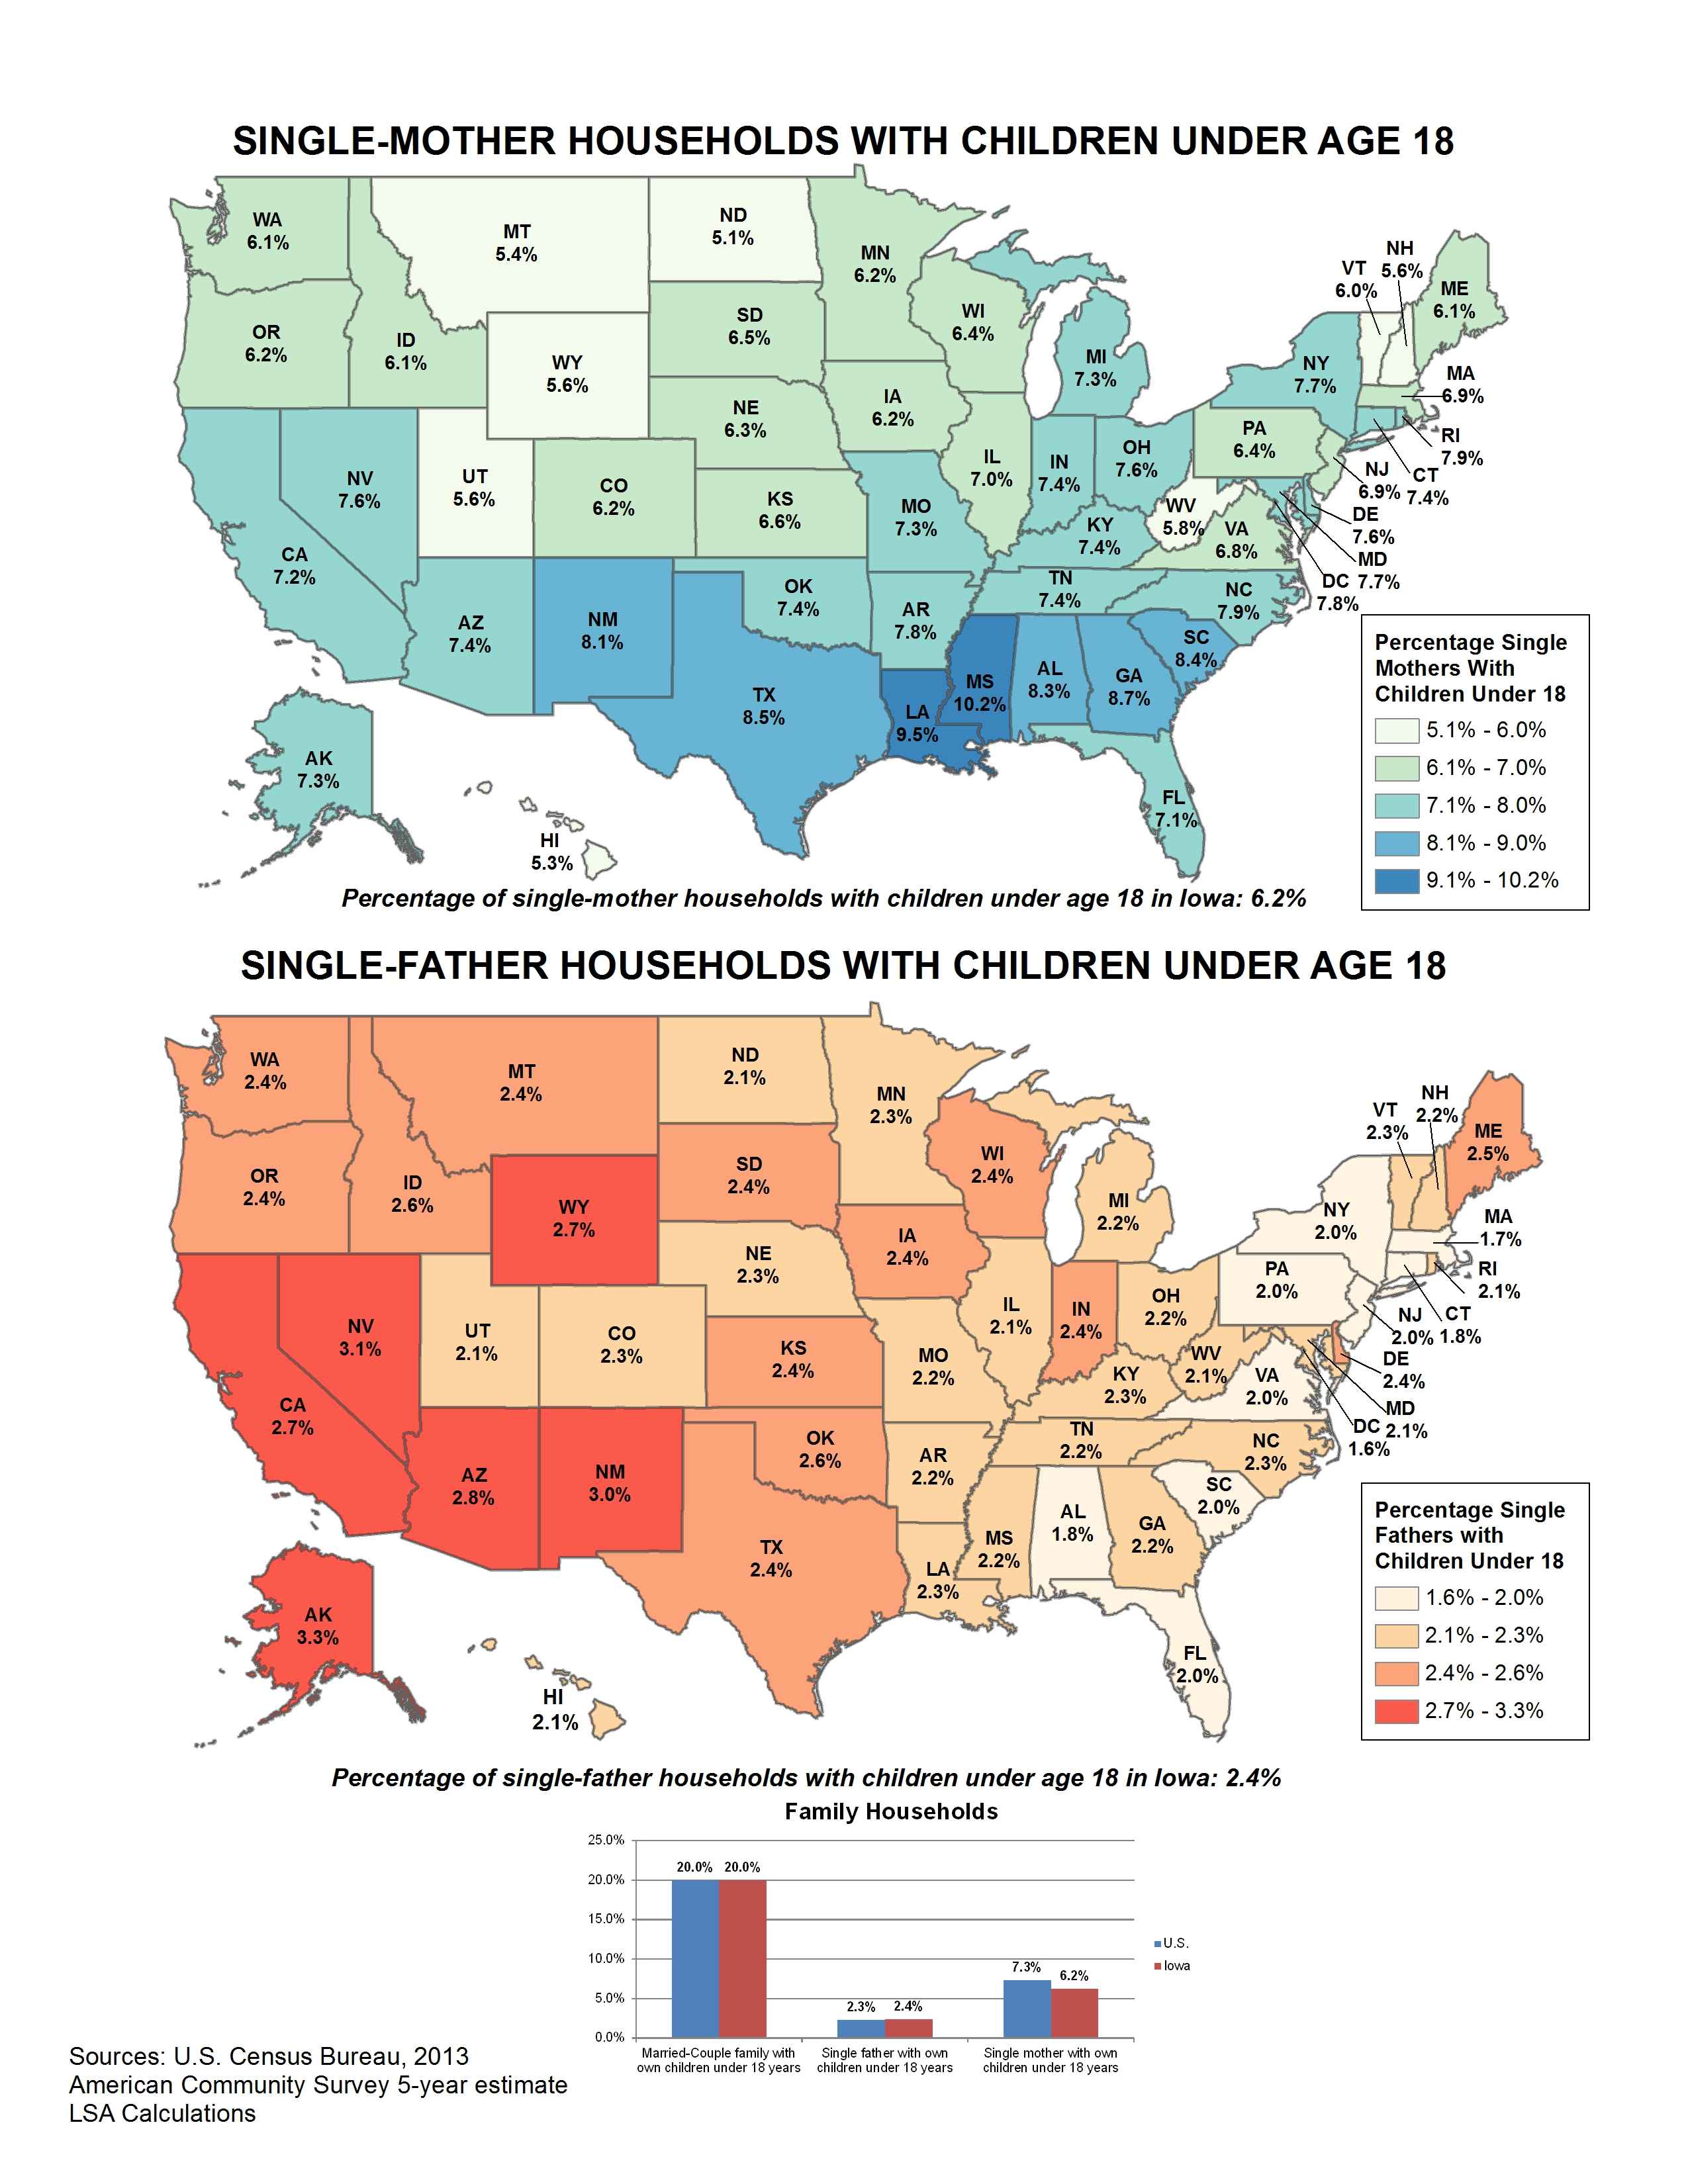
Single Parent Households with Children Under Age 18
|
|
|
|
|
| 12/07/2015 |
Iowa Insights |
Labor Force Participation Rate

|
|
|
|
|
| 11/30/2015 |
Iowa Insights |
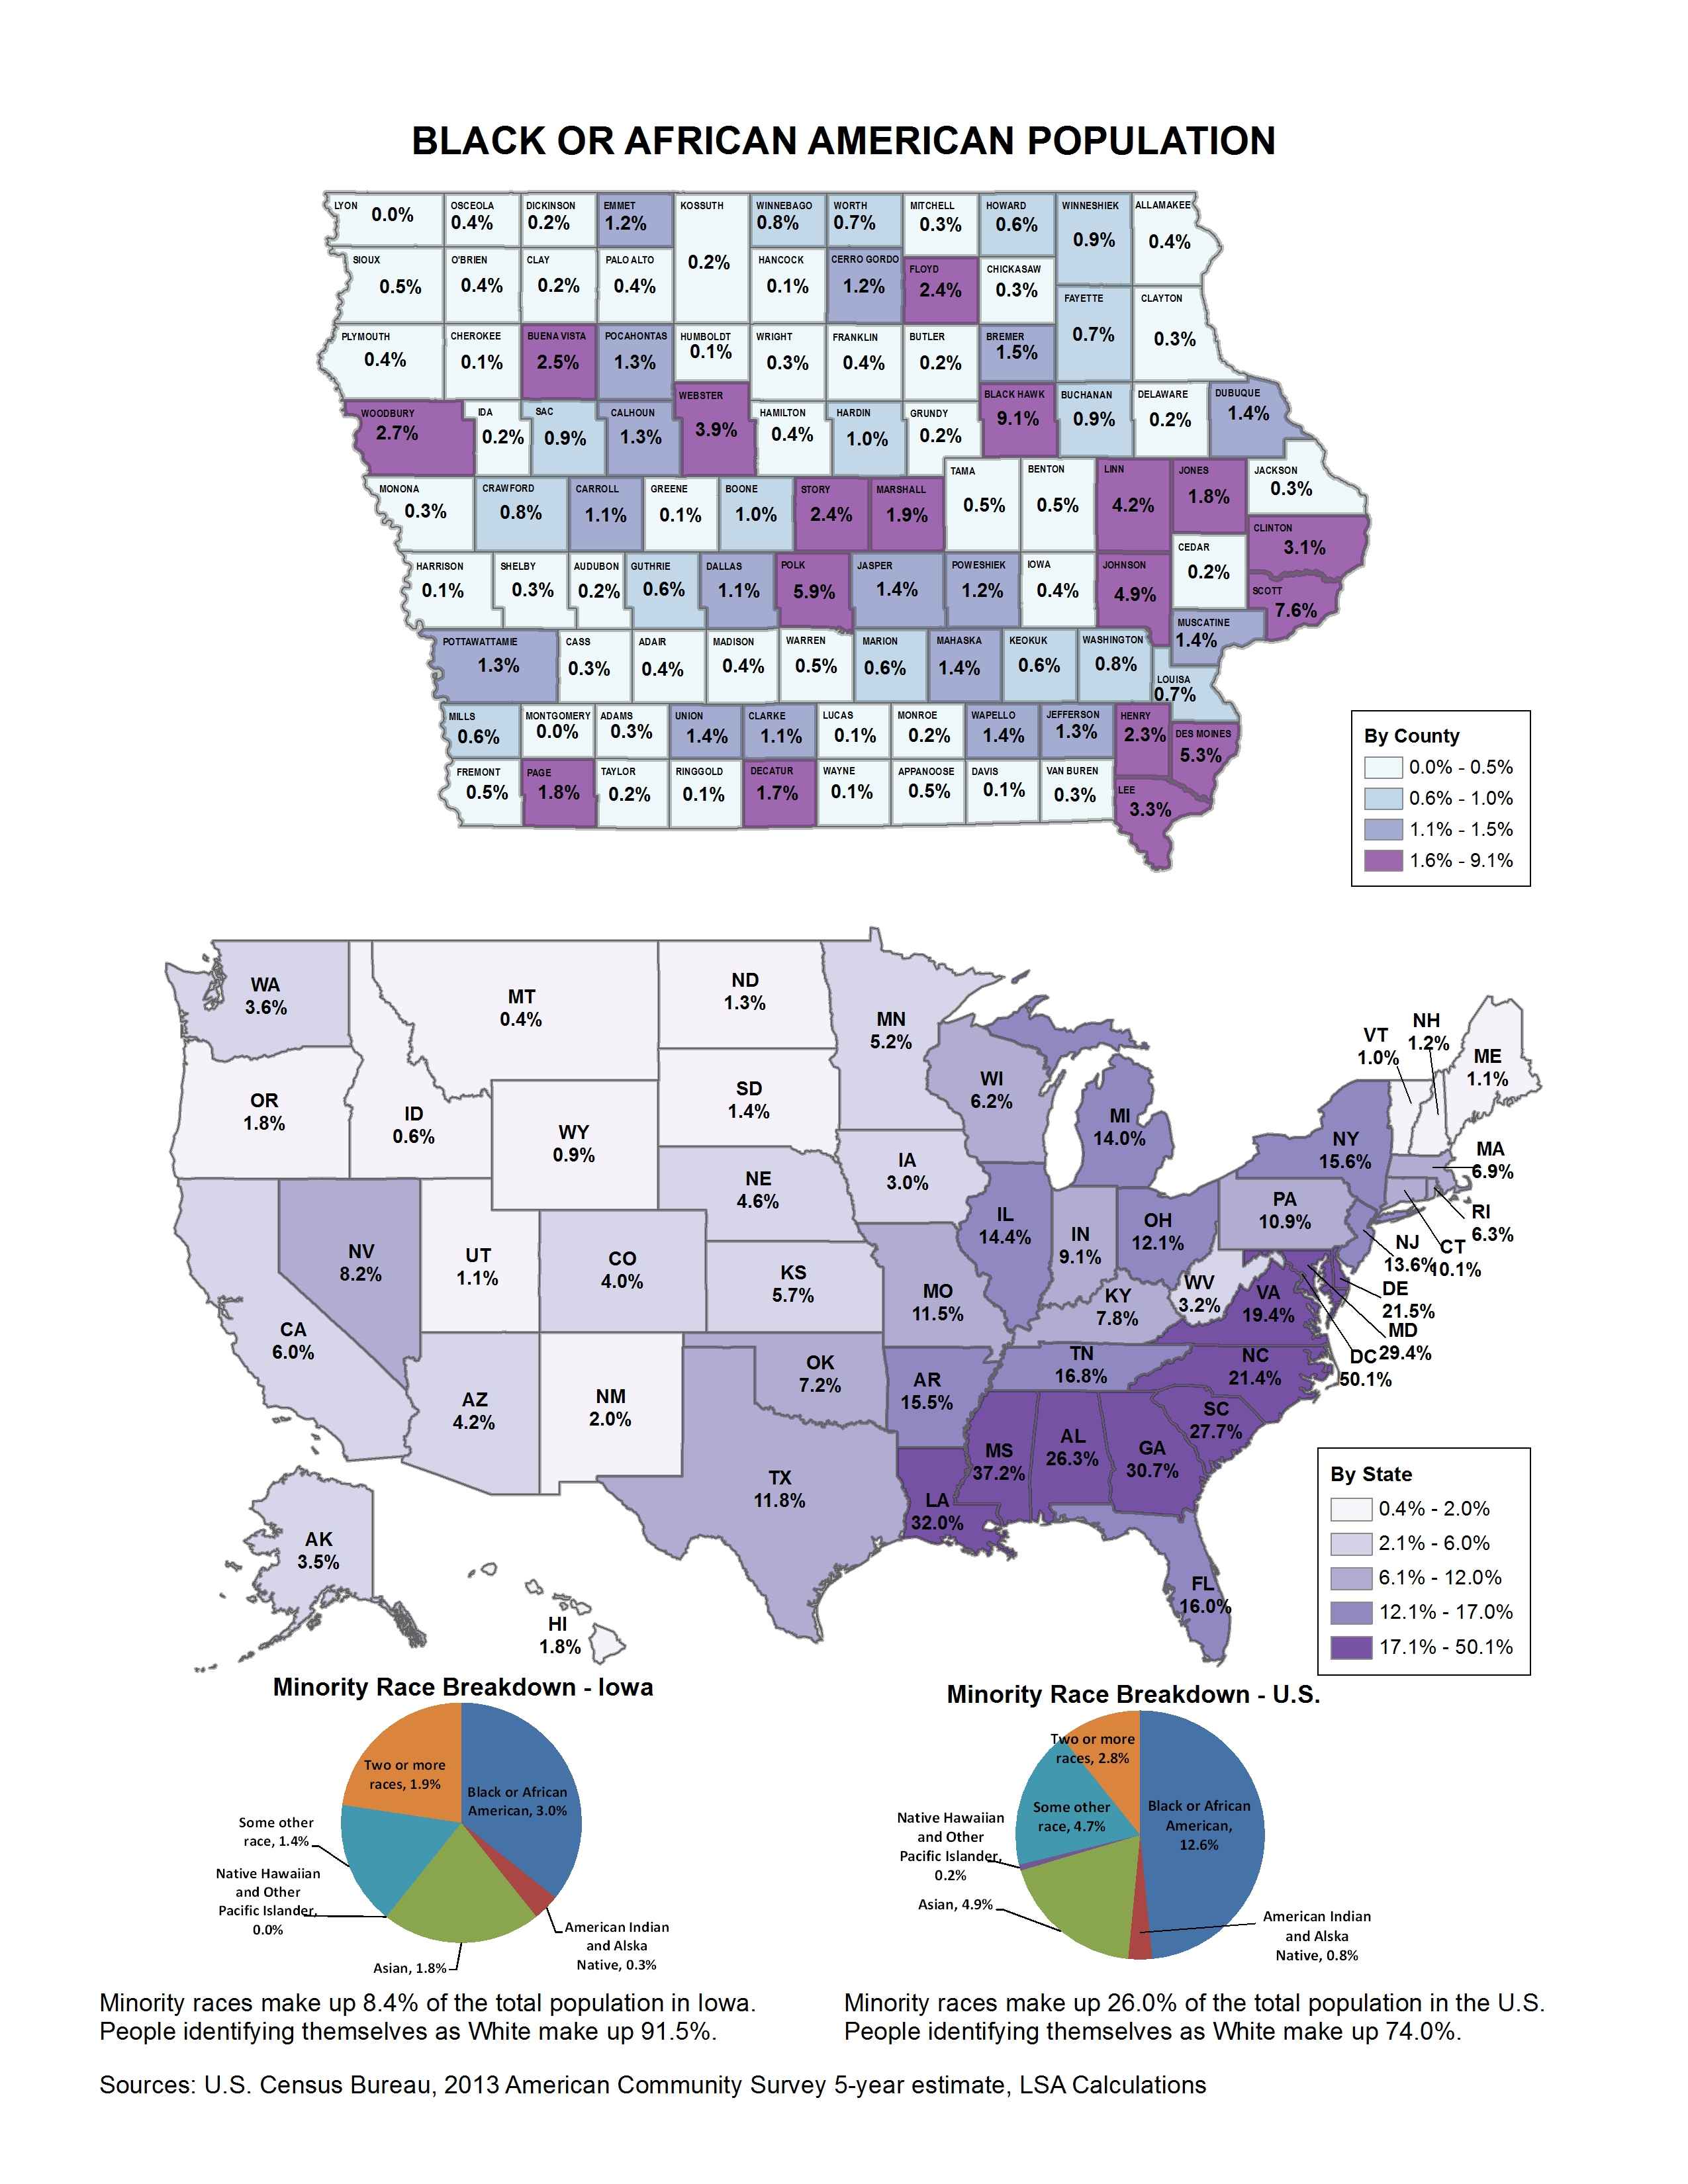
Black or African American Population
|
|
|
|
|
| 11/23/2015 |
Iowa Insights |
Hispanic or Latino Population

|
|
|
|
|
| 11/16/2015 |
Iowa Insights |
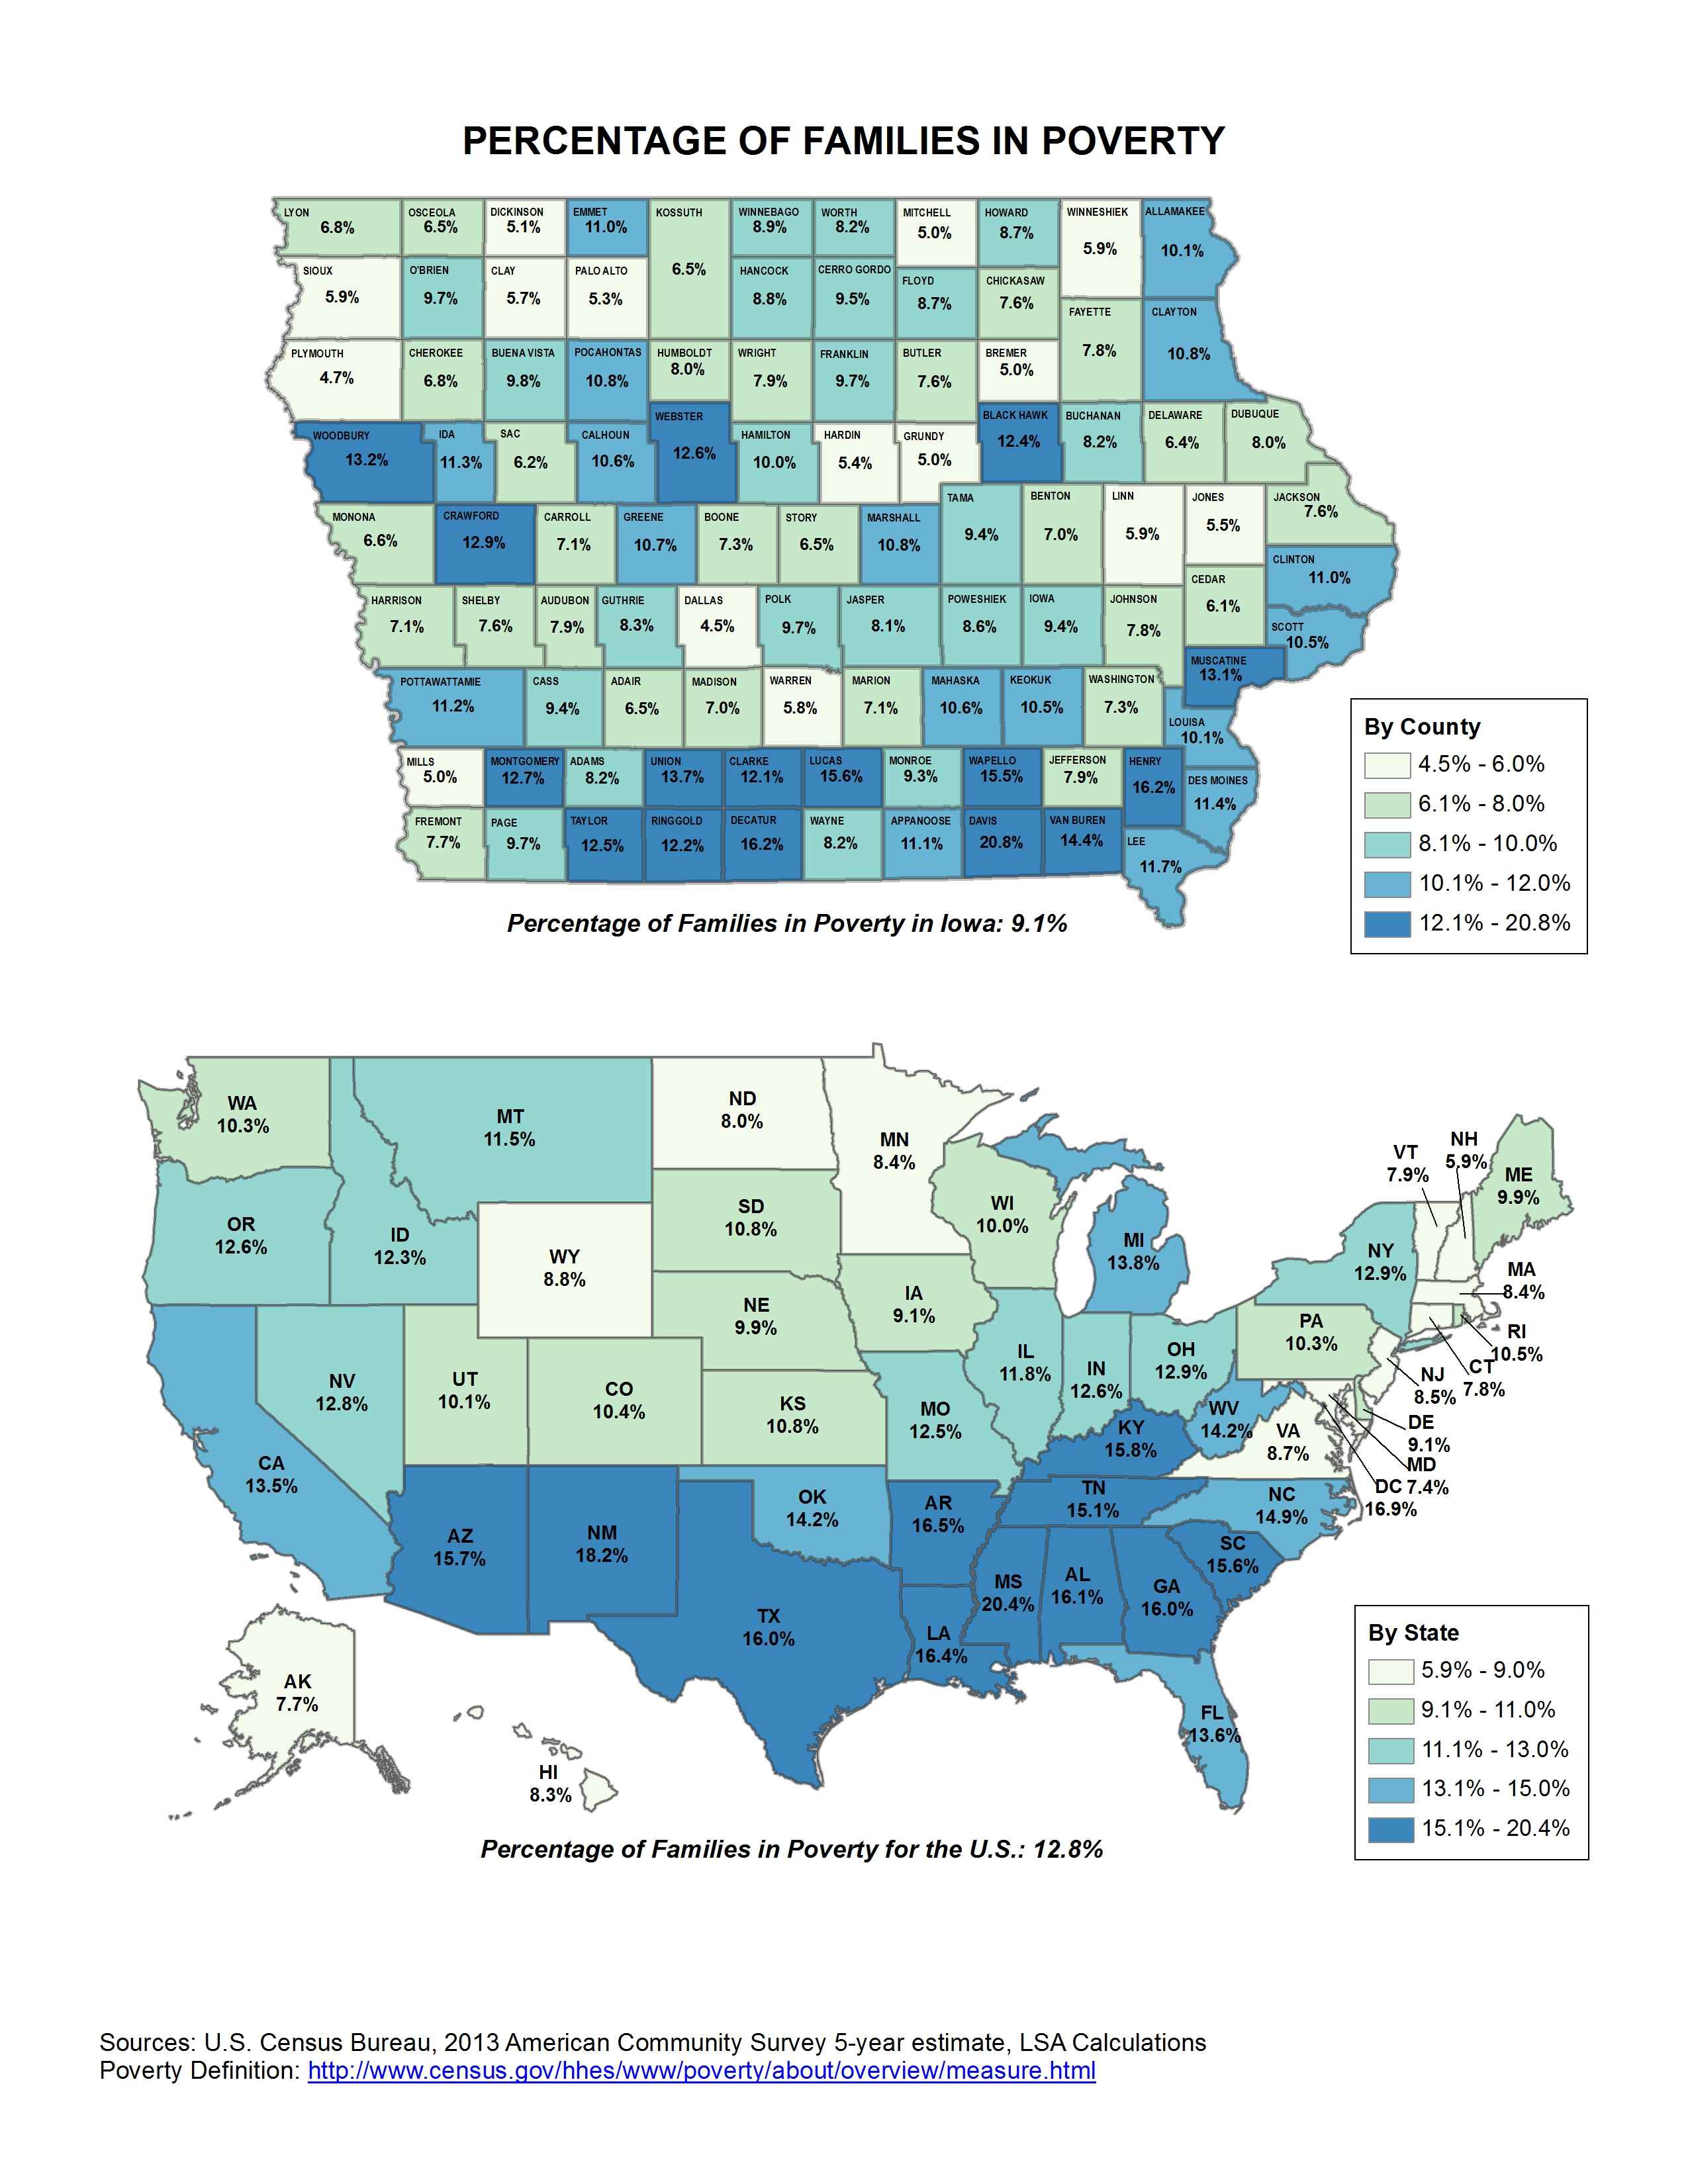
Percentage of Families in Poverty
|
|
|
|
|
| 11/09/2015 |
Iowa Insights |
Patients Seeking Care at VA Health Facilities By County - FY 2014

|
|
|
|
|
| 11/02/2015 |
Iowa Insights |
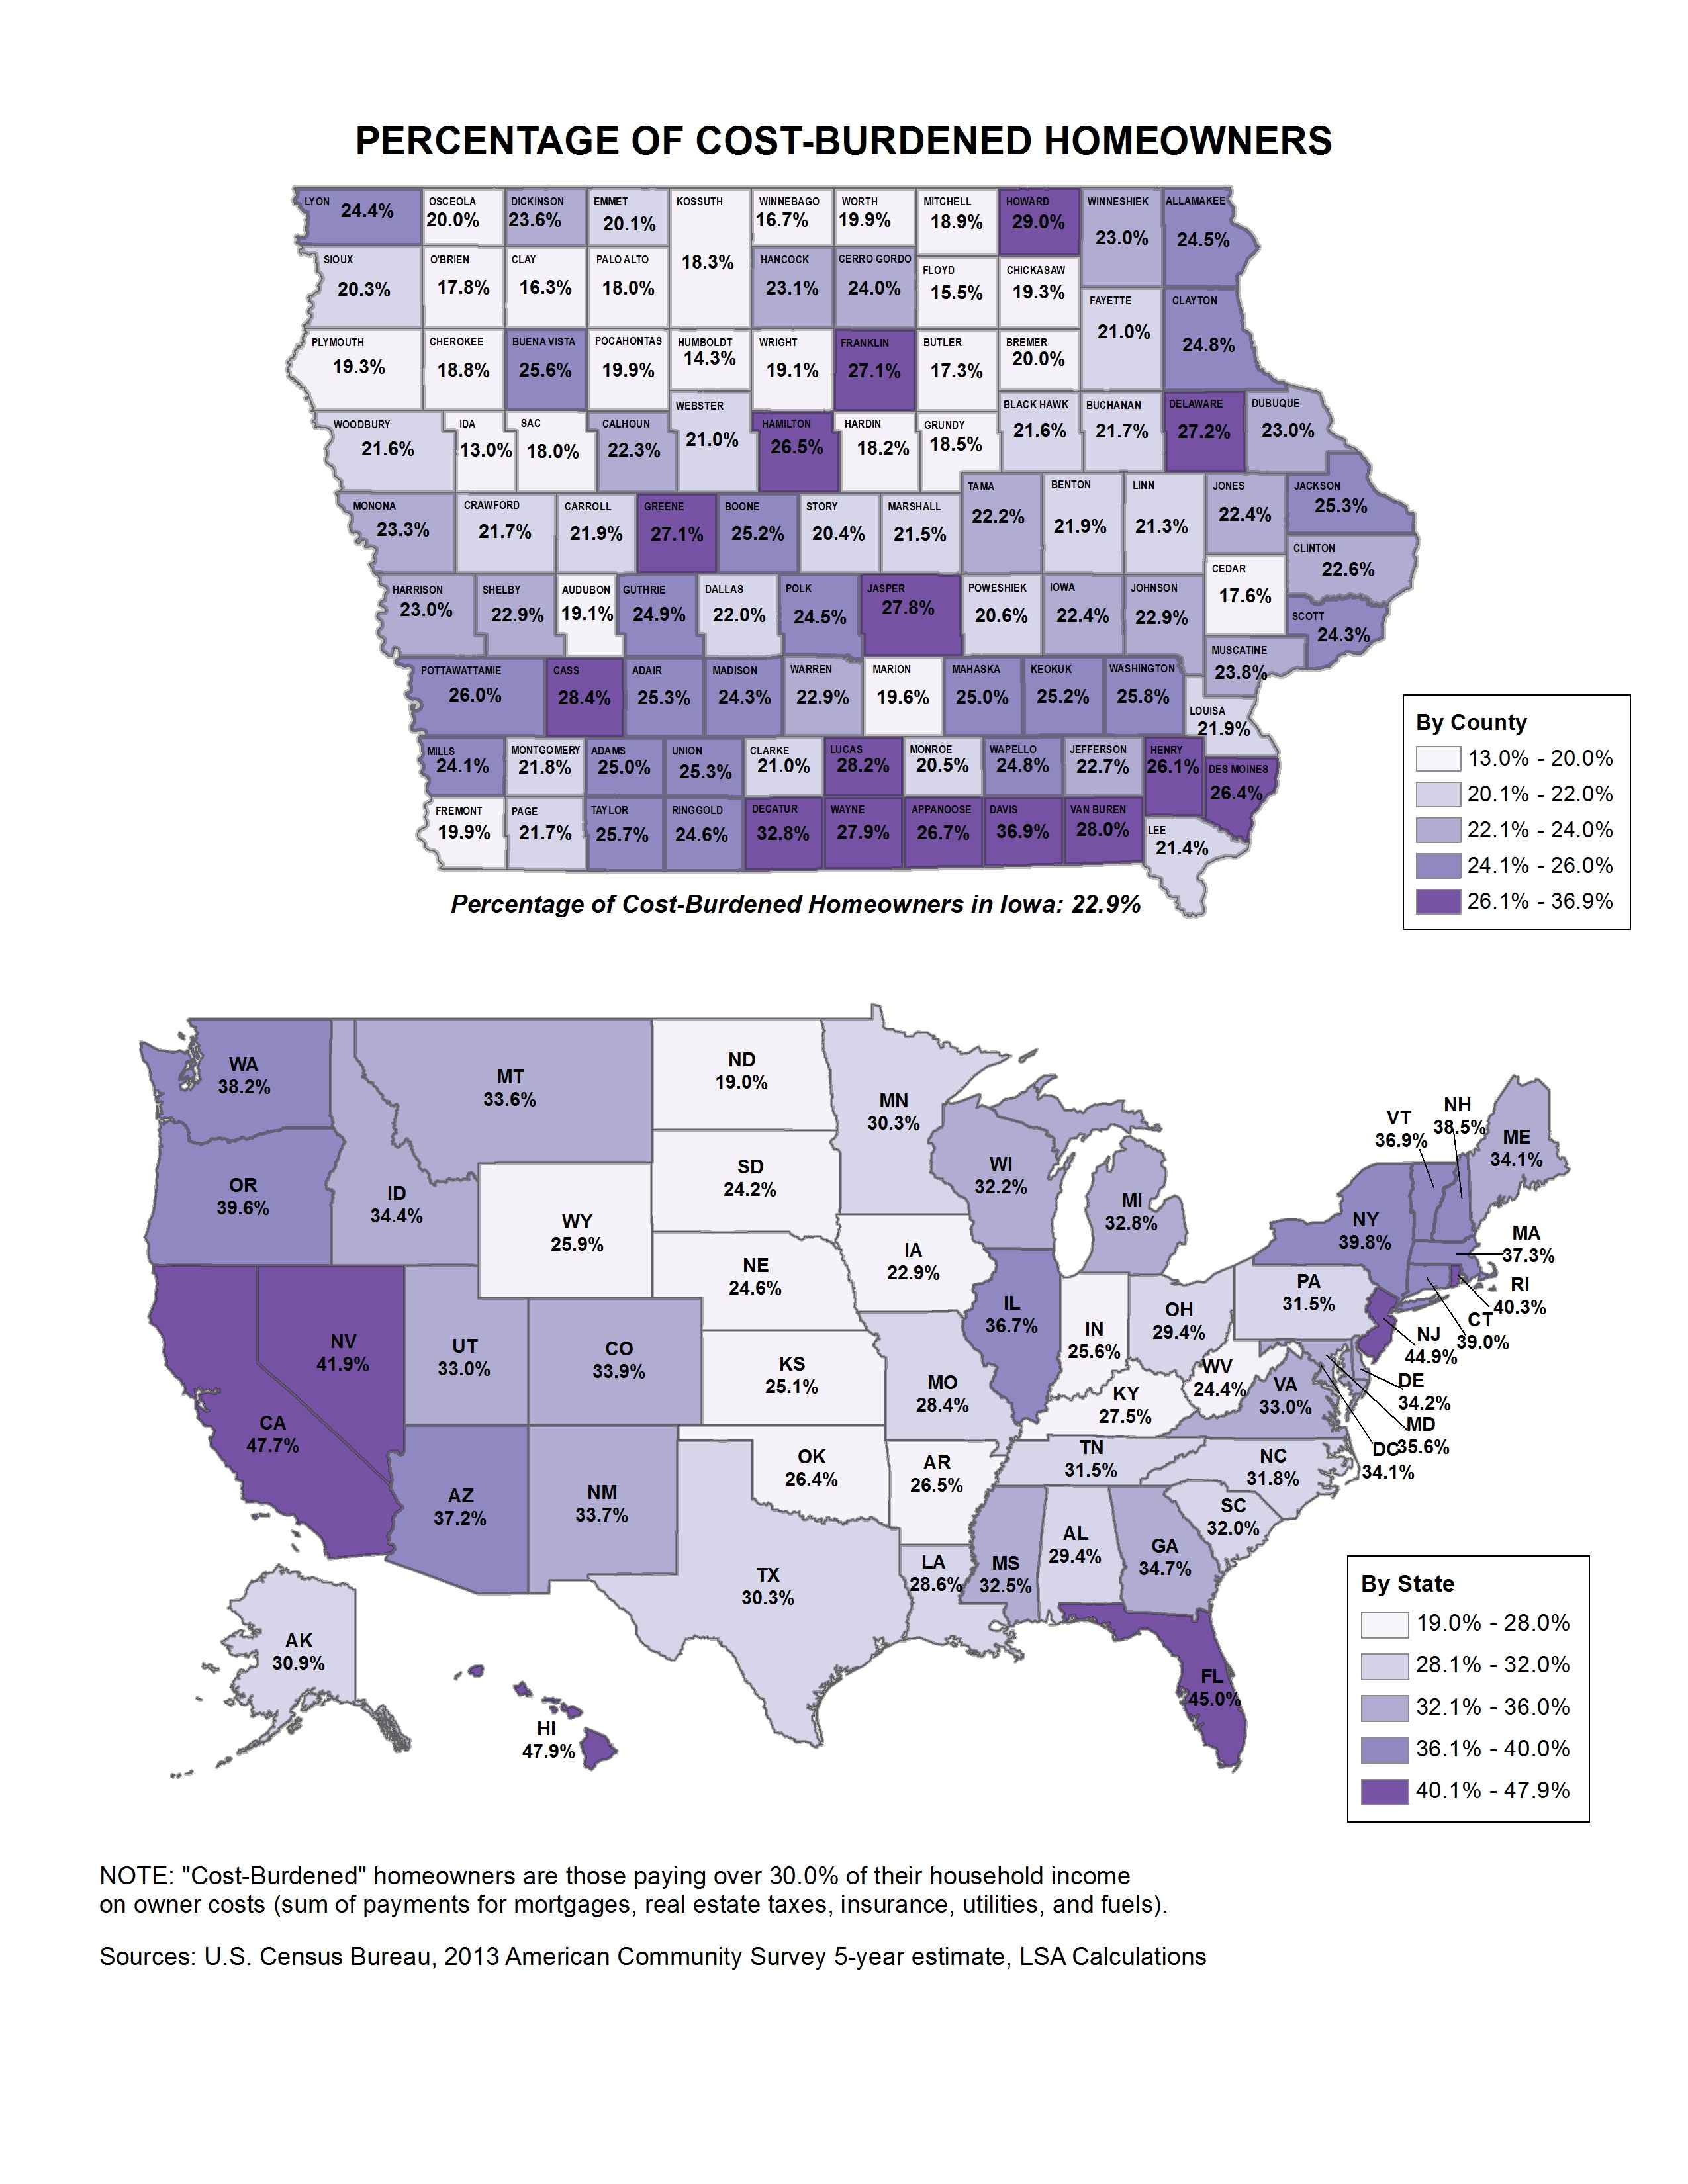
Percentage of Cost-Burdened Homeowners
|
|
|
|
|
| 10/19/2015 |
Iowa Insights |
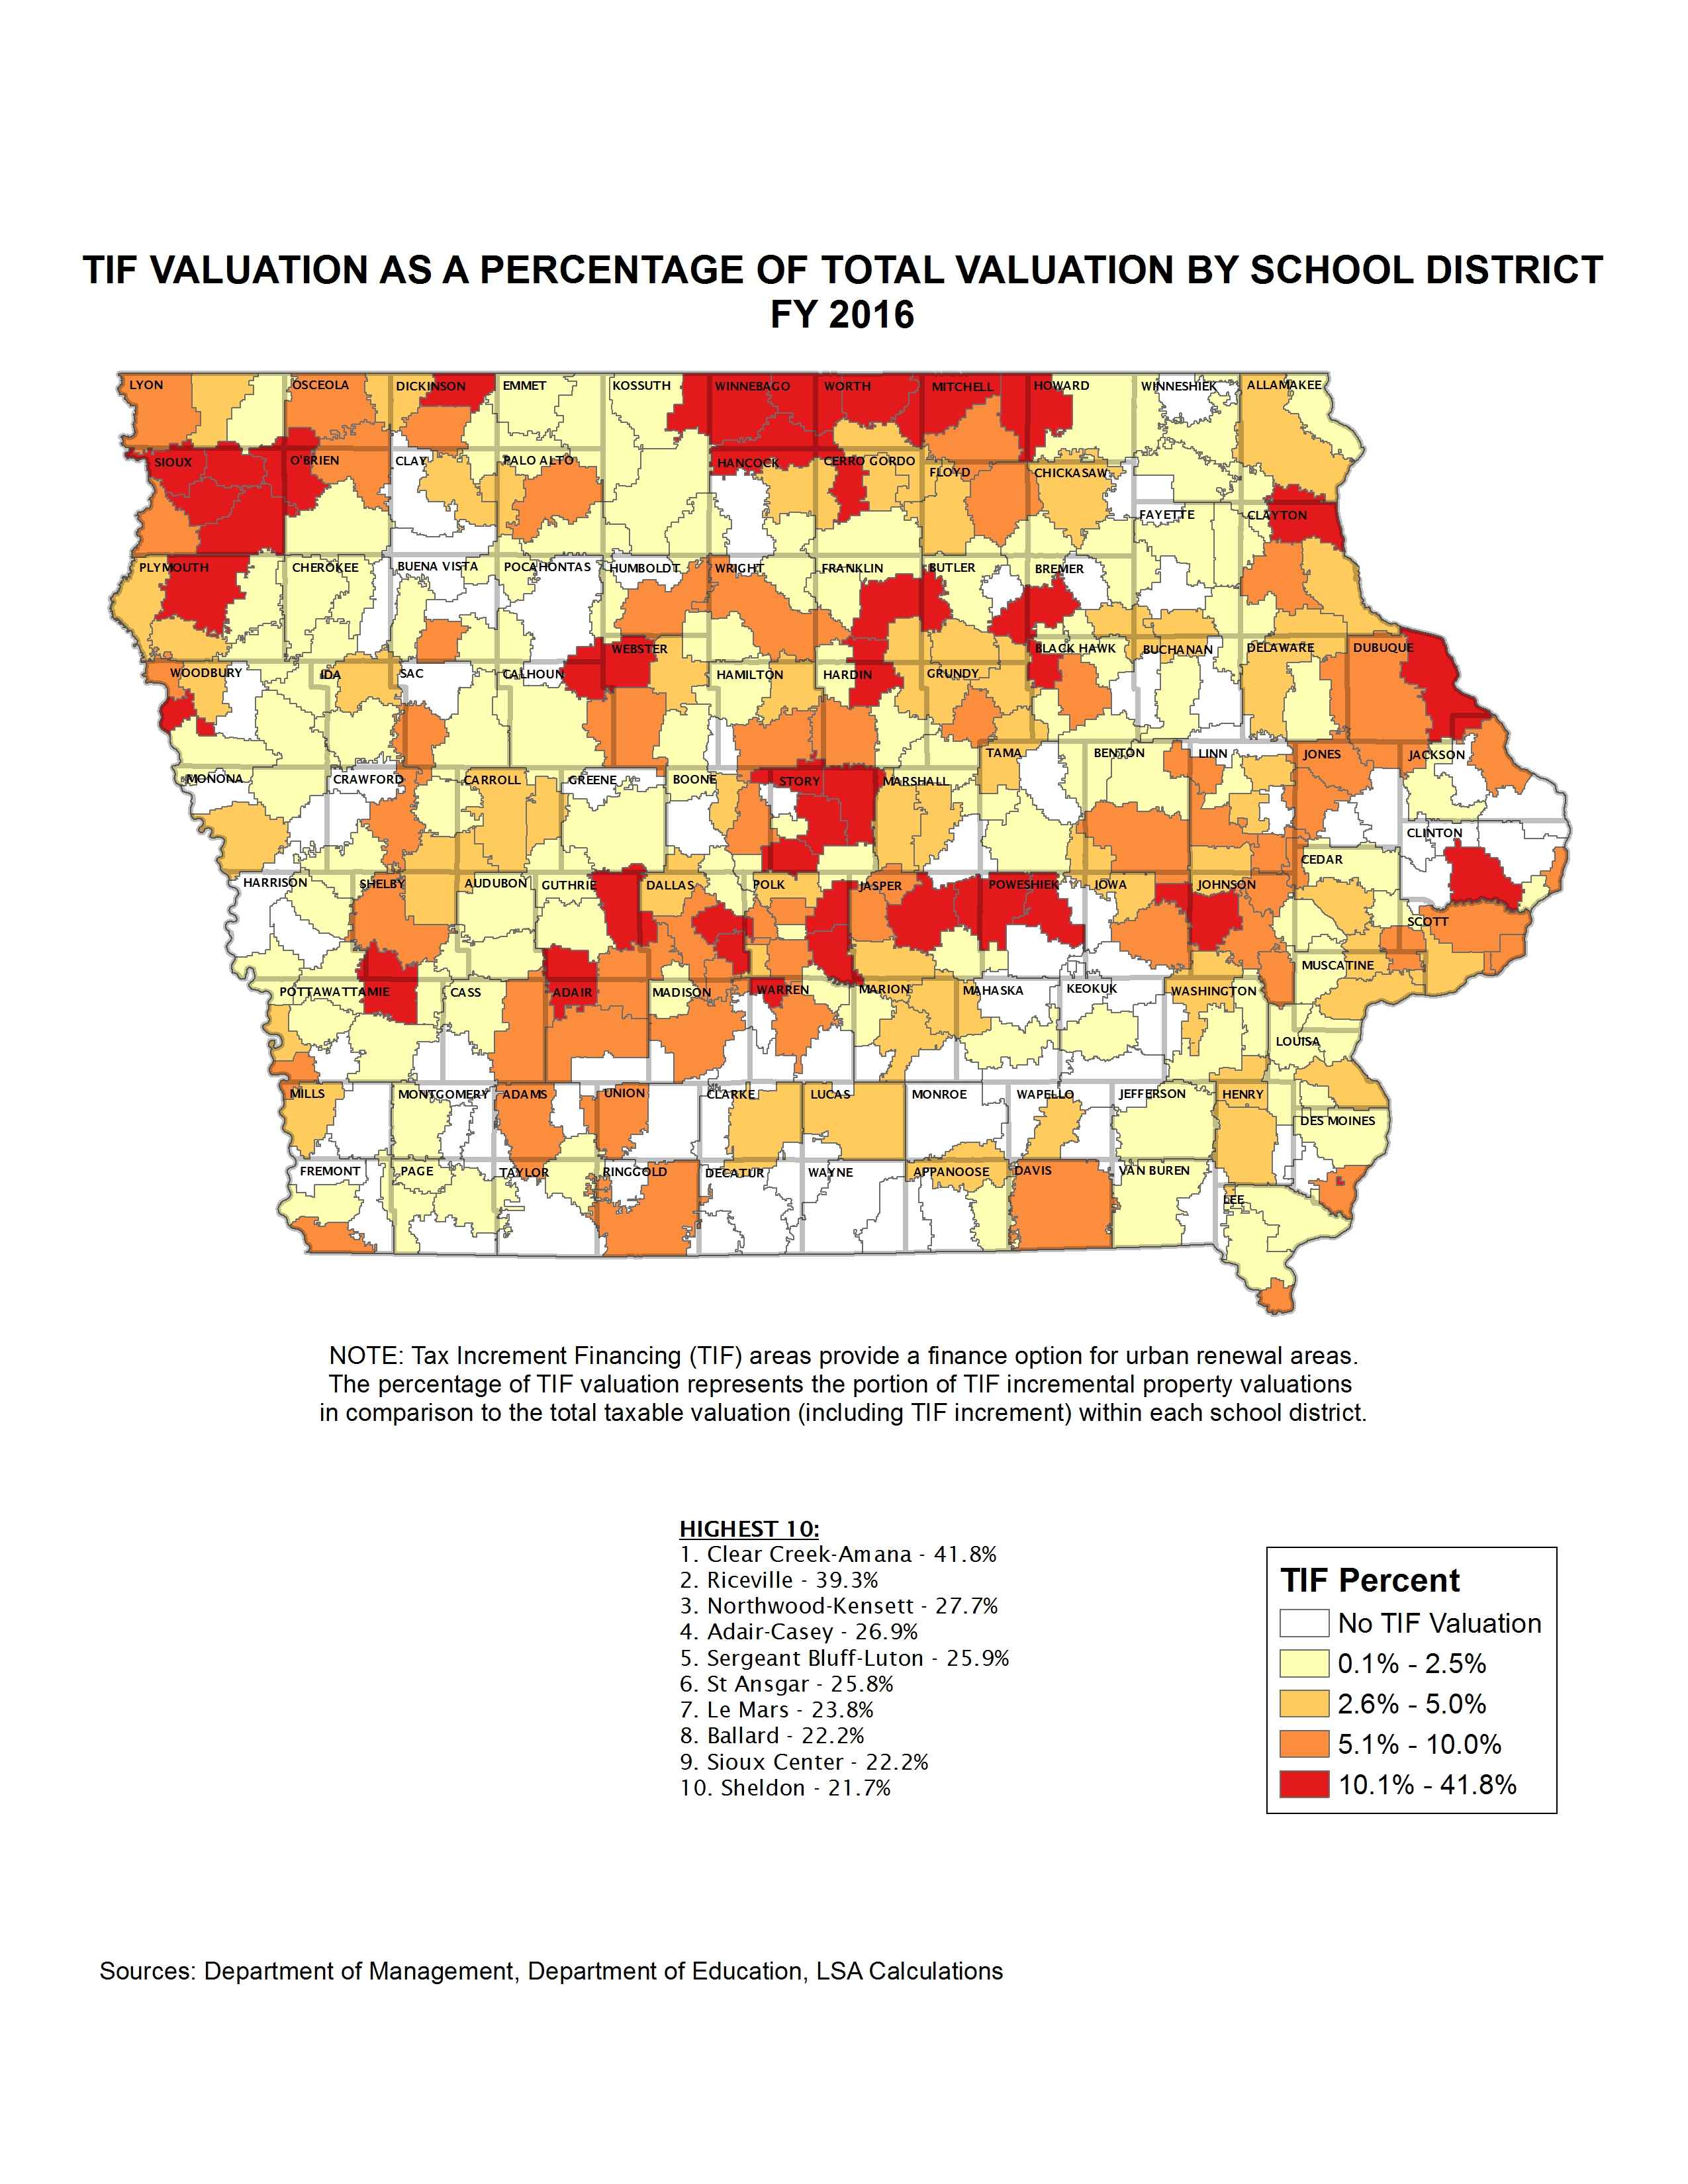
TIF Valuation by School District
|
|
|
|
|
| 10/12/2015 |
Iowa Insights |
General Fund Levy Rate by School District
|
|
|
|
|
| 10/05/2015 |
Iowa Insights |
Area Education Agency Enrollments

|
|
|
|
|
| 09/28/2015 |
Iowa Insights |
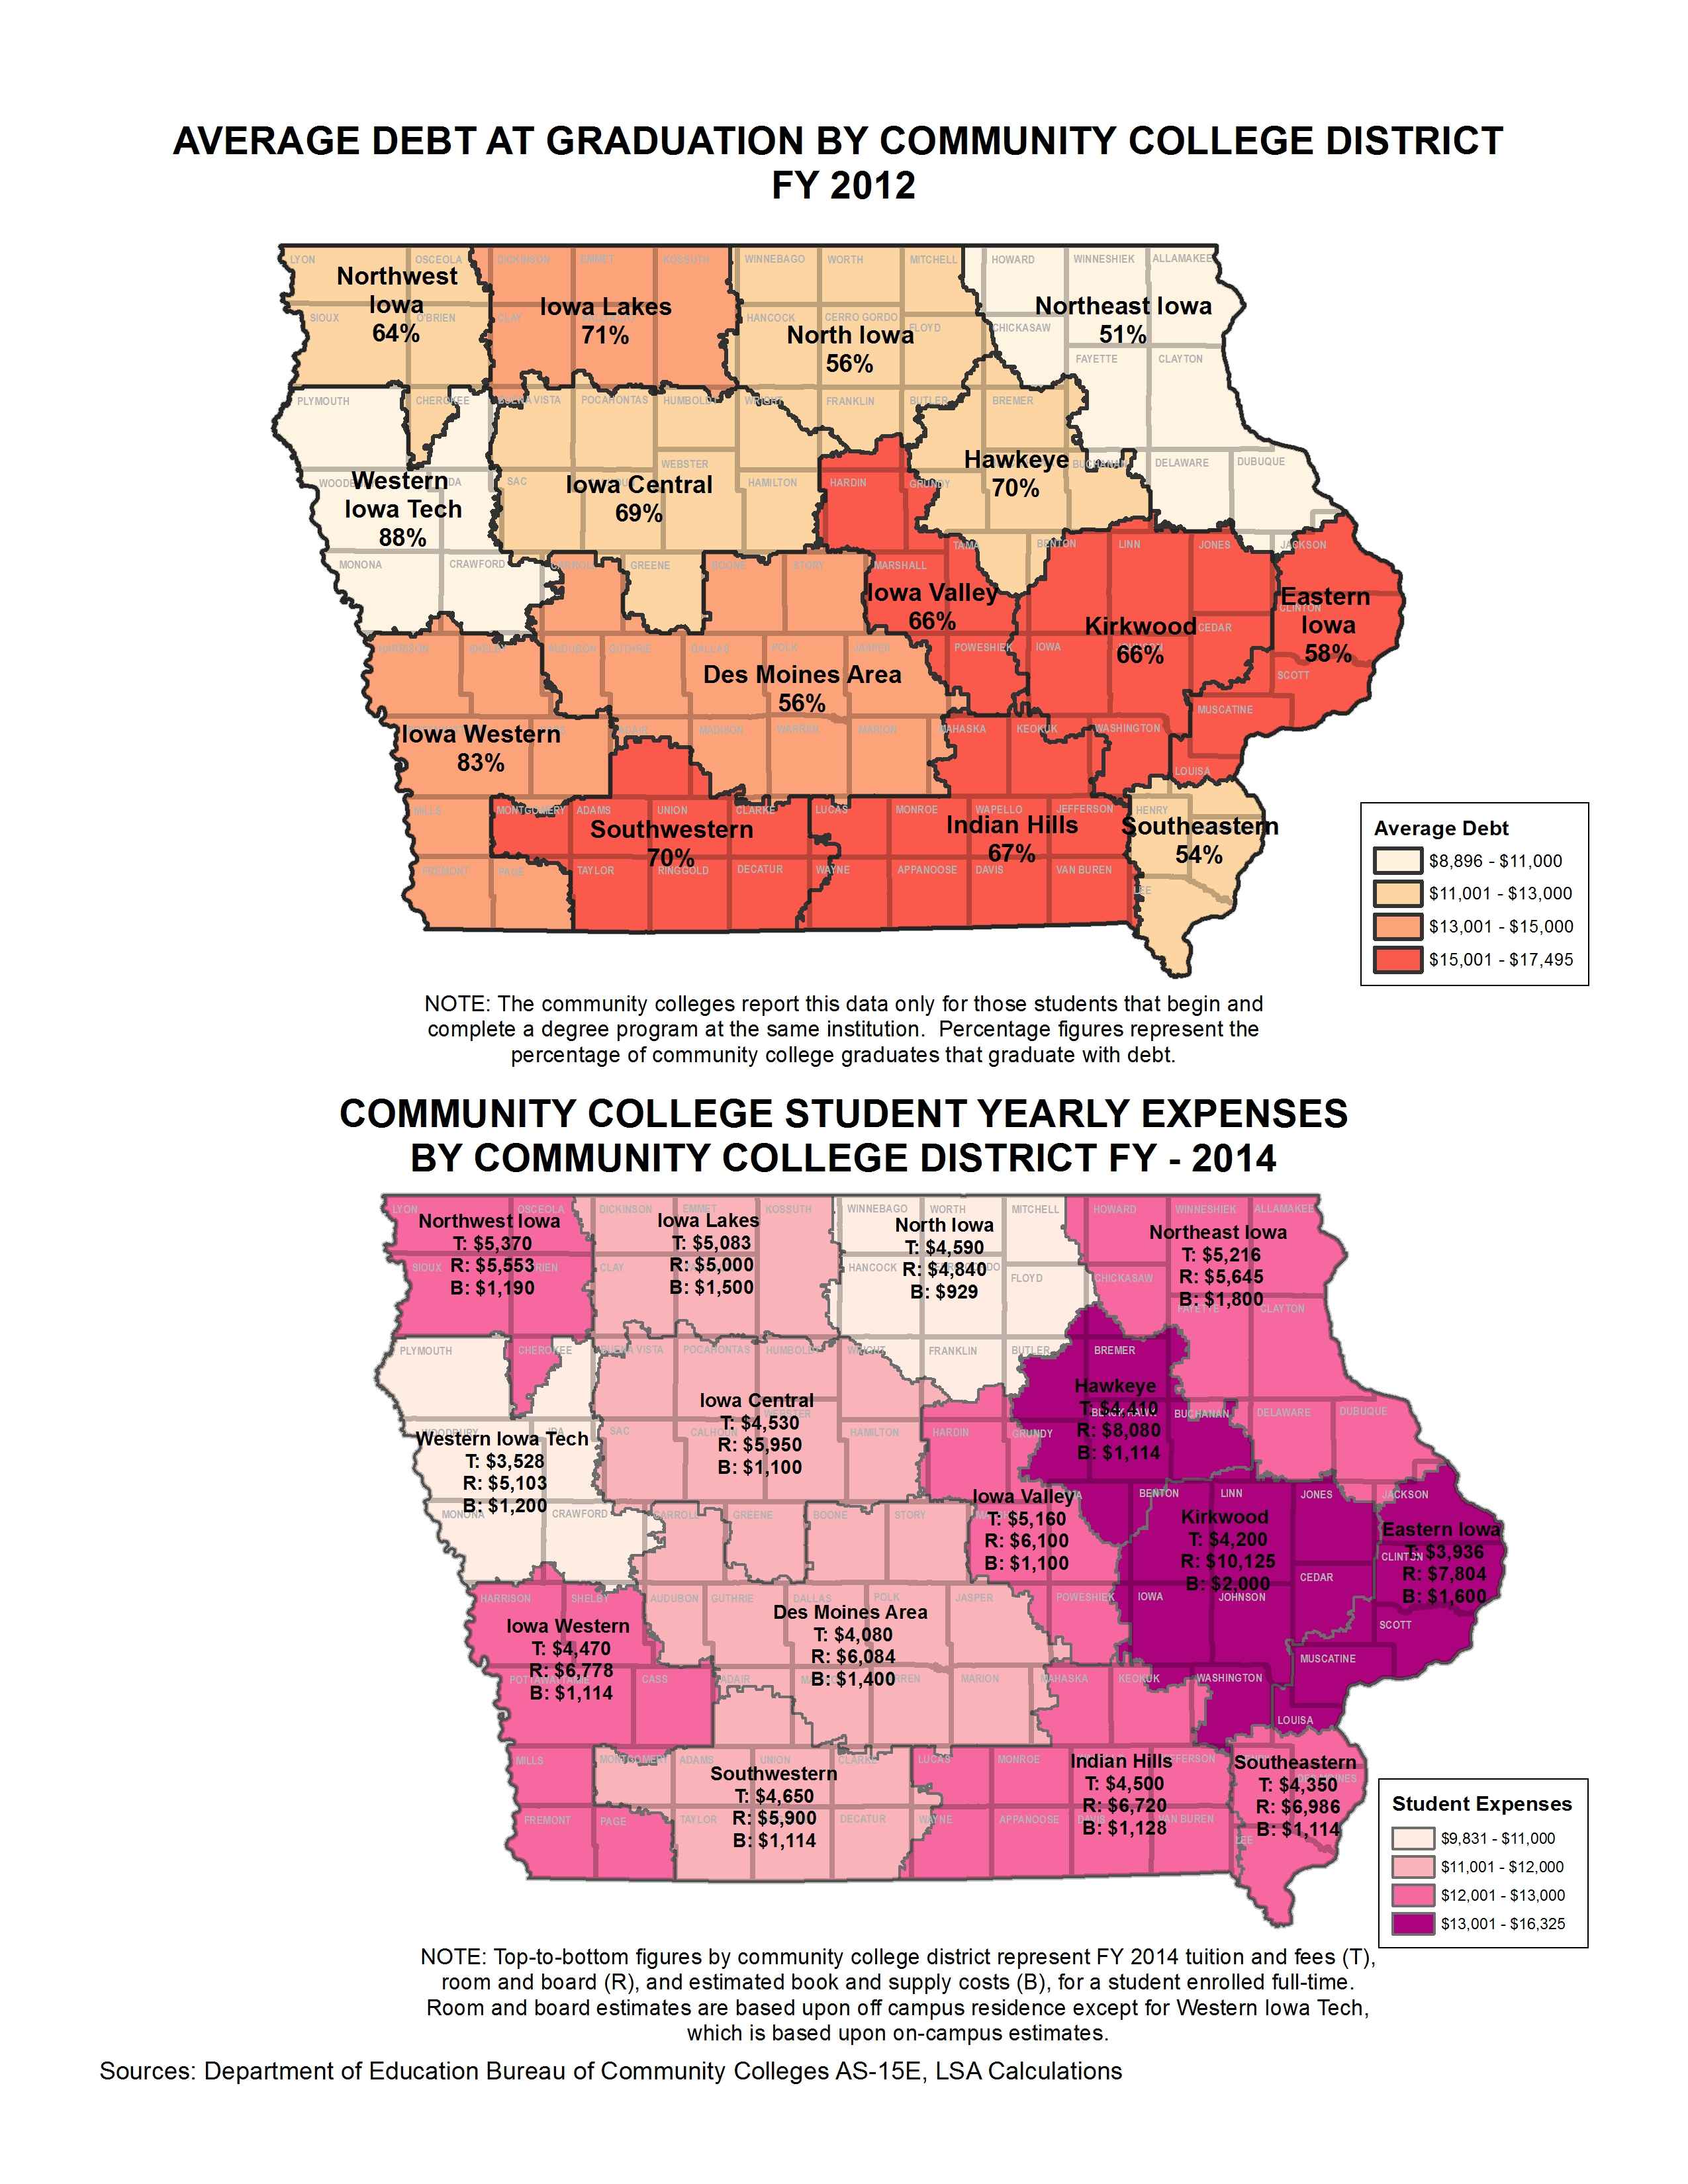
Average Debt at Graduation and Yearly Expenses by Community College District
|
|
|
|
|
| 09/21/2015 |
Iowa Insights |
Teacher Salary by School District and State - FY 2015
|
|
|
|
|
| 09/14/2015 |
Iowa Insights |
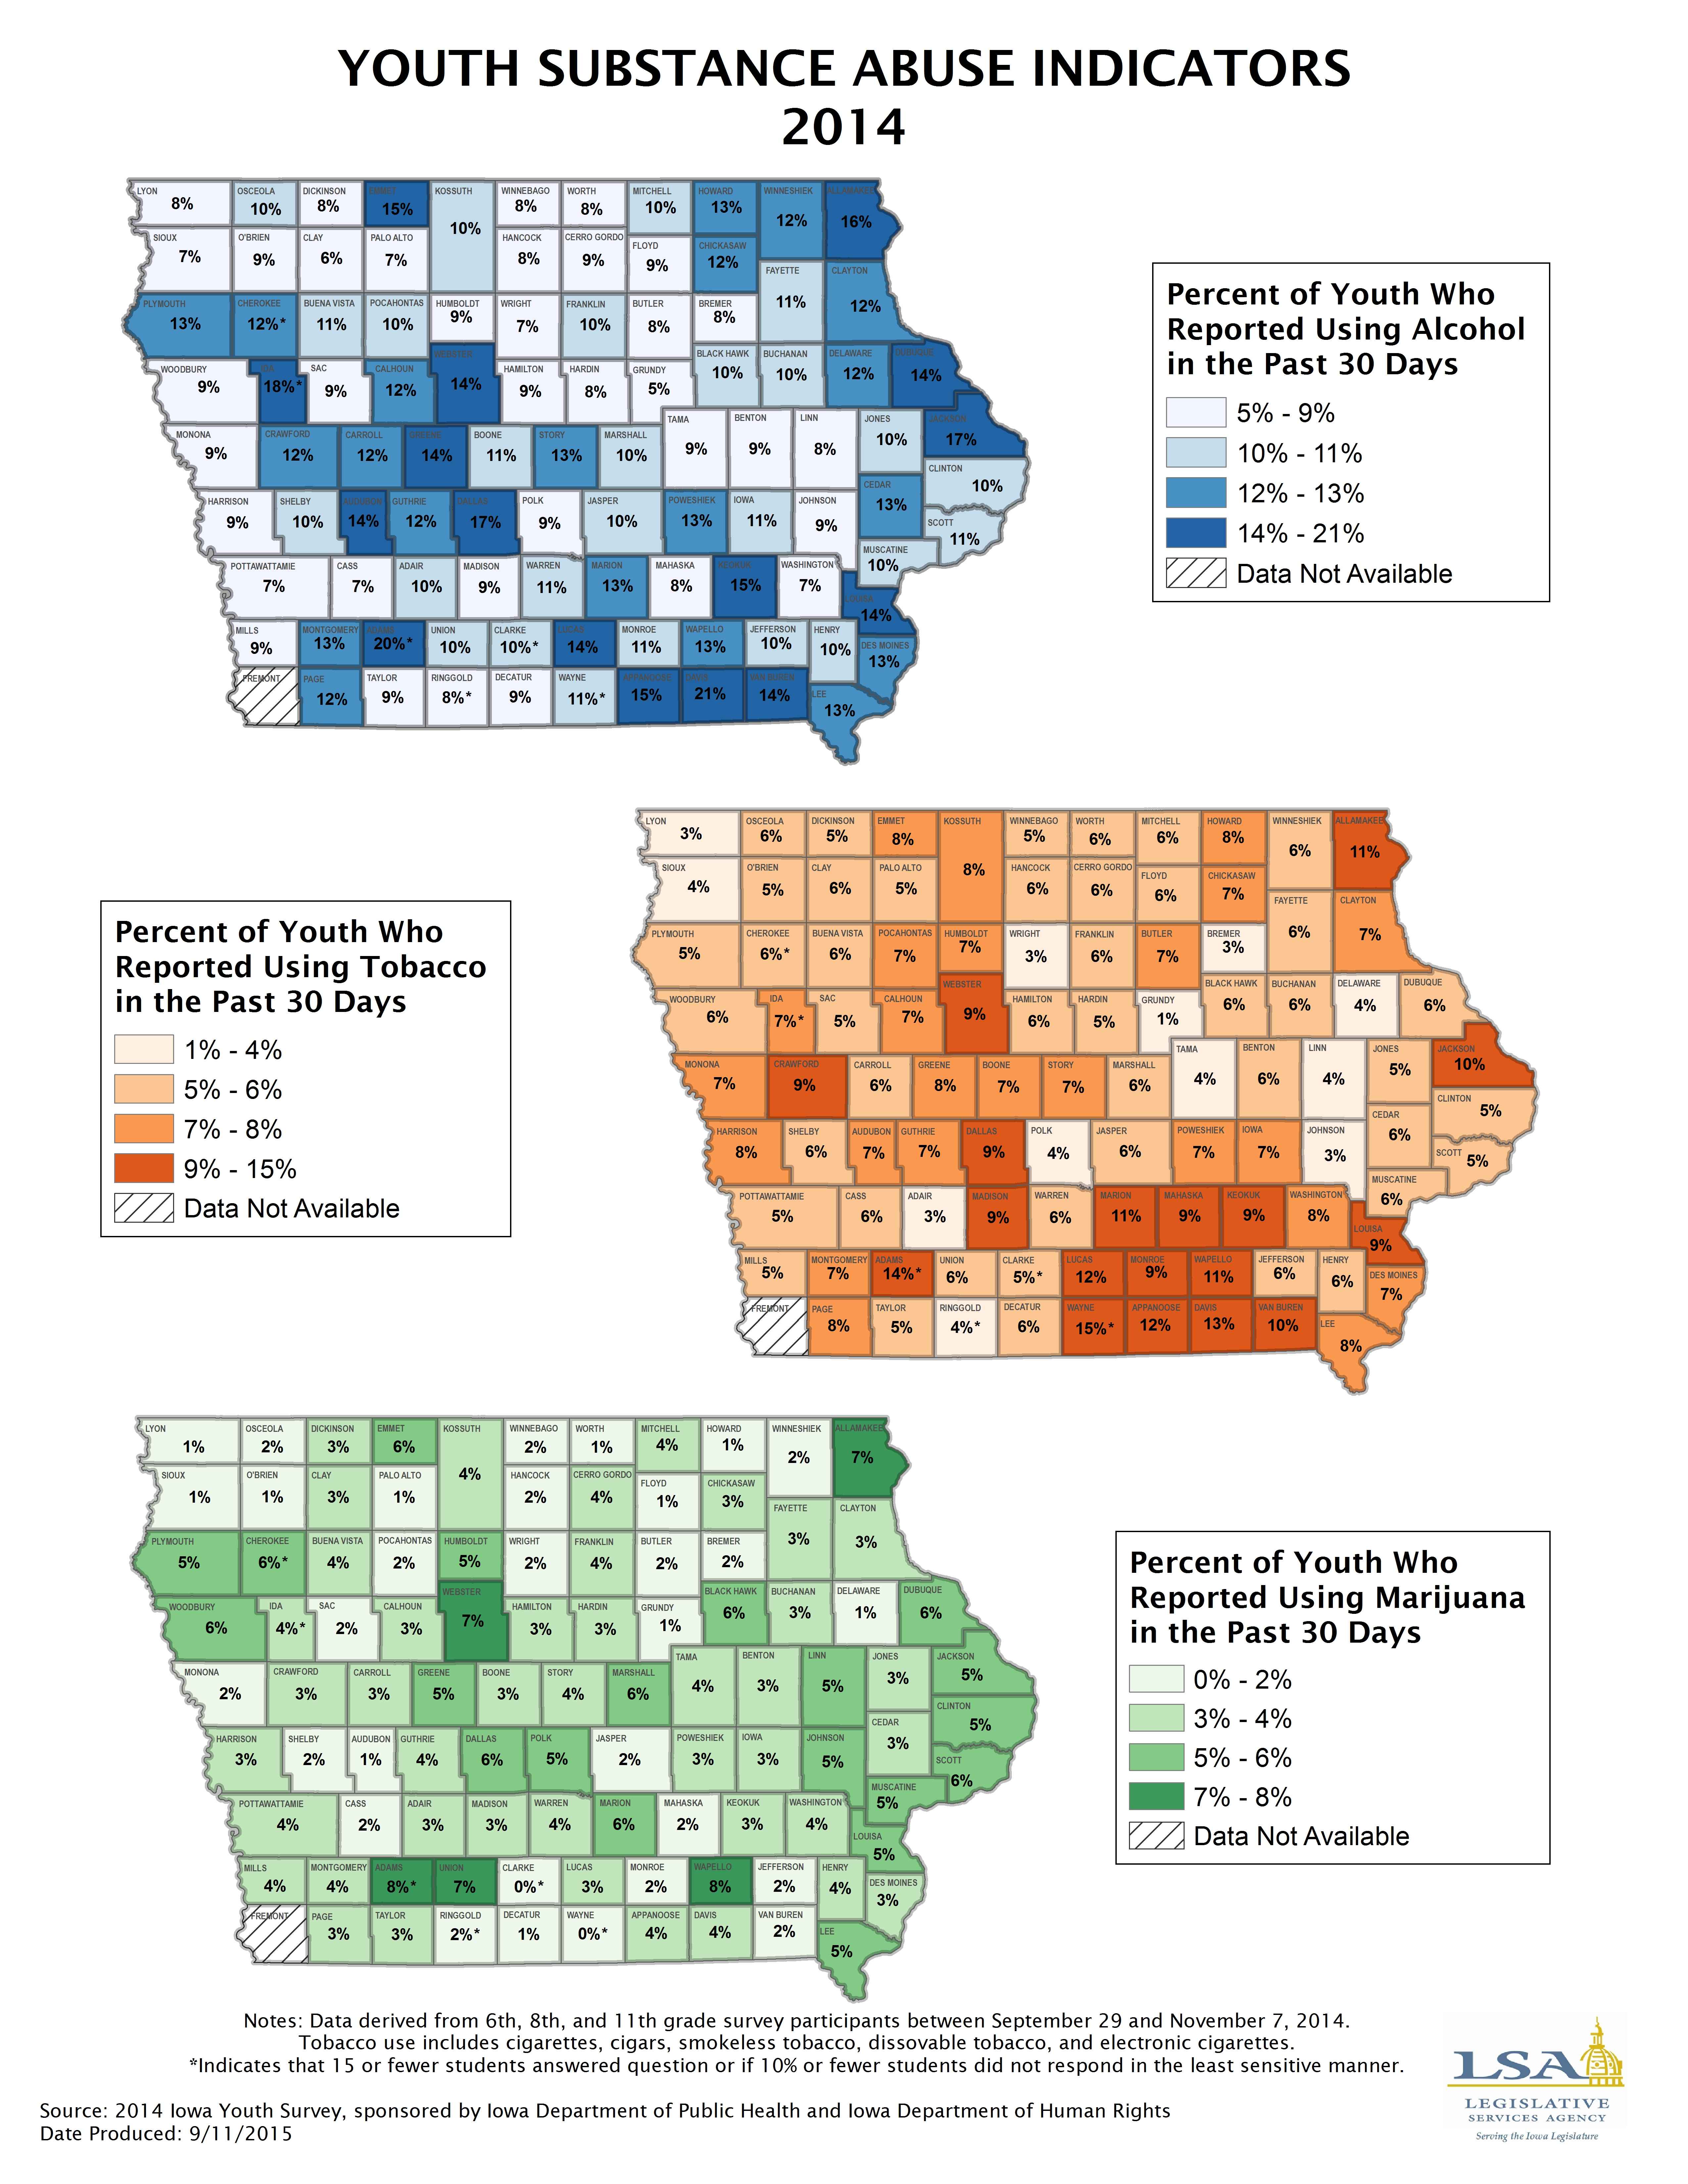
Youth Substance Abuse Indicators - 2014
|
|
|
|
|
| 09/08/2015 |
Iowa Insights |
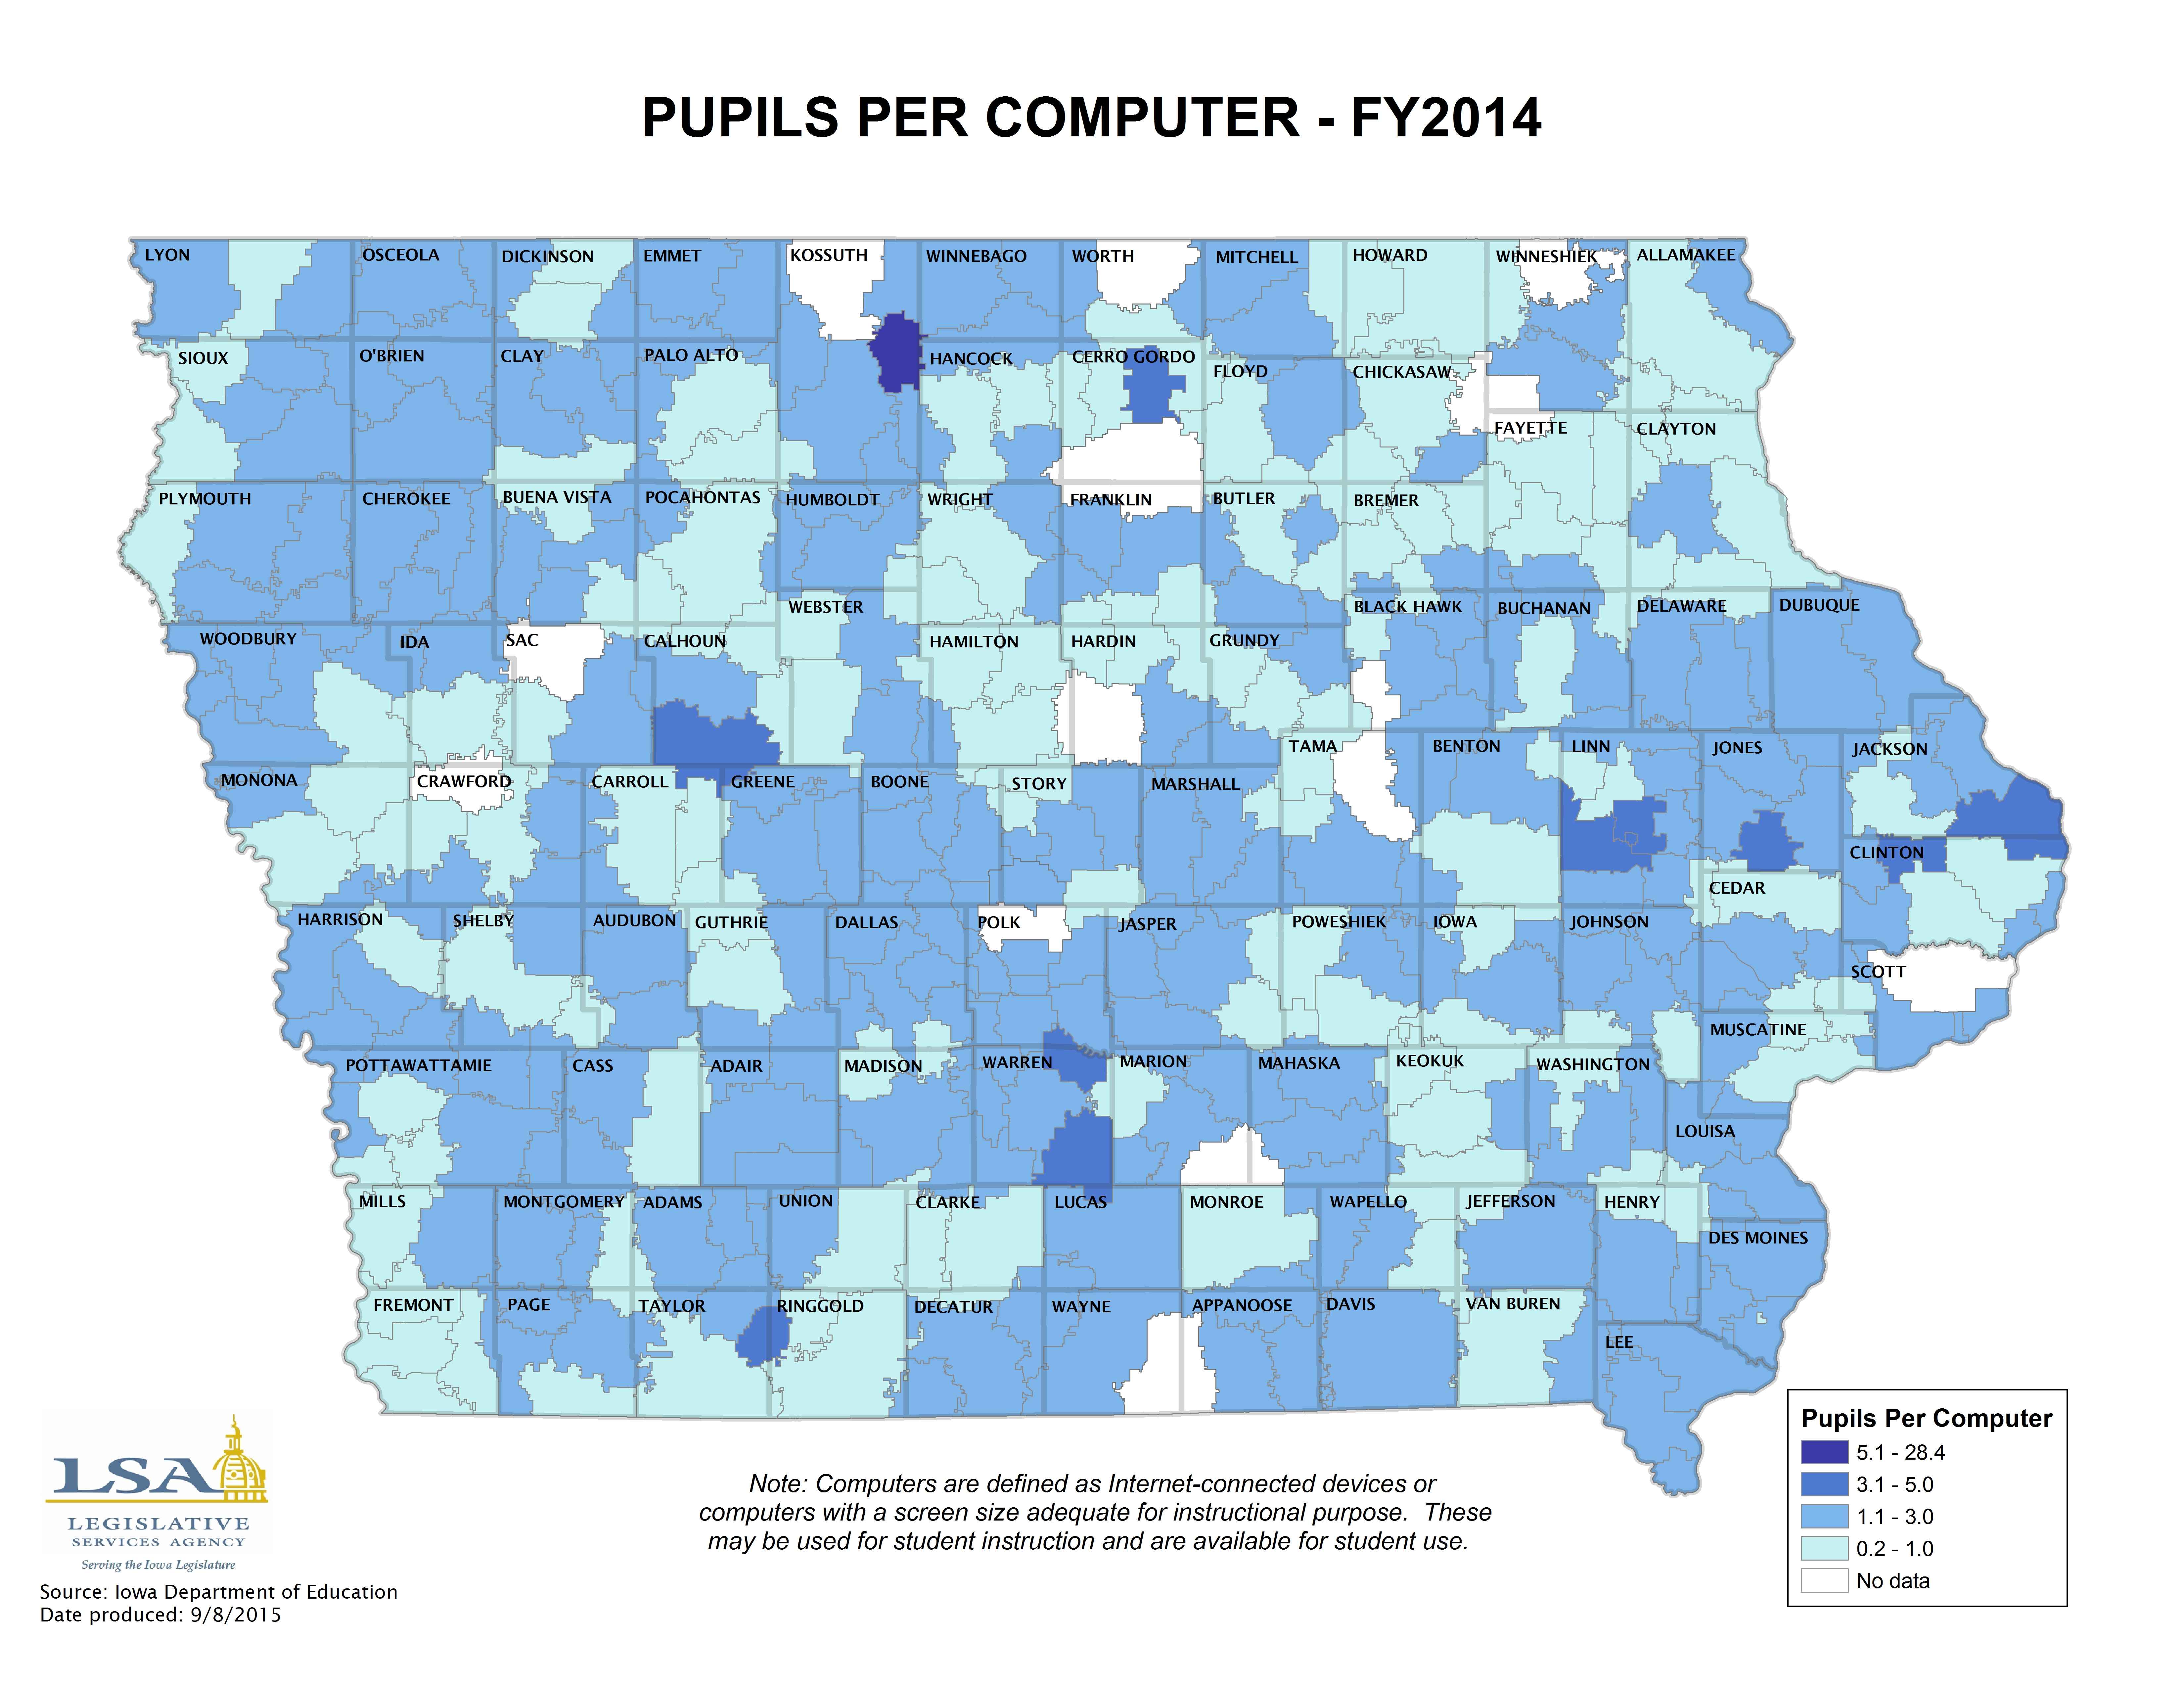
Pupils per Computer - FY 2014
|
|
|
|
|
| 08/31/2015 |
Iowa Insights |
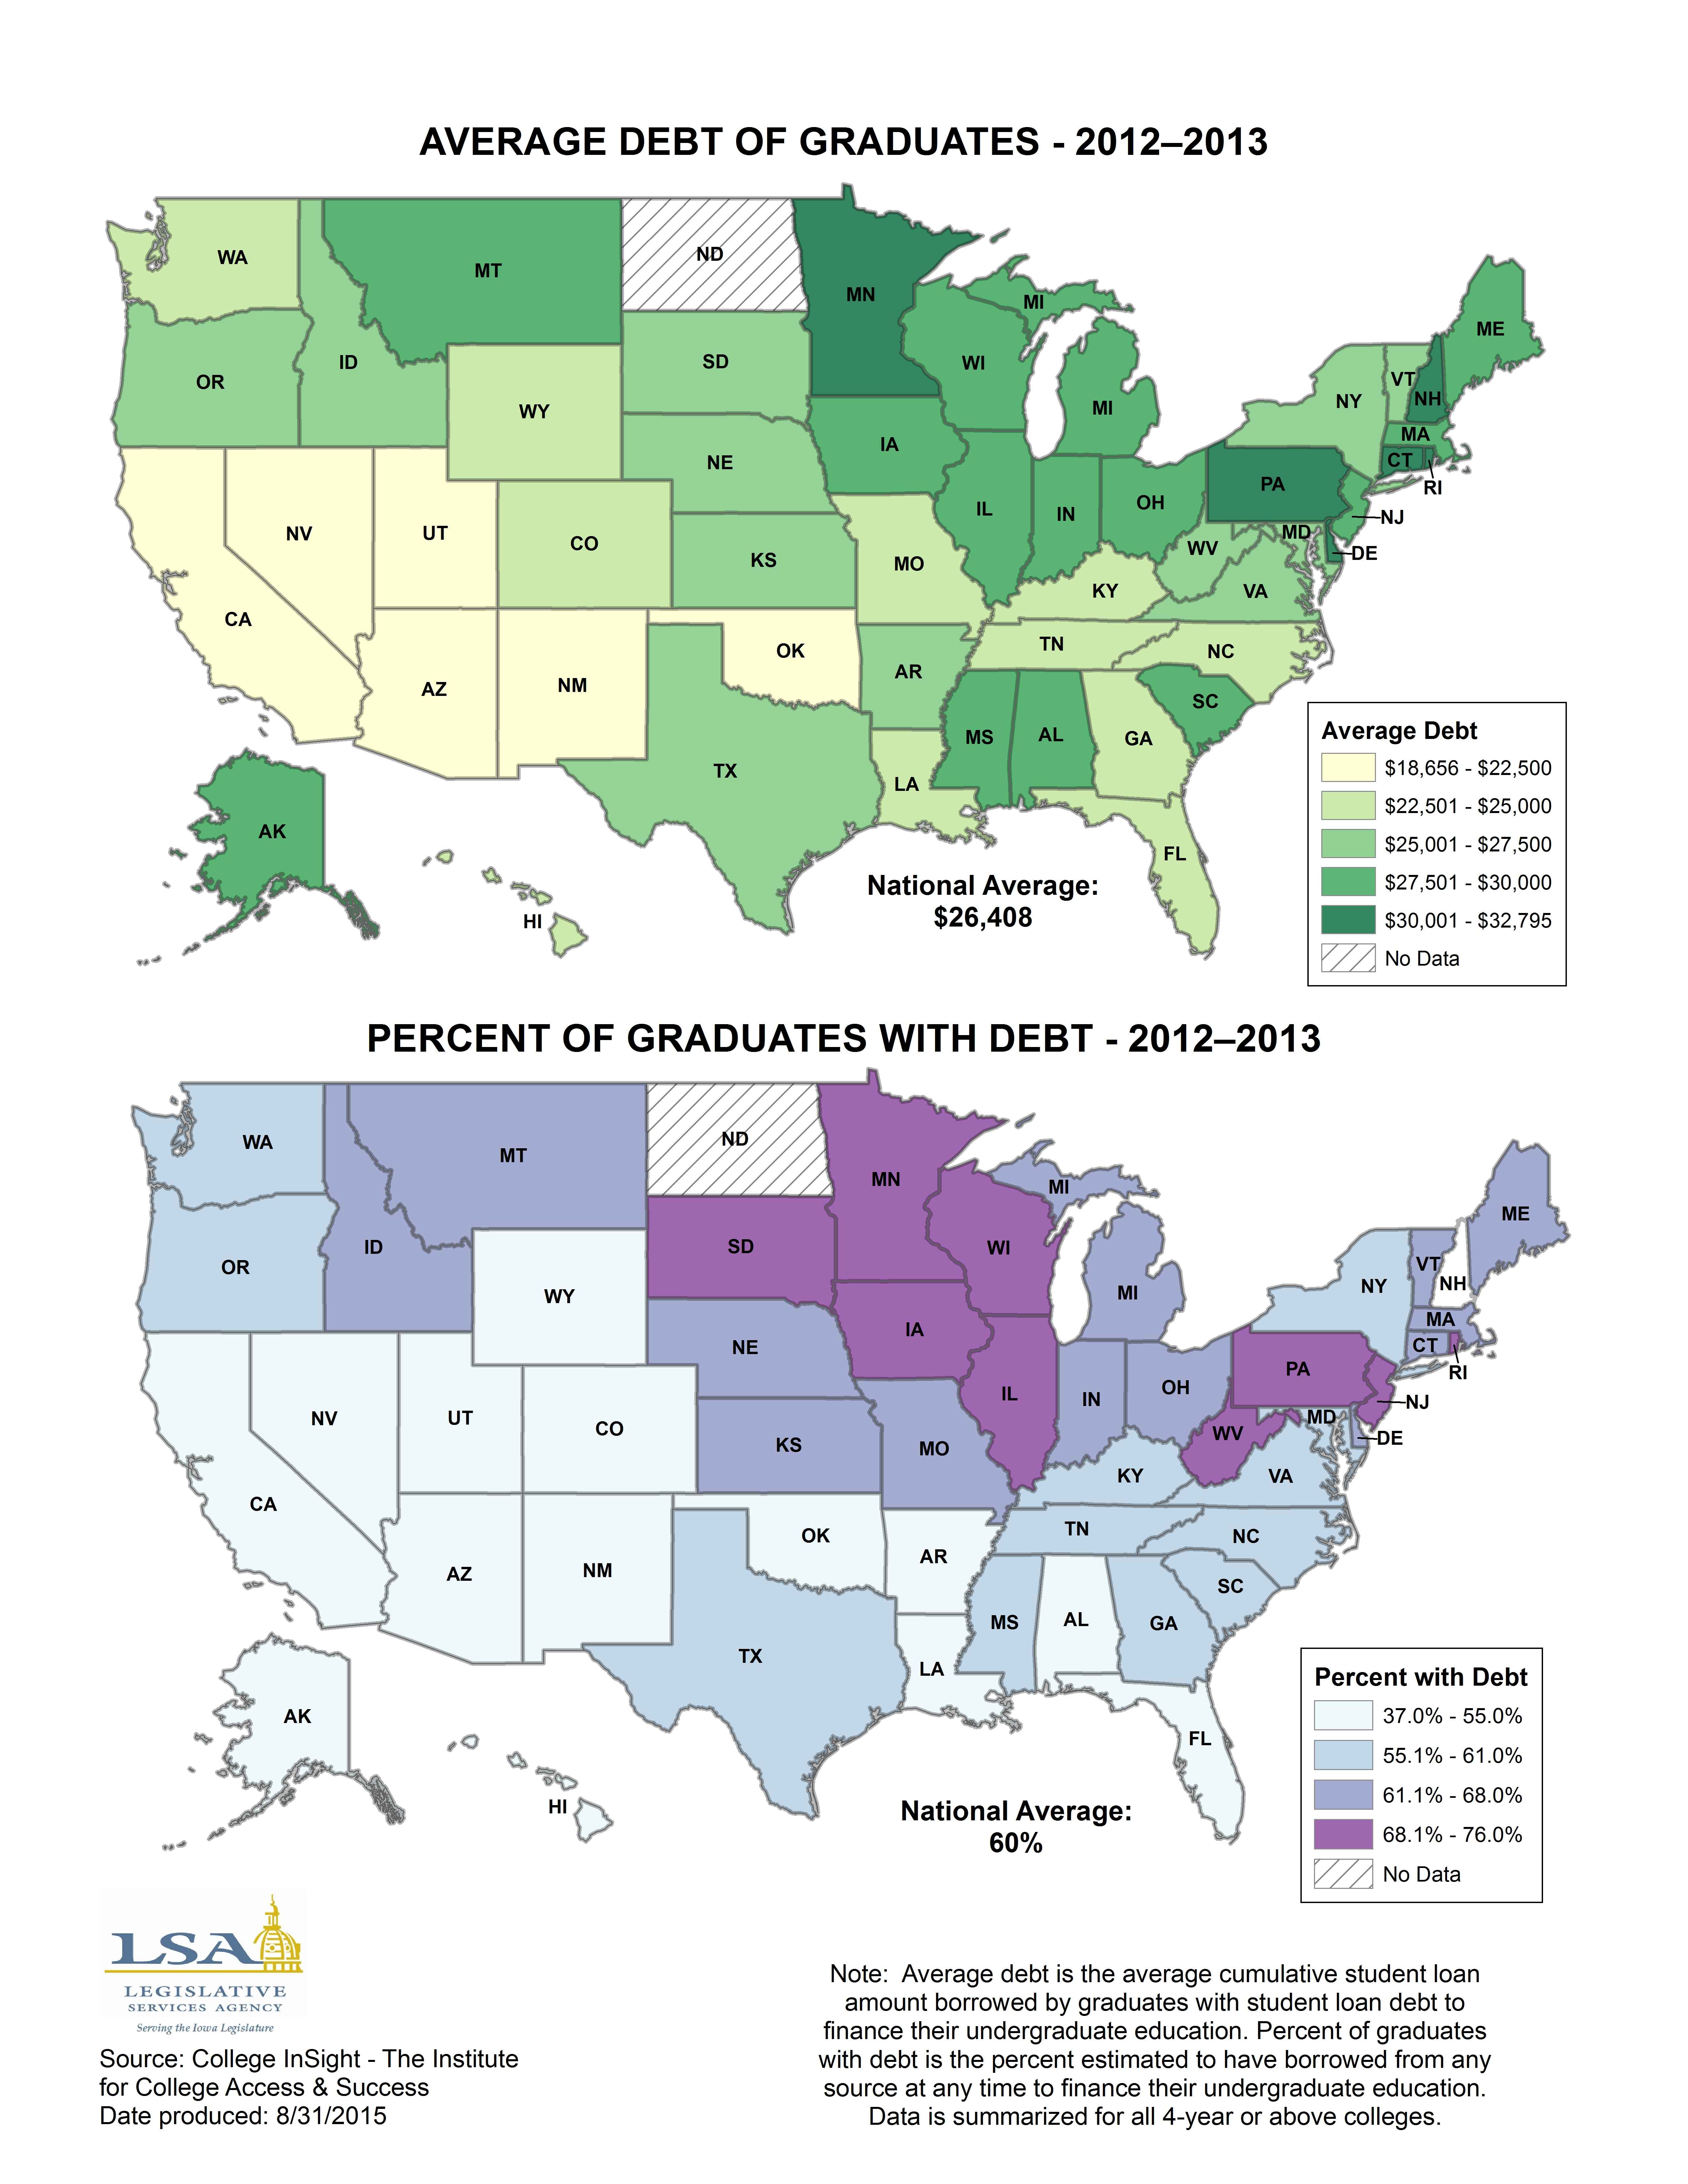
Average Debt of Graduates and Percent of Graduates with Debt - 2012-2013
|
|
|
|
|
| 08/24/2015 |
Iowa Insights |
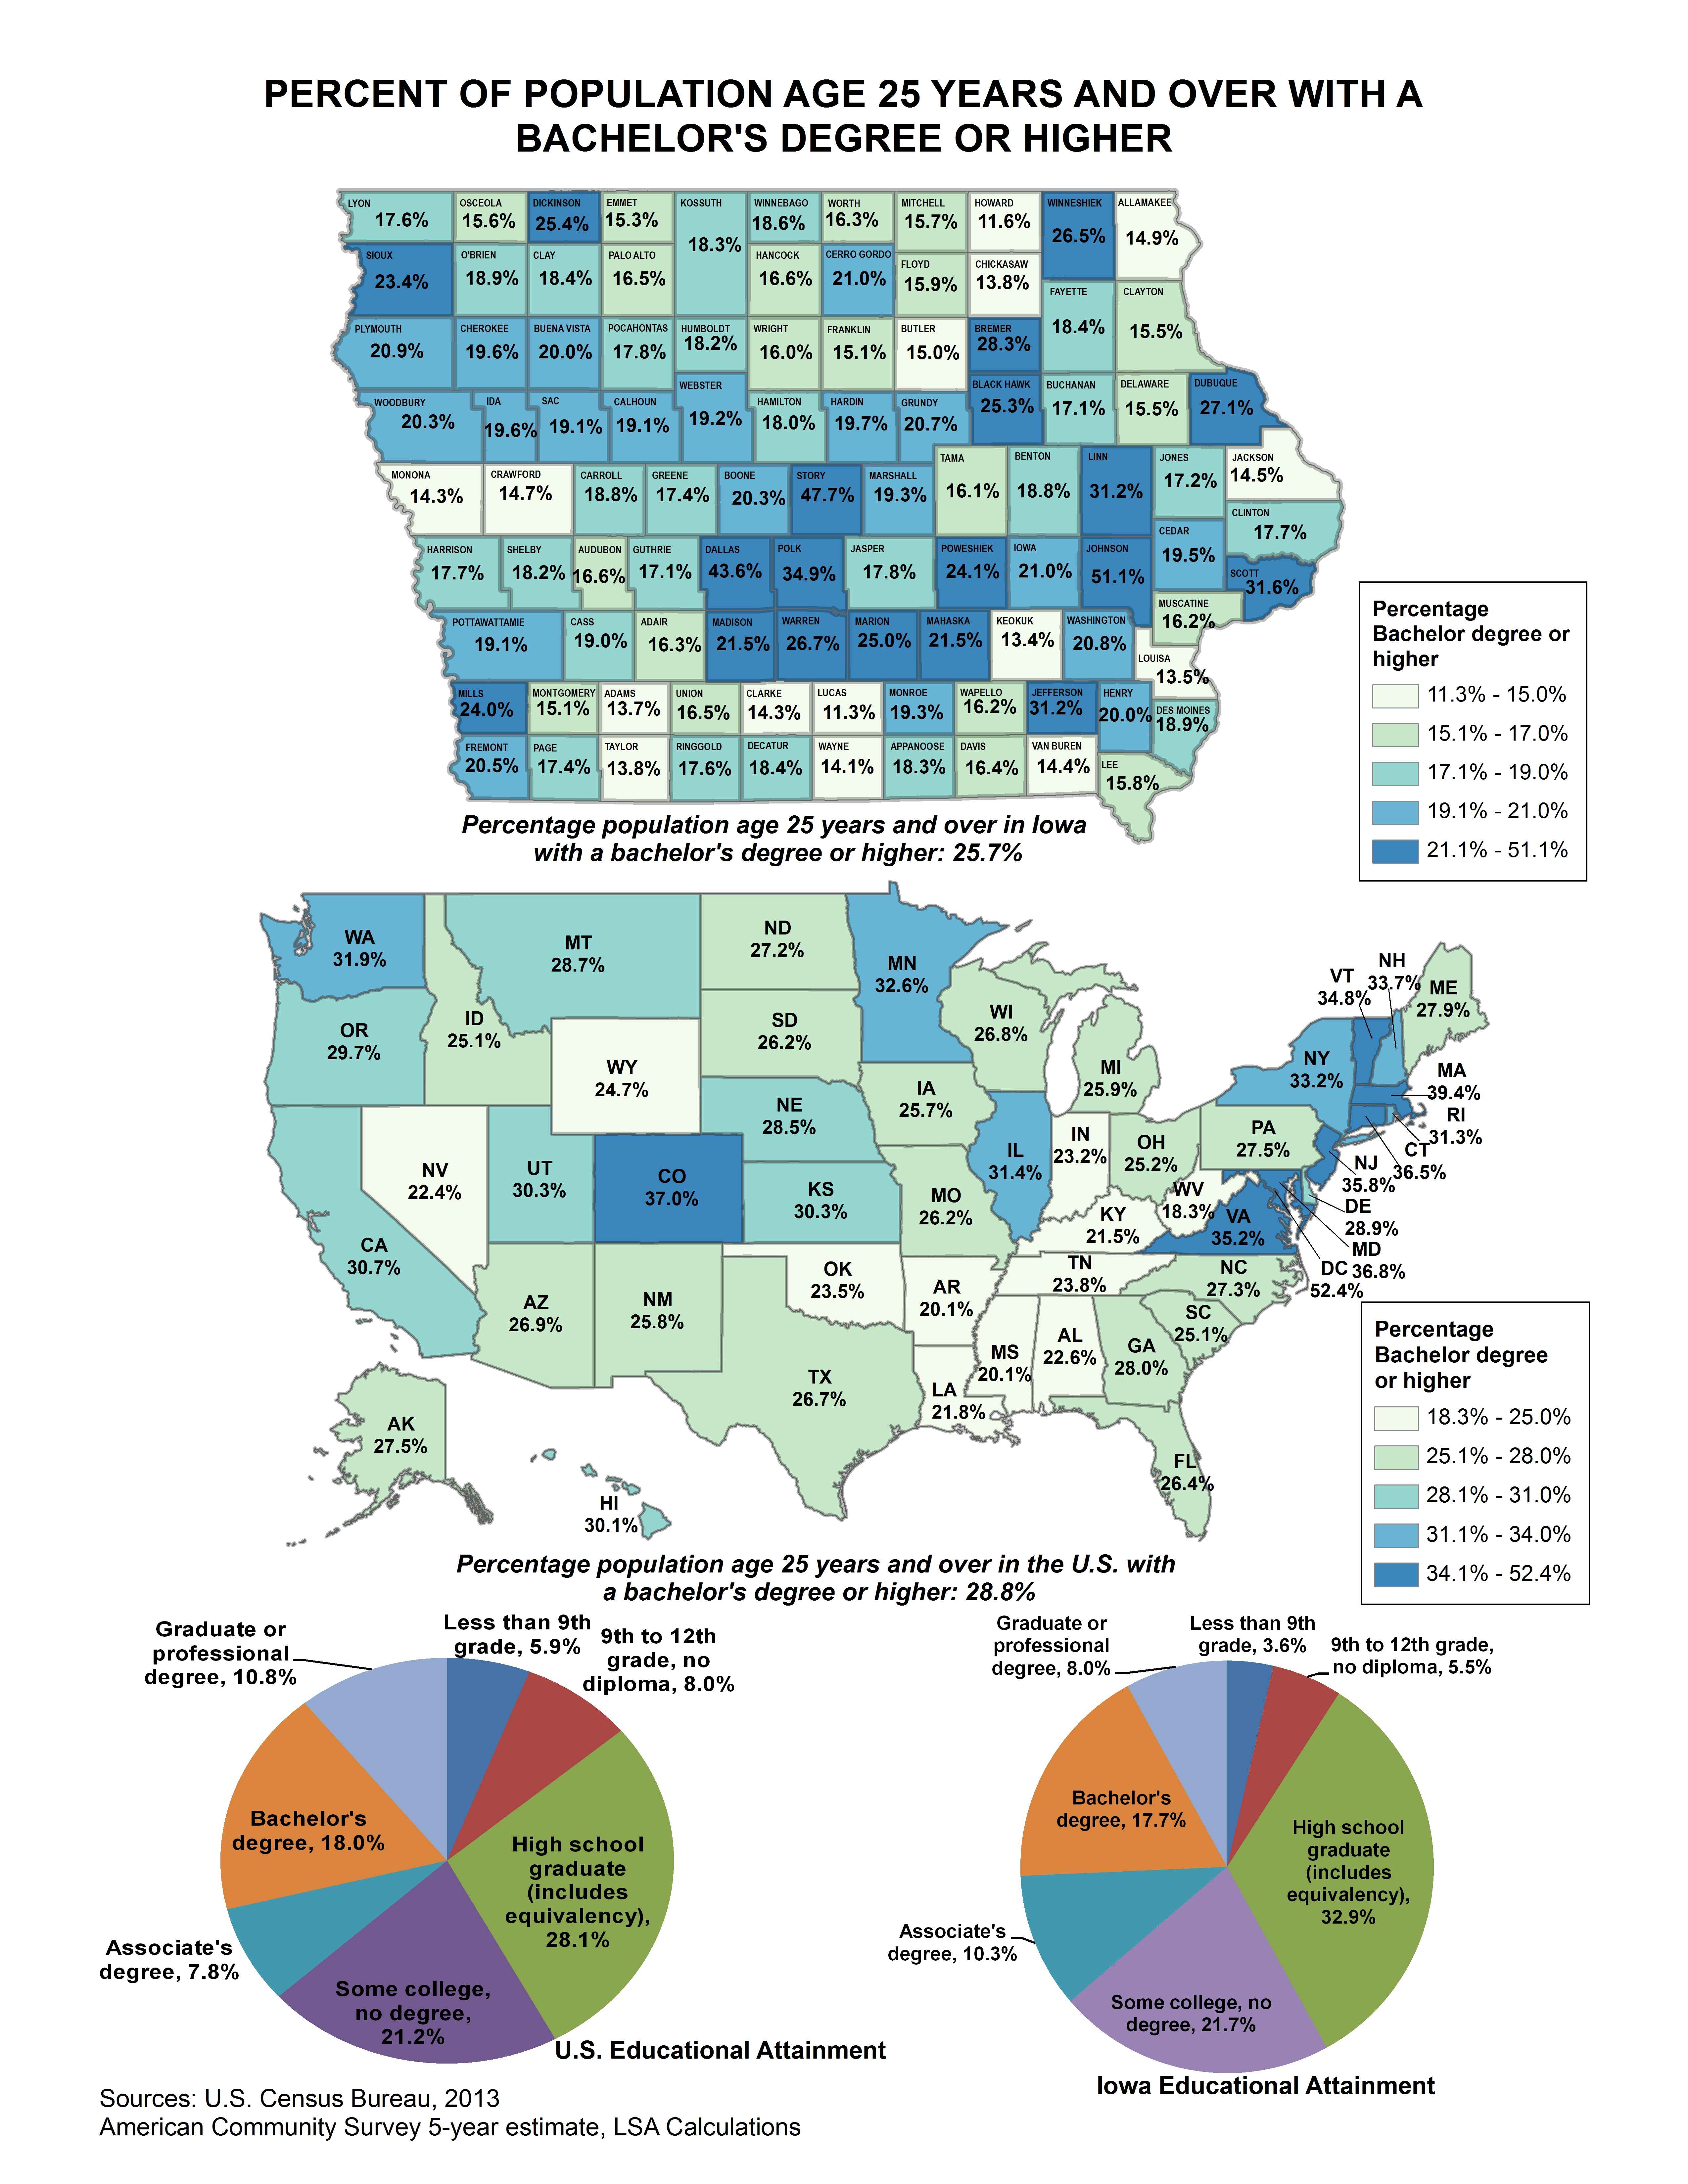
Percent of Population with a Bachelor's Degree or Higher
|
|
|
|
|
| 08/17/2015 |
Iowa Insights |
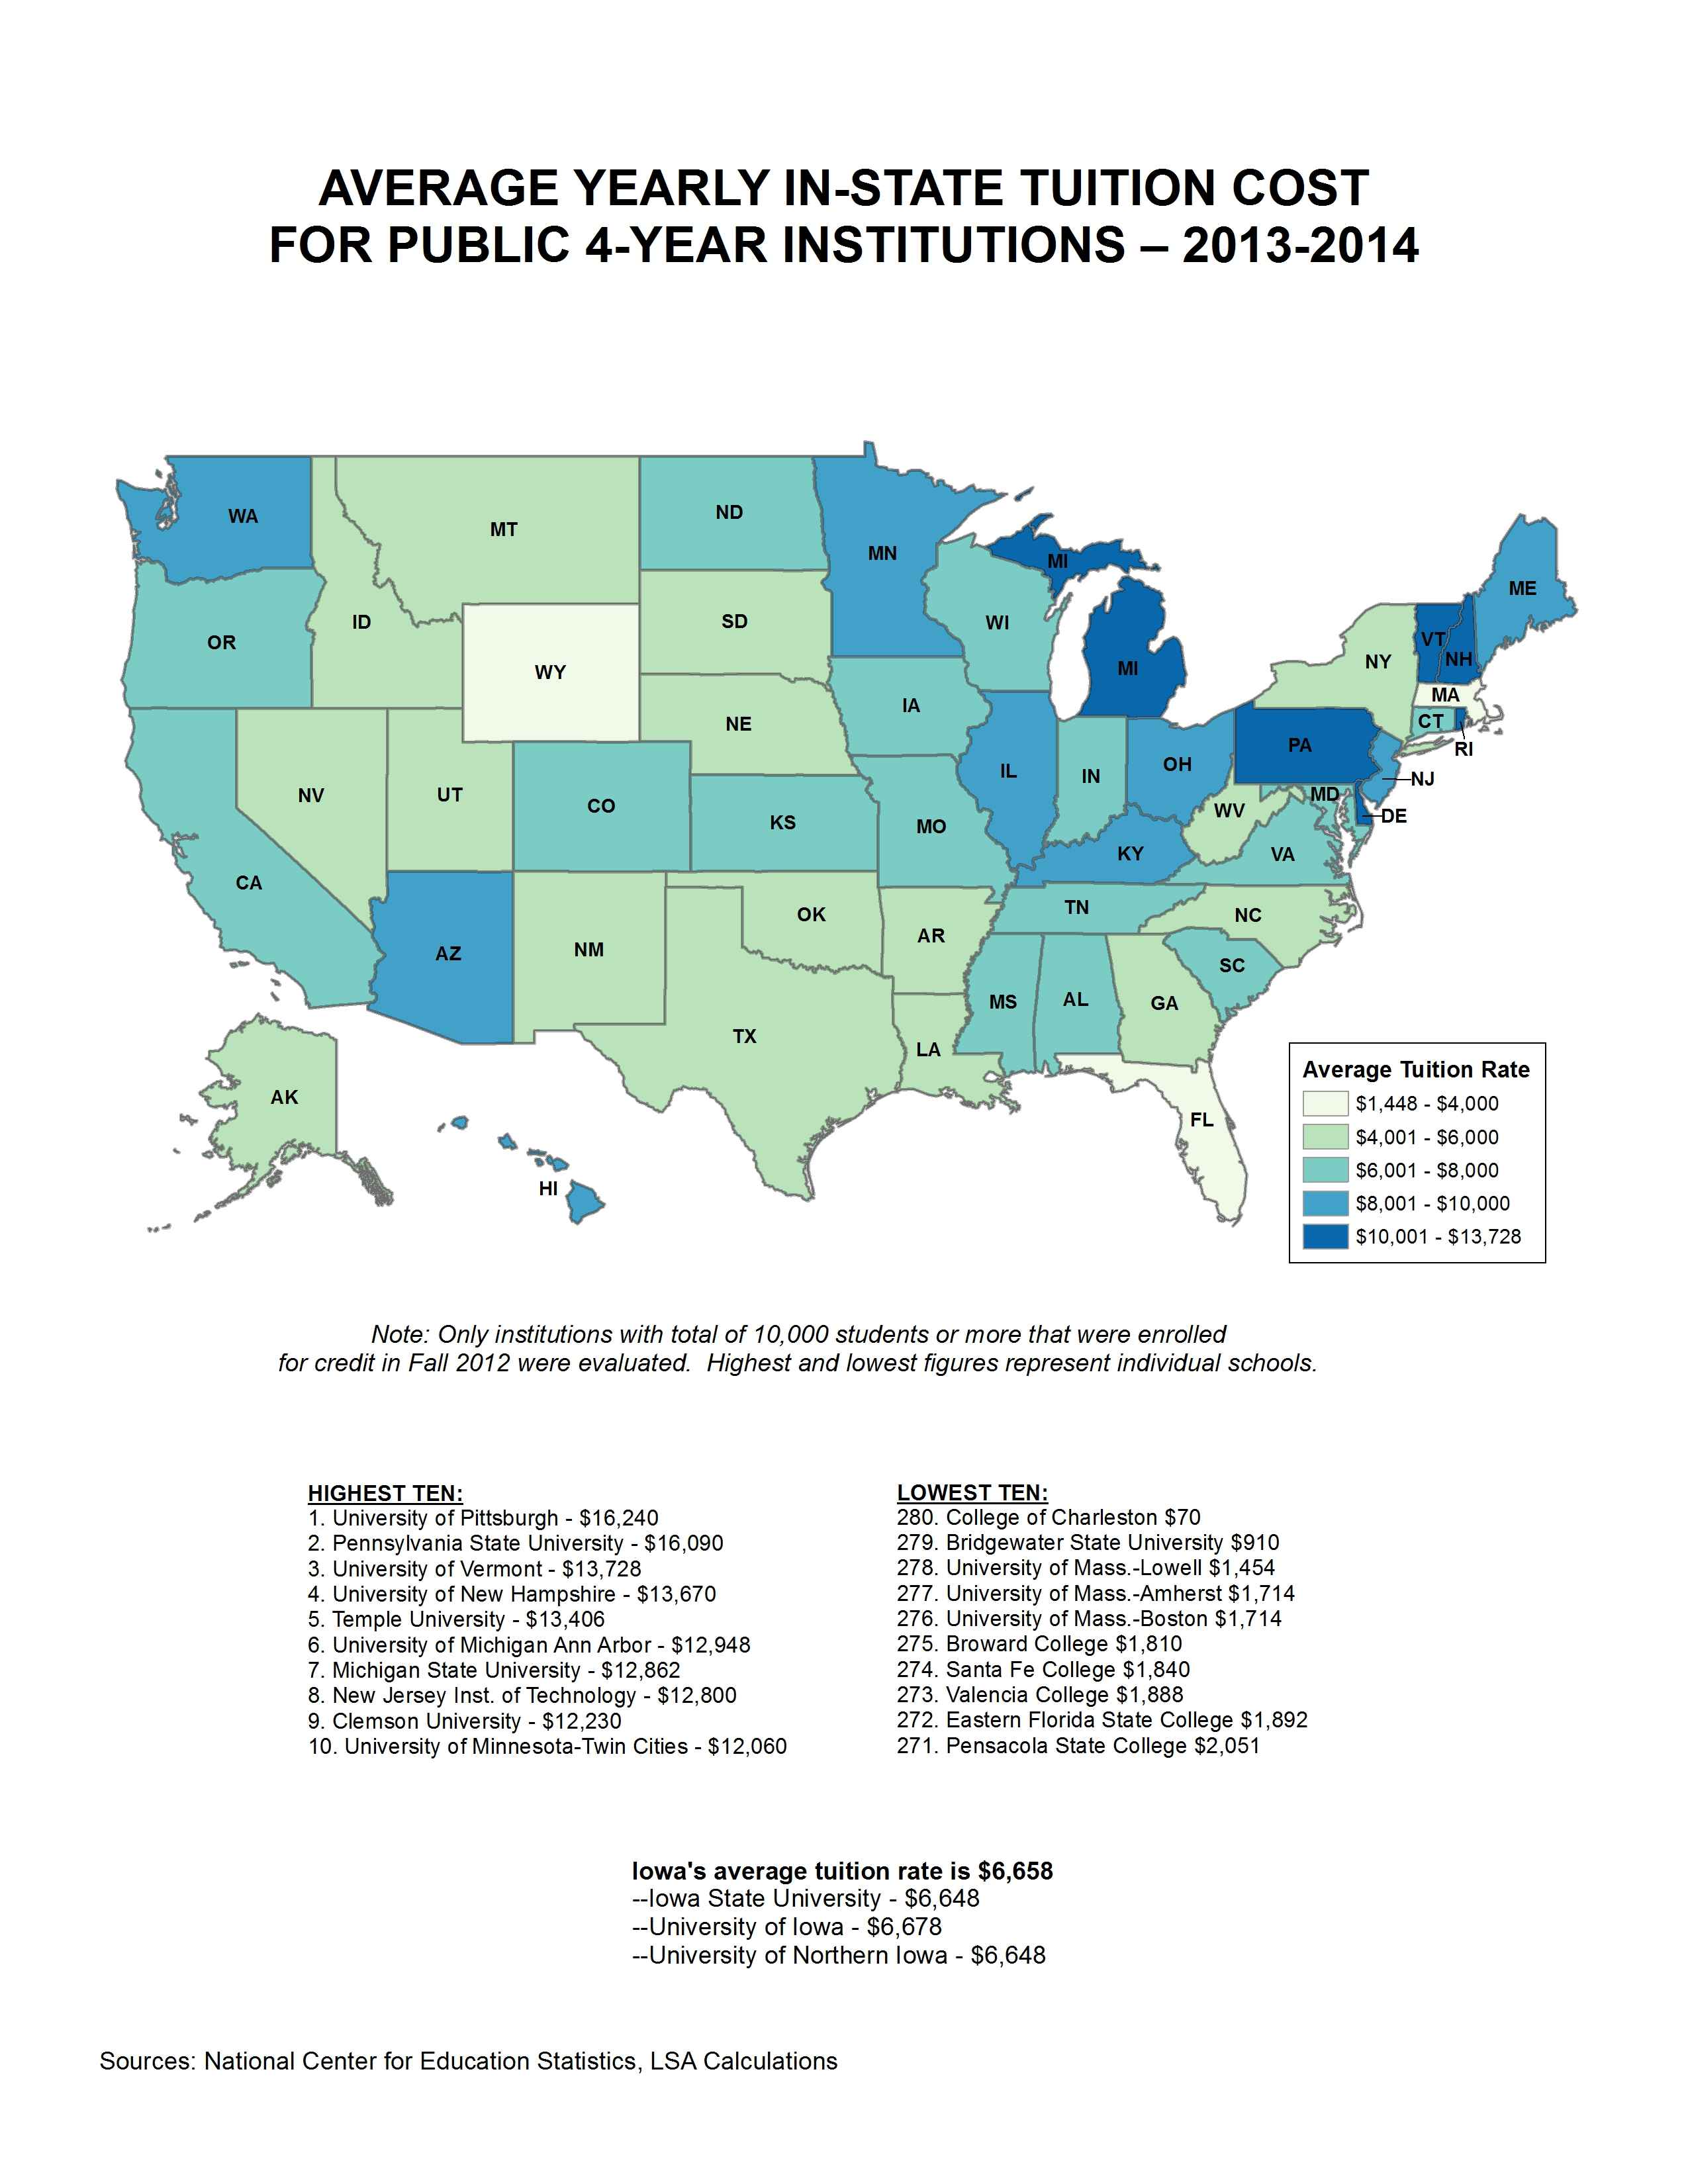
Average Yearly In-State Tuition Cost for Public 4-Year Institutions - 2013-2014
|
|
|
|
|
| 08/10/2015 |
Iowa Insights |
Percent of Population Over 65 Years Old

|
|
|
|
|
| 08/03/2015 |
Iowa Insights |
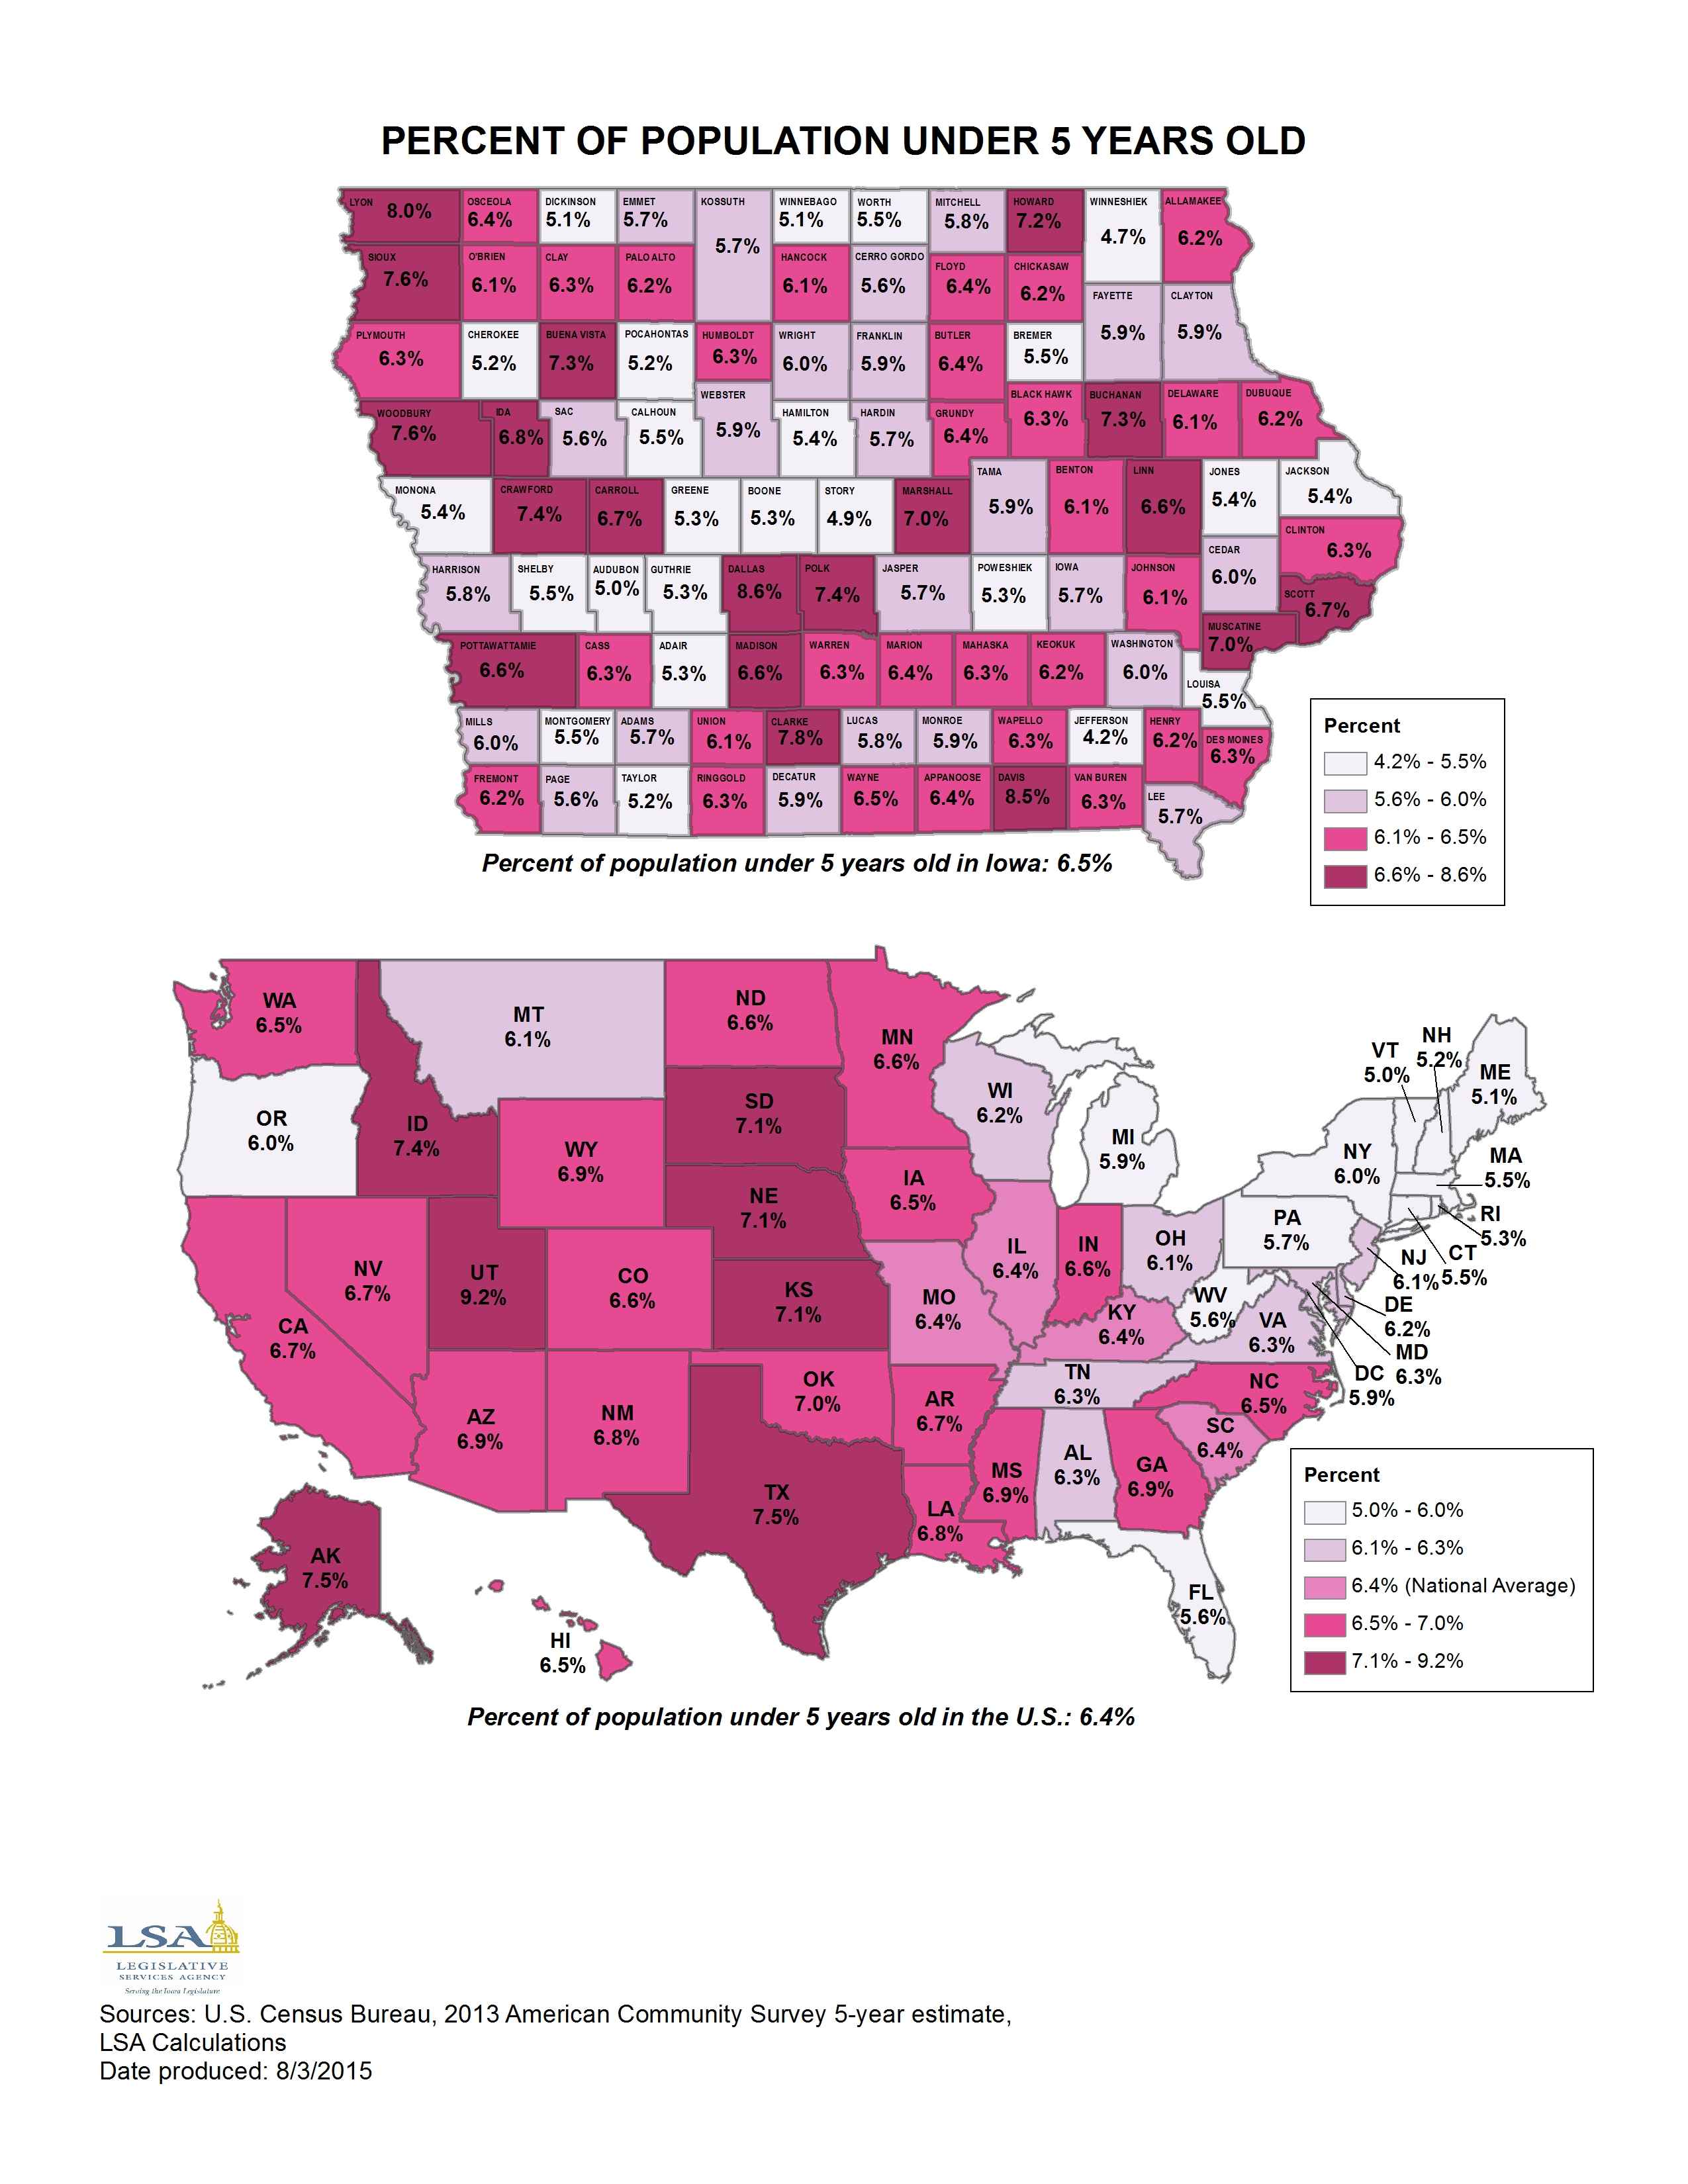
Percent of Population Under 5-Years Old
|
|
|
|
|
| 07/27/2015 |
Iowa Insights |
Estimated Population by Iowa County

|
|
|
|
|
| 07/20/2015 |
Iowa Insights |
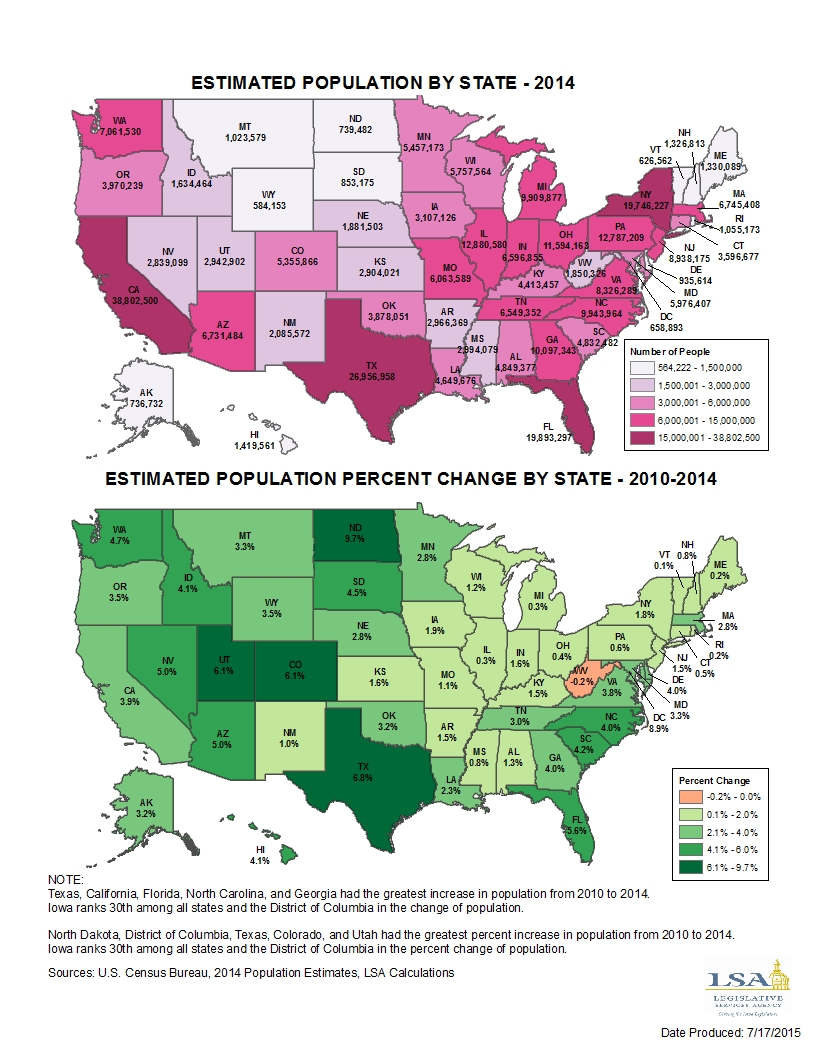
Estimated Population by State
|
|
|
|
|
| 07/13/2015 |
Iowa Insights |
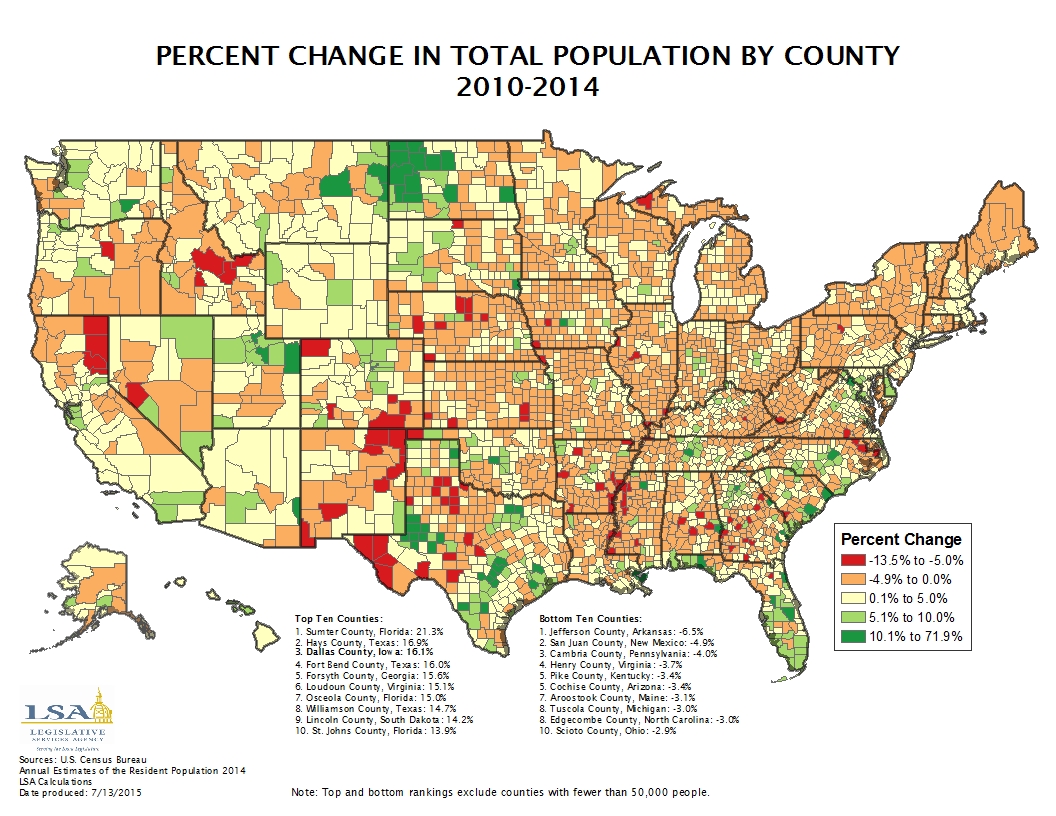
Percent Change in Total Population for U.S. Counties
|
|
|
|
|
| 07/06/2015 |
Iowa Insights |
Fireworks Laws by State - 2015

|
|
|
|
|
| 06/29/2015 |
Iowa Insights |
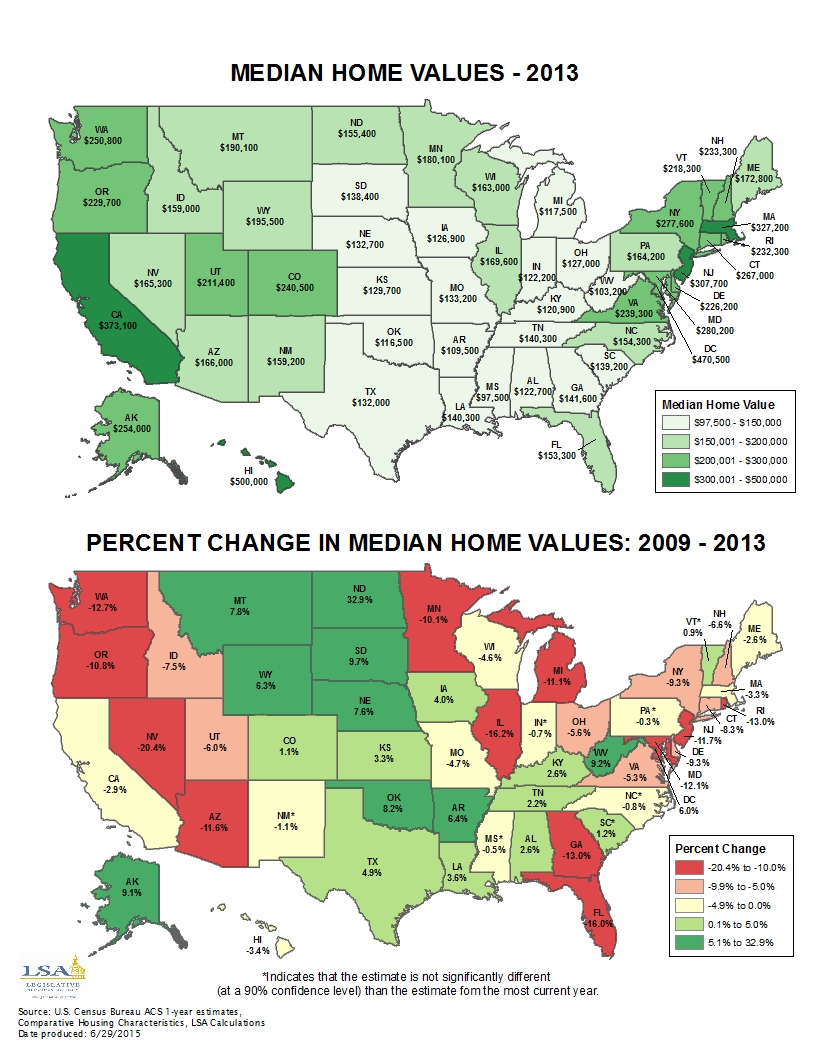
Median Home Values - 2013
|
|
|
|
|
| 06/22/2015 |
Iowa Insights |
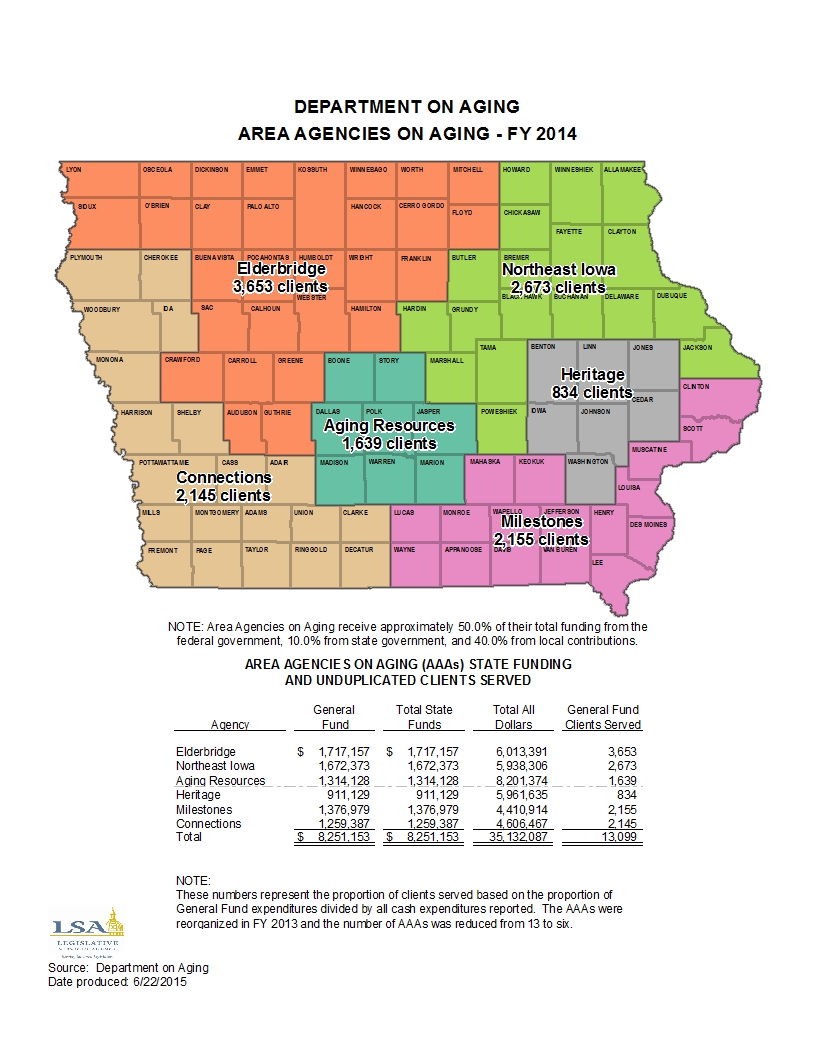
Area Agencies on Aging - FY 2014
|
|
|
|
|
| 06/15/2015 |
Iowa Insights |
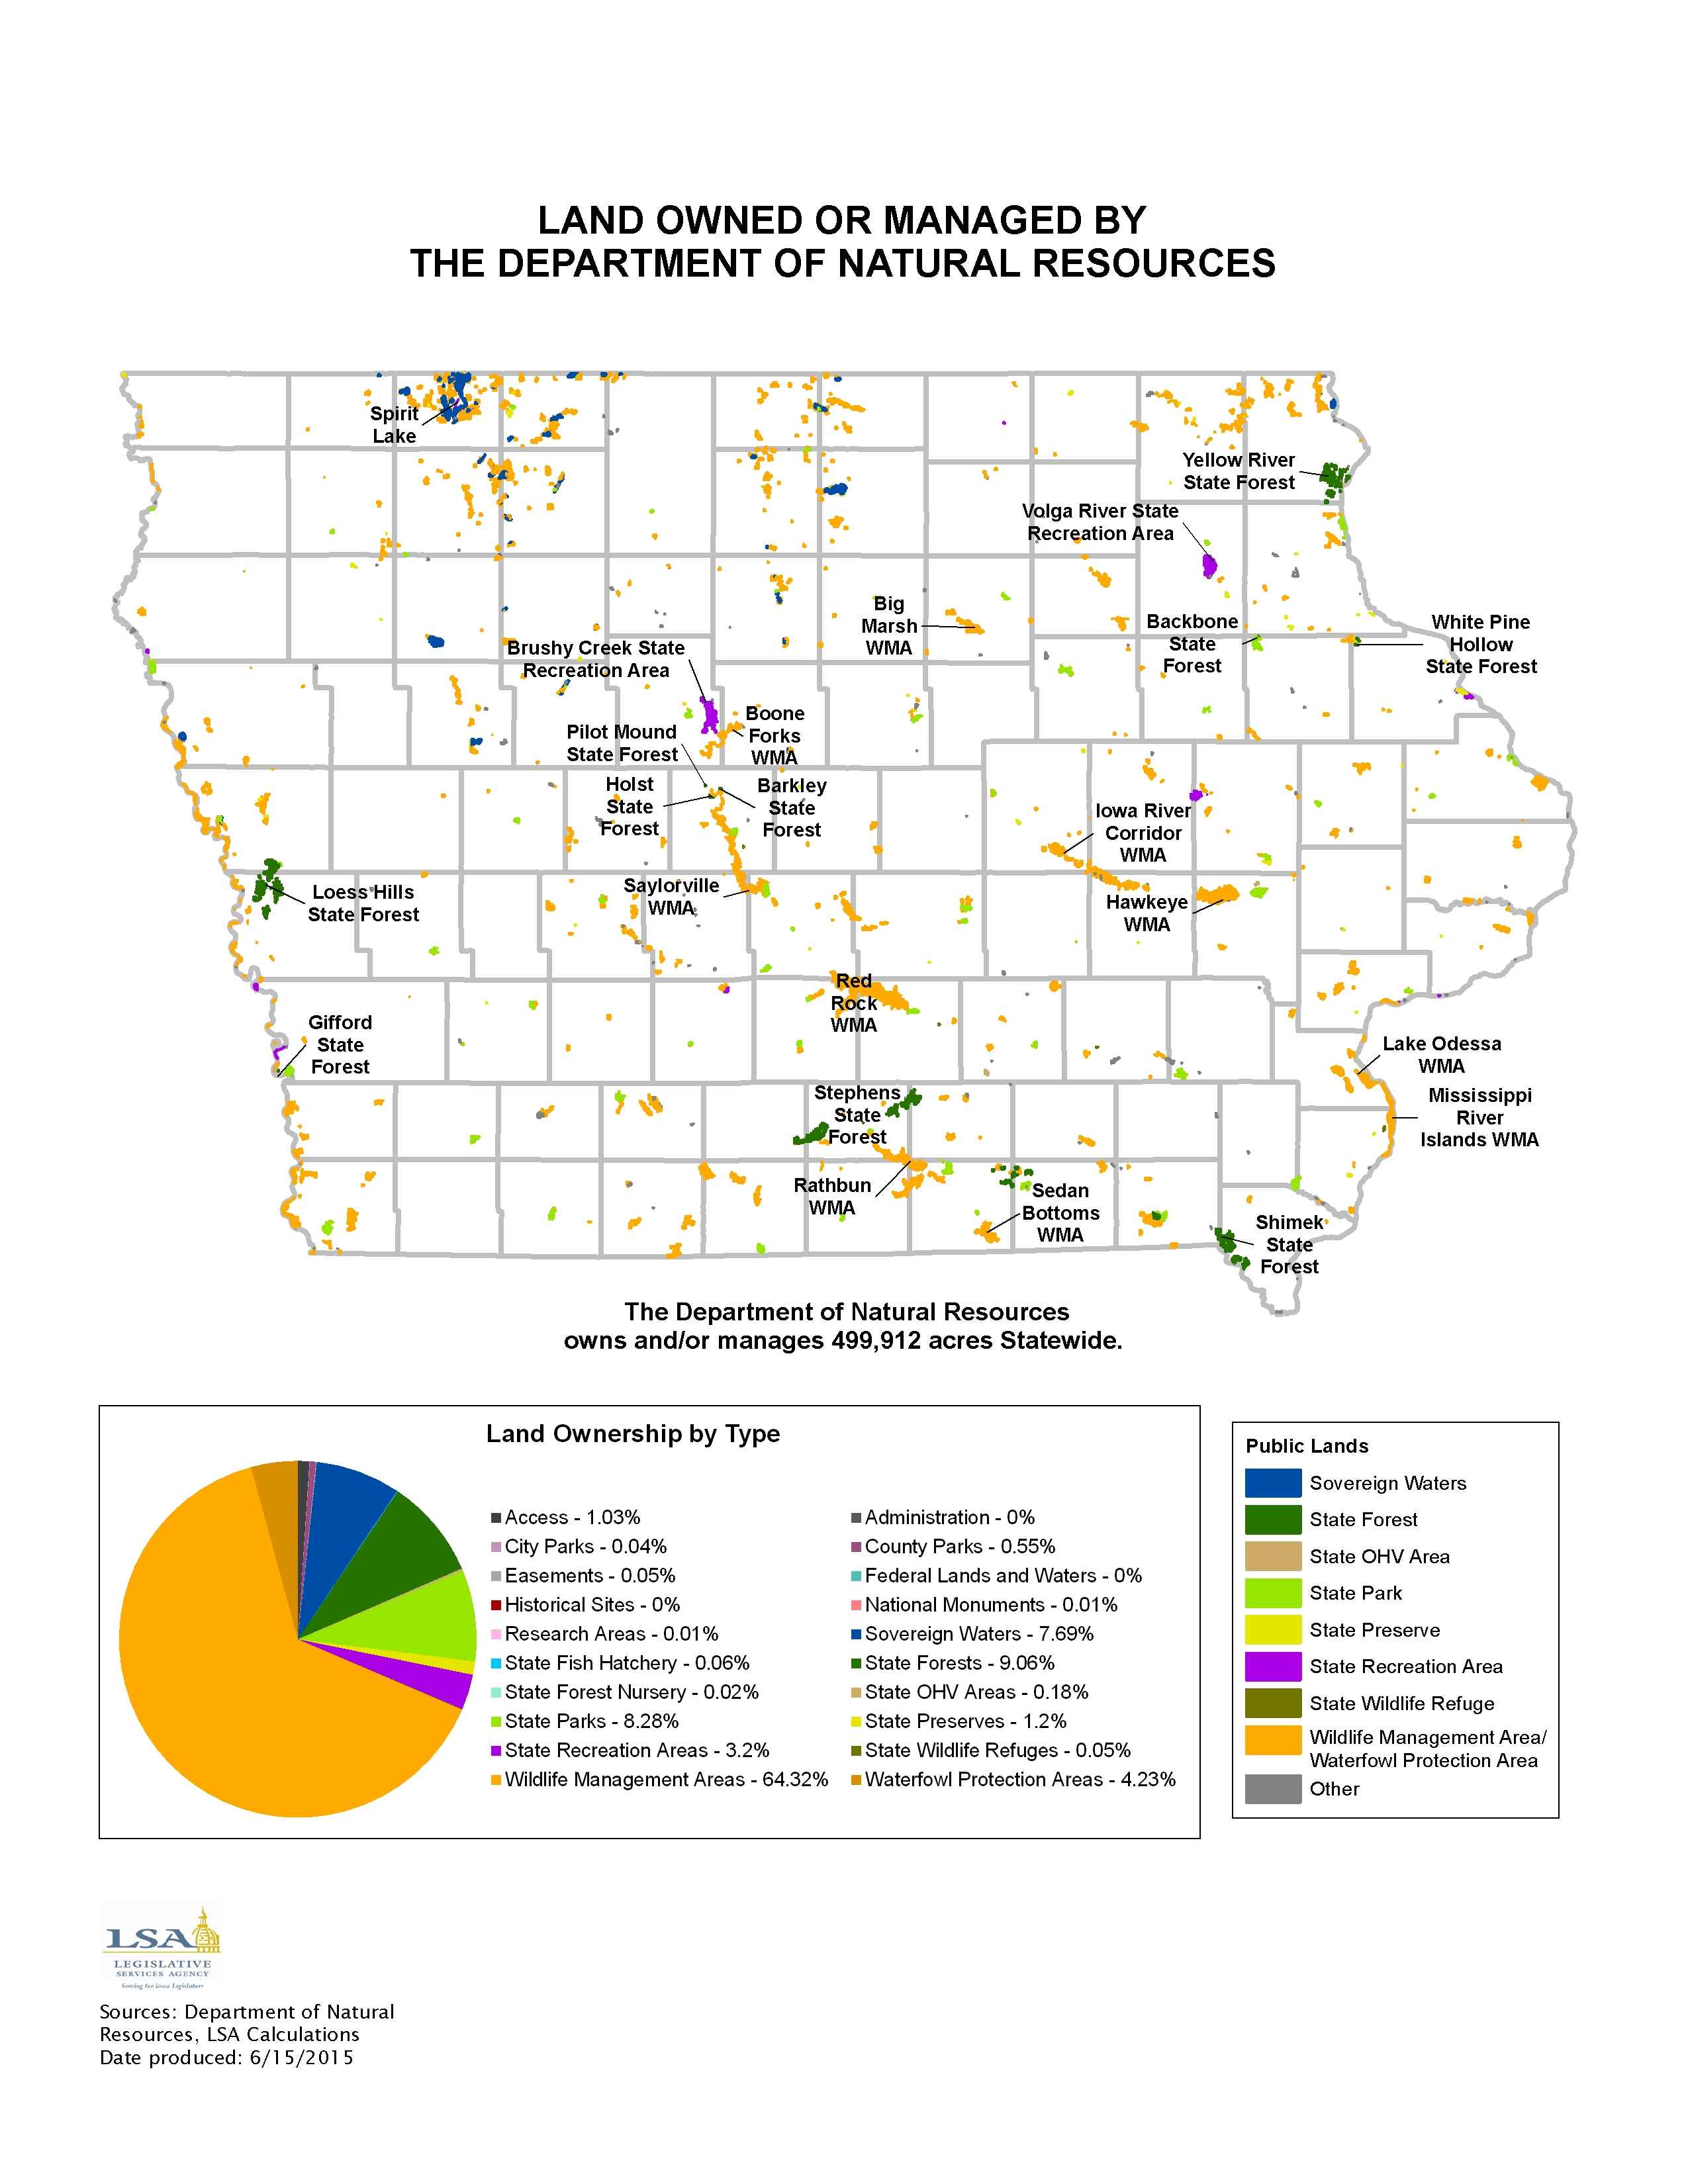
Land Owned or Managed by the Iowa Department of Natural Resources
|
|
|
|
|
| 06/08/2015 |
Iowa Insights |
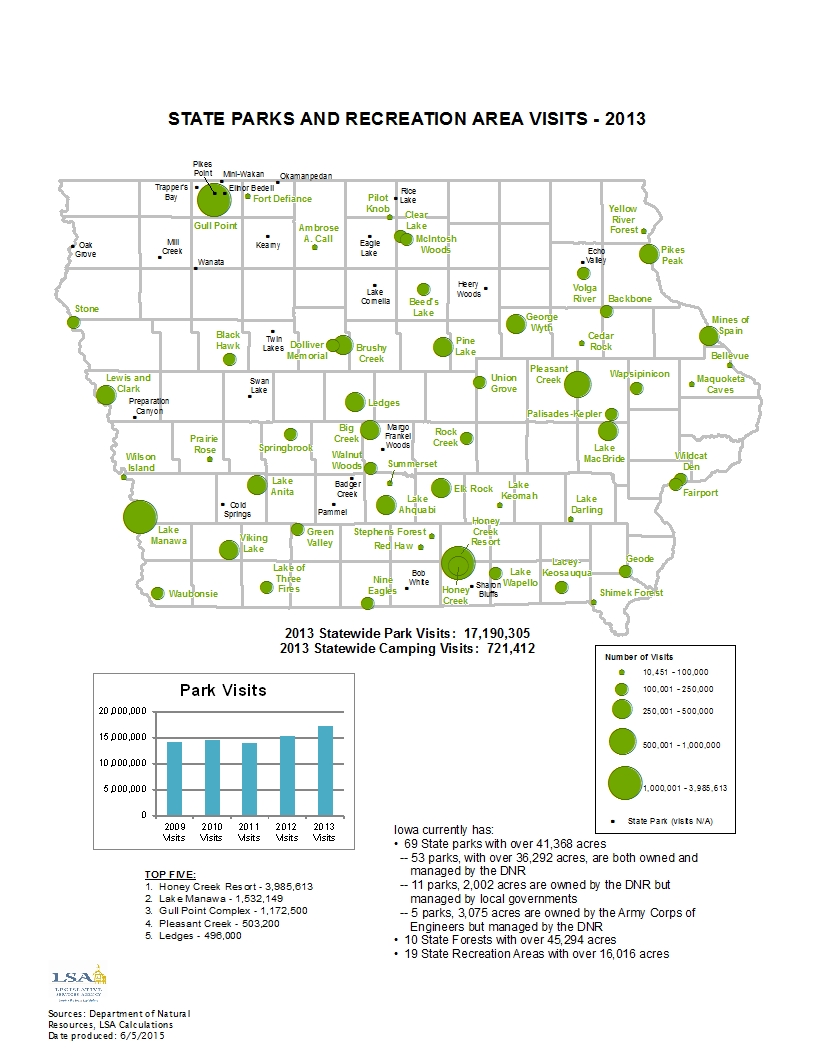
State Parks and Recreation Area Visits - 2013
|
|
|
|
|
| 06/01/2015 |
Iowa Insights |
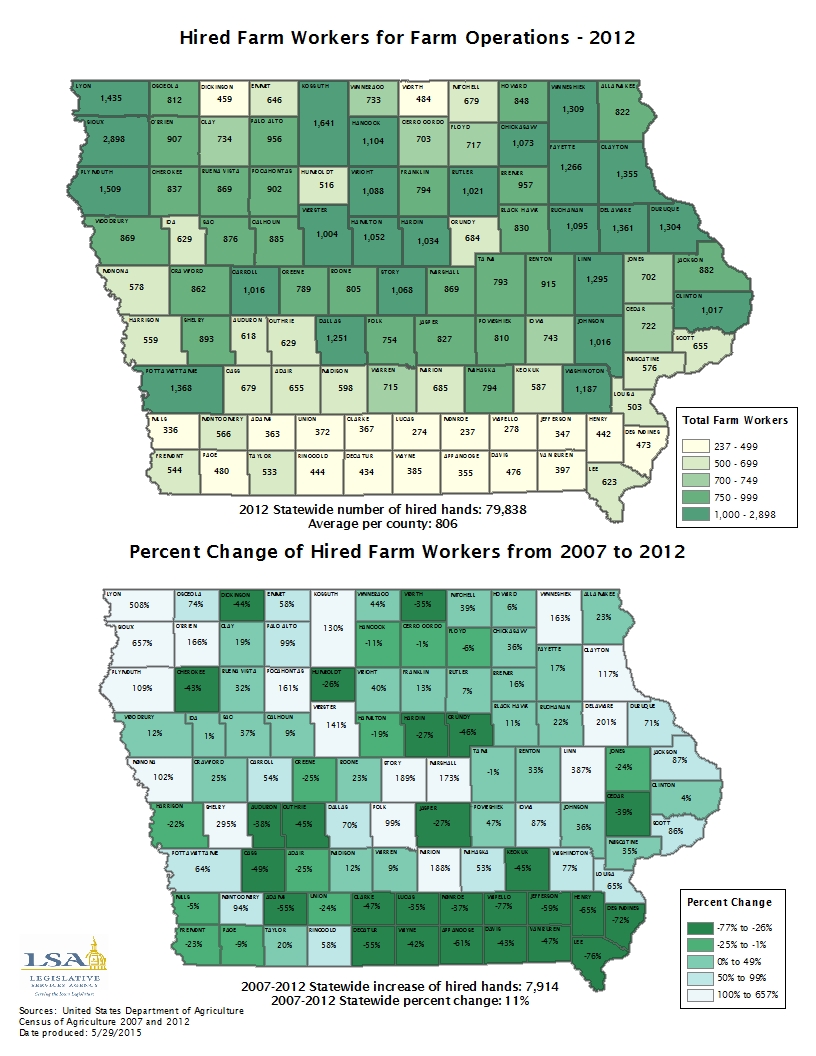
Hired Farm Workers for Farm Operations - 2012
|
|
|
|
|
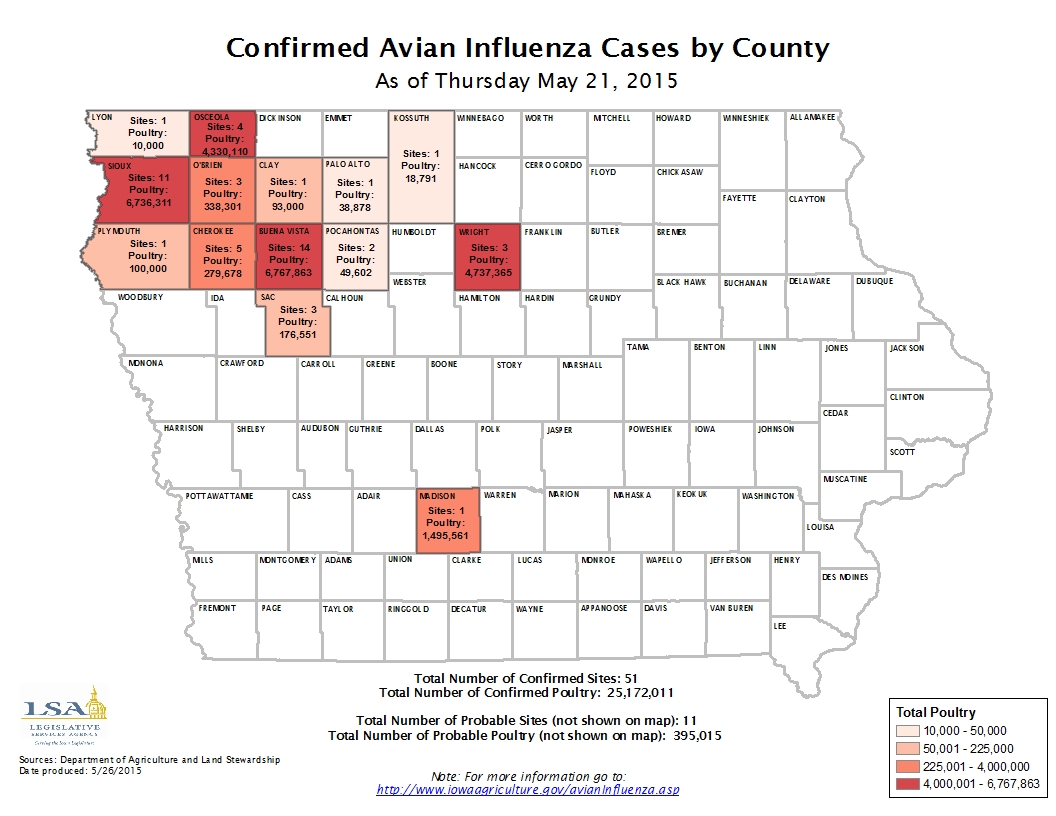
| 05/26/2015 |
Iowa Insights |
Confirmed Avian Influenza Cases
|
|
|
|
|
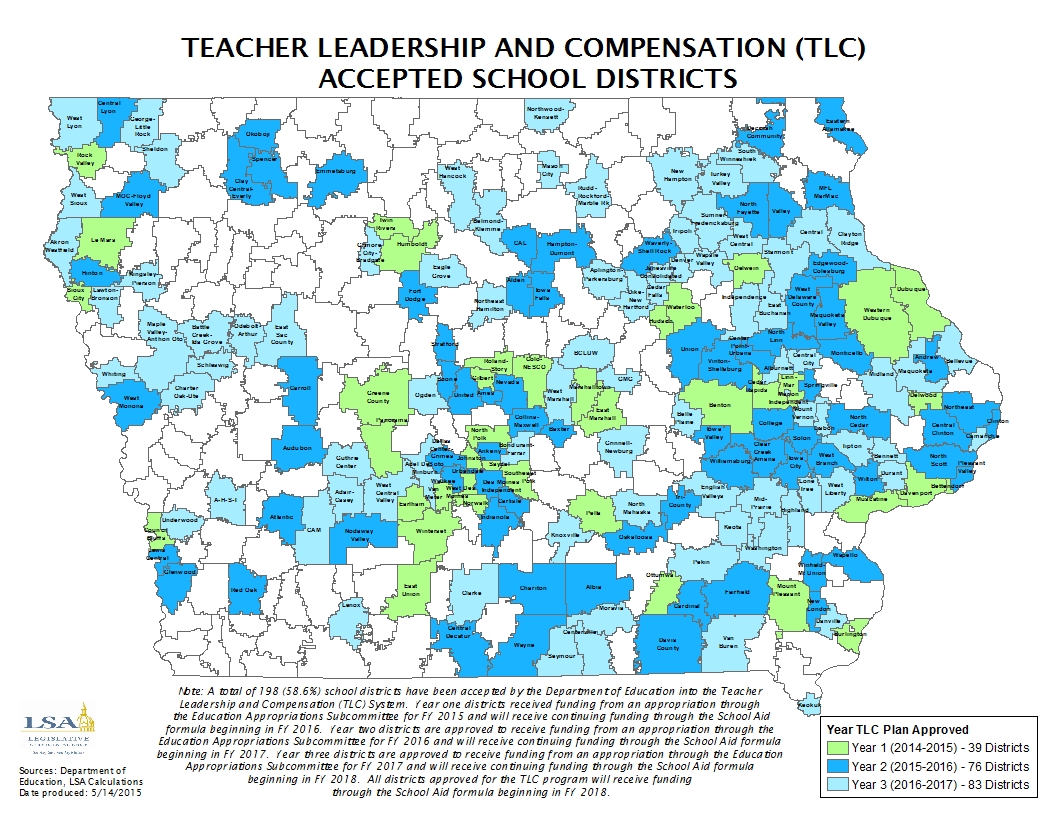
| 05/18/2015 |
Iowa Insights |
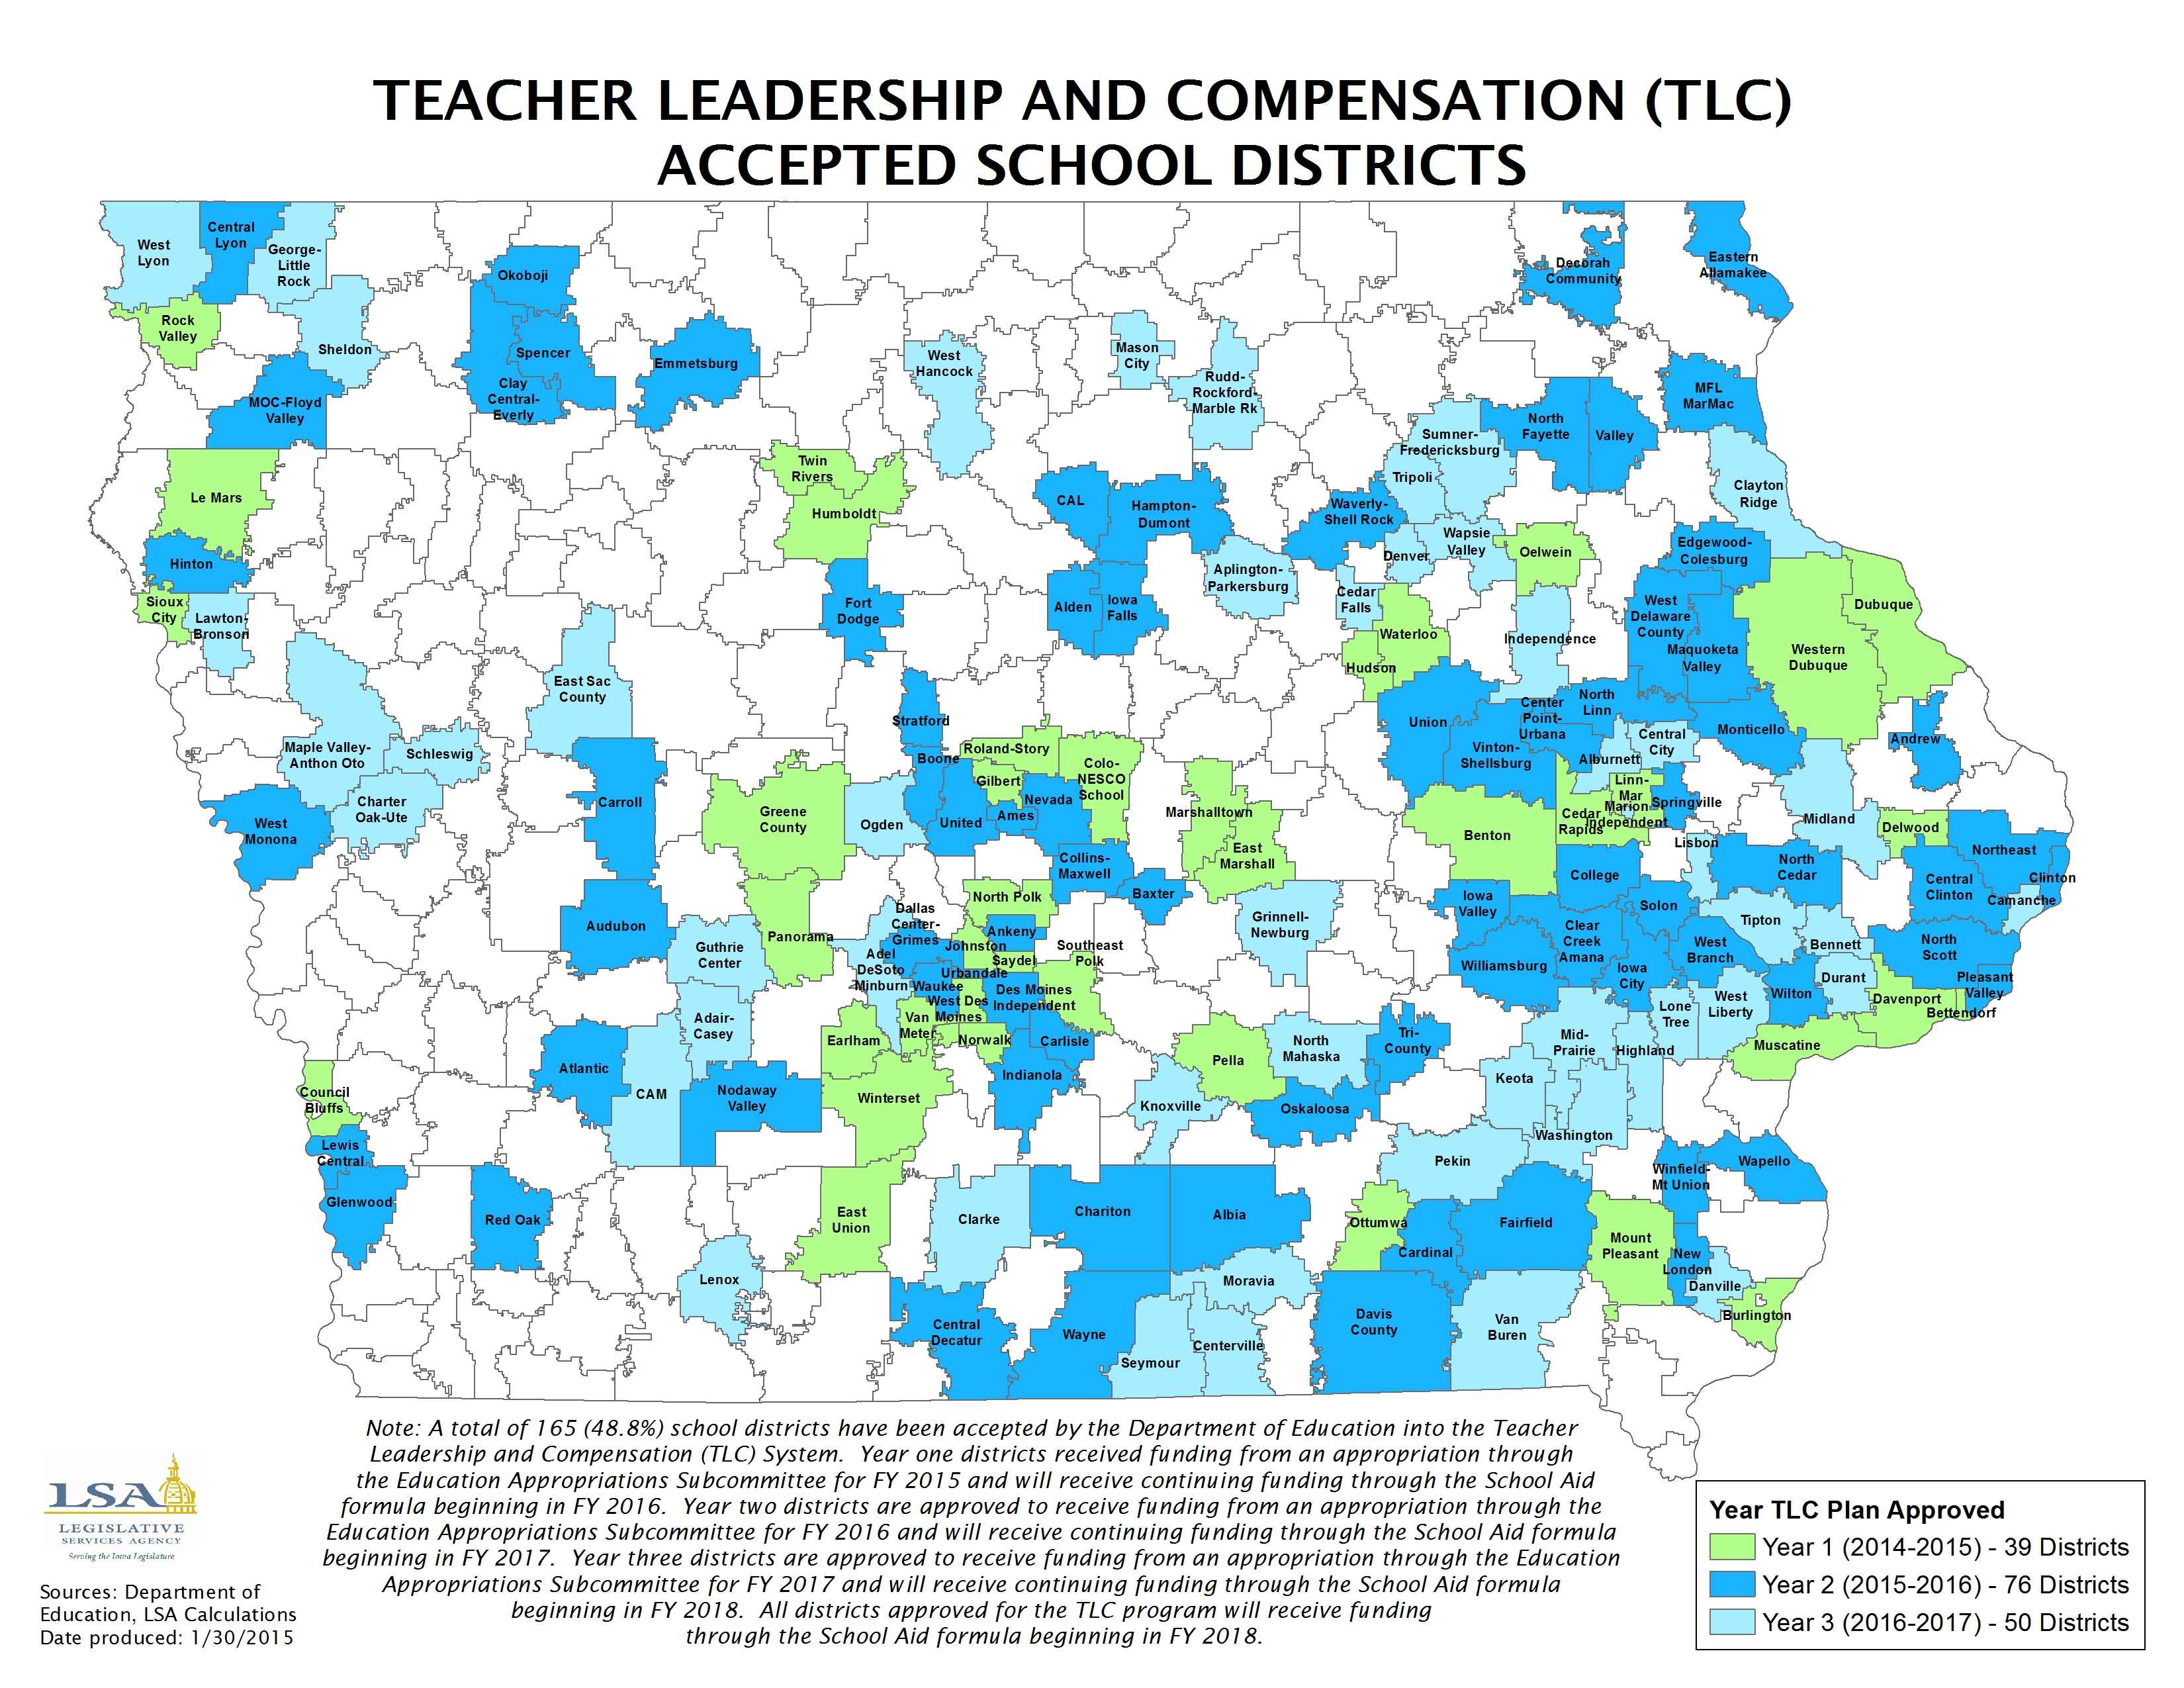
Teacher Leadership and Compensation (TLC) Accepted School Districts
|
|
|
|
|
| 05/11/2015 |
Iowa Insights |
Confirmed Avian Influenza Cases

|
|
|
|
|
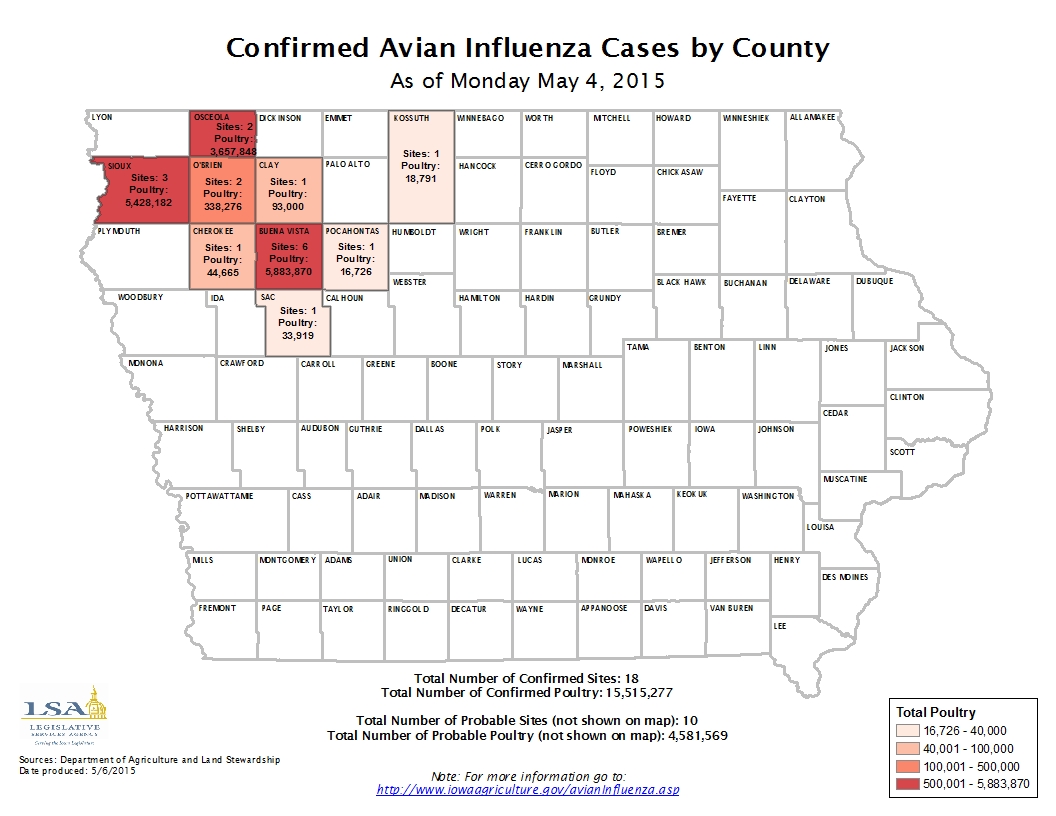
| 05/04/2015 |
Iowa Insights |
Confirmed Avian Influenza Cases
|
|
|
|
|
| 04/27/2015 |
Iowa Insights |
Per Capita Personal Income

|
|
|
|
|
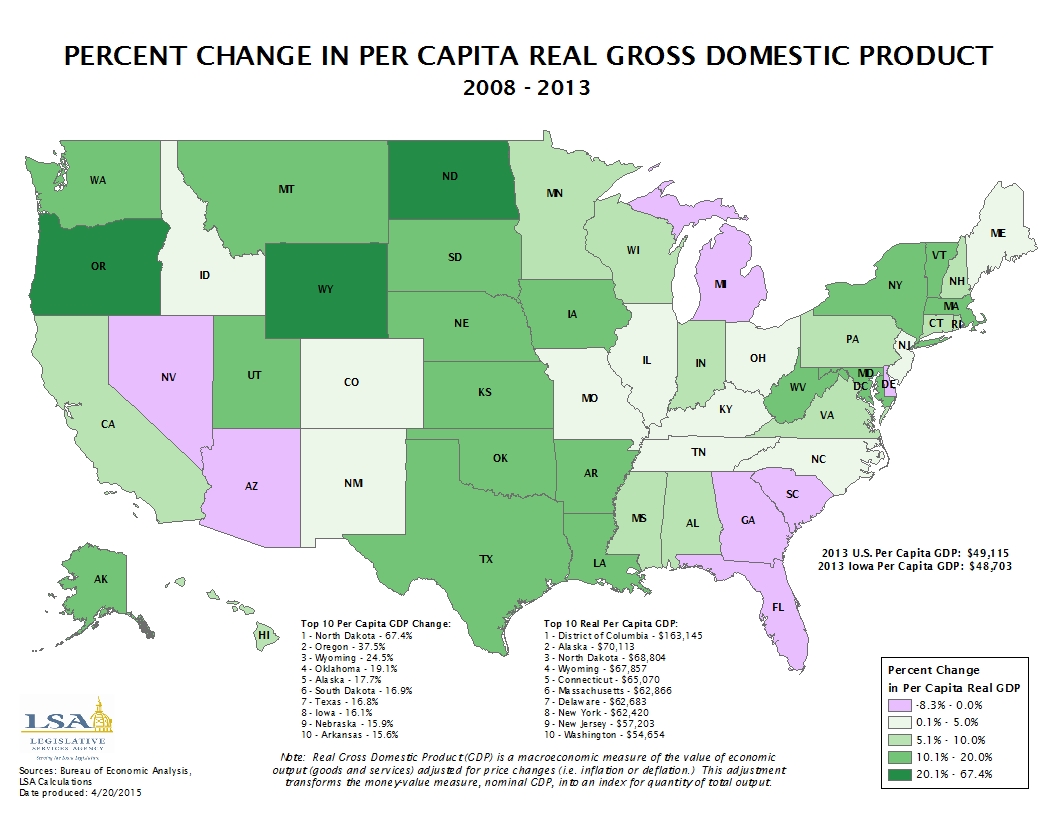
| 04/20/2015 |
Iowa Insights |
Percent Change in Per Capita Real Gross Domestic Product
|
|
|
|
|
| 04/13/2015 |
Iowa Insights |
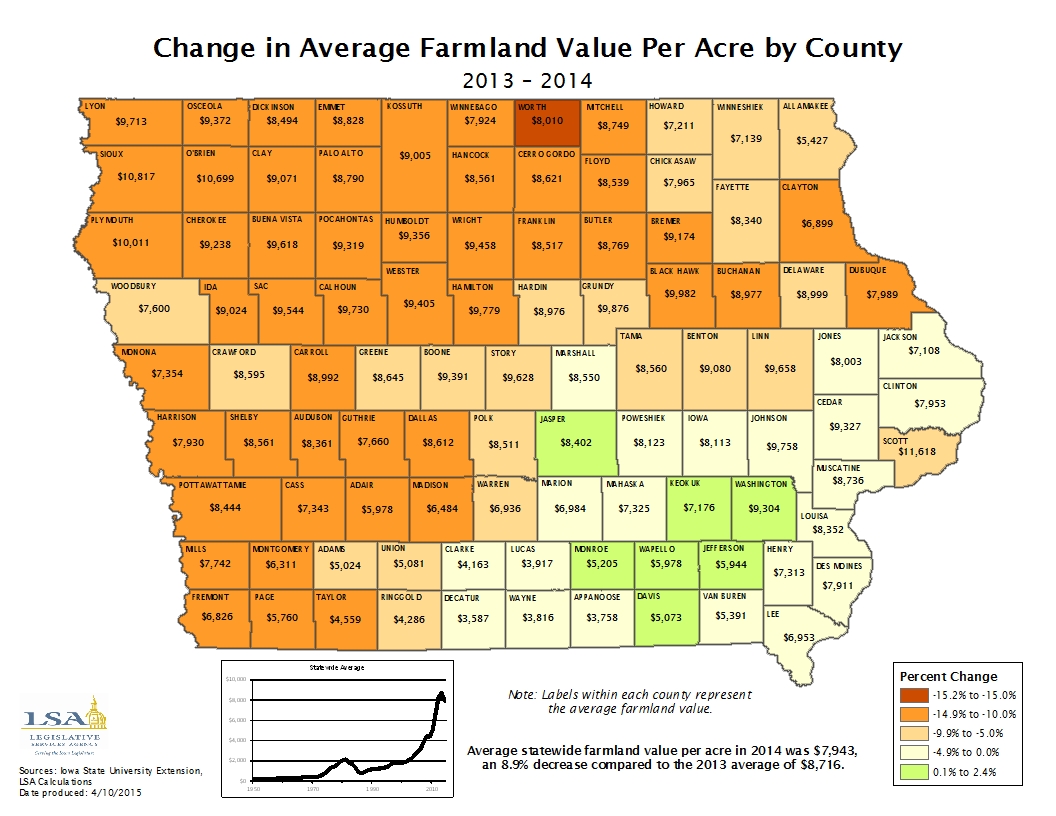
Change in Average Farmland Value Per Acre by County
|
|
|
|
|
| 04/06/2015 |
Iowa Insights |
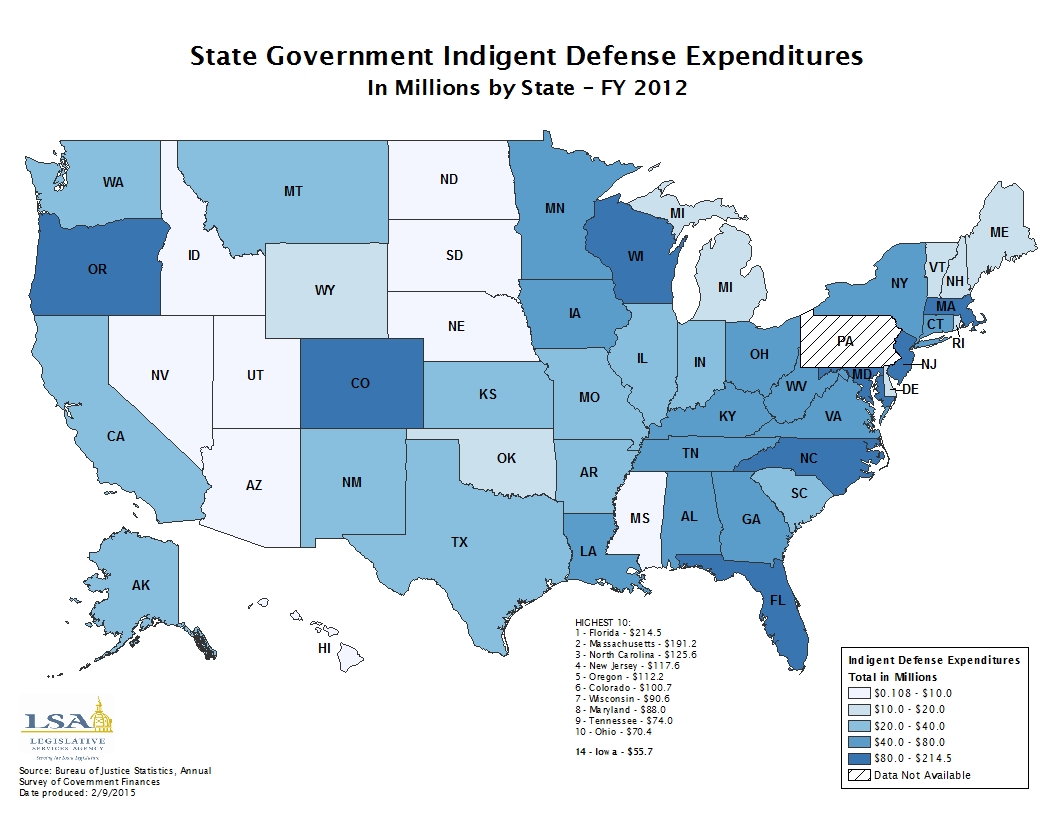
State Government Indigent Defense Expenditures - FY 2012
|
|
|
|
|
| 03/30/2015 |
Iowa Insights |
Number of State and Federal Prisoner Deaths - 2012

|
|
|
|
|
| 03/23/2015 |
Iowa Insights |
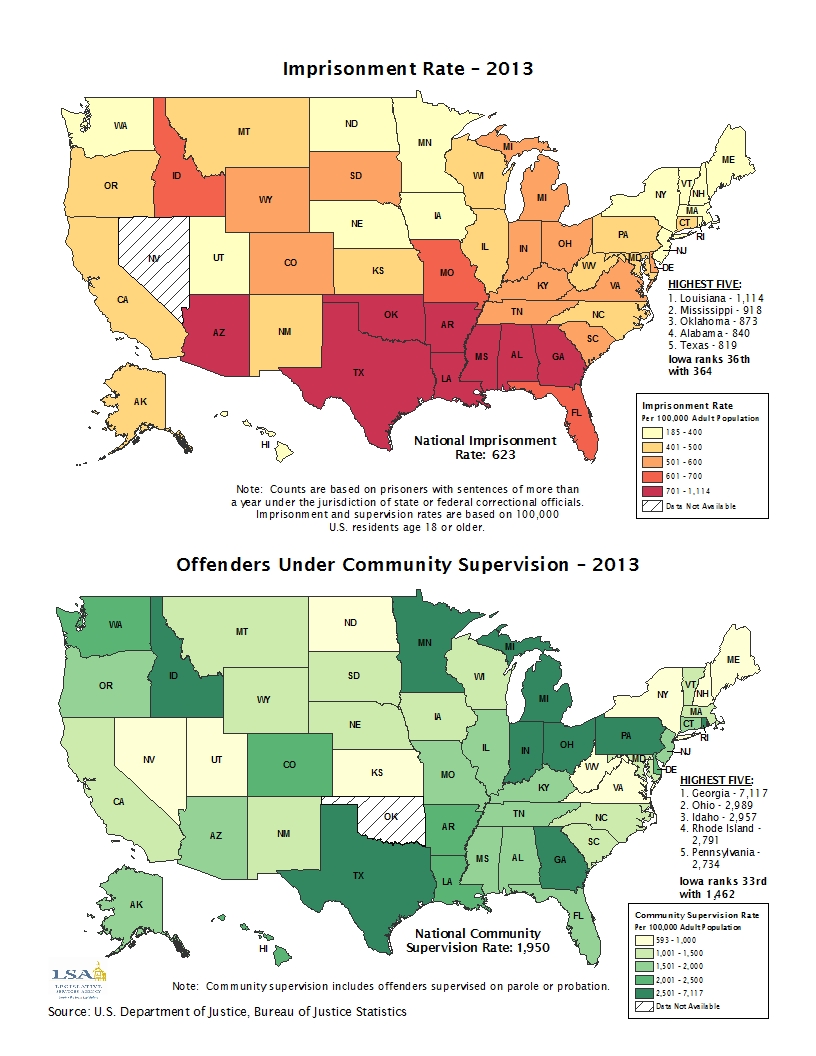
Imprisonment Rate and Community Supervision Rate - 2013
|
|
|
|
|
| 03/16/2015 |
Iowa Insights |
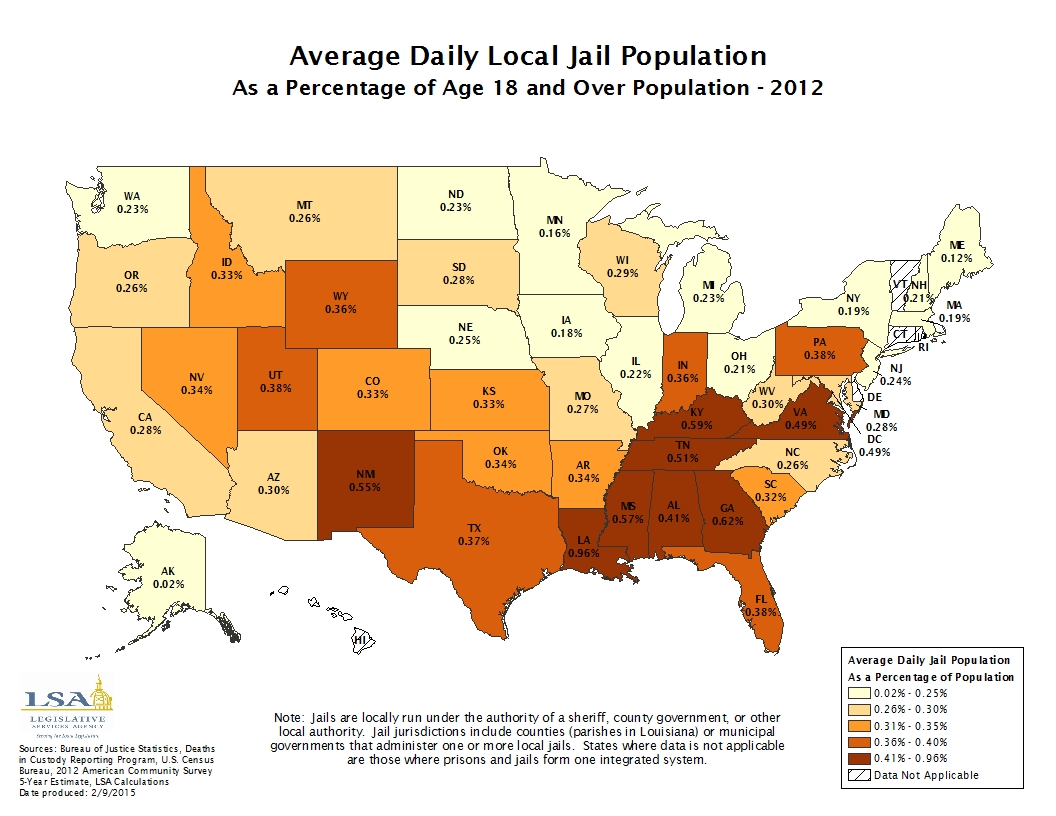
Average Daily Local Jail Population - 2012
|
|
|
|
|
| 03/09/2015 |
Iowa Insights |
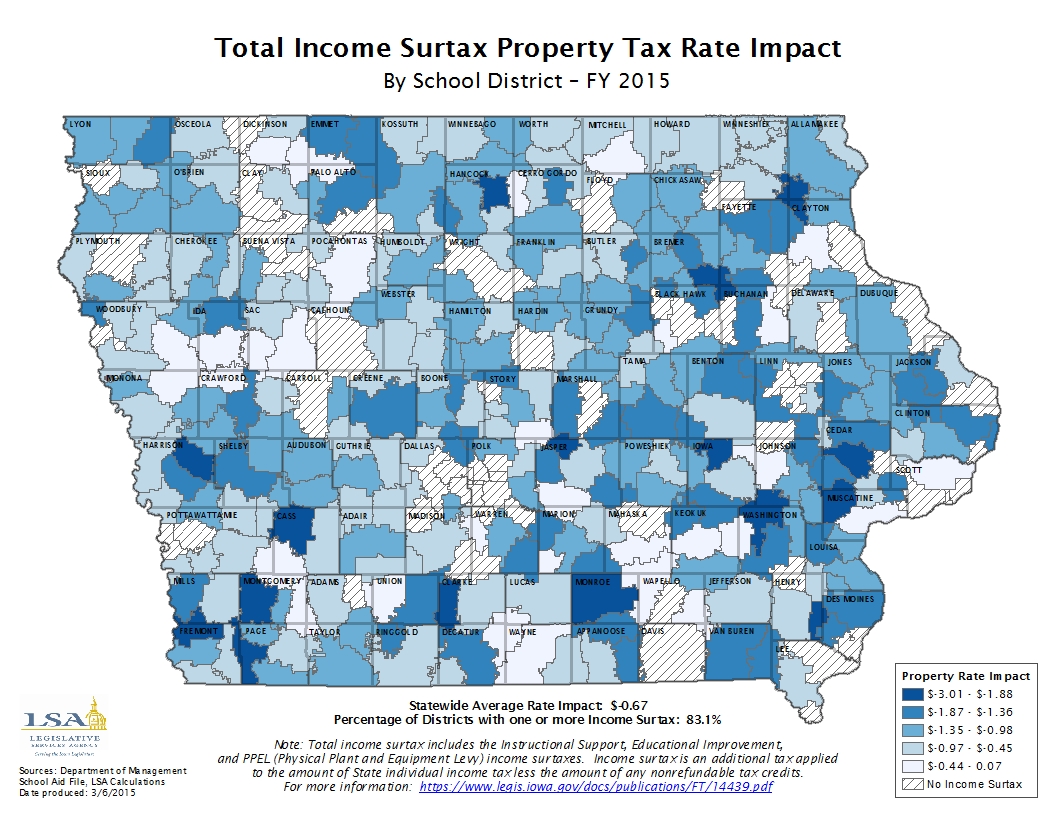
Total Income Surtax Property Tax Rate Impact
|
|
|
|
|
| 03/02/2015 |
Iowa Insights |
Districts at Capacity - Regular PPEL and Voter Approved PPEL

|
|
|
|
|
| 02/23/2015 |
Iowa Insights |
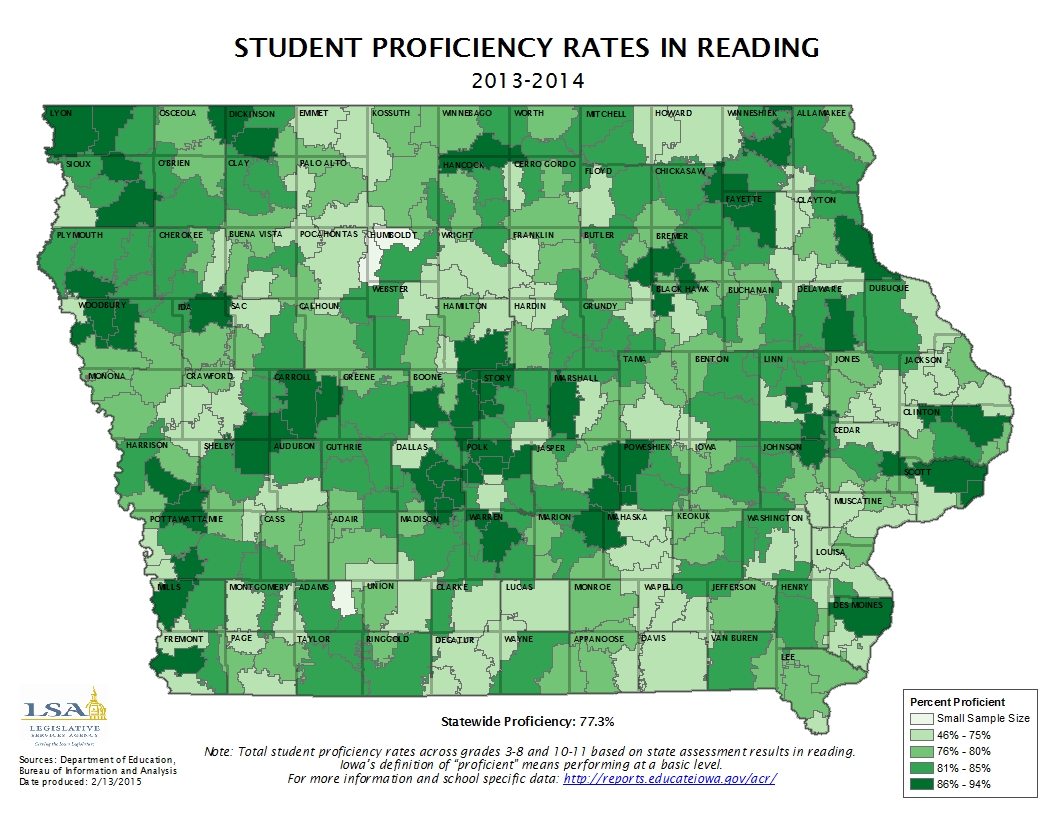
Student Proficiency Rates in Reading
|
|
|
|
|
| 02/16/2015 |
Iowa Insights |
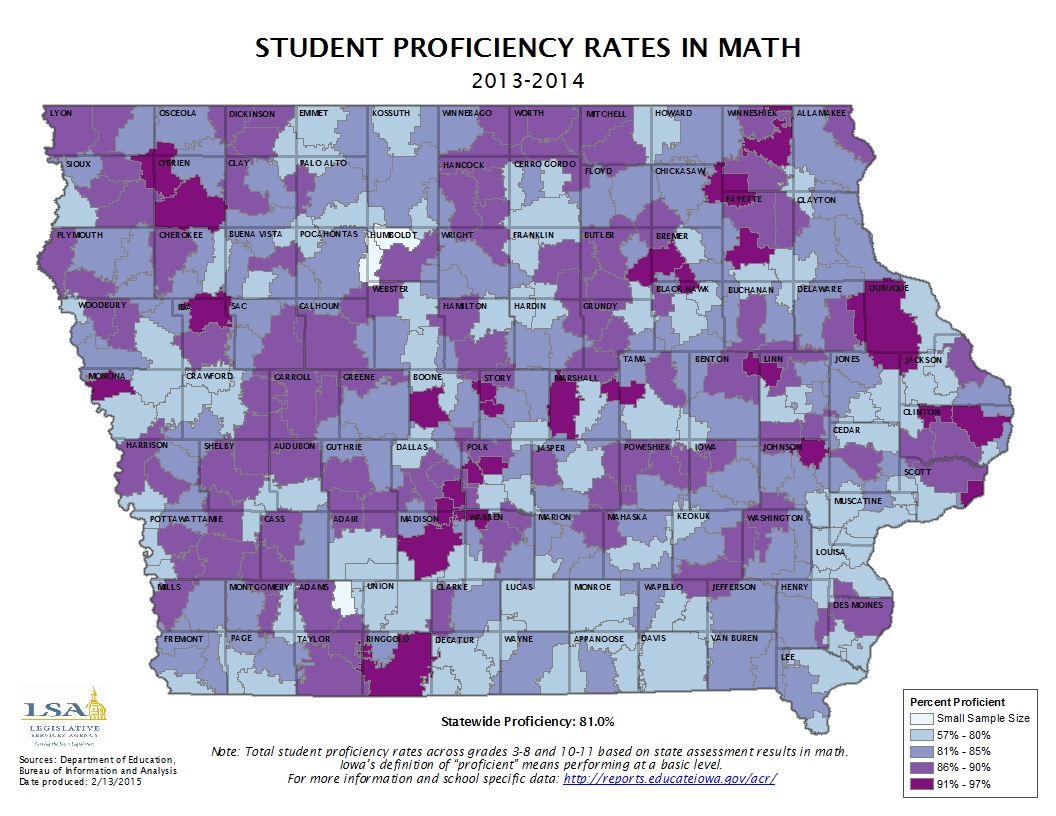
Student Proficiency Rates in Math
|
|
|
|
|
| 02/09/2015 |
Iowa Insights |
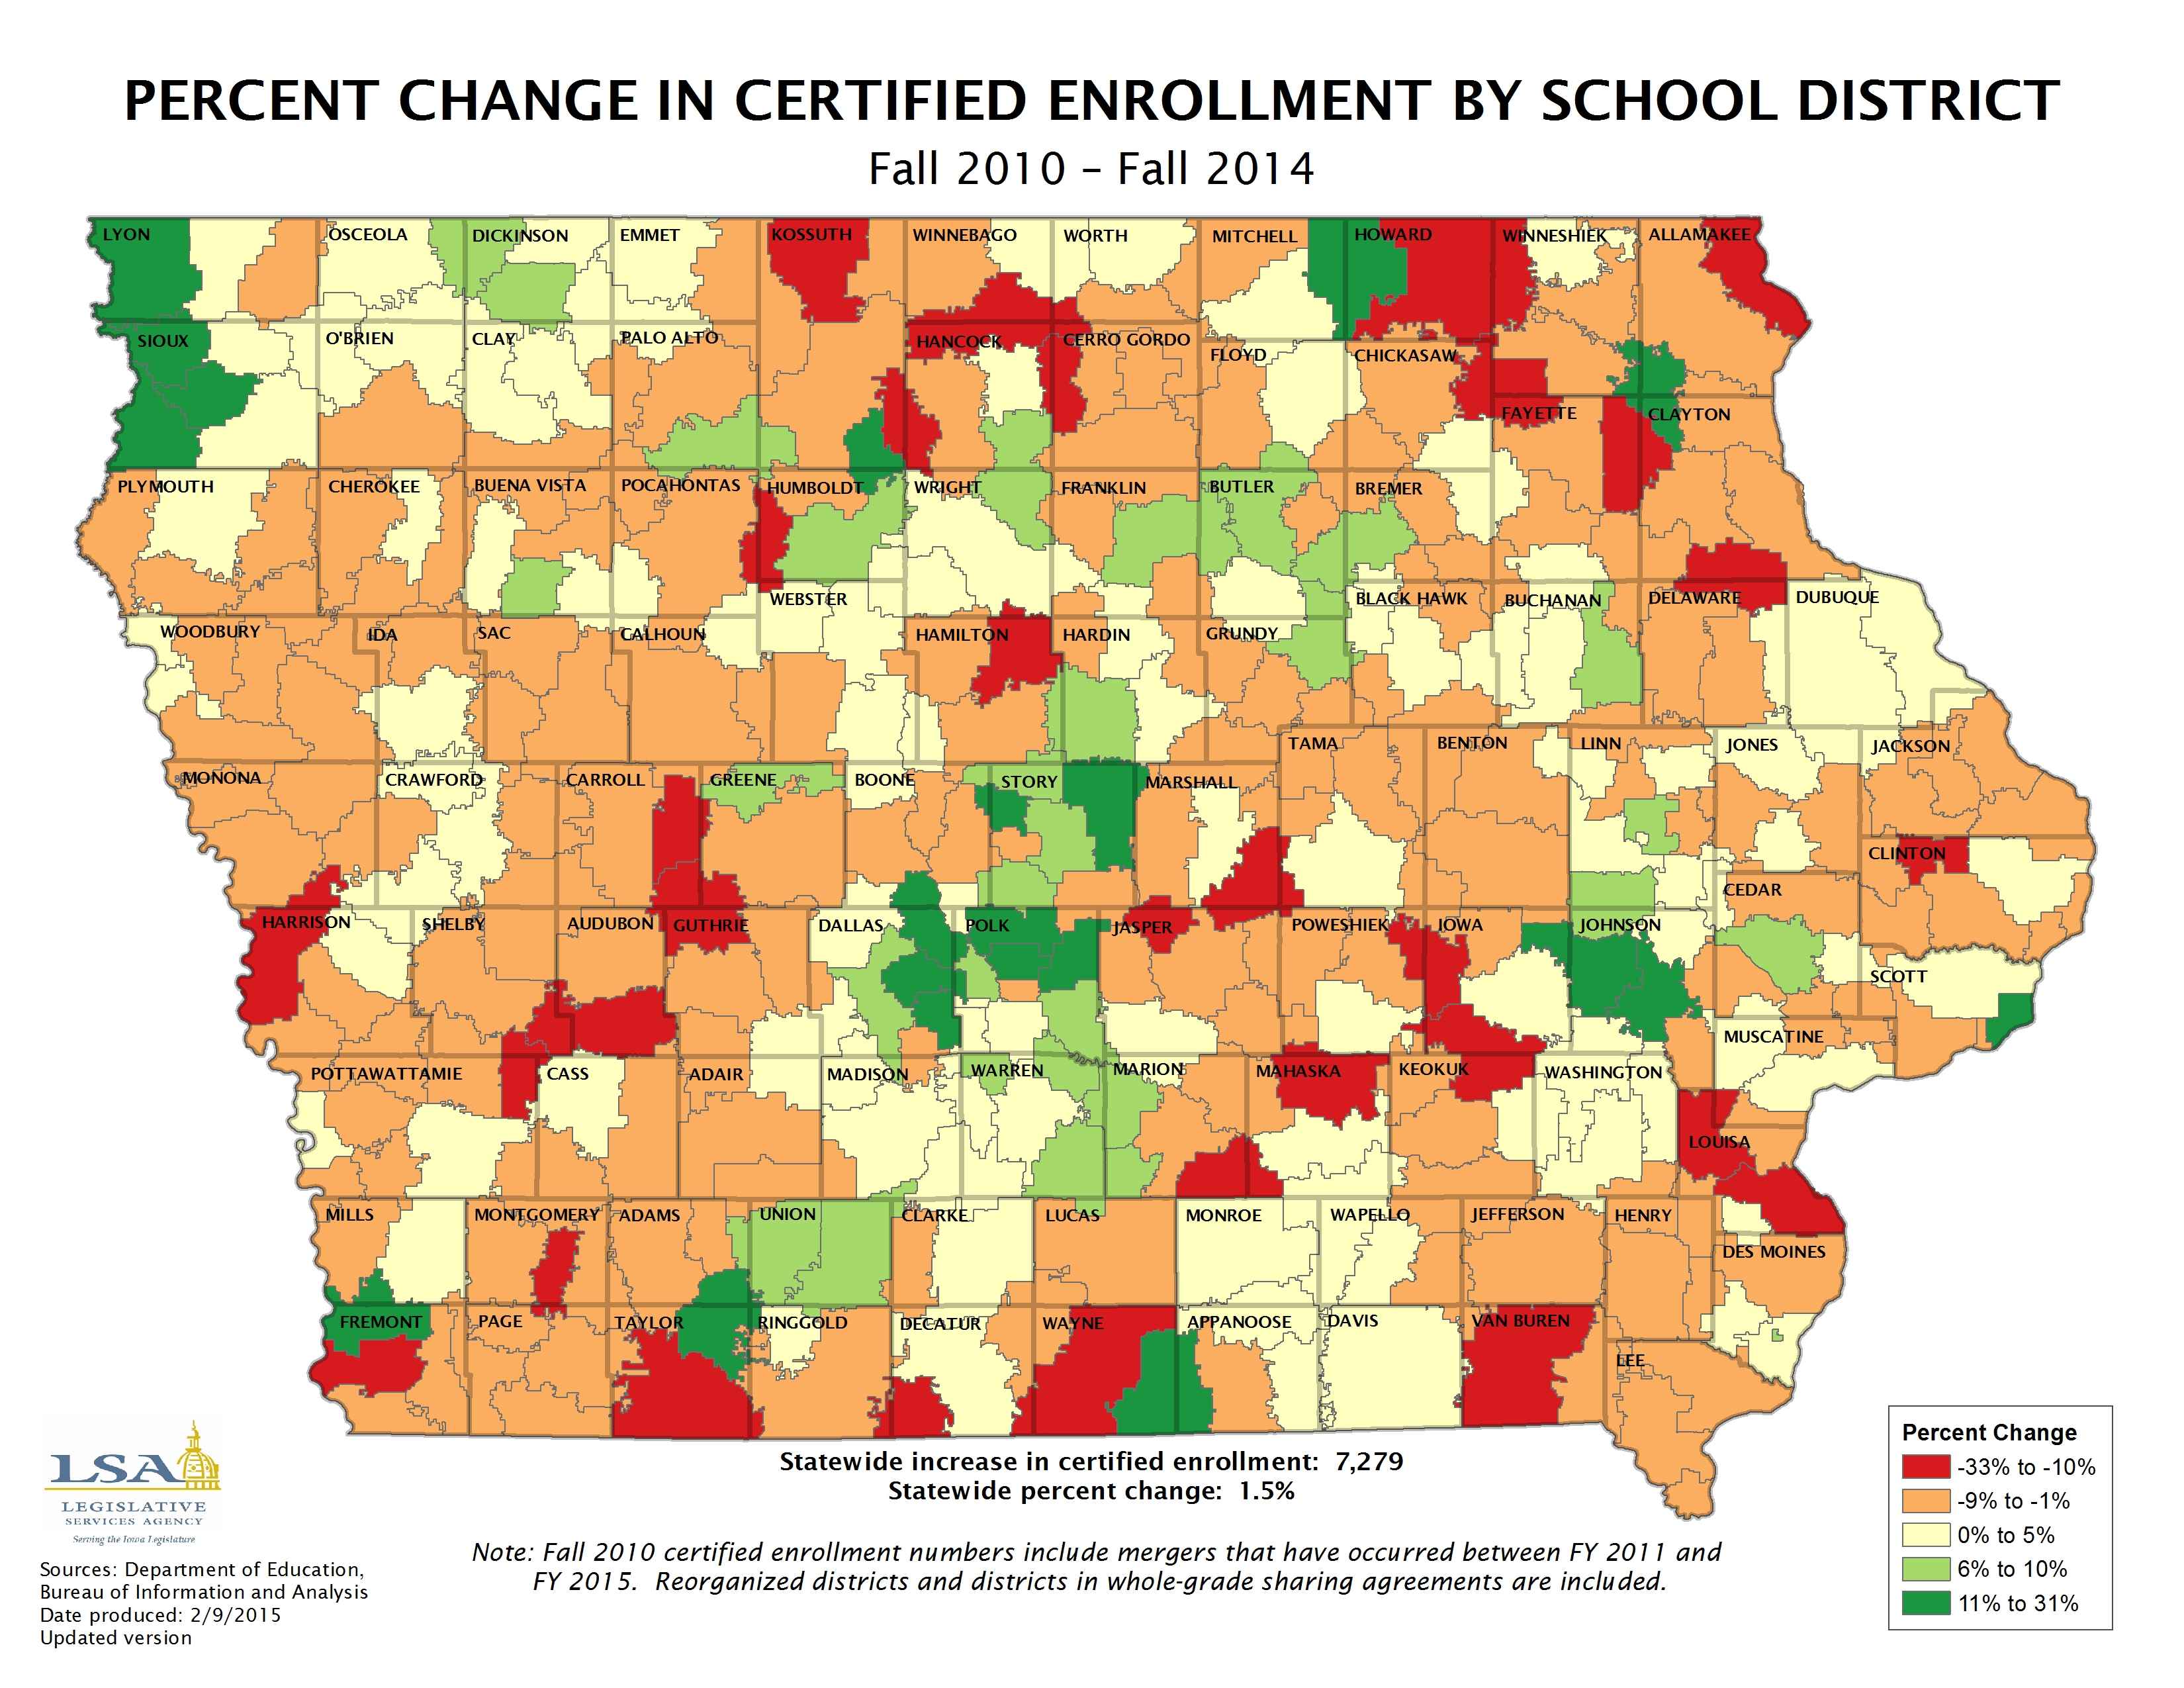
Percent Change in Certified Enrollment by School District
|
|
|
|
|
| 02/02/2015 |
Iowa Insights |
Teacher Leadership and Compensation (TLC) Accepted School Districts
|
|
|
|
|
| 01/26/2015 |
Iowa Insights |
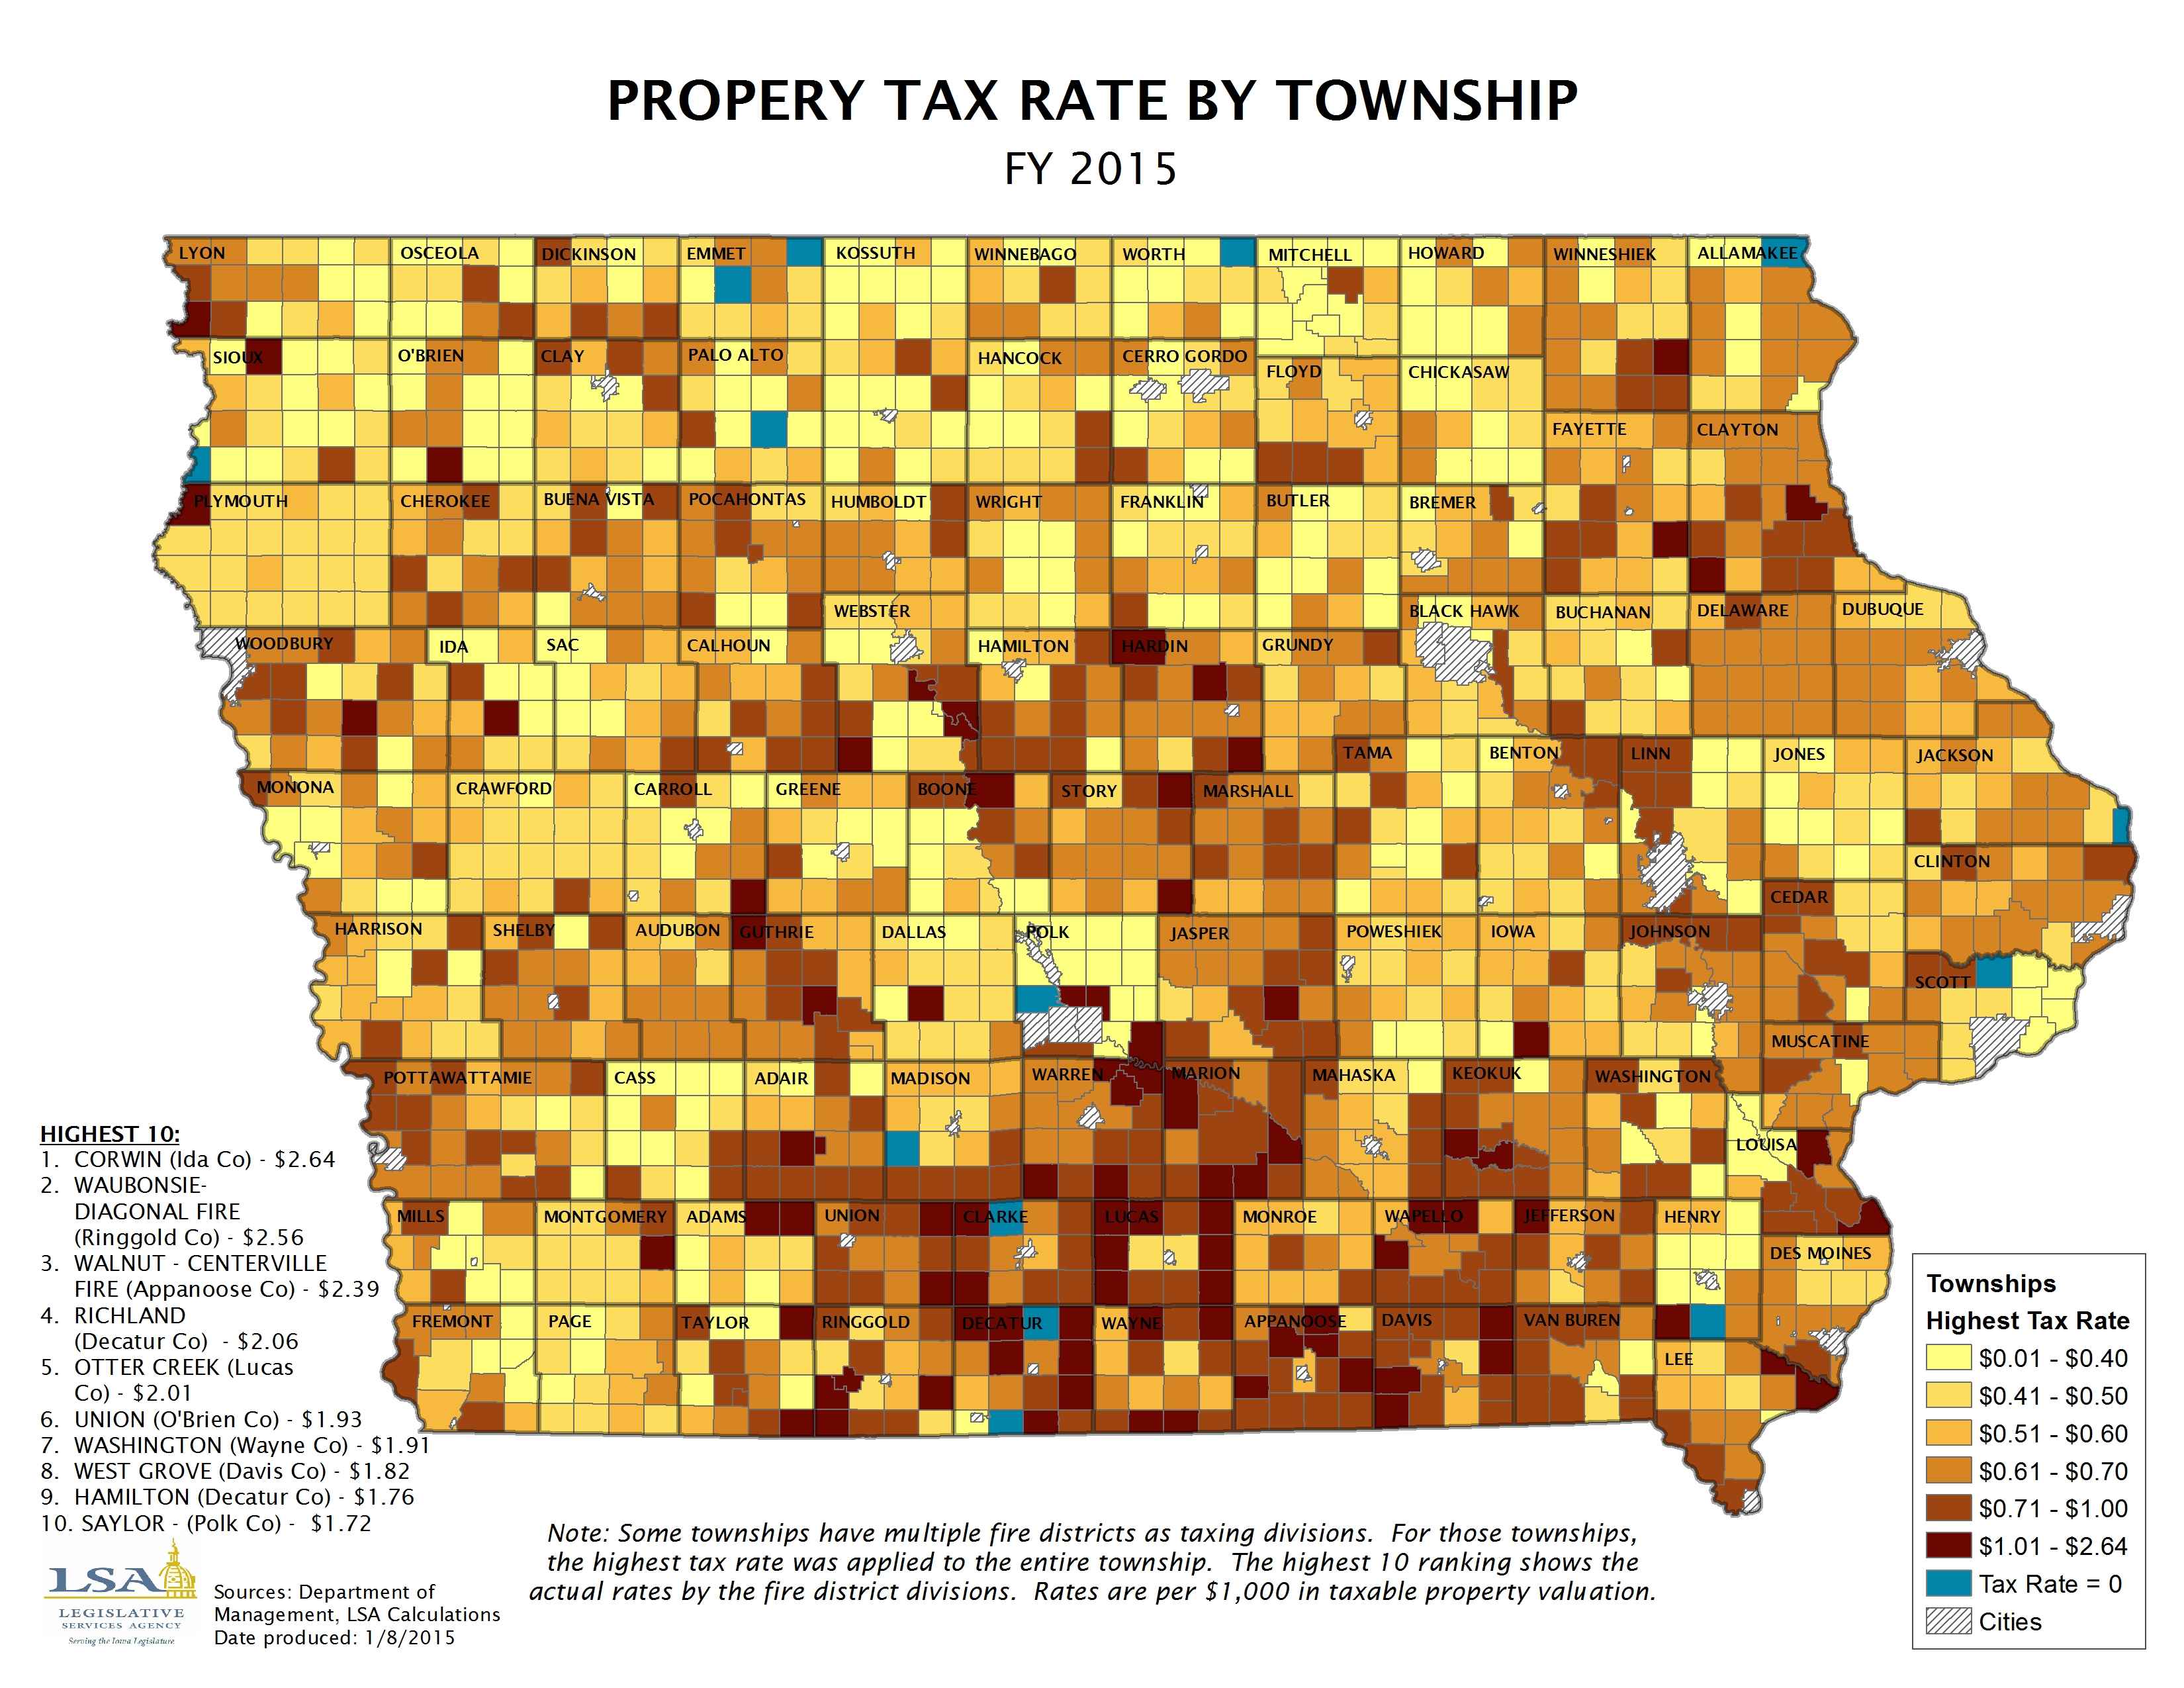
Property Tax Rate by Township
|
|
|
|
|
| 01/19/2015 |
Iowa Insights |
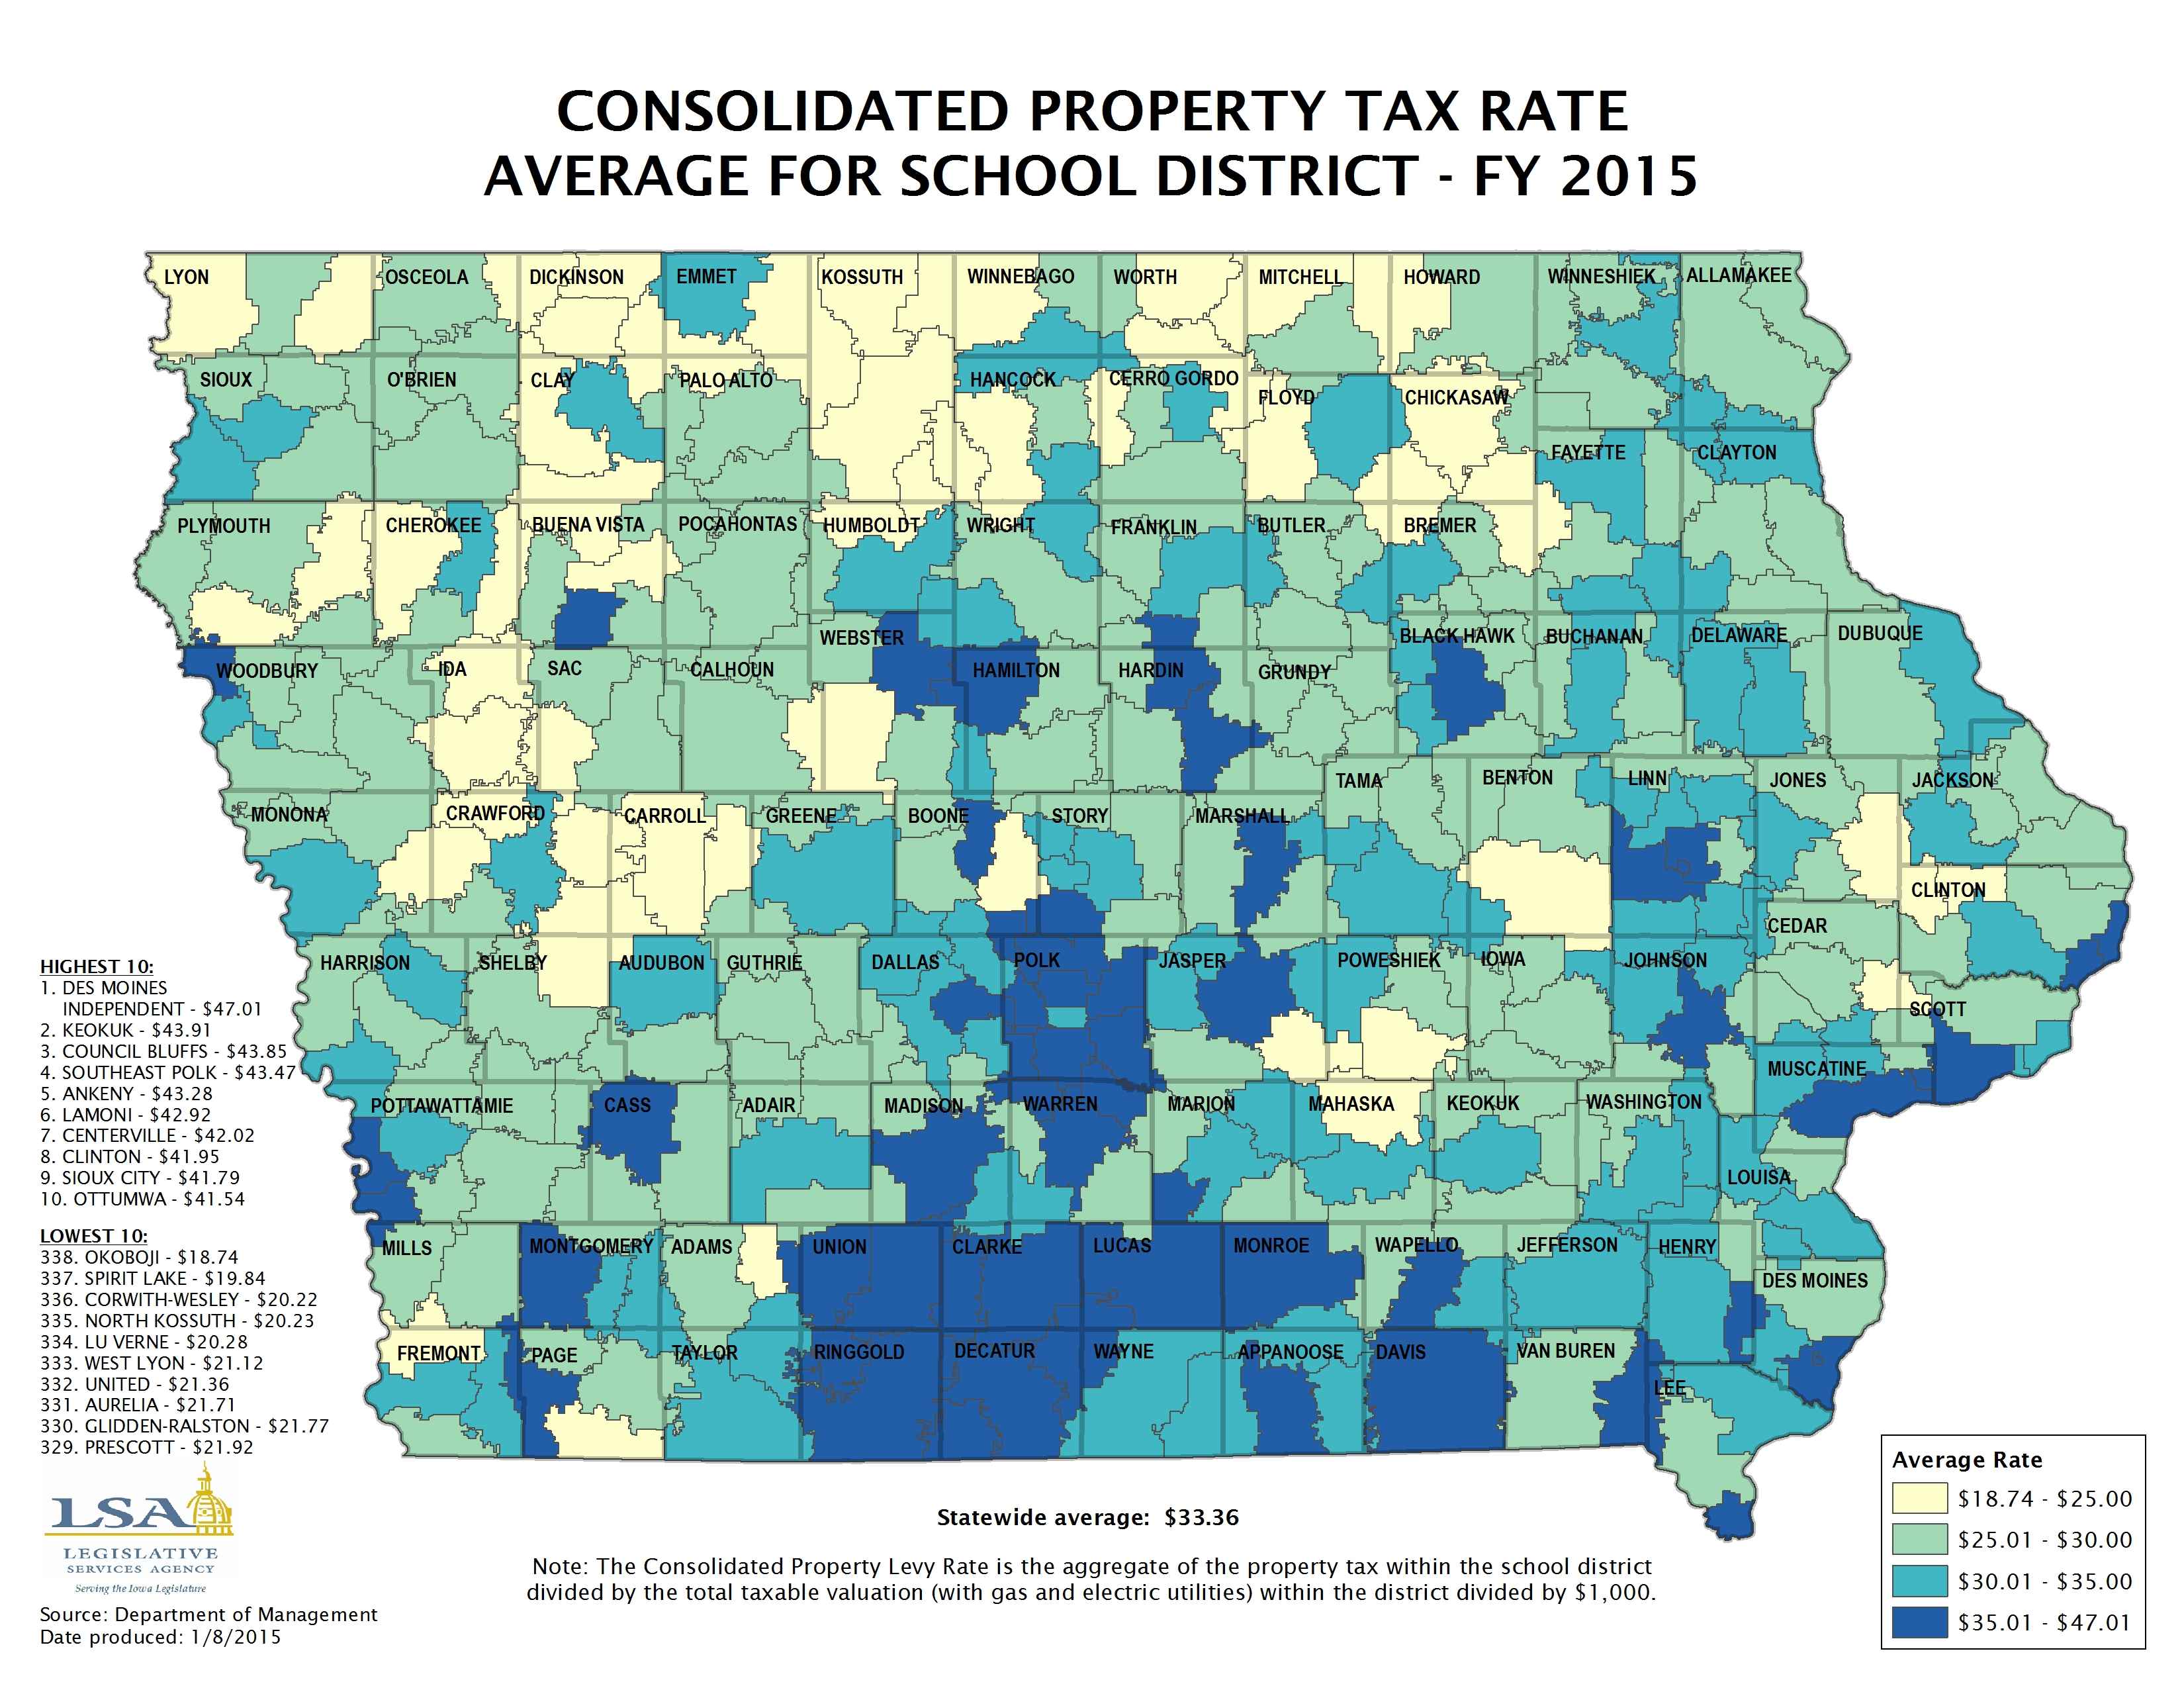
Consolidated Property Tax Rate Average for School District - FY 2015
|
|
|
|
|
| 01/05/2015 |
Iowa Insights |
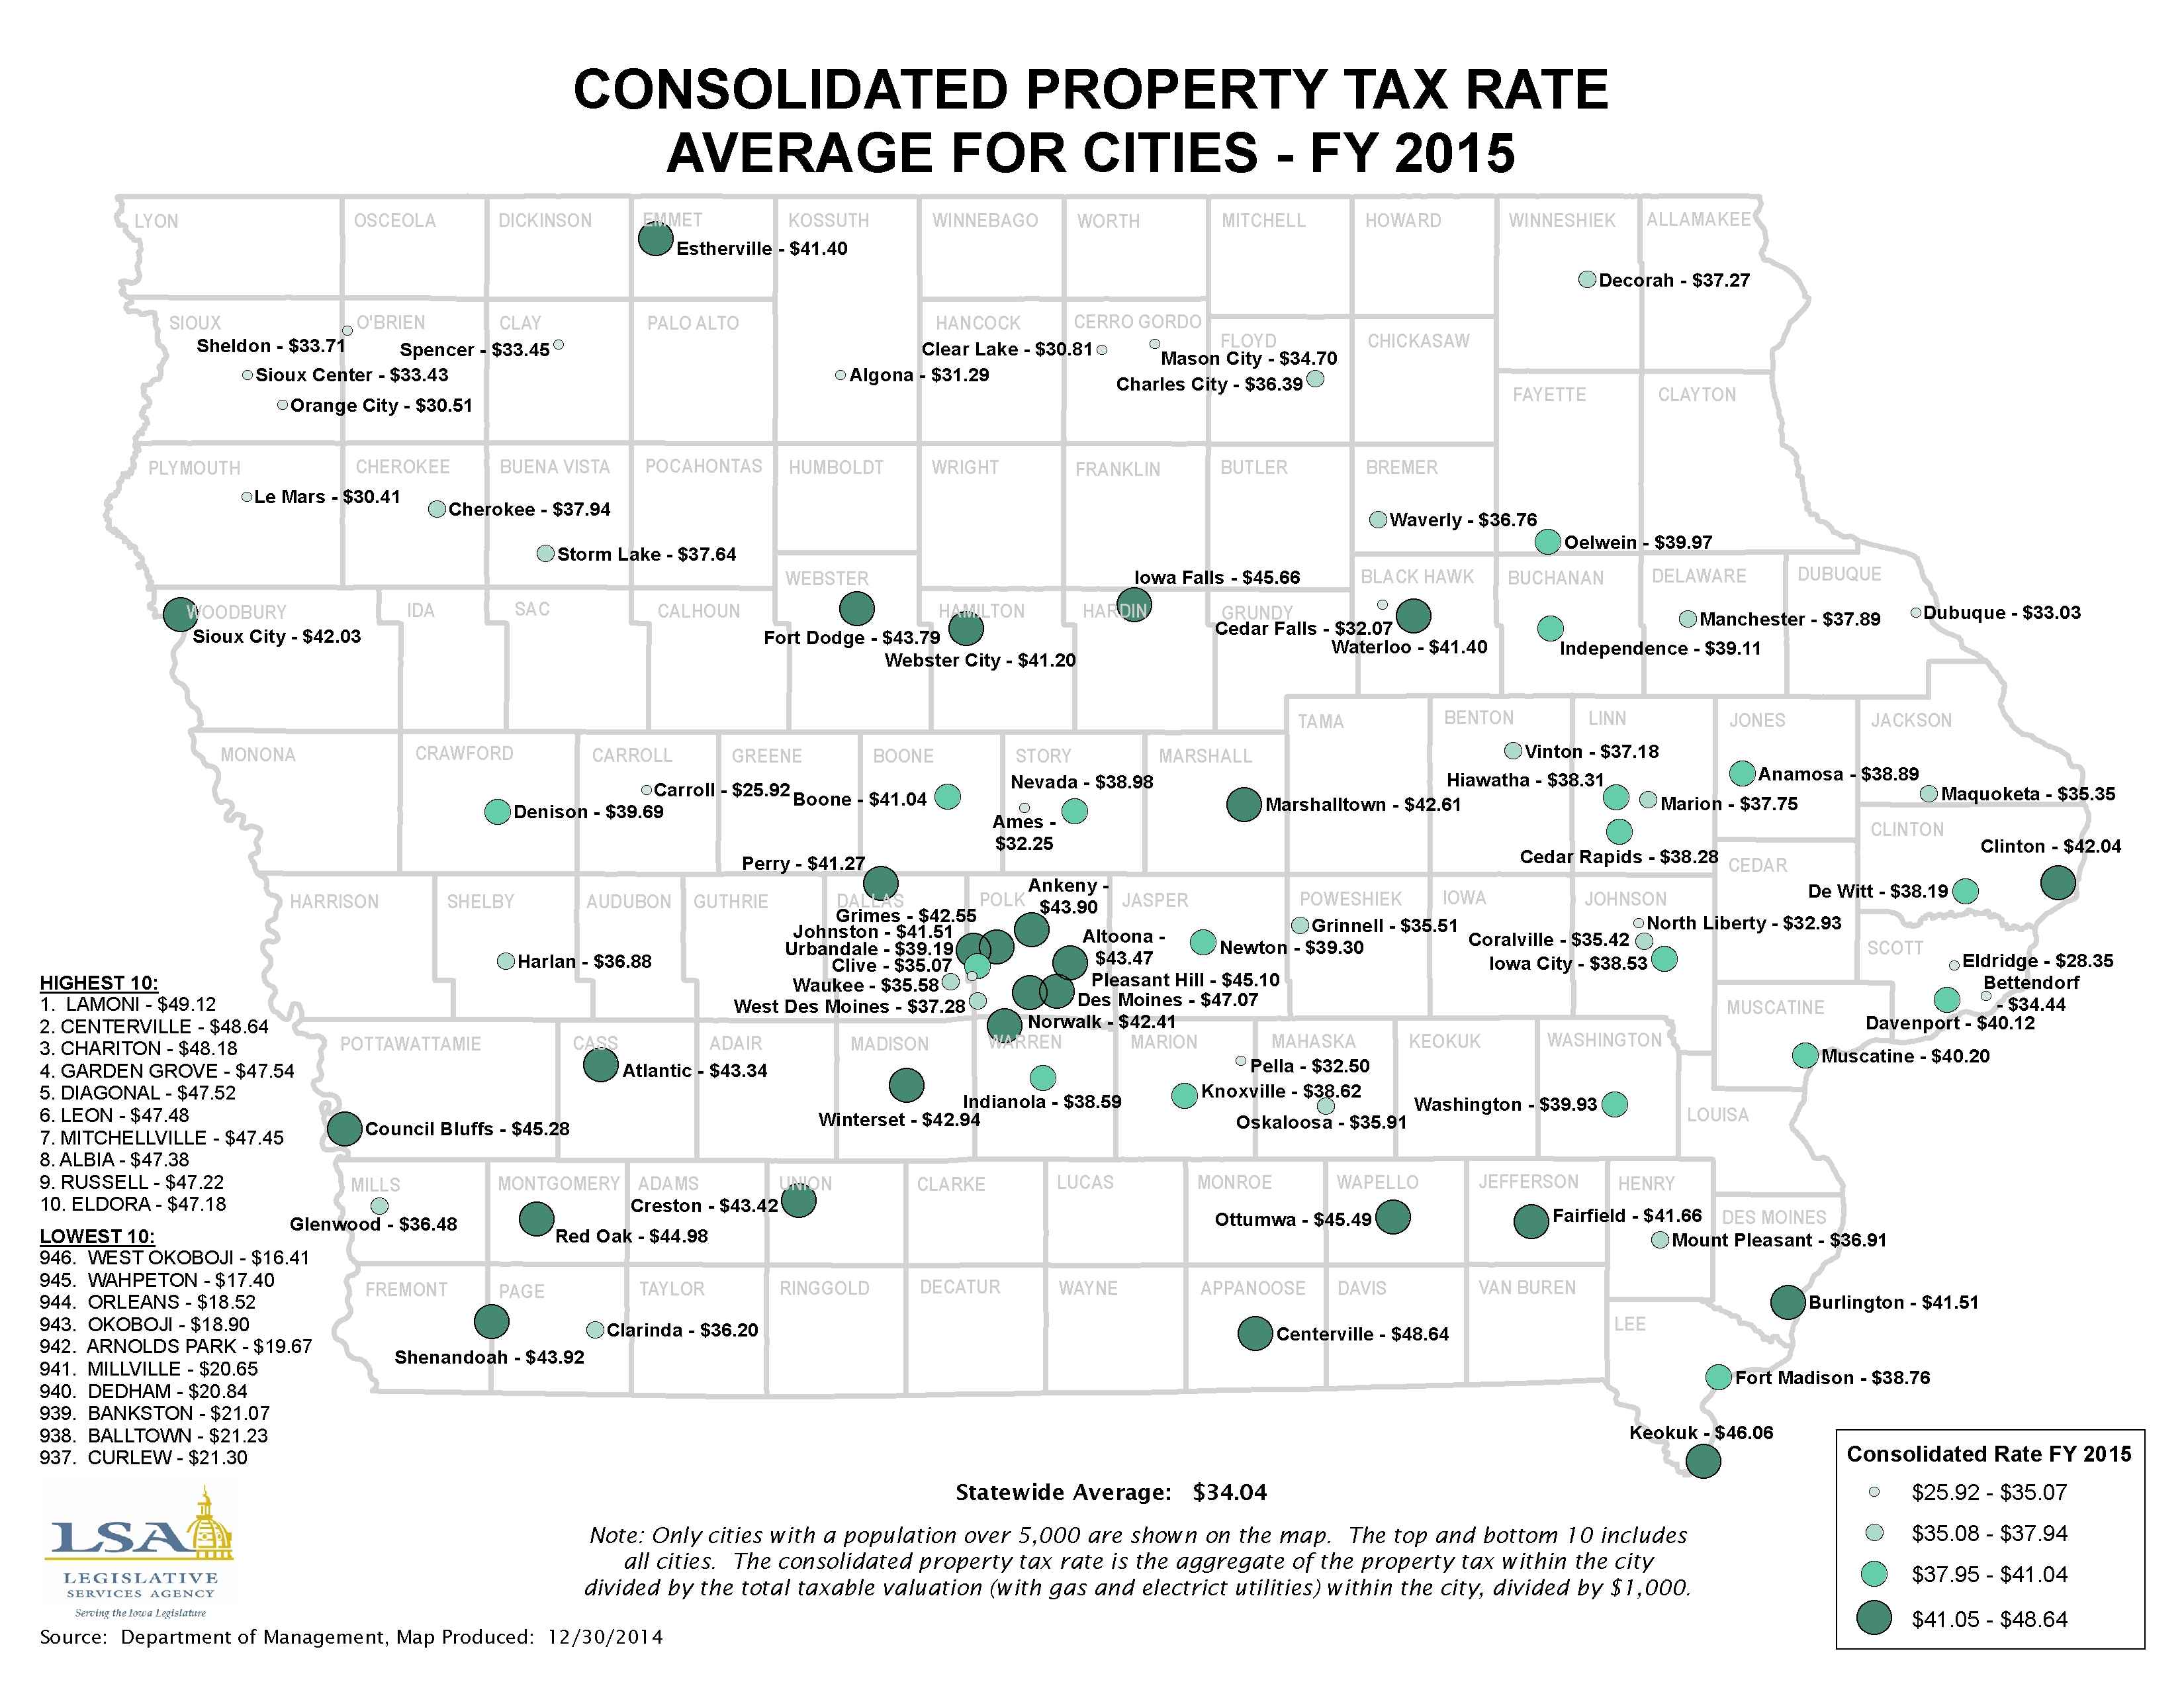
Consolidated Property Tax Rate - Average for Cities - FY 2015
|
|
|
|
|
| 12/29/2014 |
Iowa Insights |
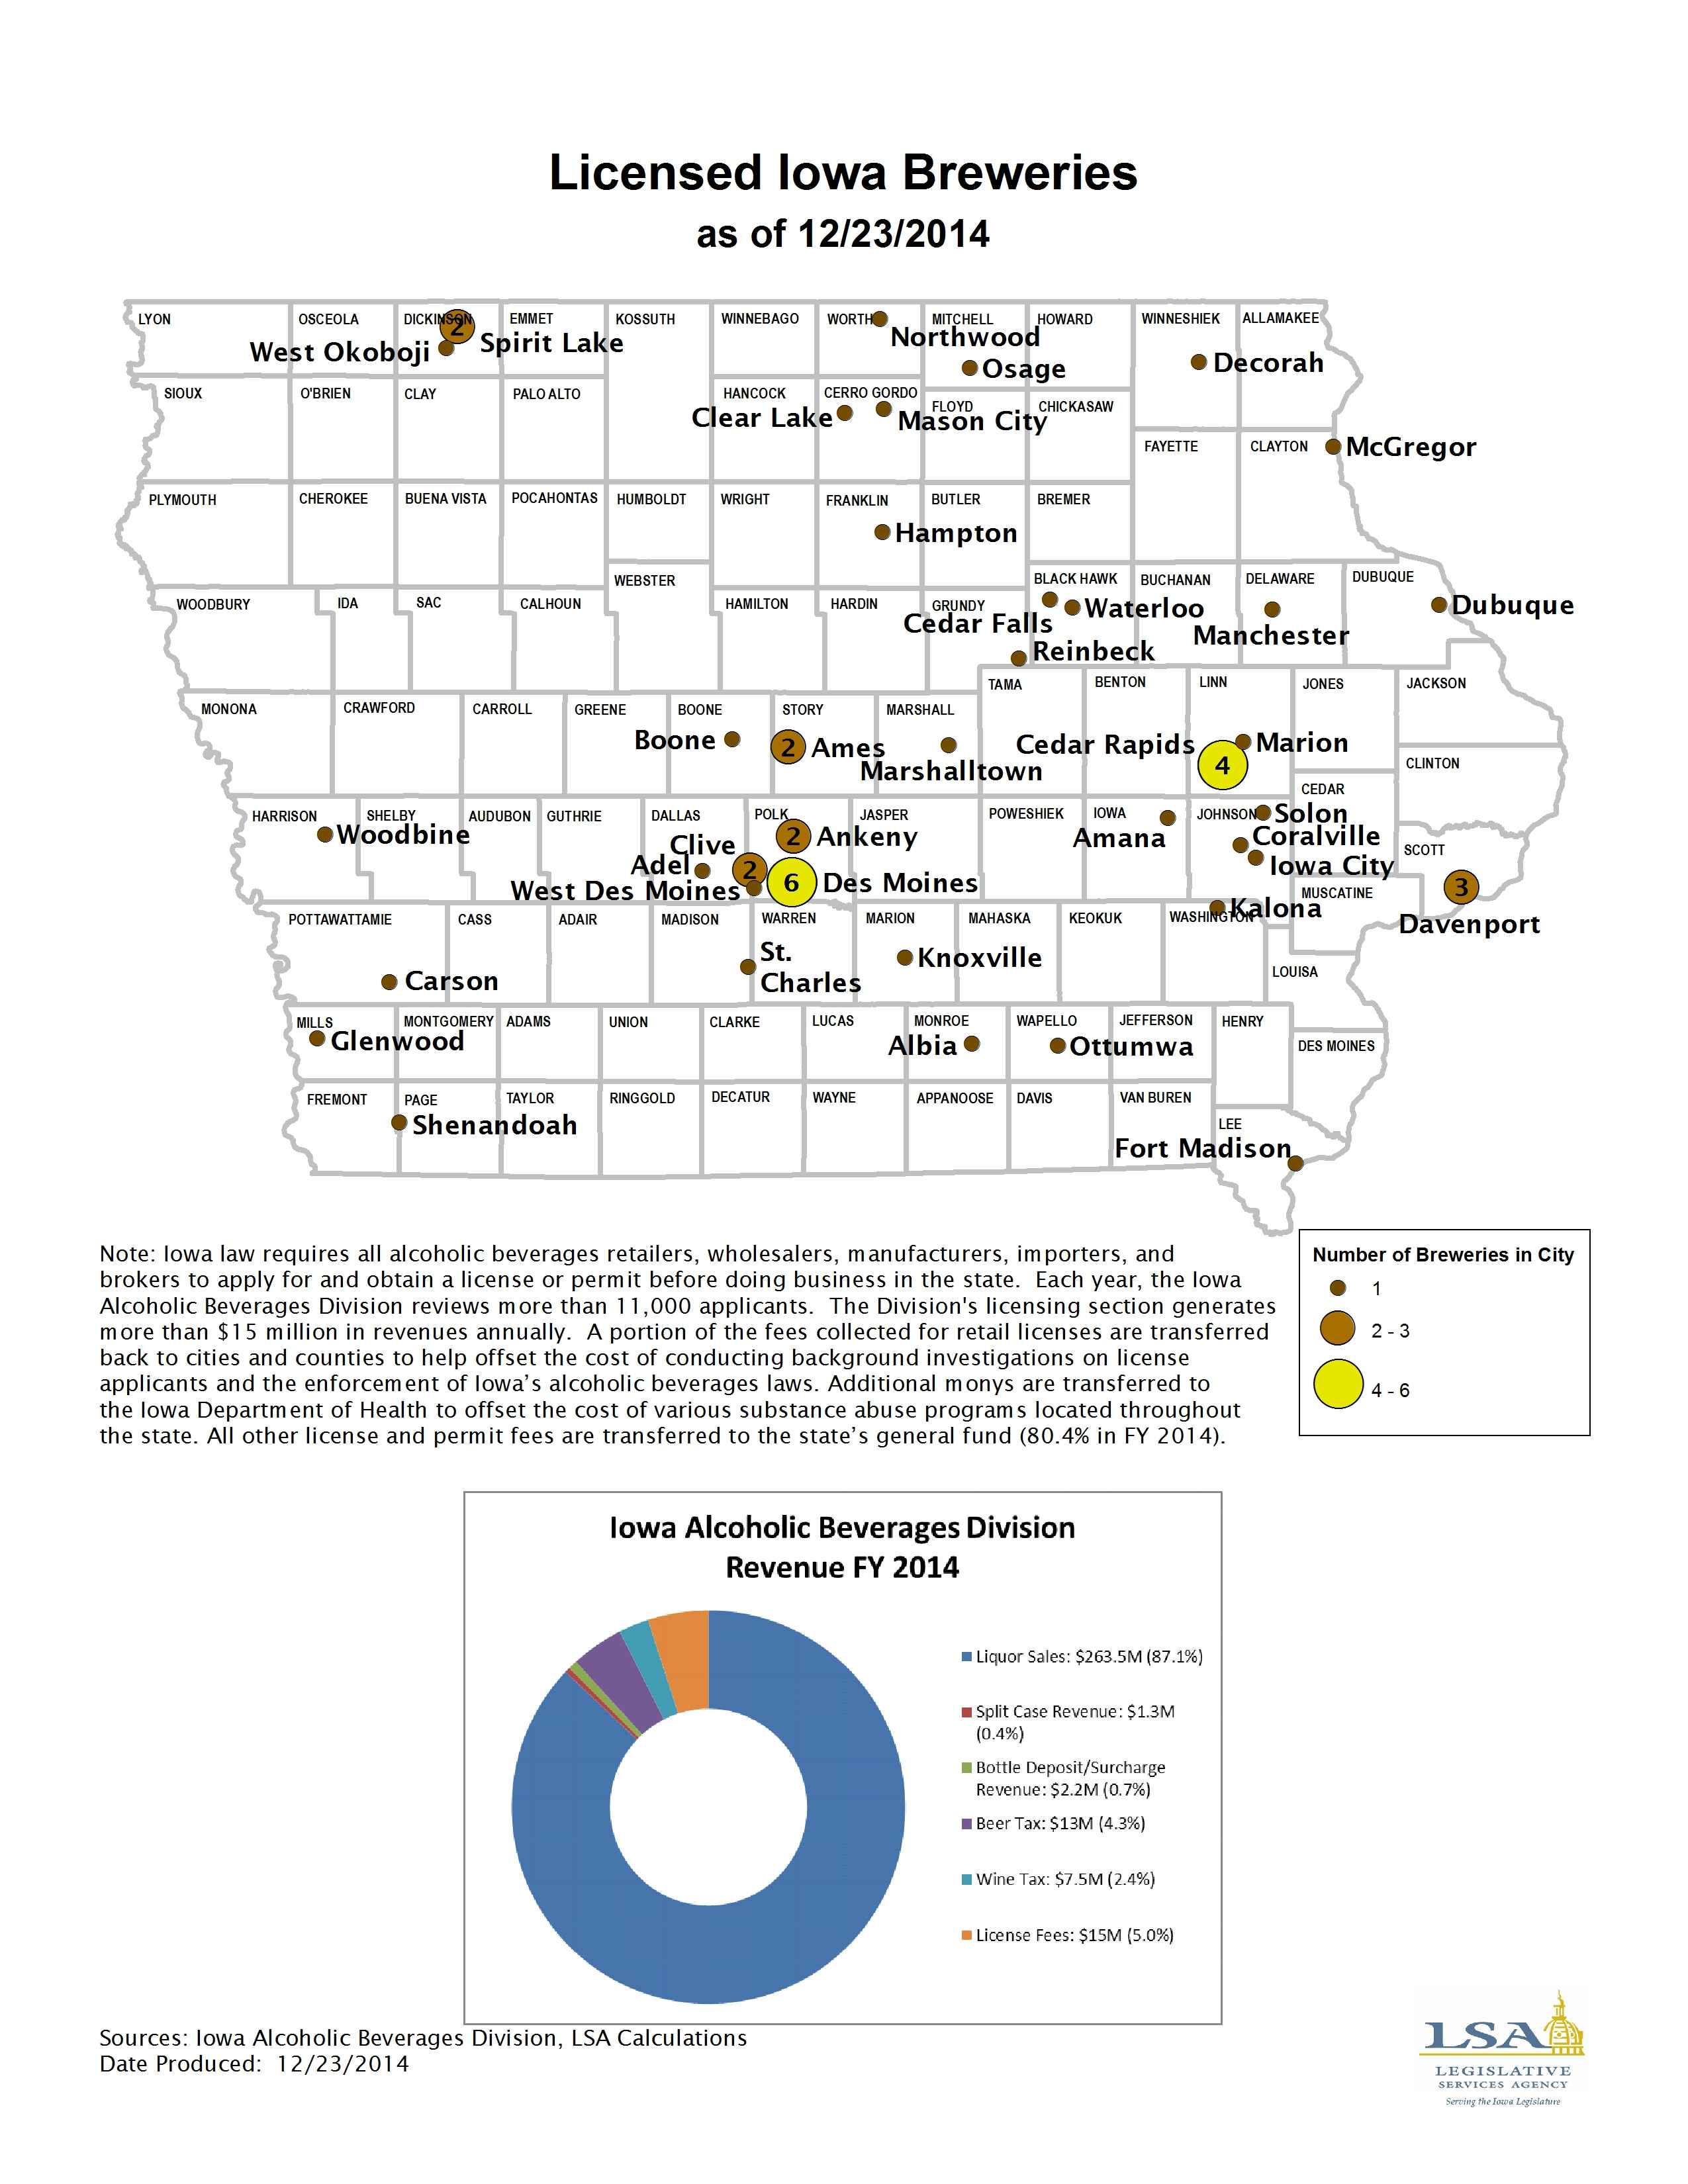
Licensed Iowa Breweries
|
|
|
|
|
| 12/22/2014 |
Iowa Insights |
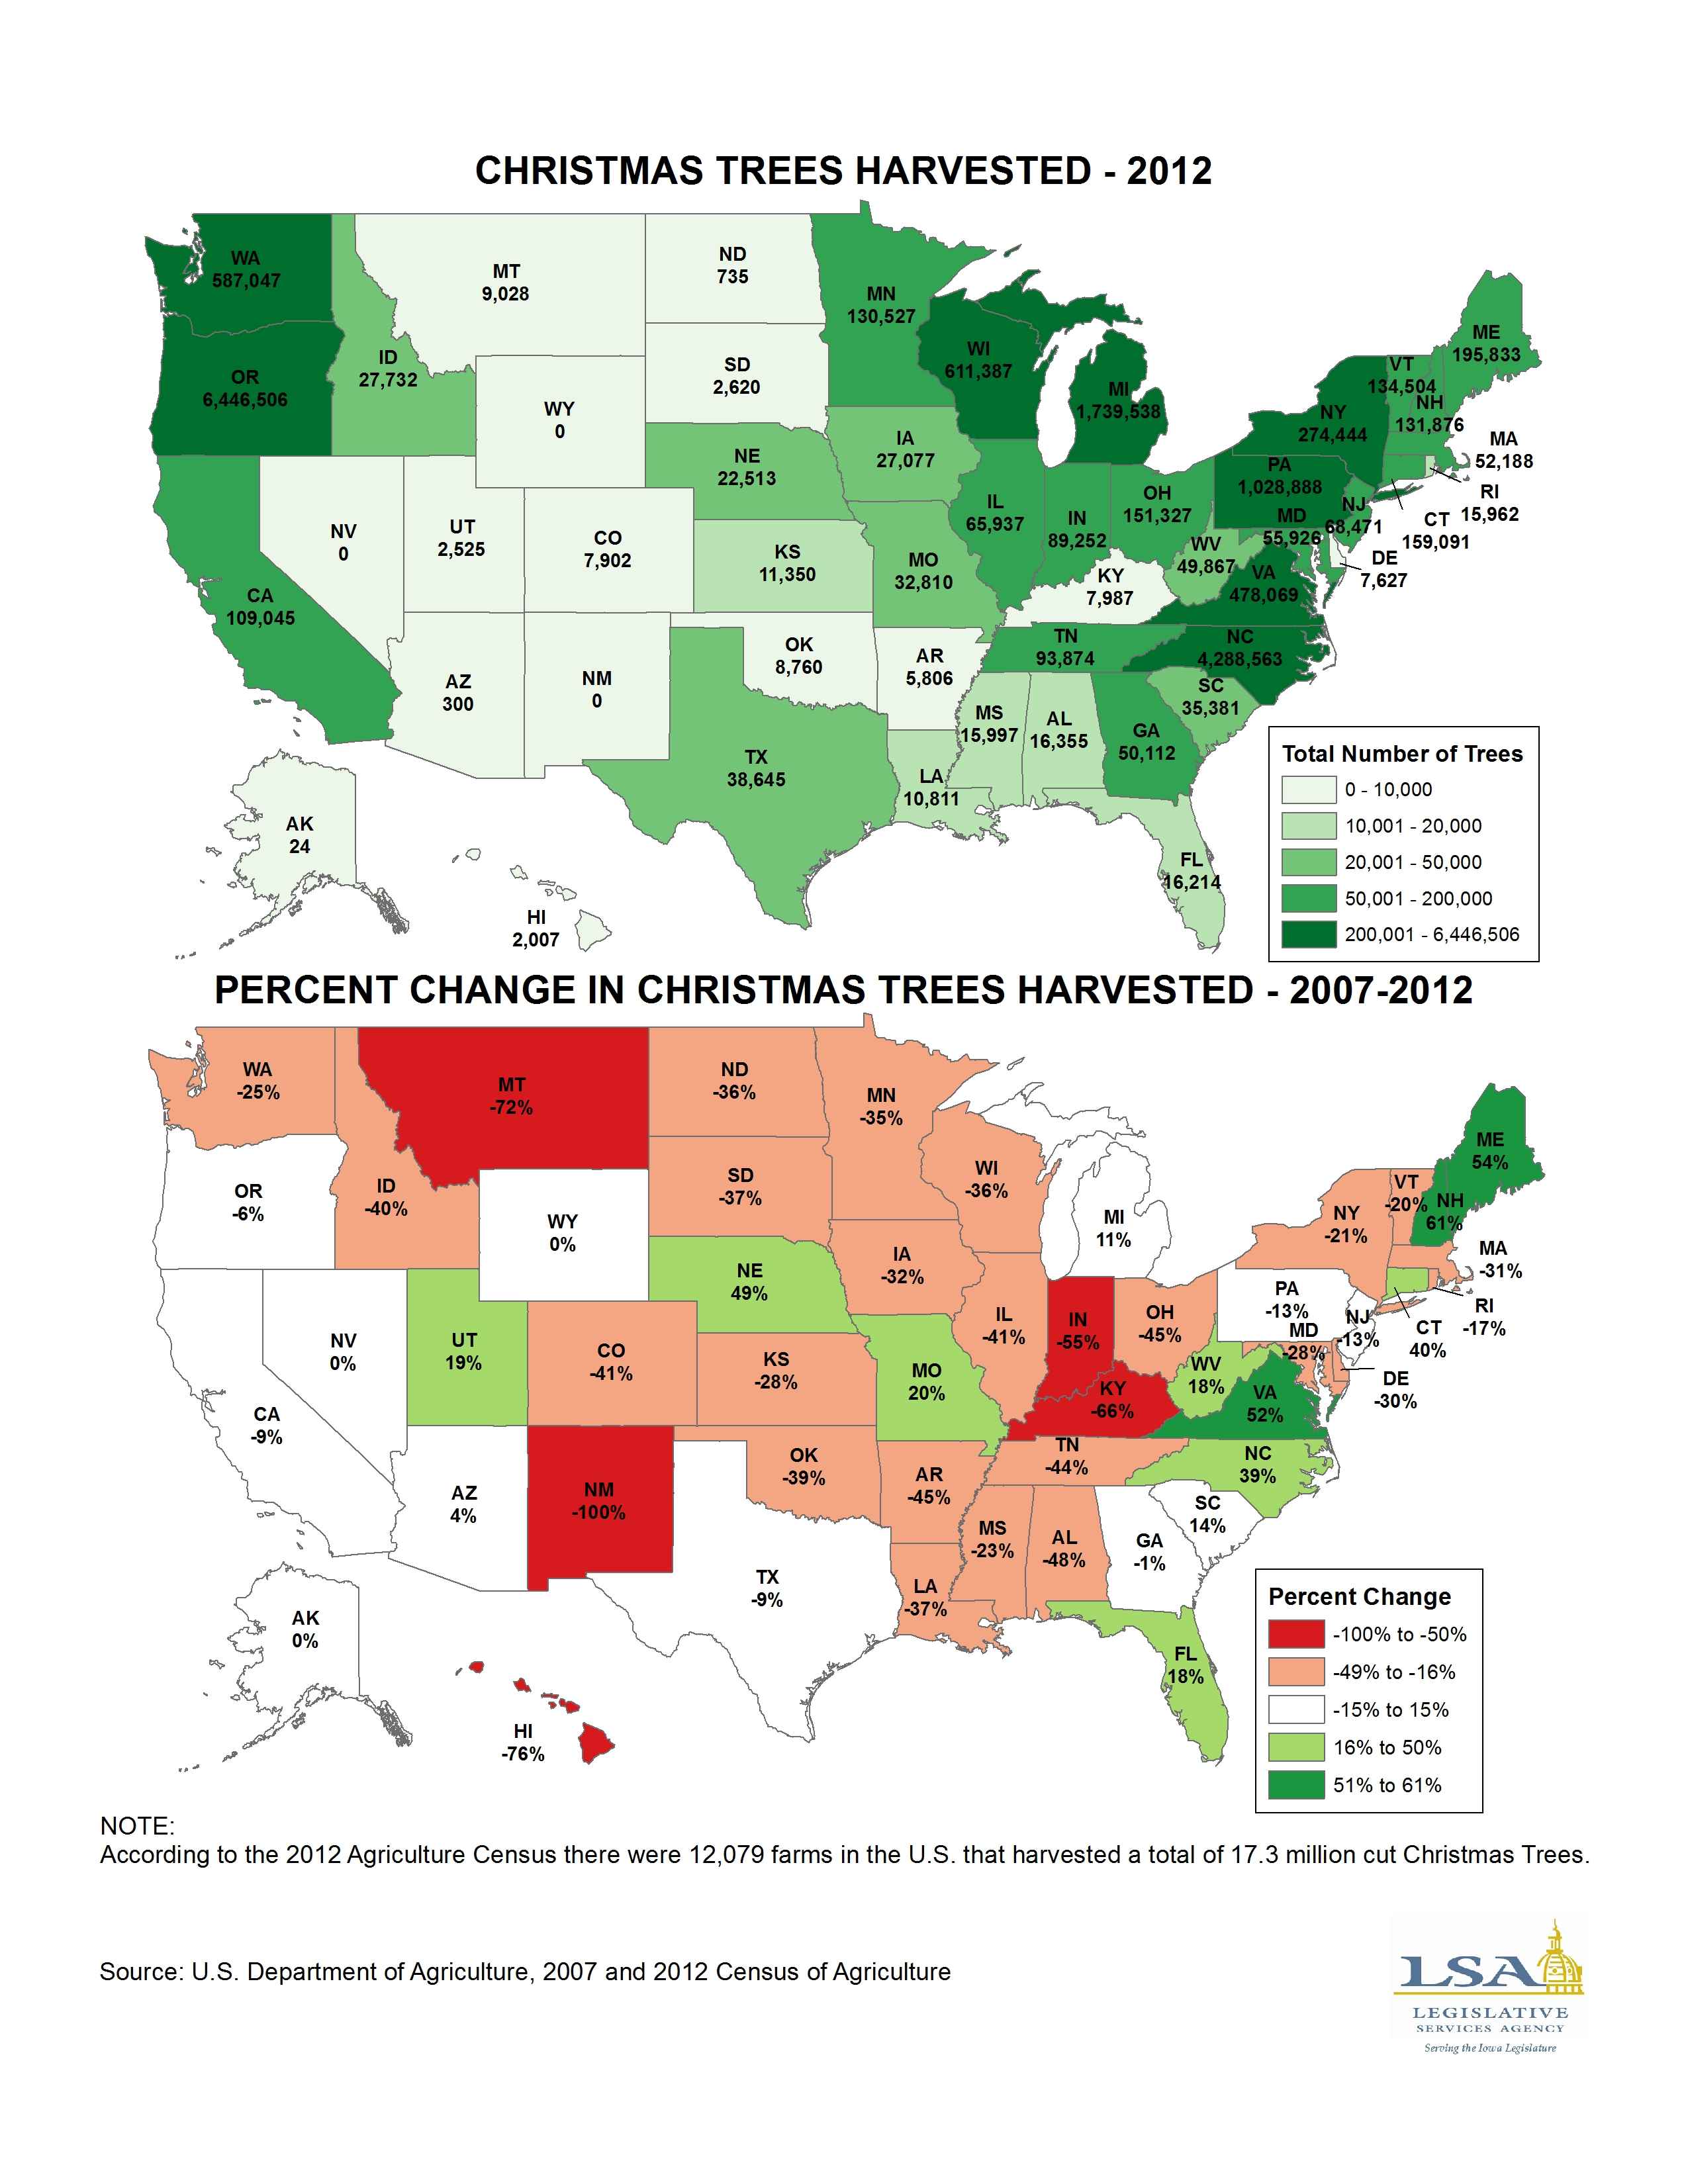
Number of Christmas Trees Harvested in the U.S.
|
|
|
|
|
| 12/15/2014 |
Iowa Insights |
Infant Mortaility Rates and Percentage of Children that are Fully Immunized by State

|
|
|
|
|
| 12/08/2014 |
Iowa Insights |
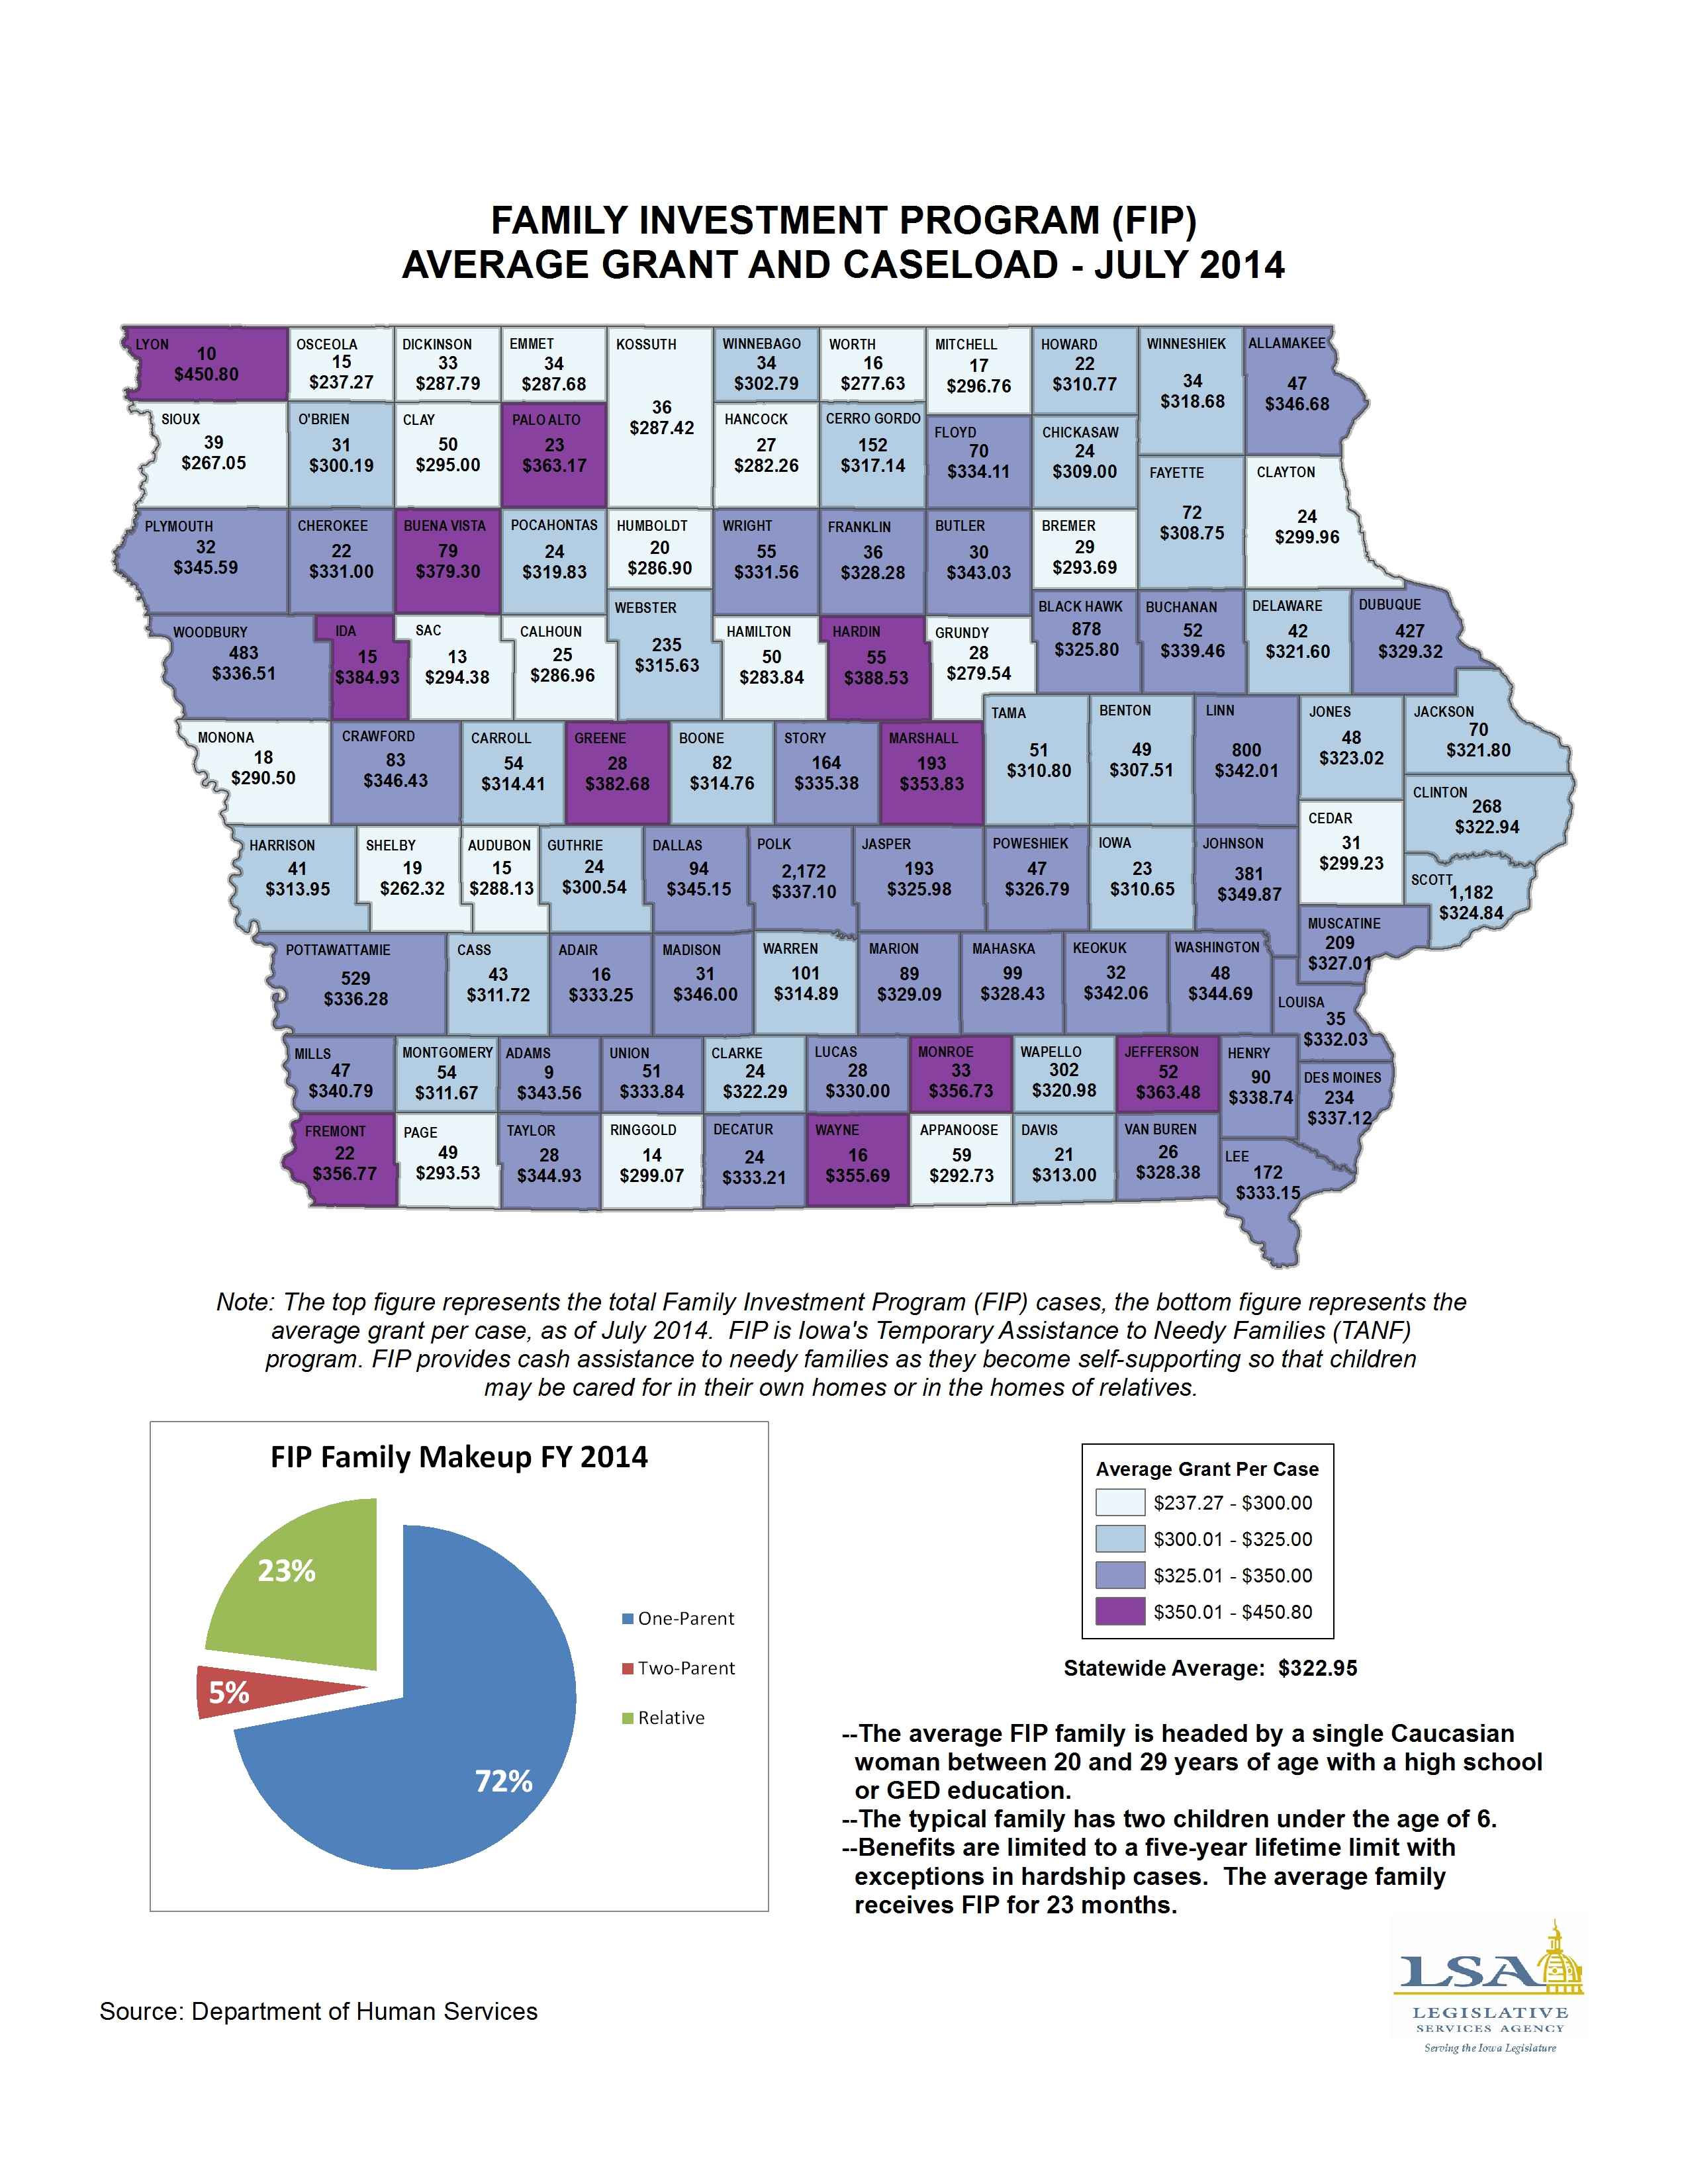
Family Investment Program (FIP) Average Grant and Caseload - July 2014
|
|
|
|
|
| 12/01/2014 |
Iowa Insights |
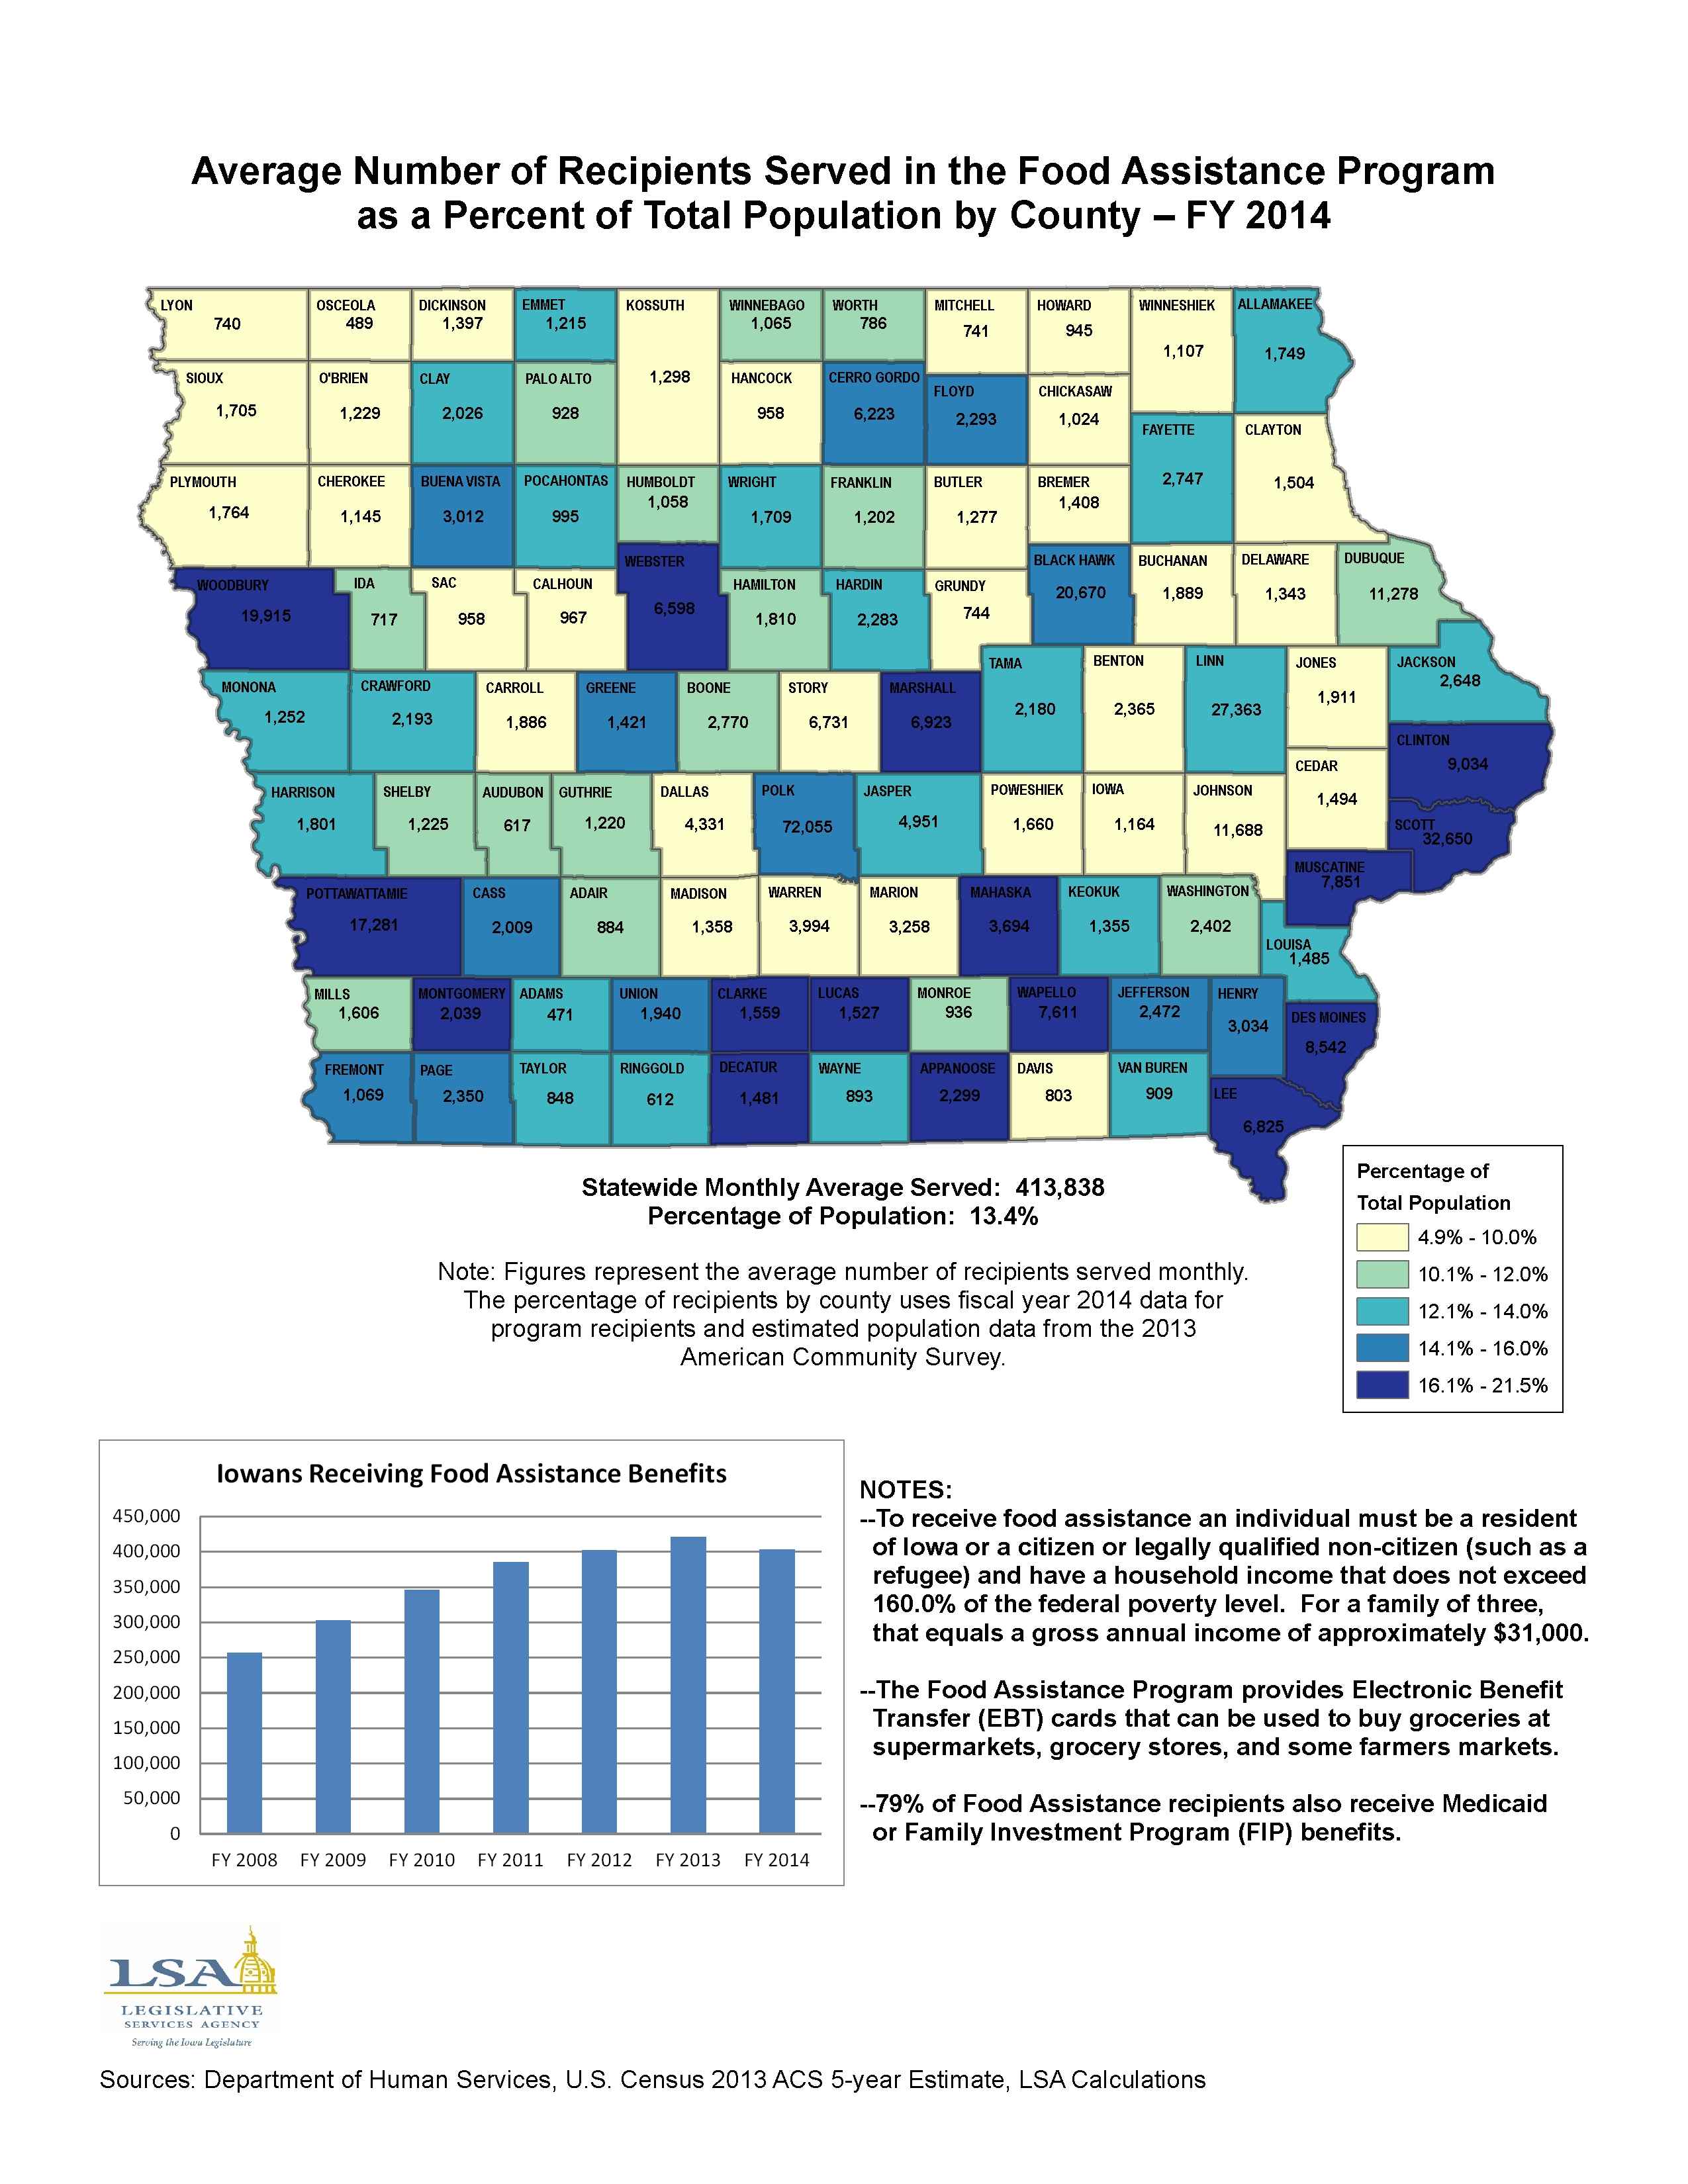
Average Number of Recipients Served in the Food Assistance Program as a Percent of Total Population by County - FY 2014
|
|
|
|
|
| 11/24/2014 |
Iowa Insights |
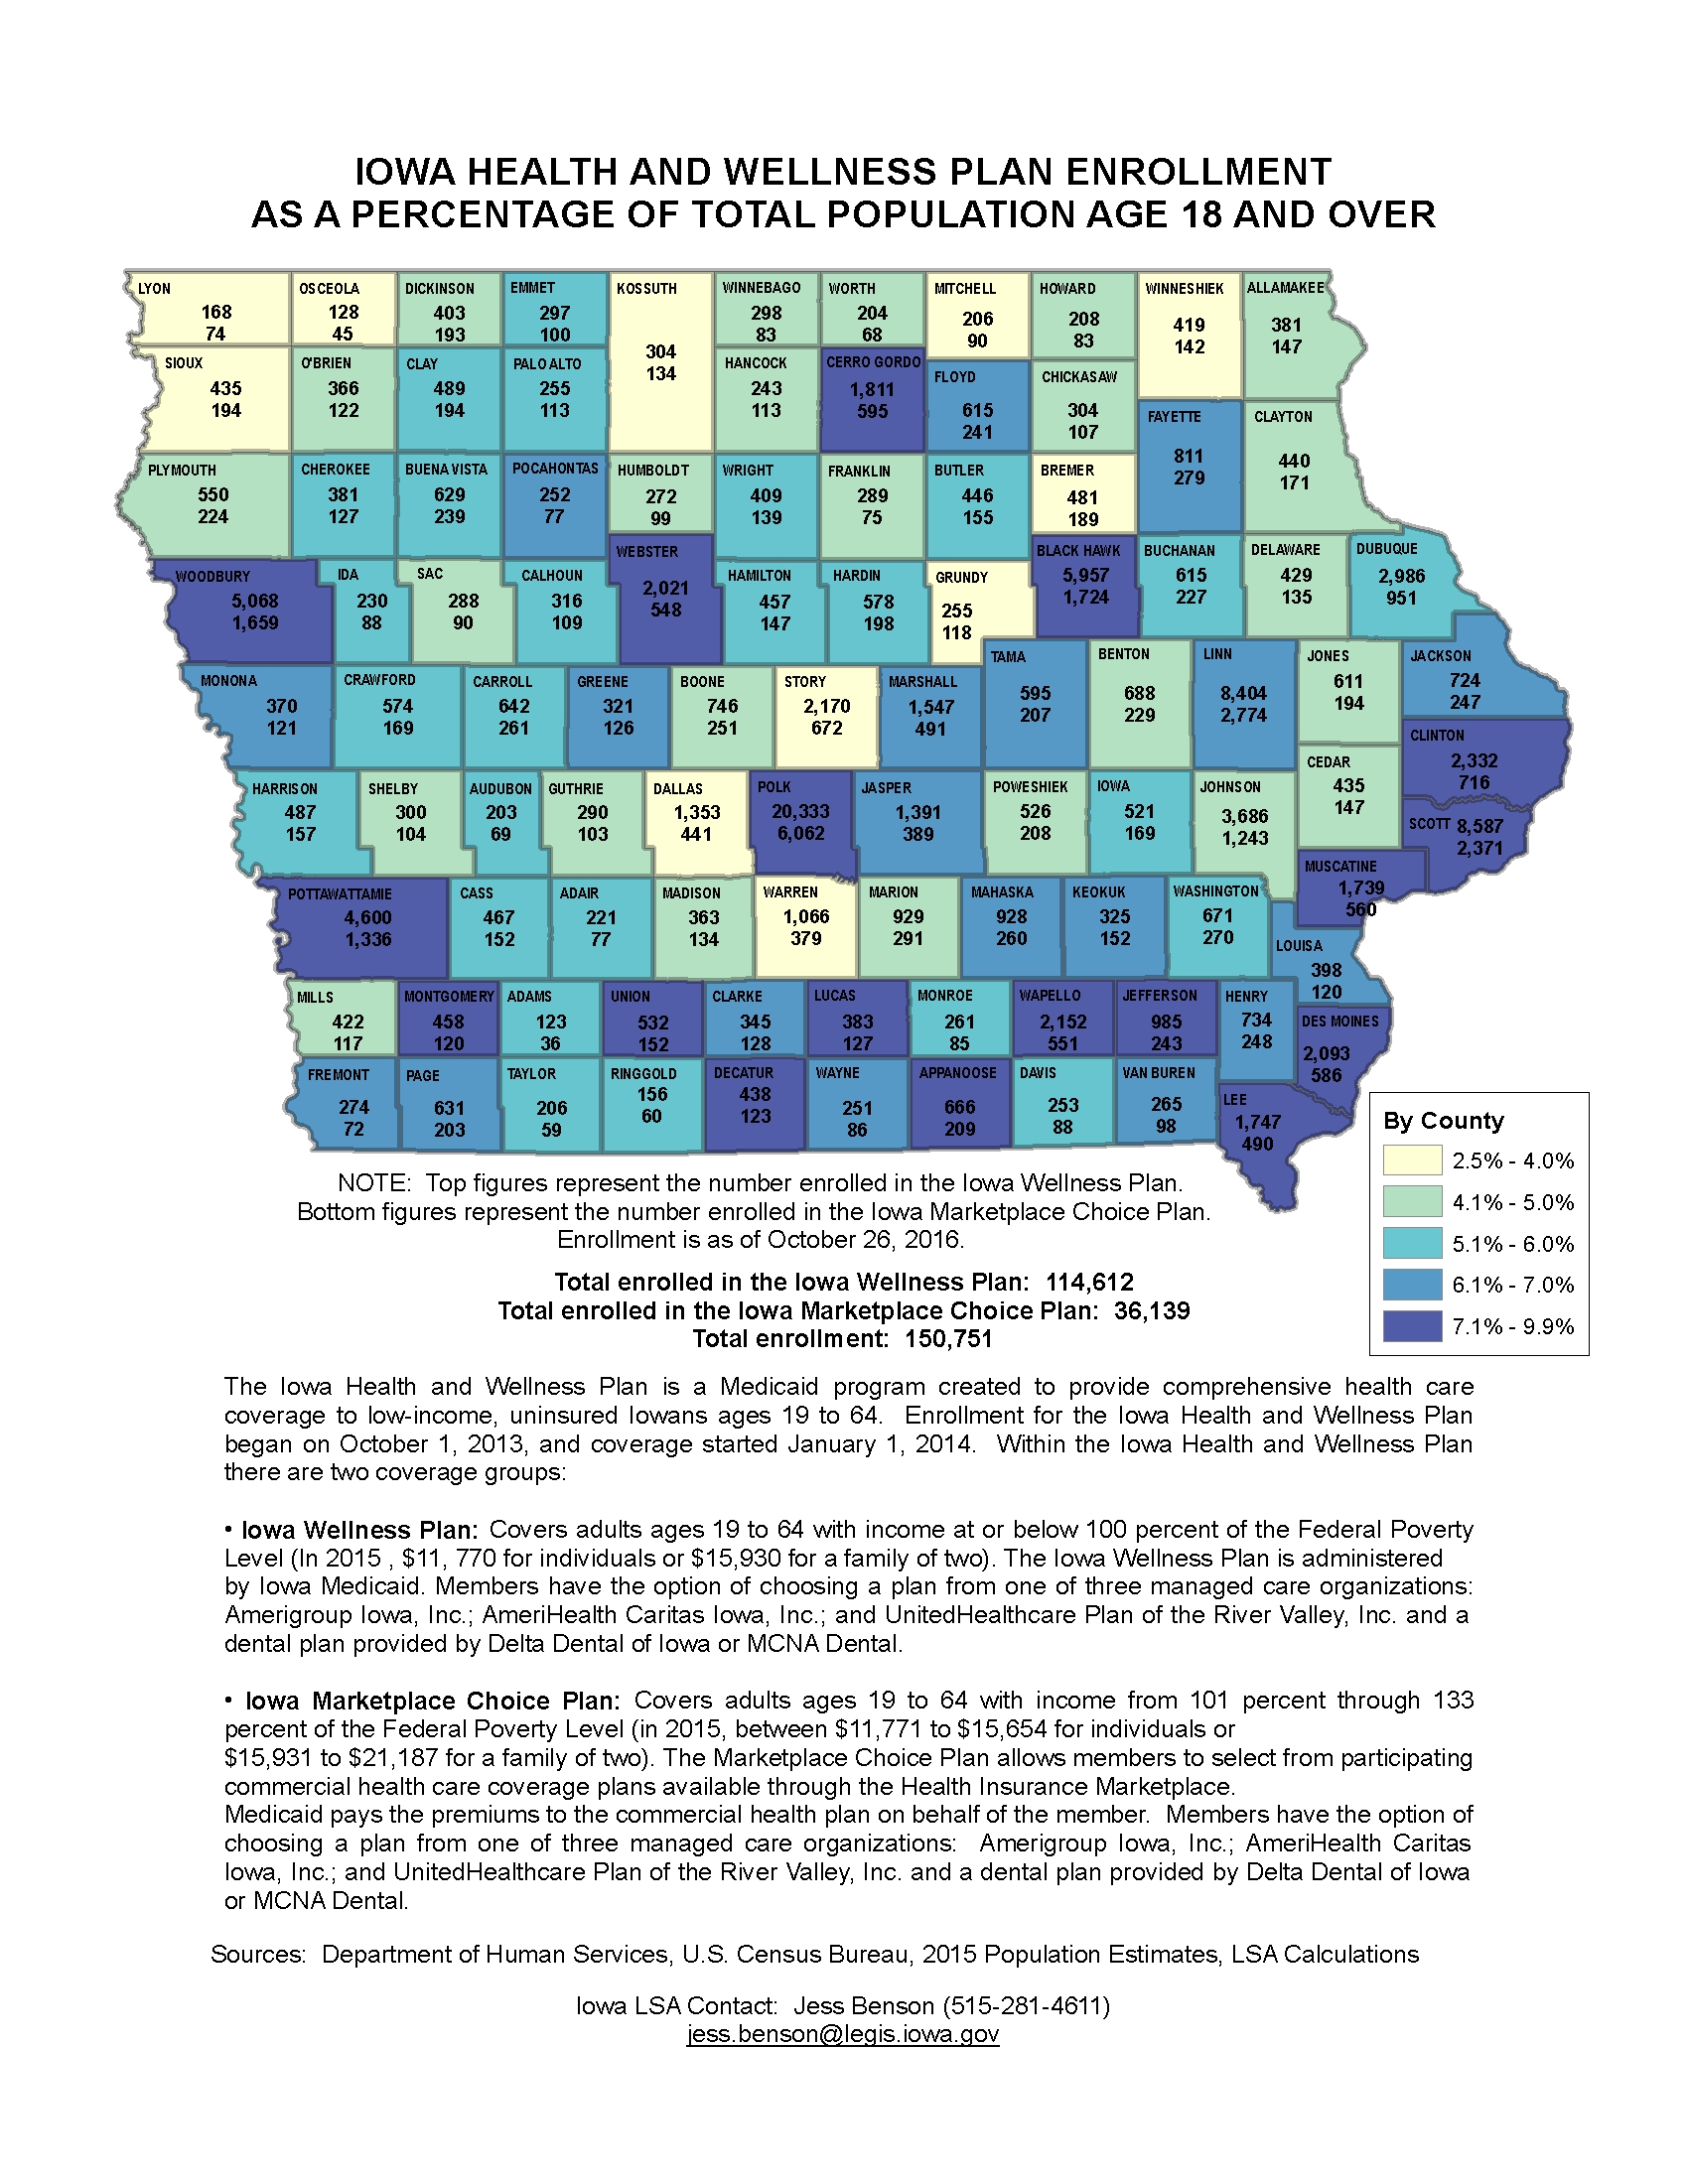
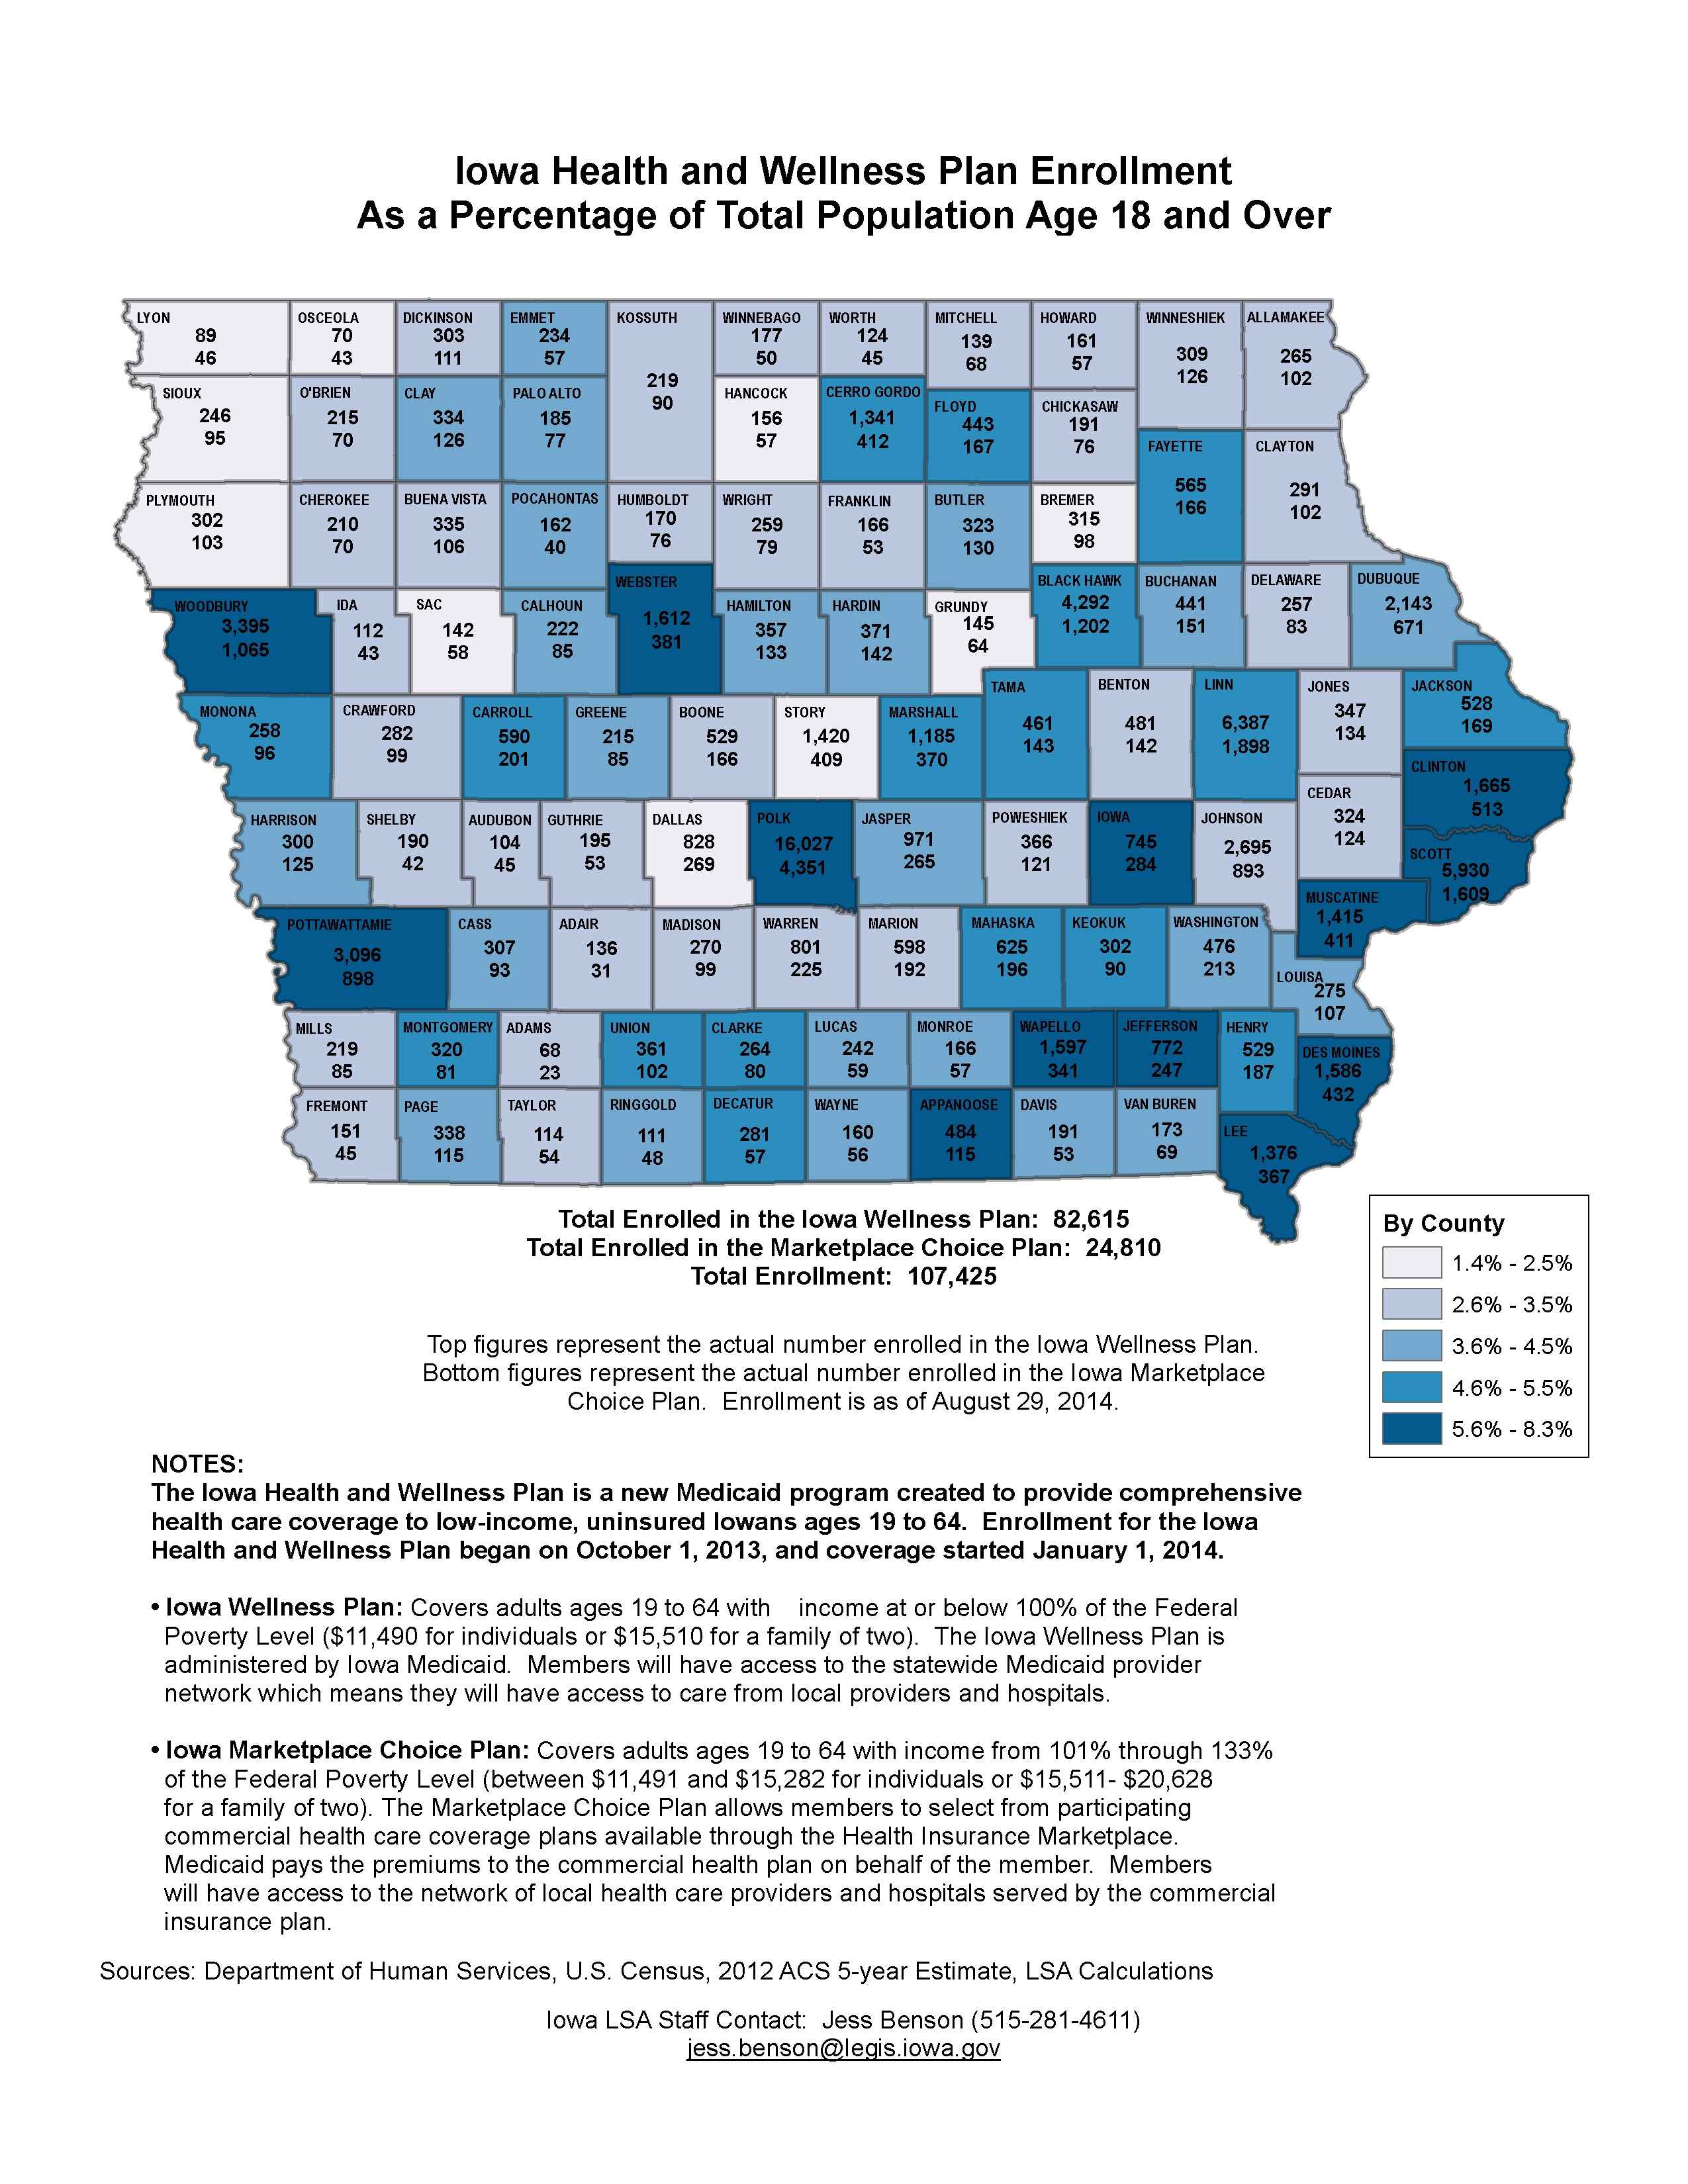
Iowa Health and Wellness Plan Enrollment as a Percentage of Population Age 18 and Over
|
|
|
|
|
| 11/17/2014 |
Iowa Insights |
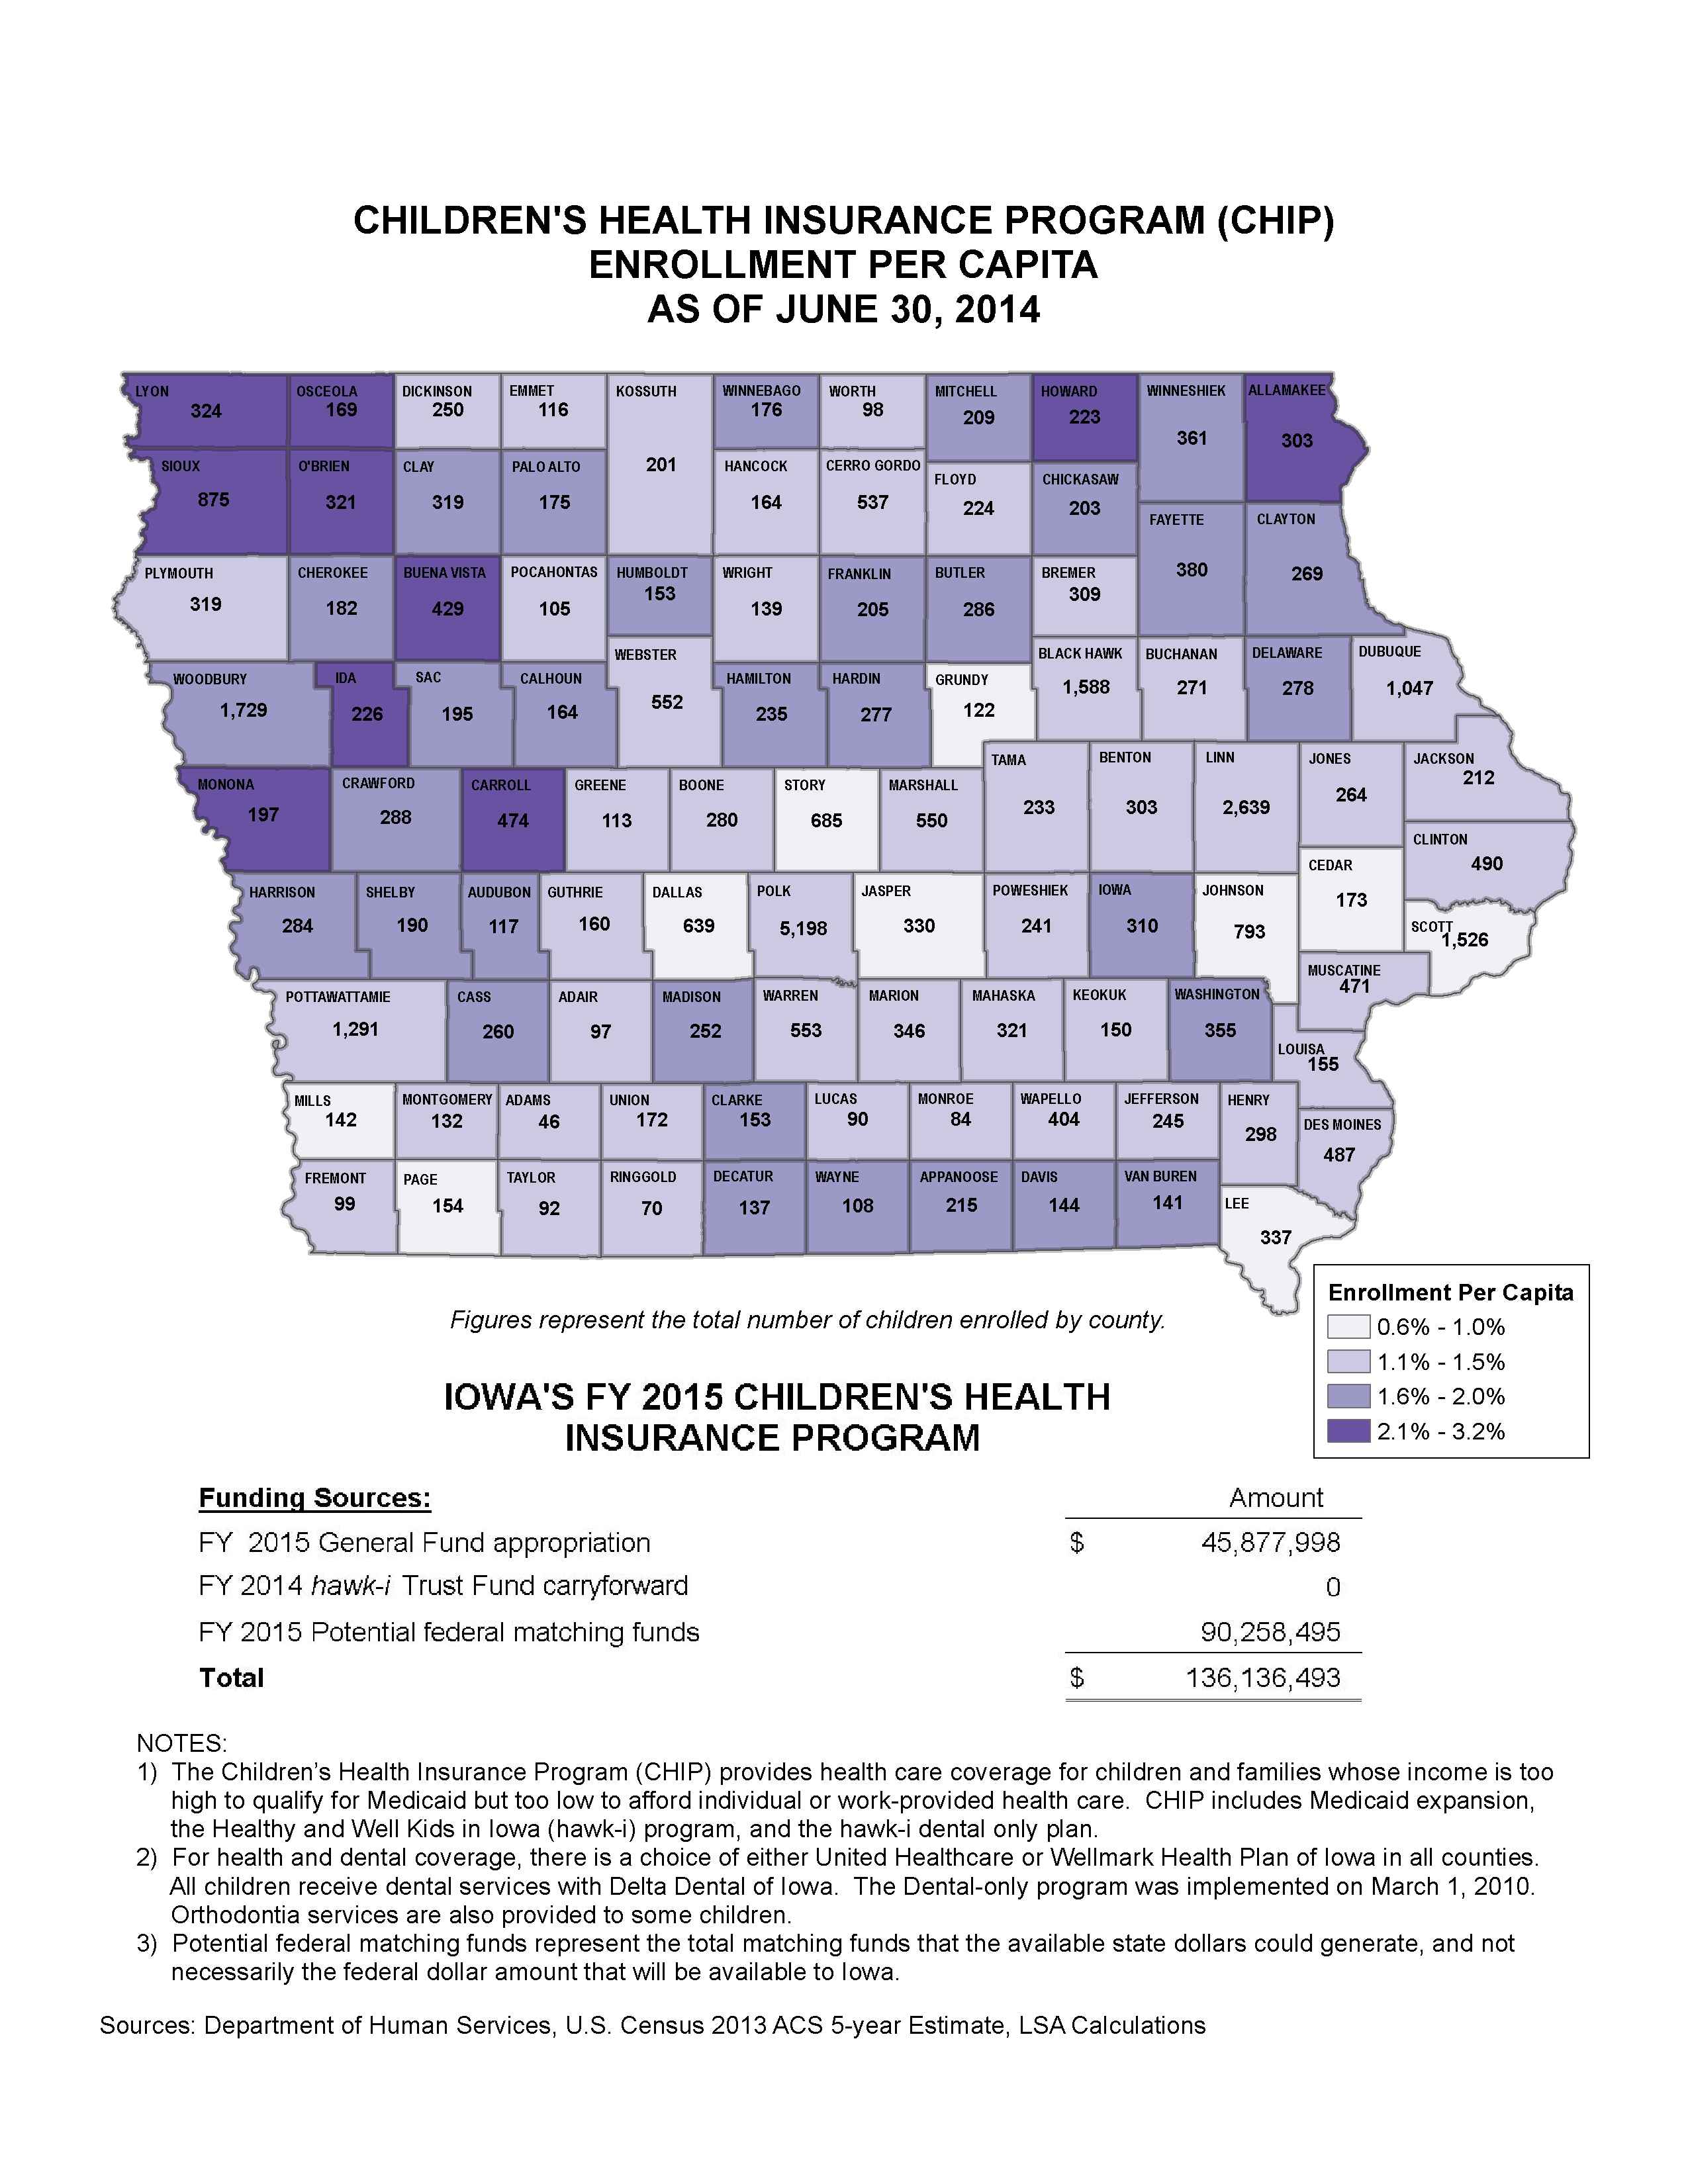
Children's Health Insurance Program (CHIP) Enrollment Per Capita as of June 30, 2014
|
|
|
|
|
| 11/10/2014 |
Iowa Insights |
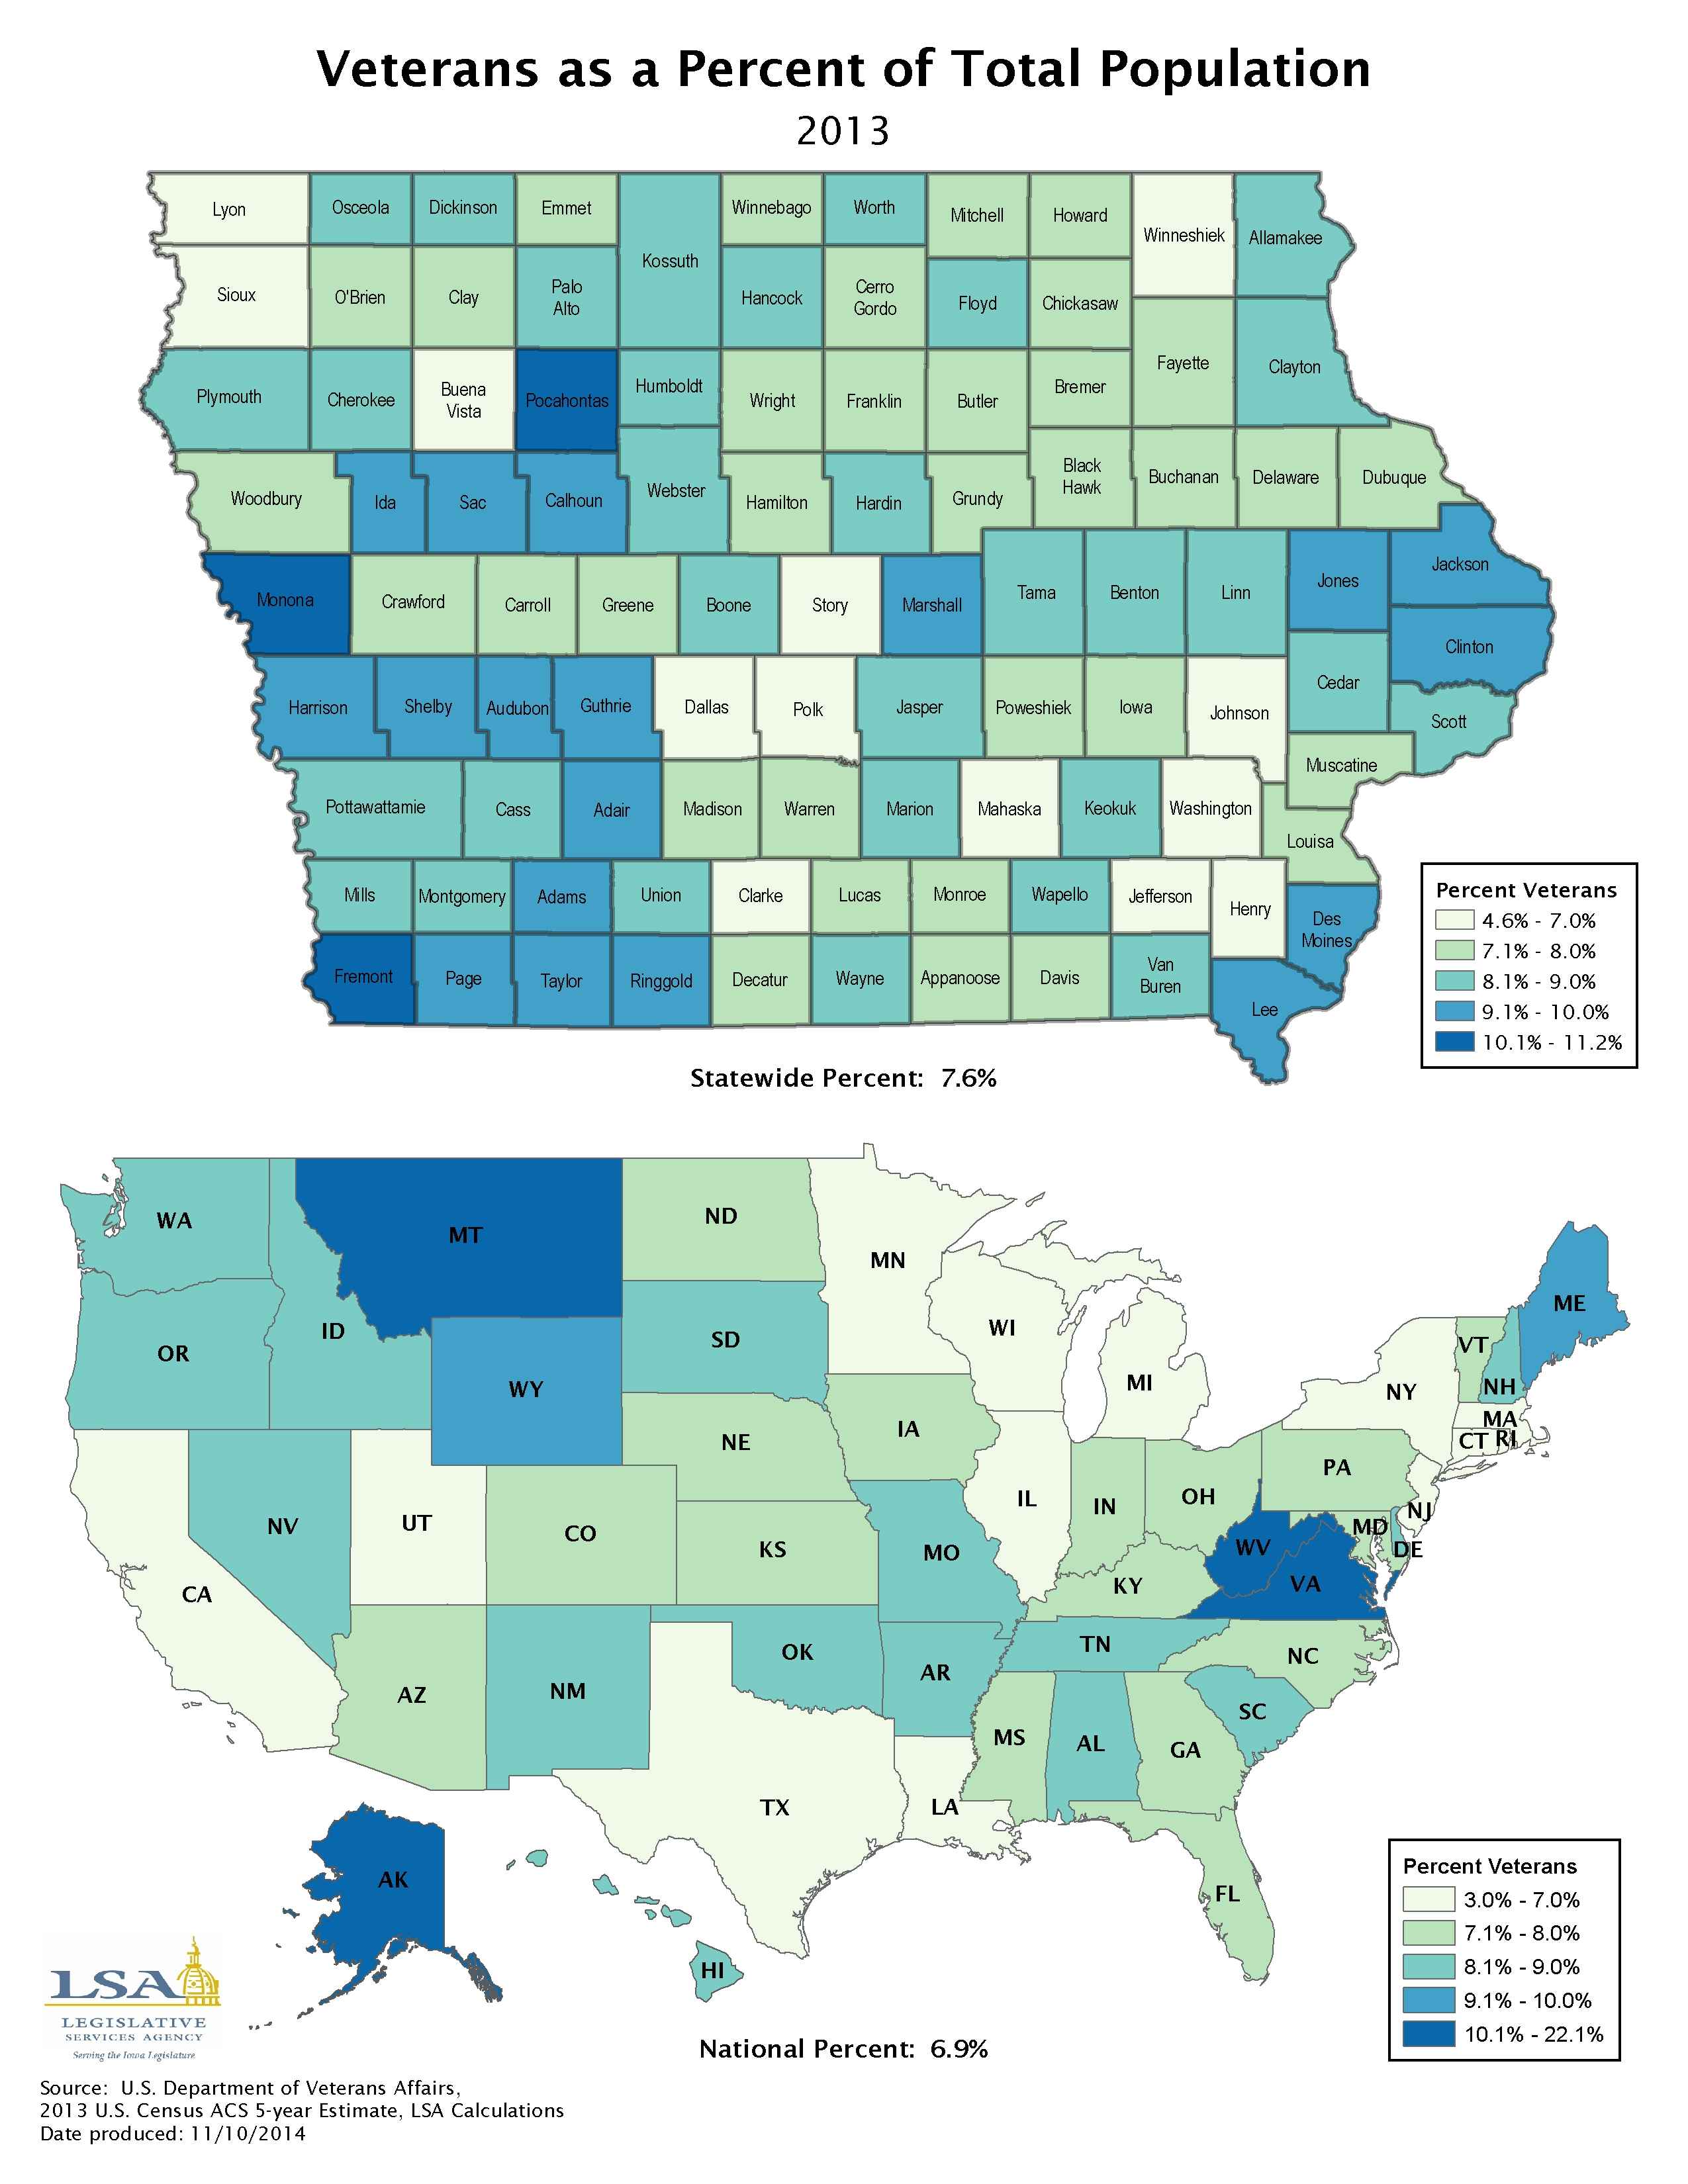
Veterans as a Percent of Total Population
|
|
|
|
|
| 11/03/2014 |
Iowa Insights |
Army National Guard Enlistment - FY 2013

|
|
|
|
|
| 10/27/2014 |
Iowa Insights |
Violent Crime Rates - CY 2012

|
|
|
|
|
| 10/20/2014 |
Iowa Insights |
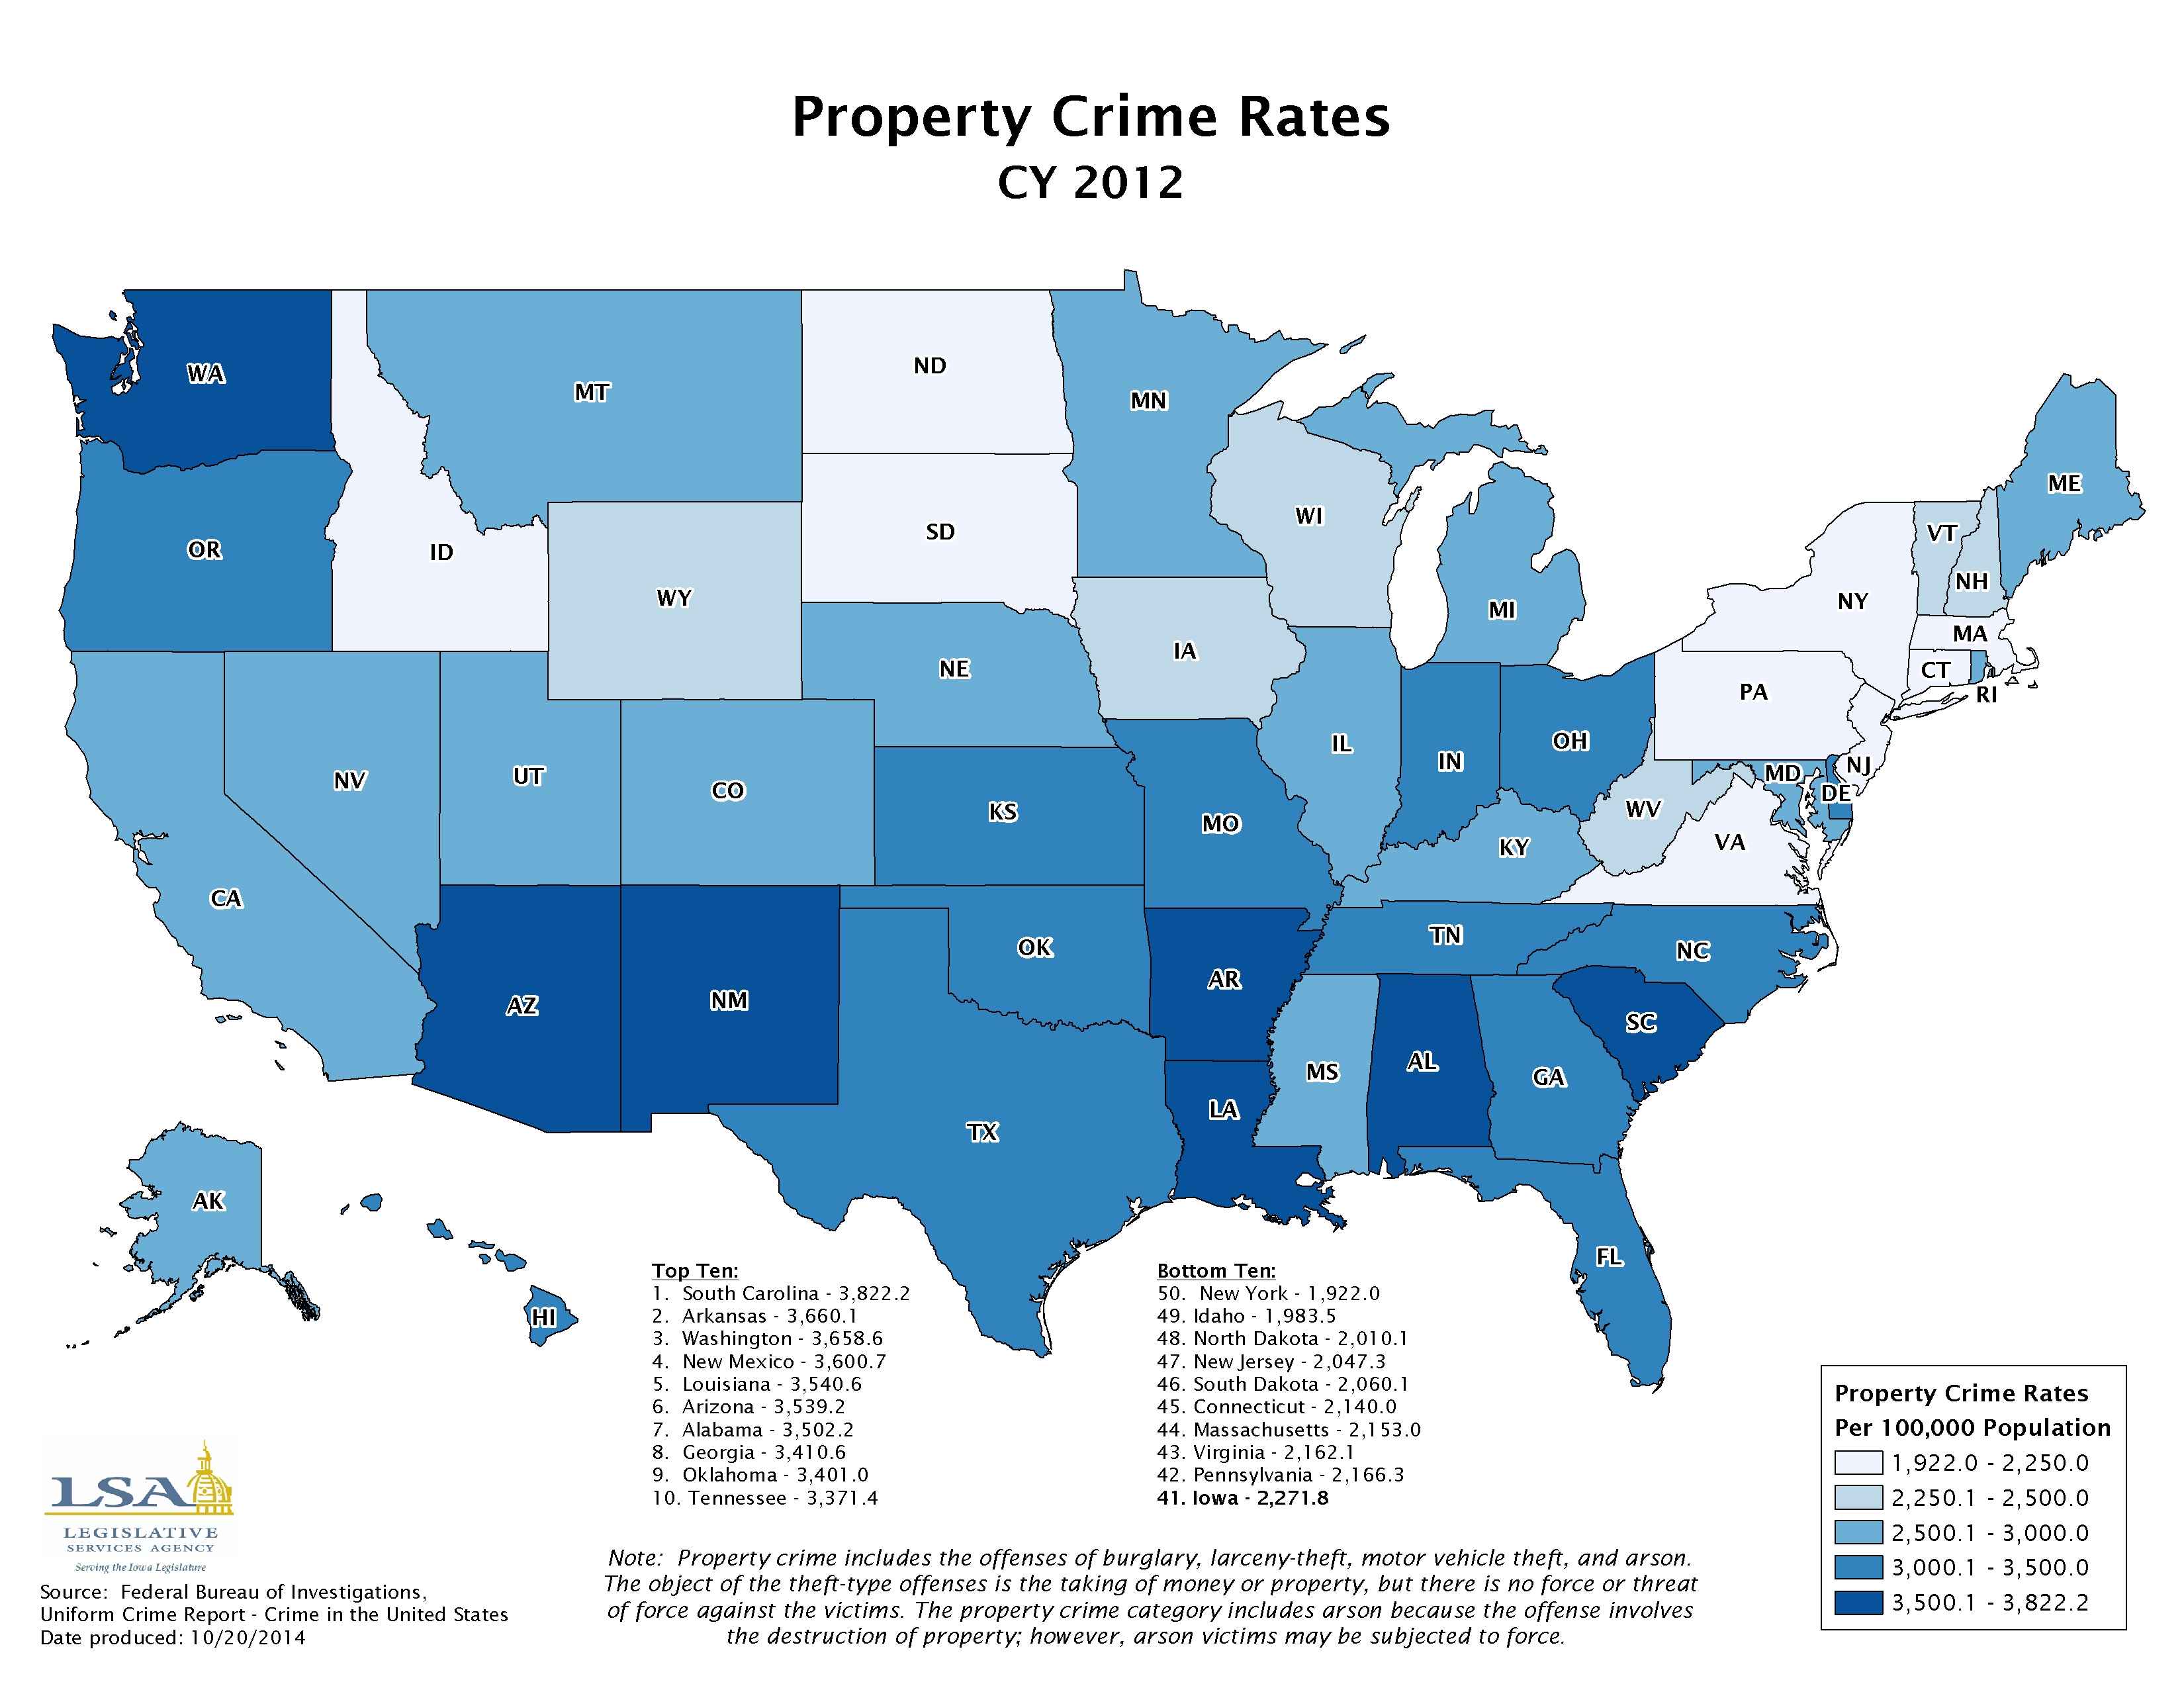
Property Crime Rates - CY 2012
|
|
|
|
|
| 10/13/2014 |
Iowa Insights |
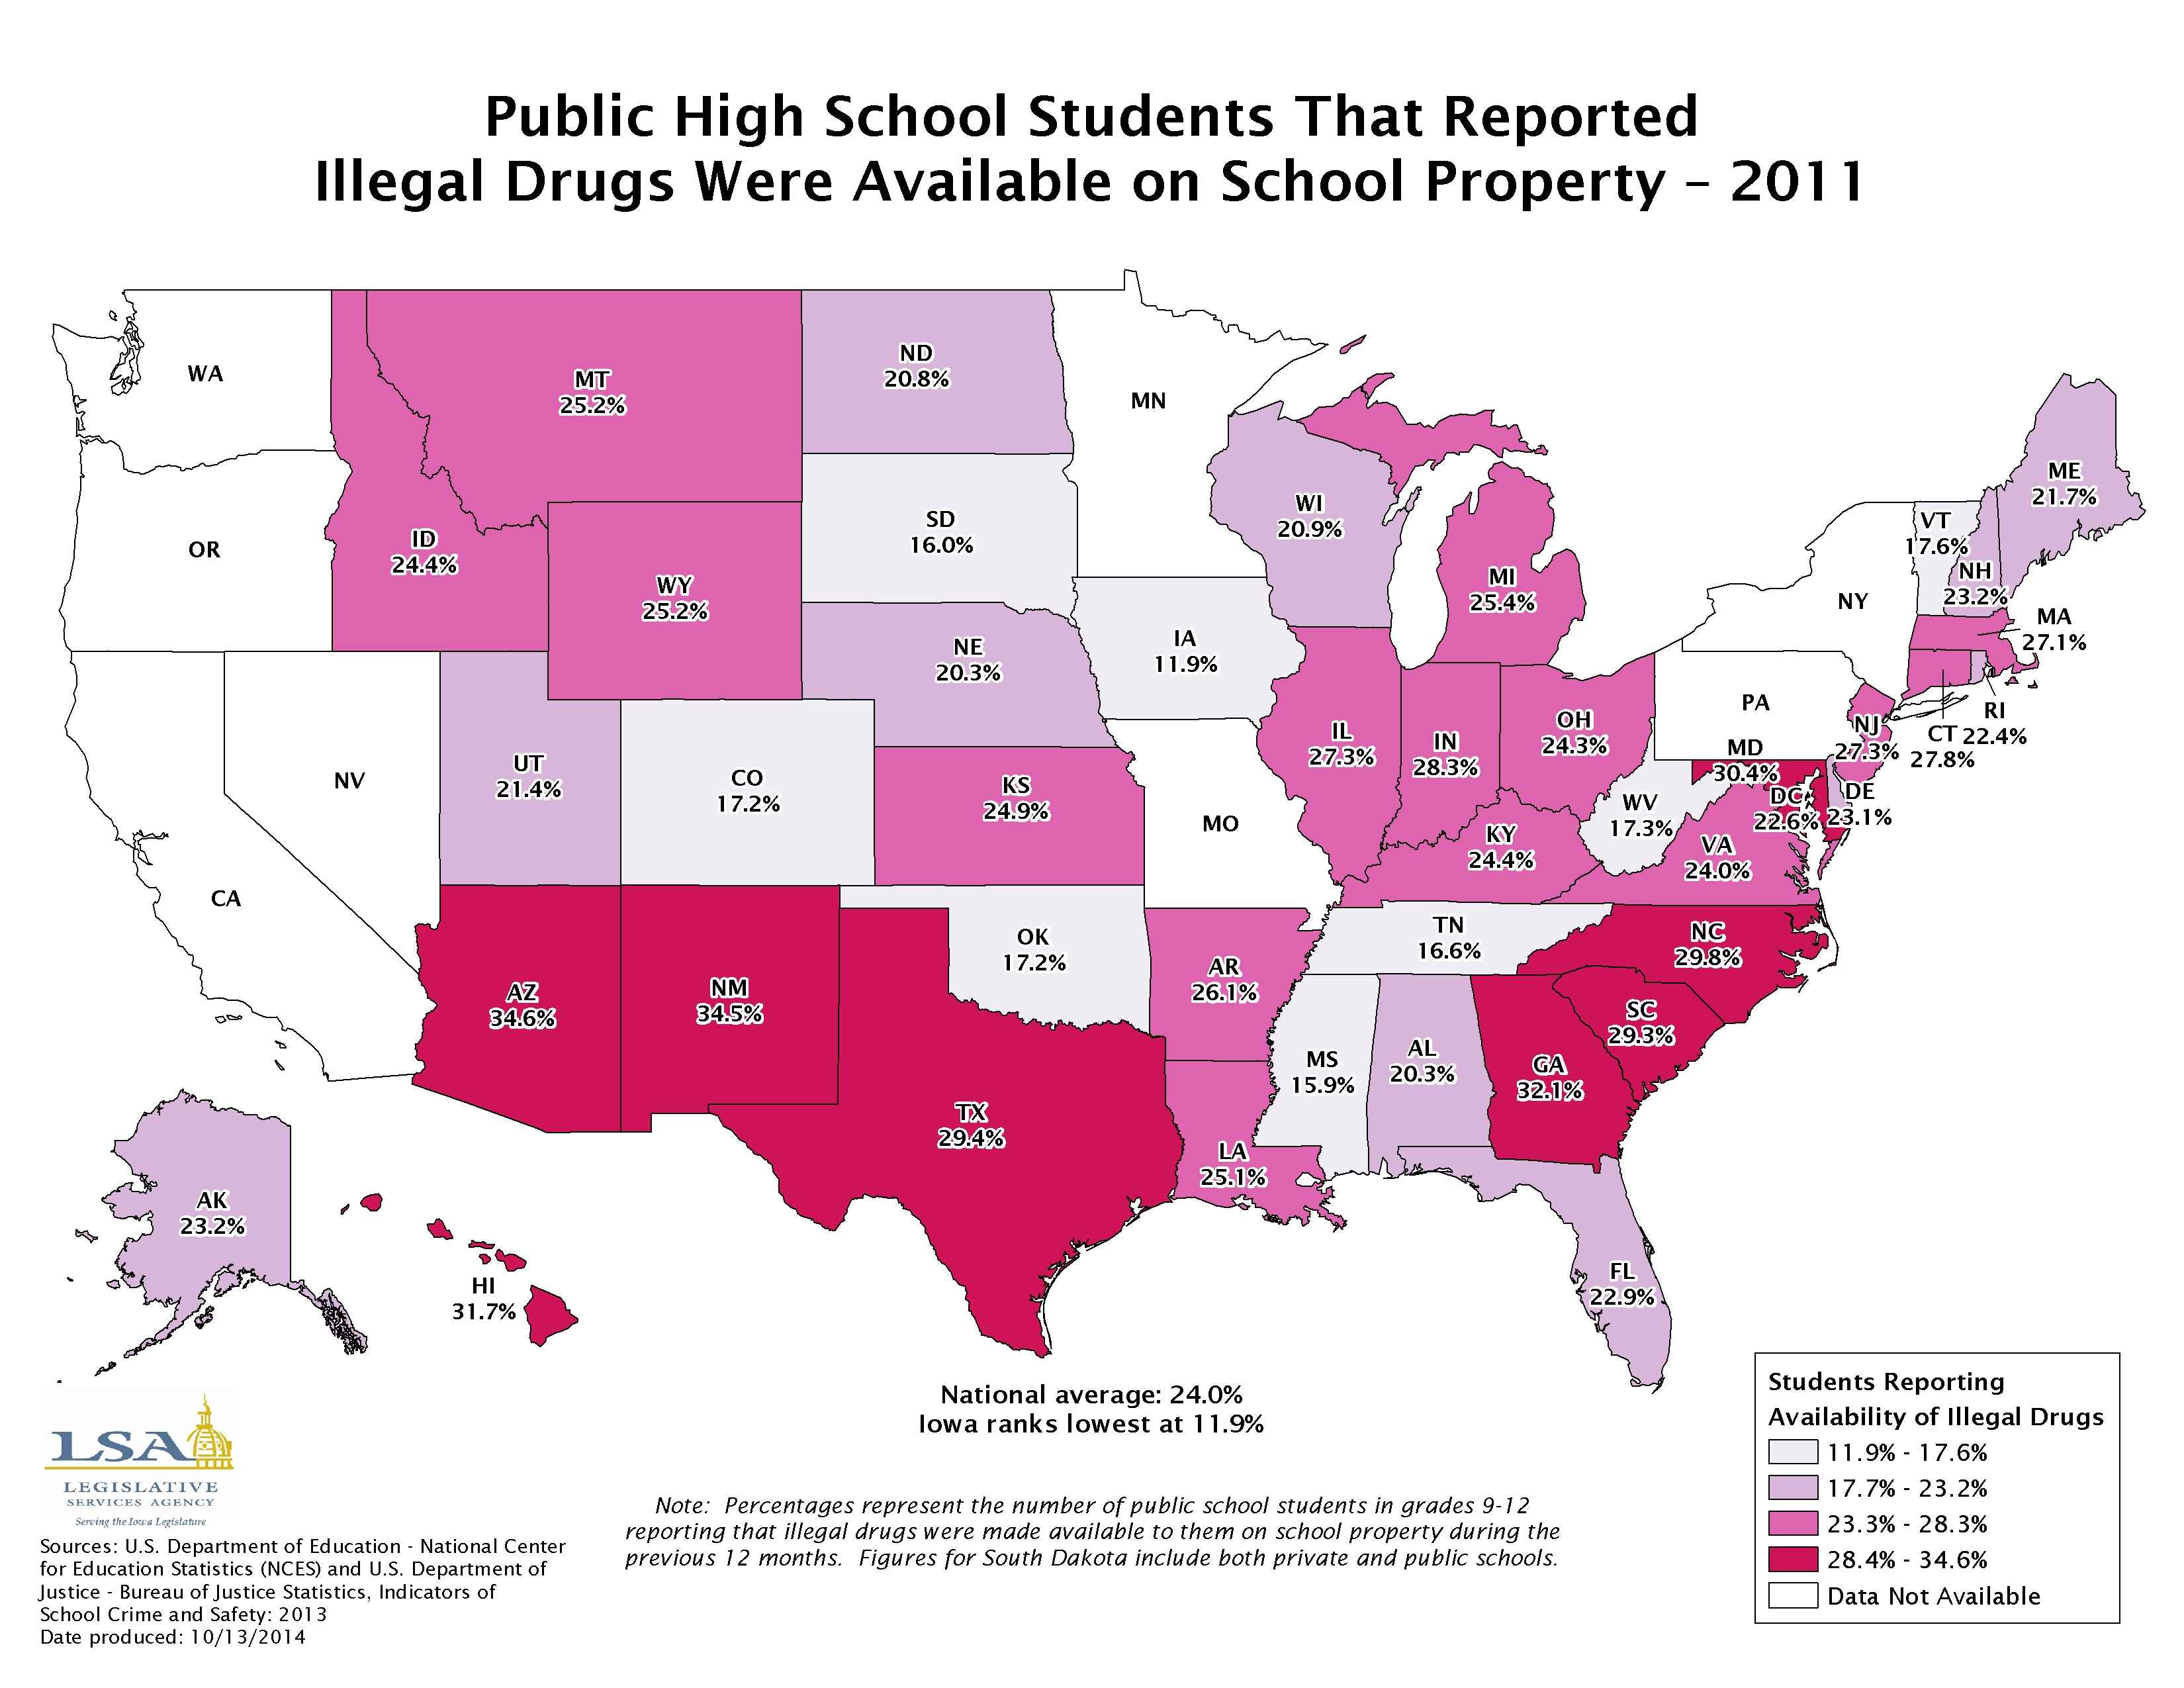
Public High School Students That Reported Illegal Drugs Were Available on School Property - 2011
|
|
|
|
|
| 10/06/2014 |
Iowa Insights |
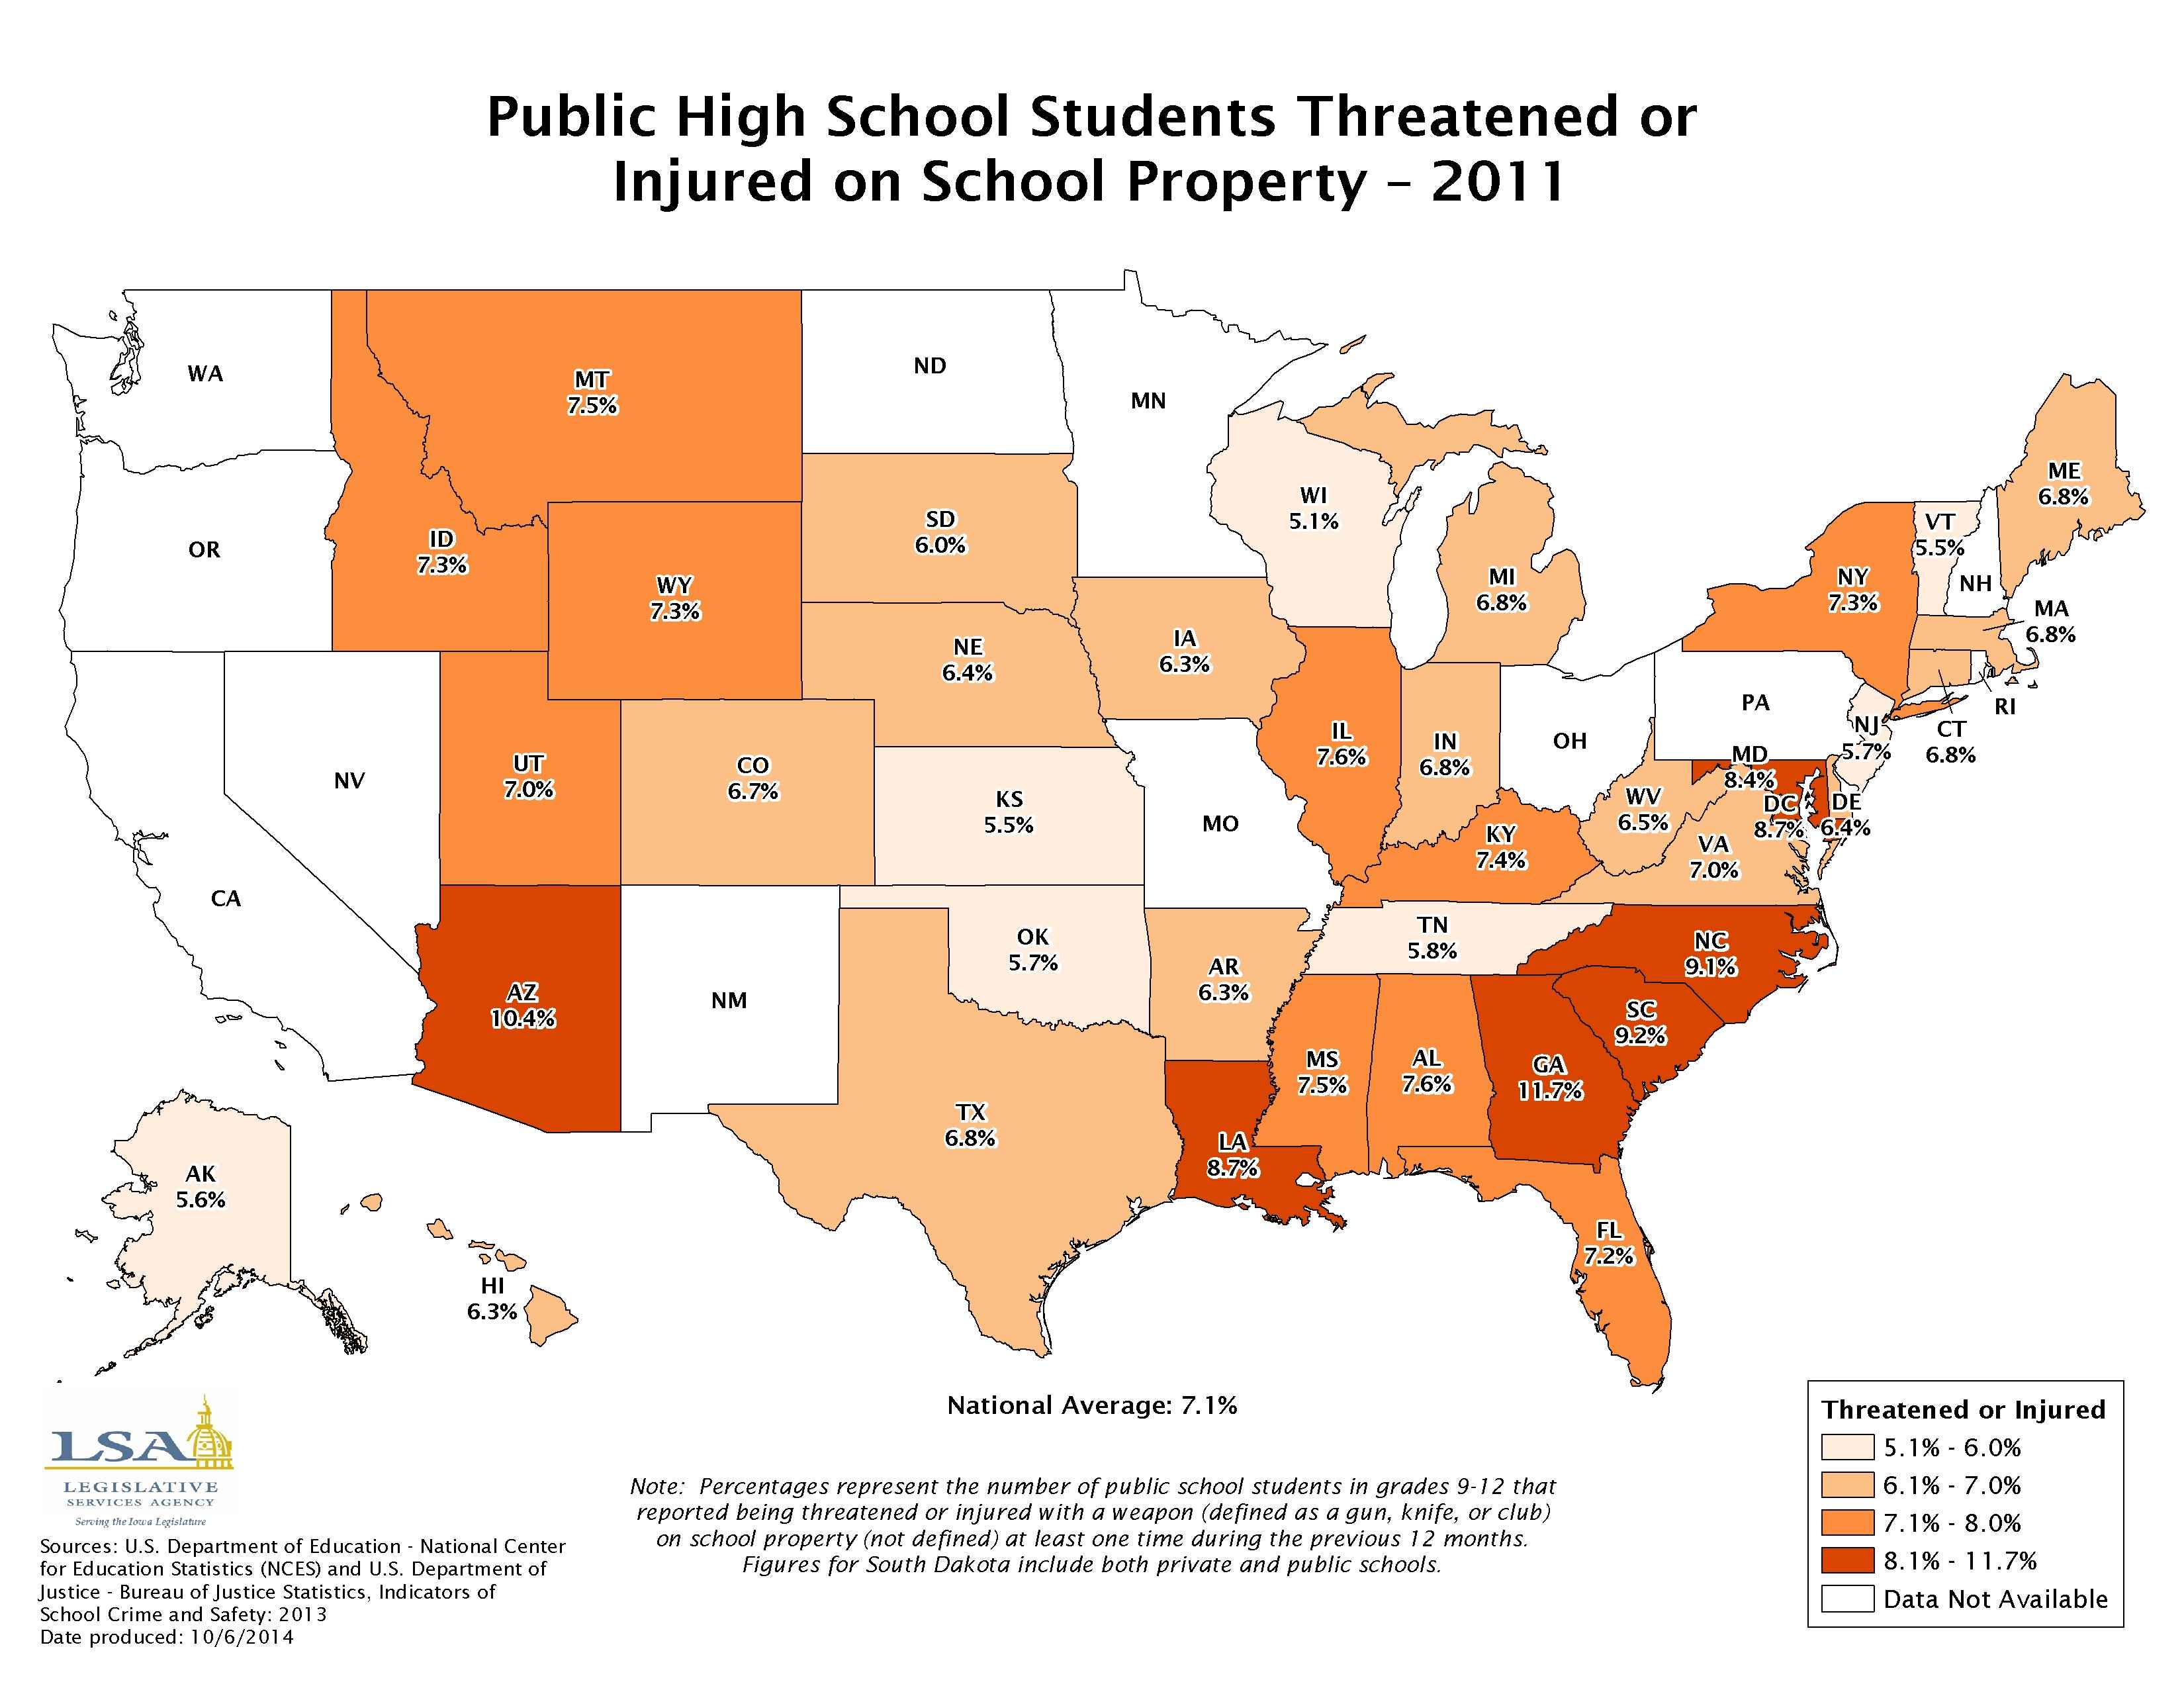
Public High School Students Threatened or Injured on School Property - 2011
|
|
|
|
|
| 09/29/2014 |
Iowa Insights |
Earned Income Tax Credit (EITC) by School District - 2012

|
|
|
|
|
| 09/22/2014 |
Iowa Insights |
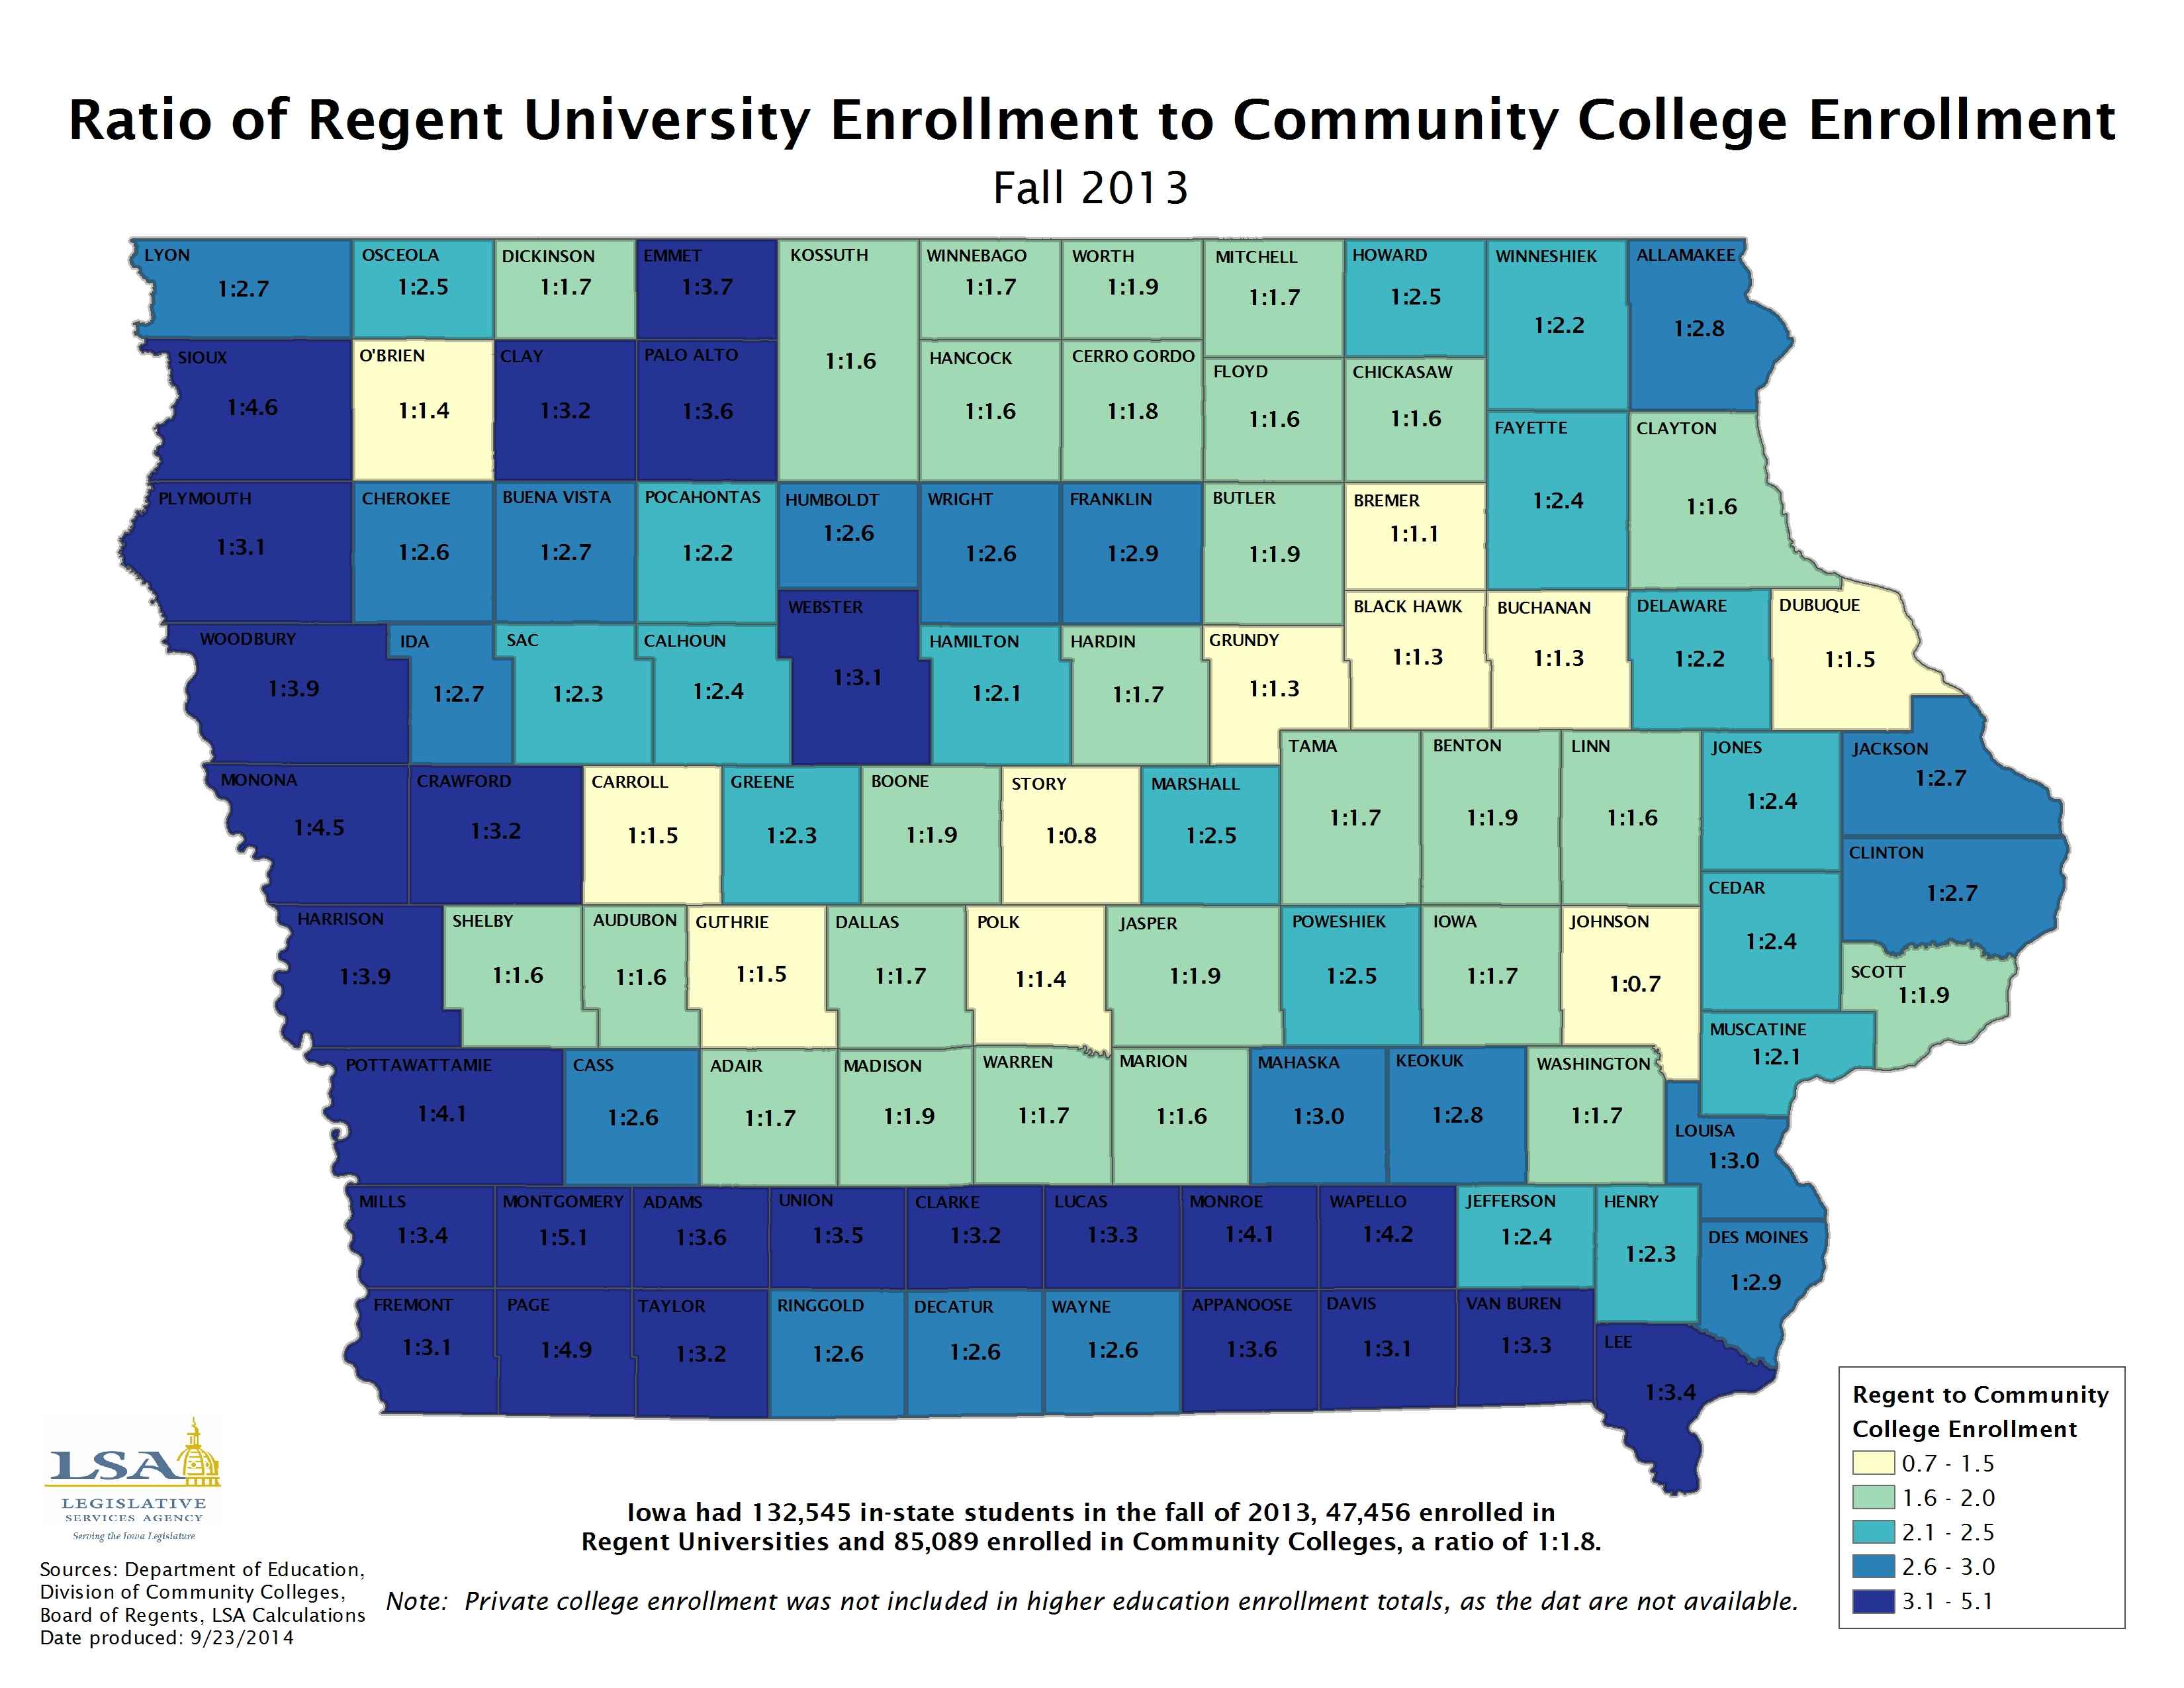
Ratio of Regent University Enrollment to Community College Enrollment
|
|
|
|
|
| 09/15/2014 |
Iowa Insights |
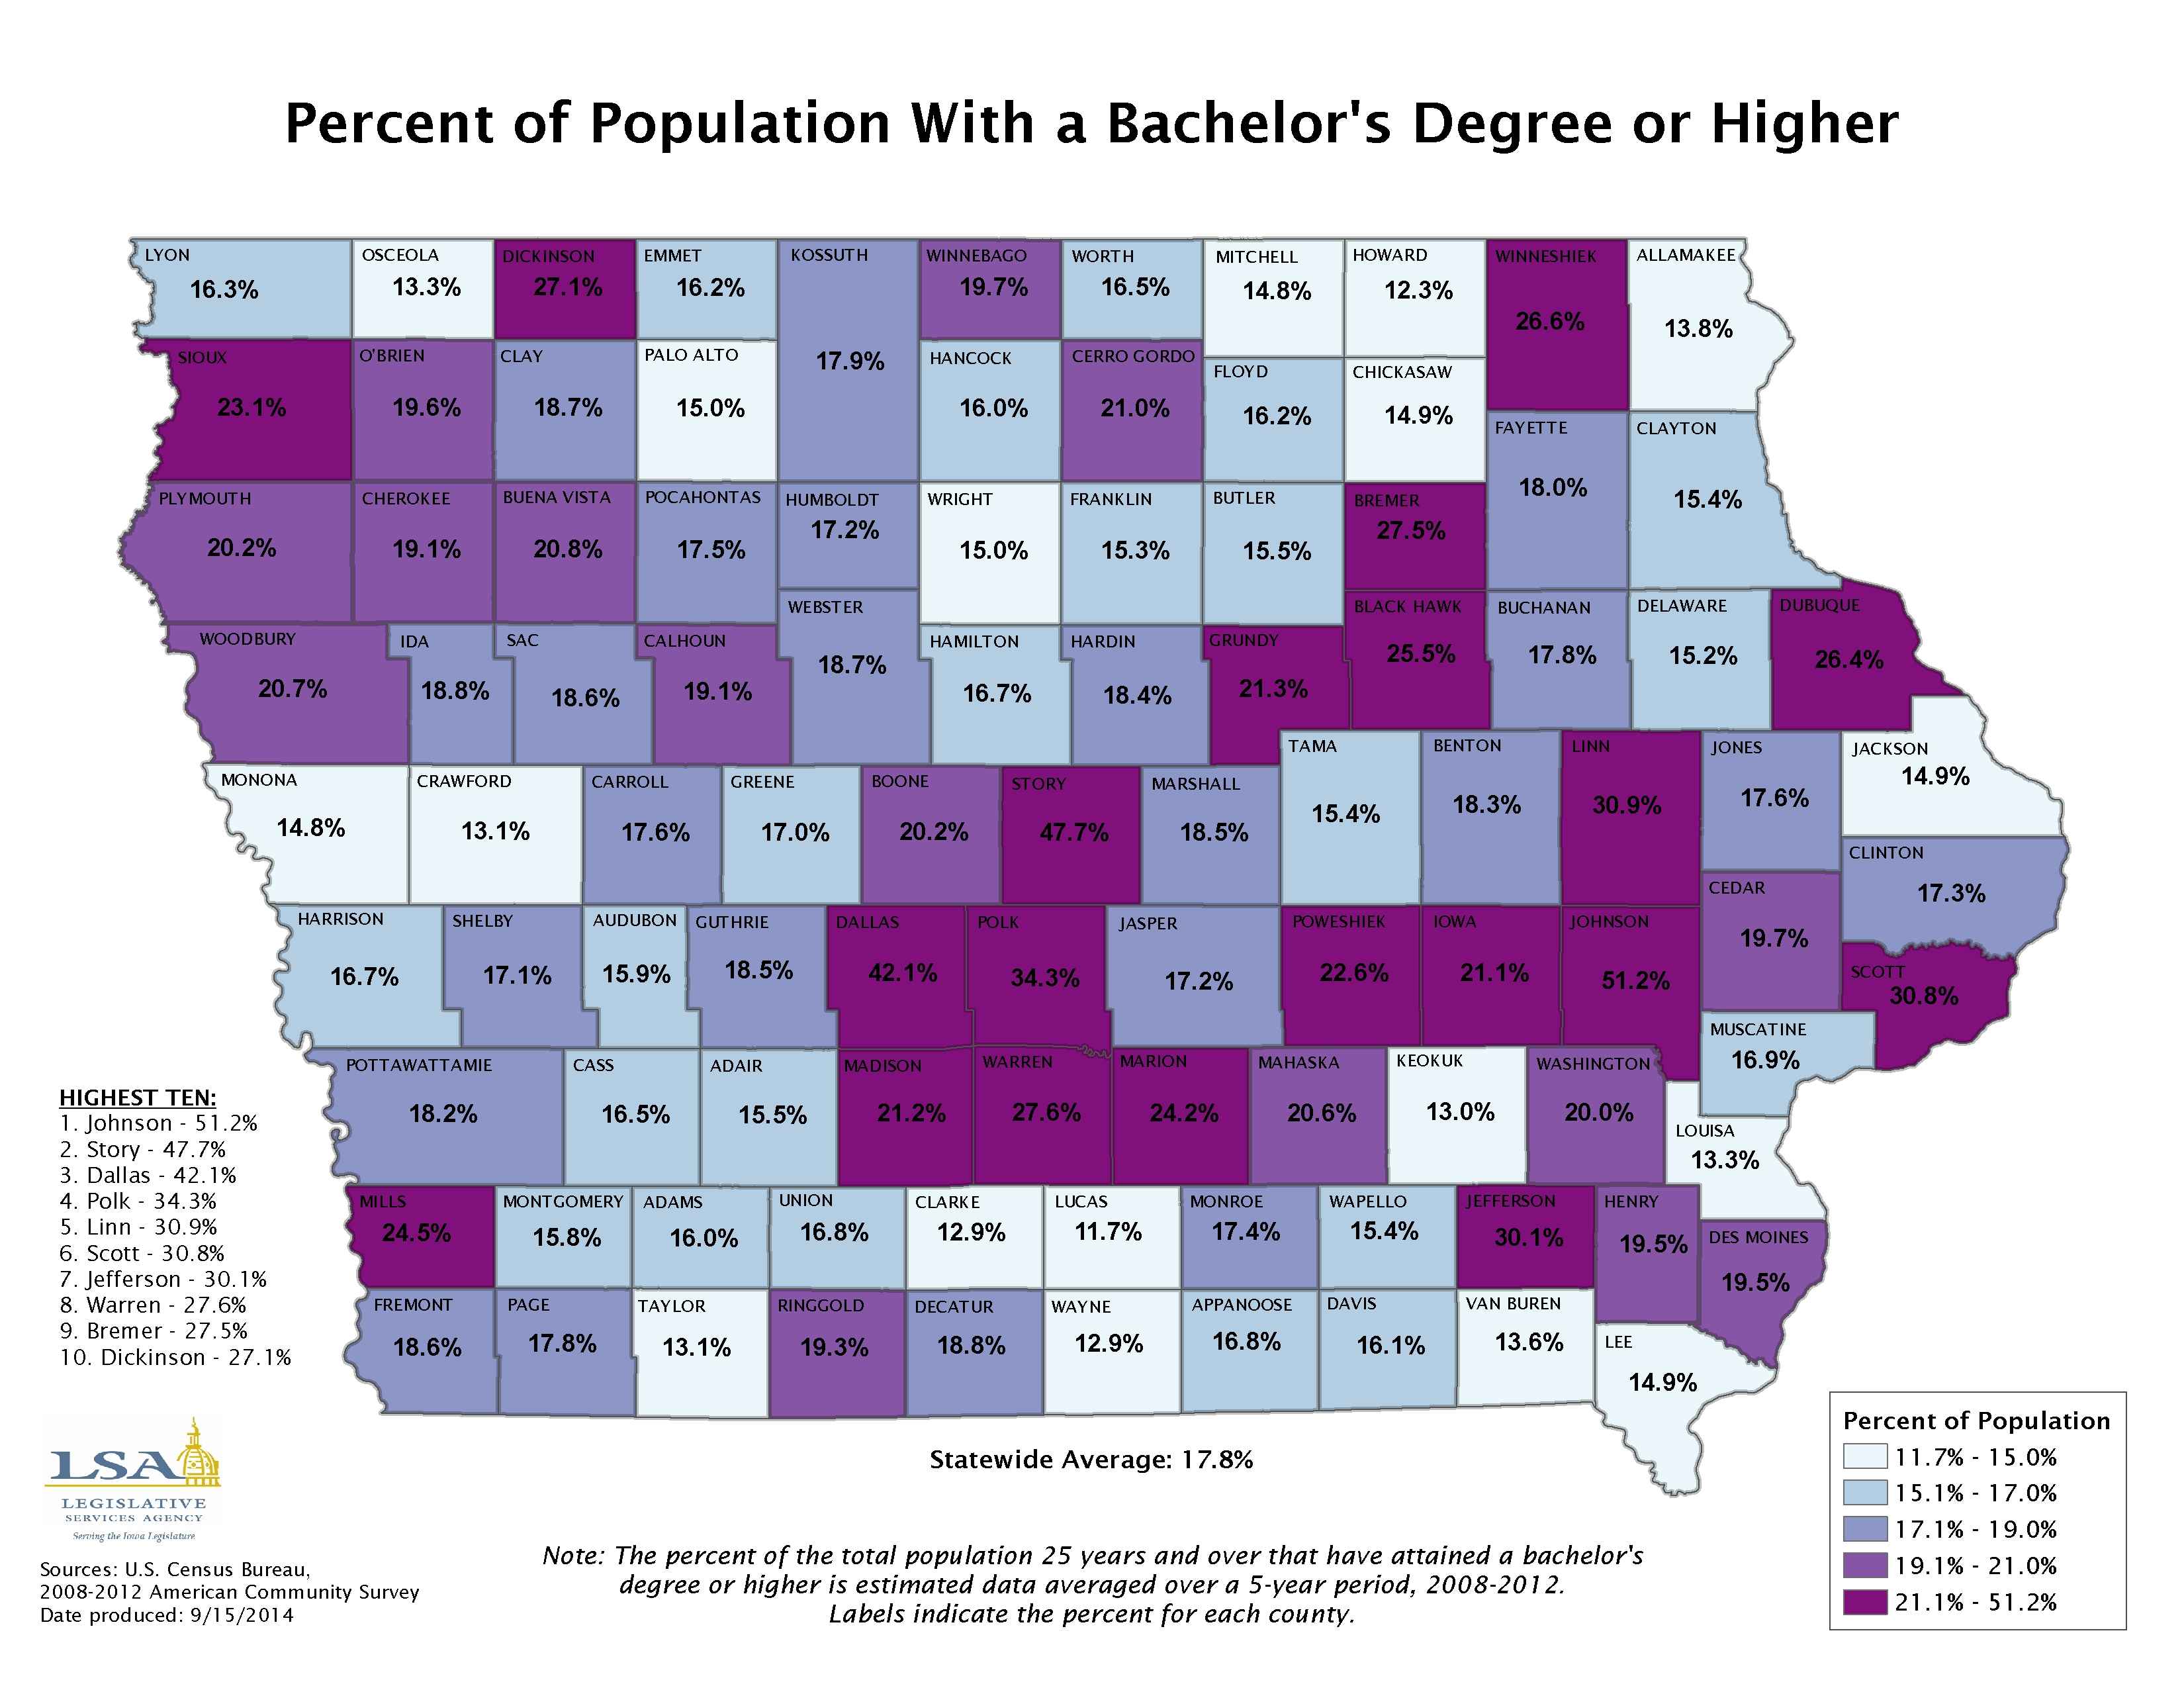
Percent of Population With a Bachelor's Degree or Higher
|
|
|
|
|
| 09/08/2014 |
Iowa Insights |
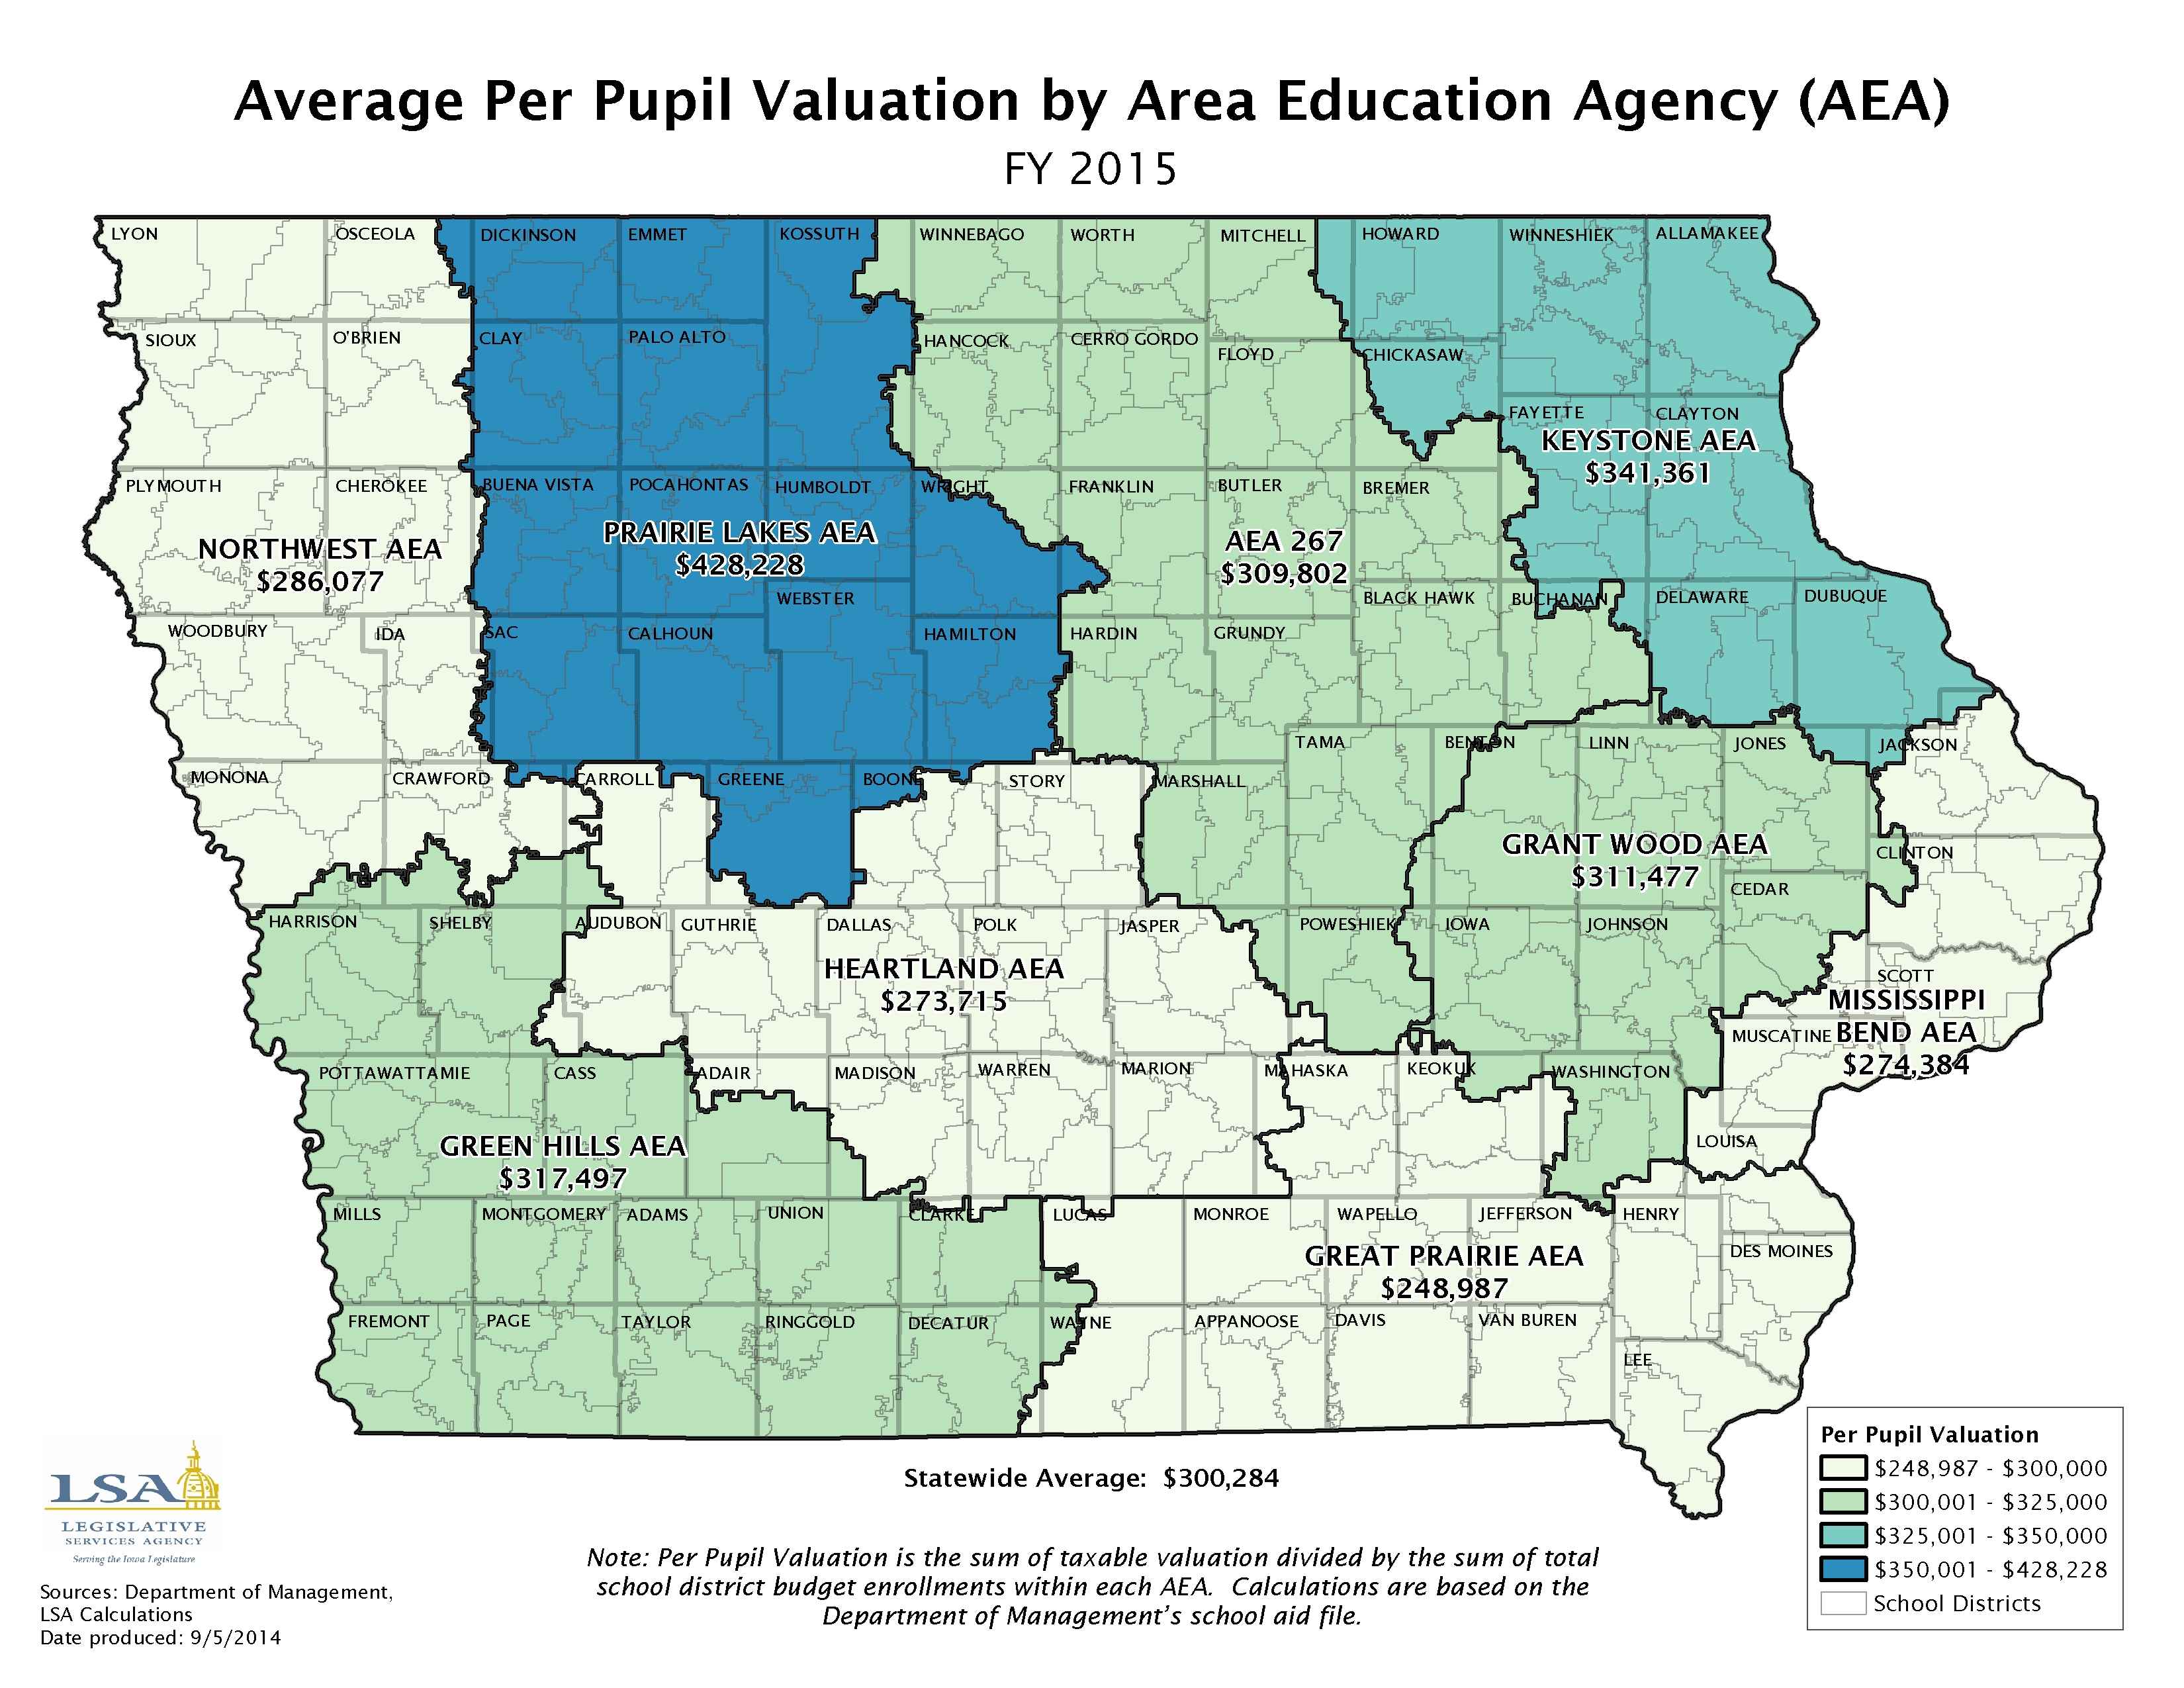
Average Per Pupil Valuation by Area Education Agency (AEA) - FY 2015
|
|
|
|
|
| 09/02/2014 |
Iowa Insights |
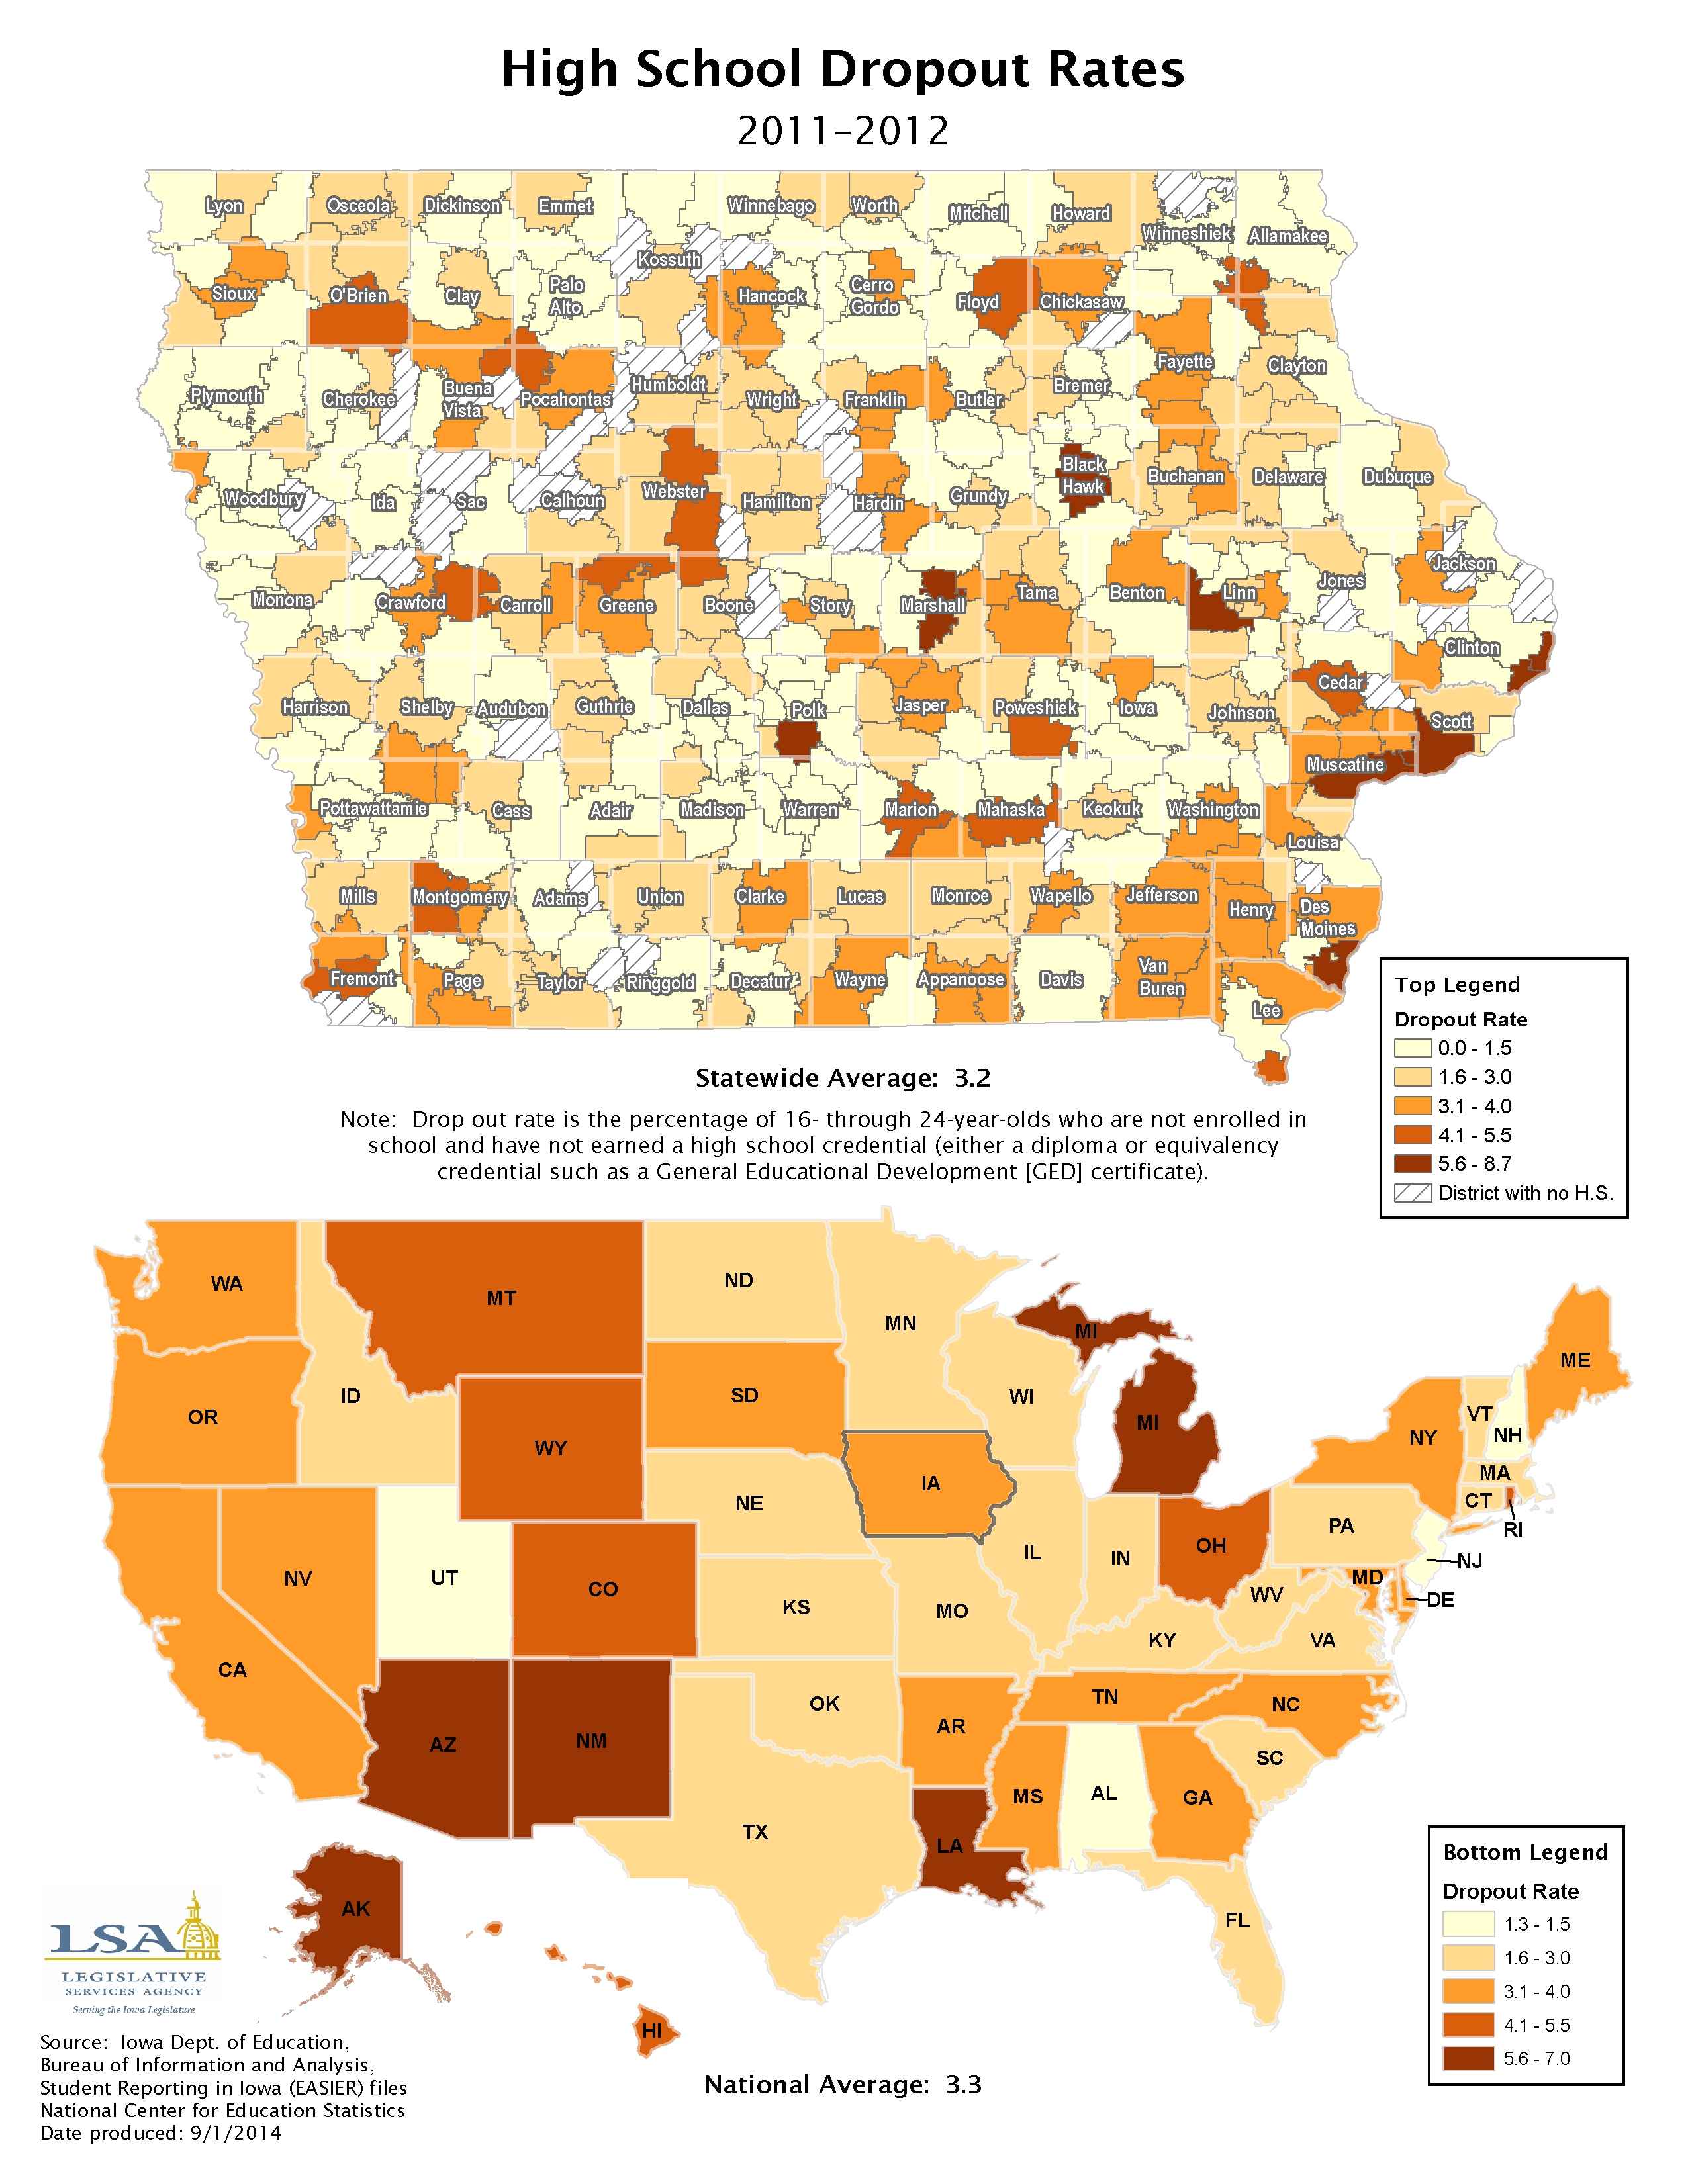
High School Dropout Rates - 2011-2012
|
|
|
|
|
| 08/25/2014 |
Iowa Insights |
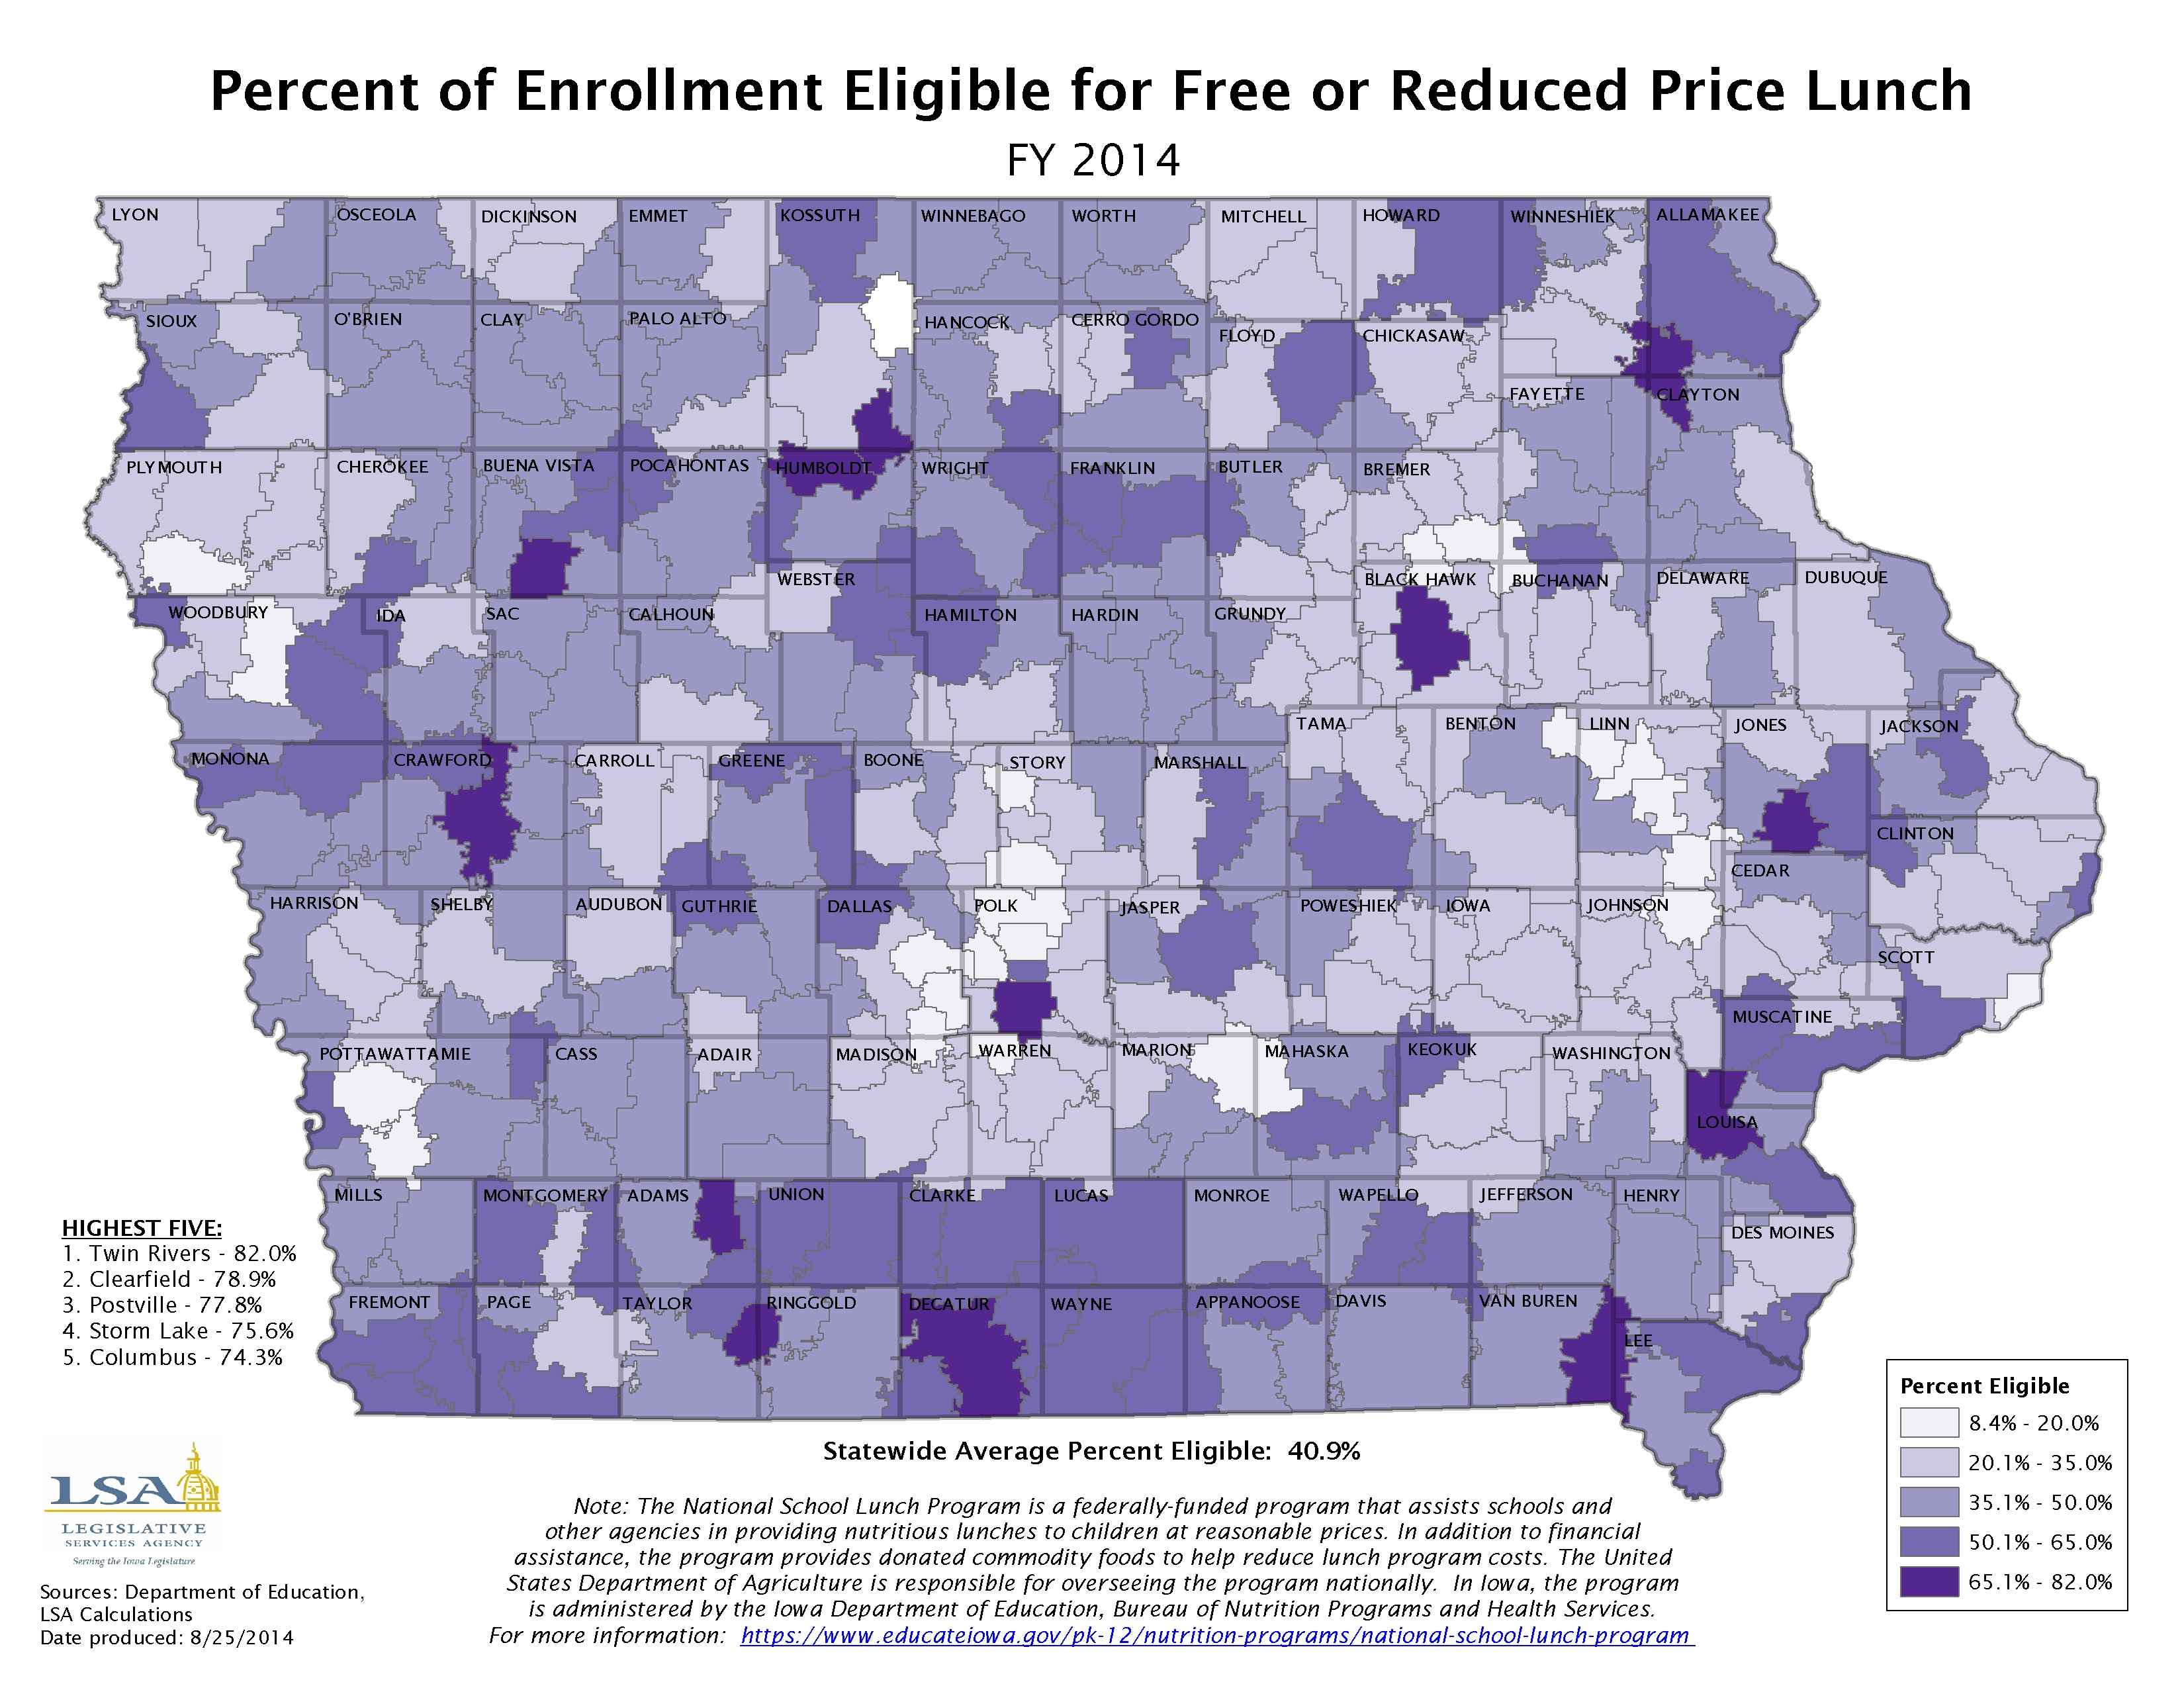
Percent of Enrollment Eligible for Free or Reduced Price Lunch - FY 2014
|
|
|
|
|
| 08/18/2014 |
Iowa Insights |
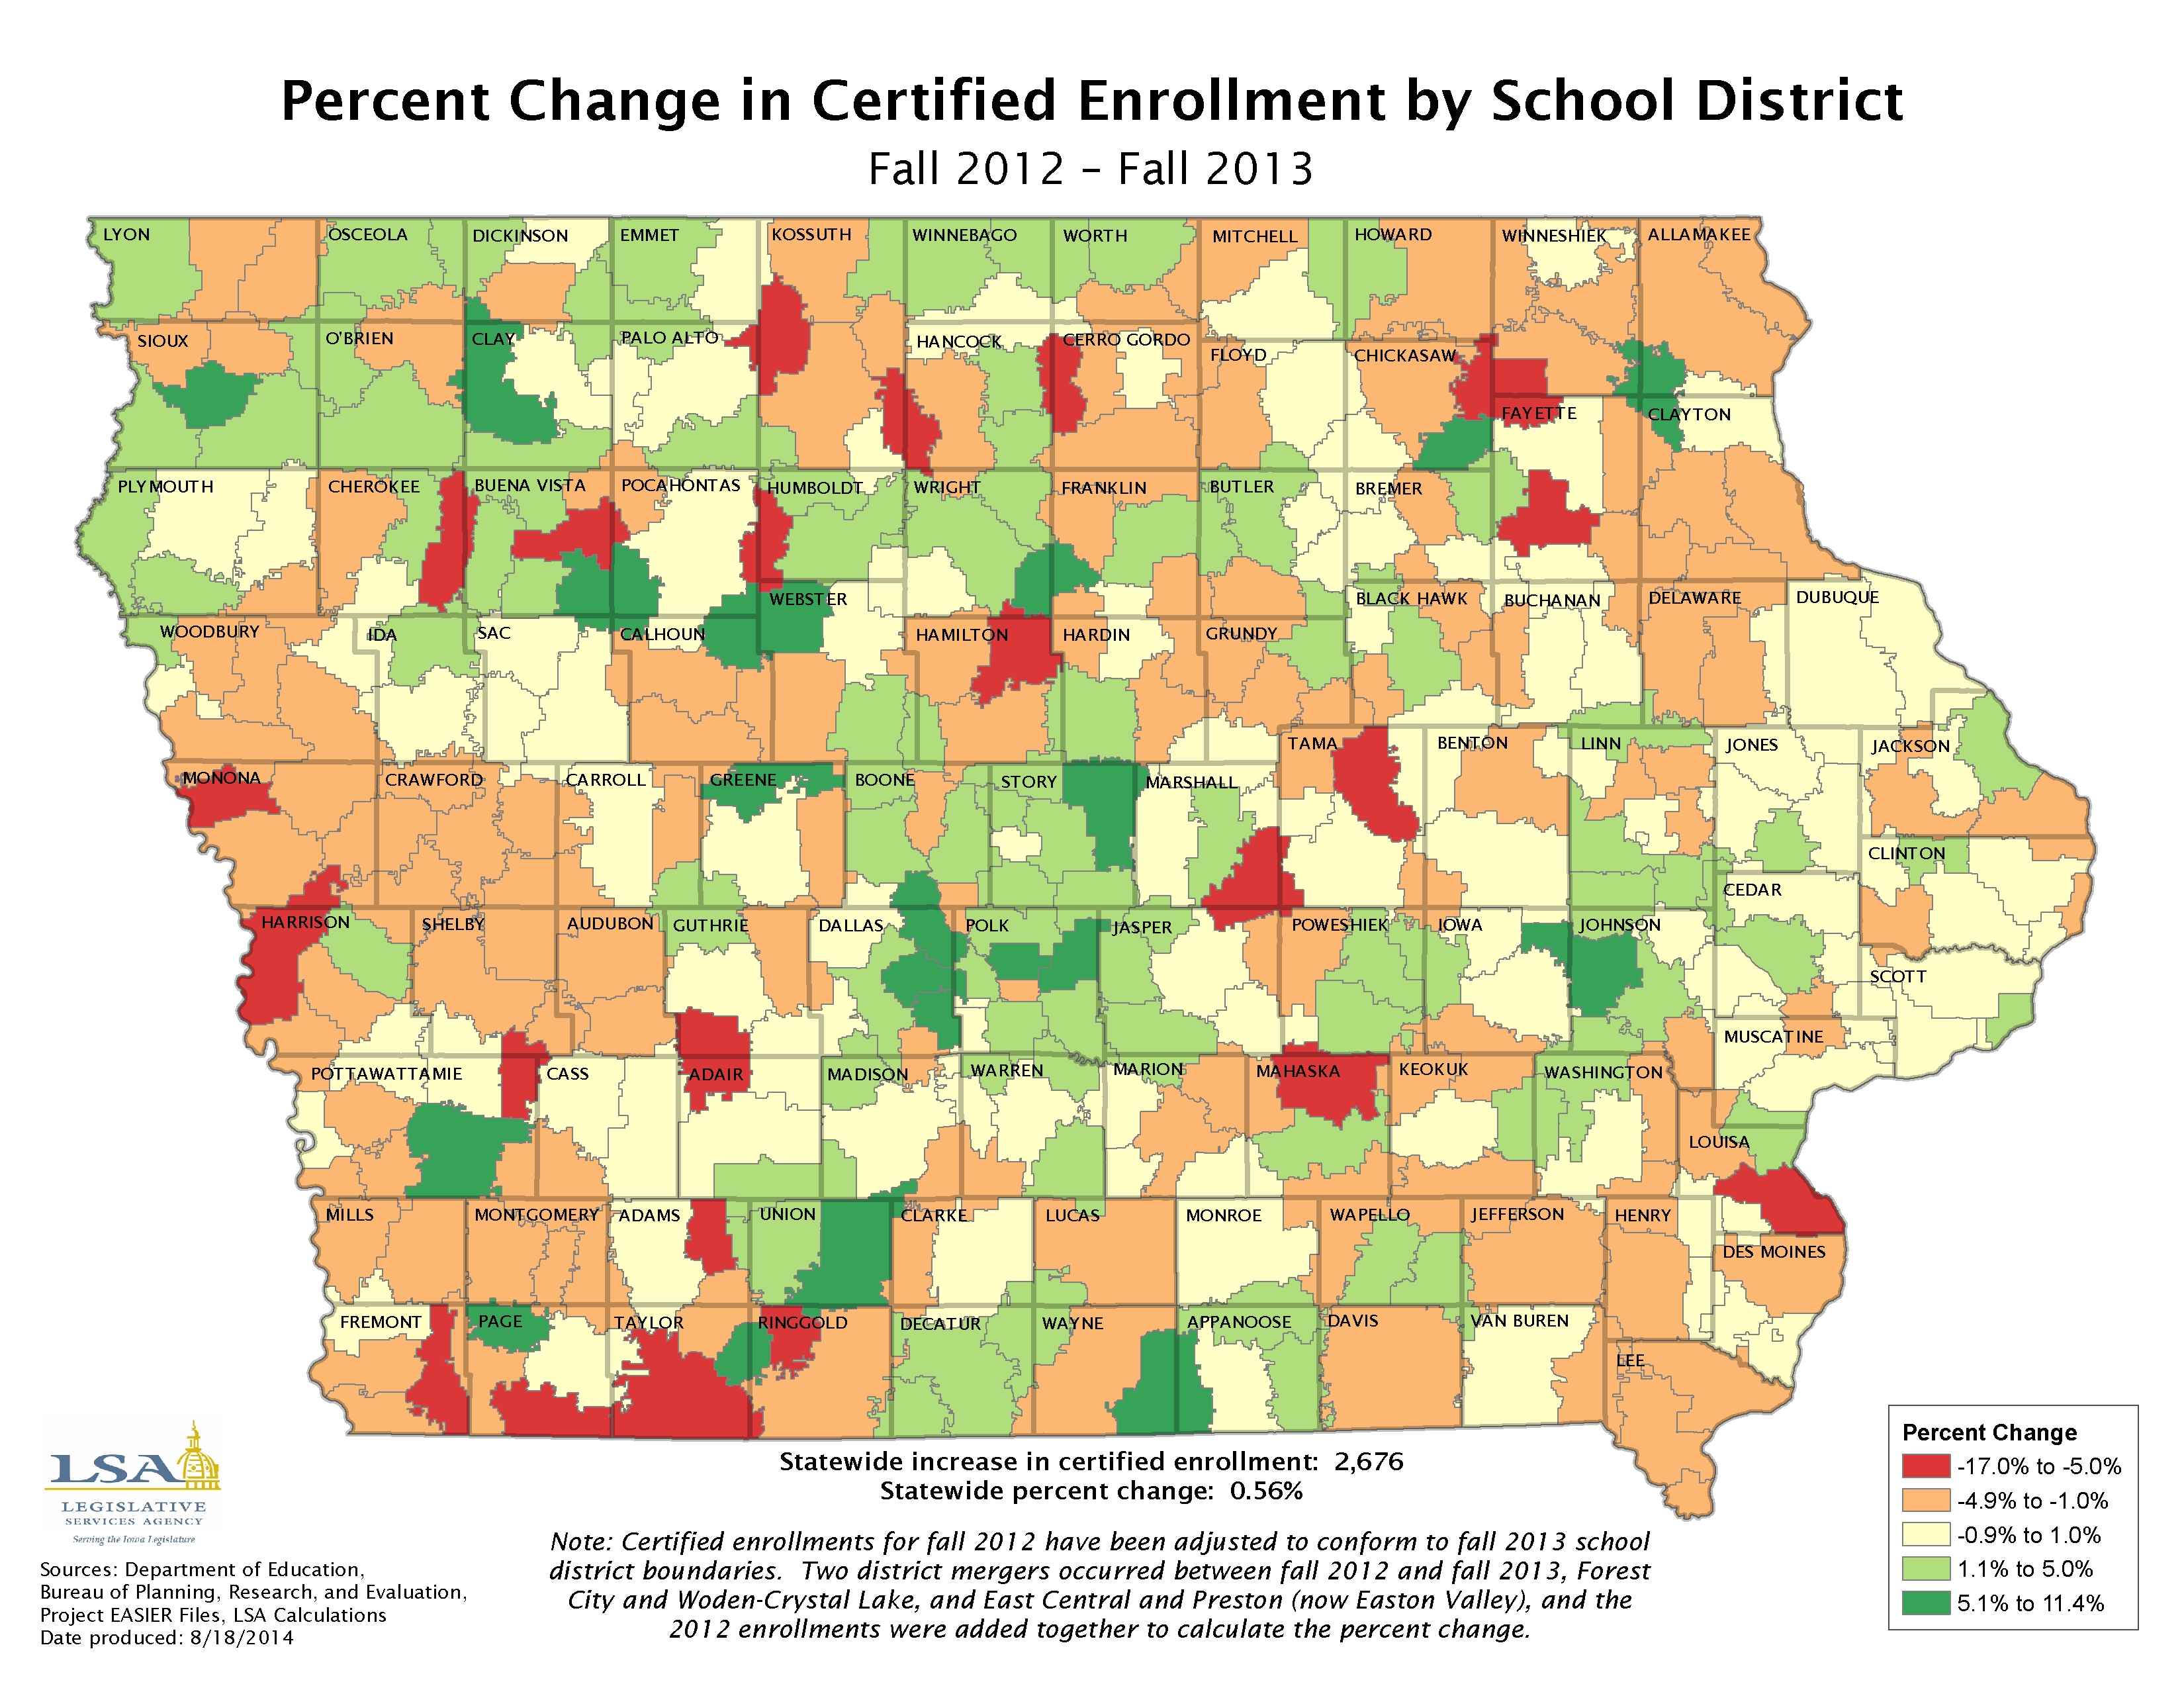
Percent Change in Certified Enrollment by School District - Fall 2012–Fall 2013
|
|
|
|
|
| 08/11/2014 |
Iowa Insights |
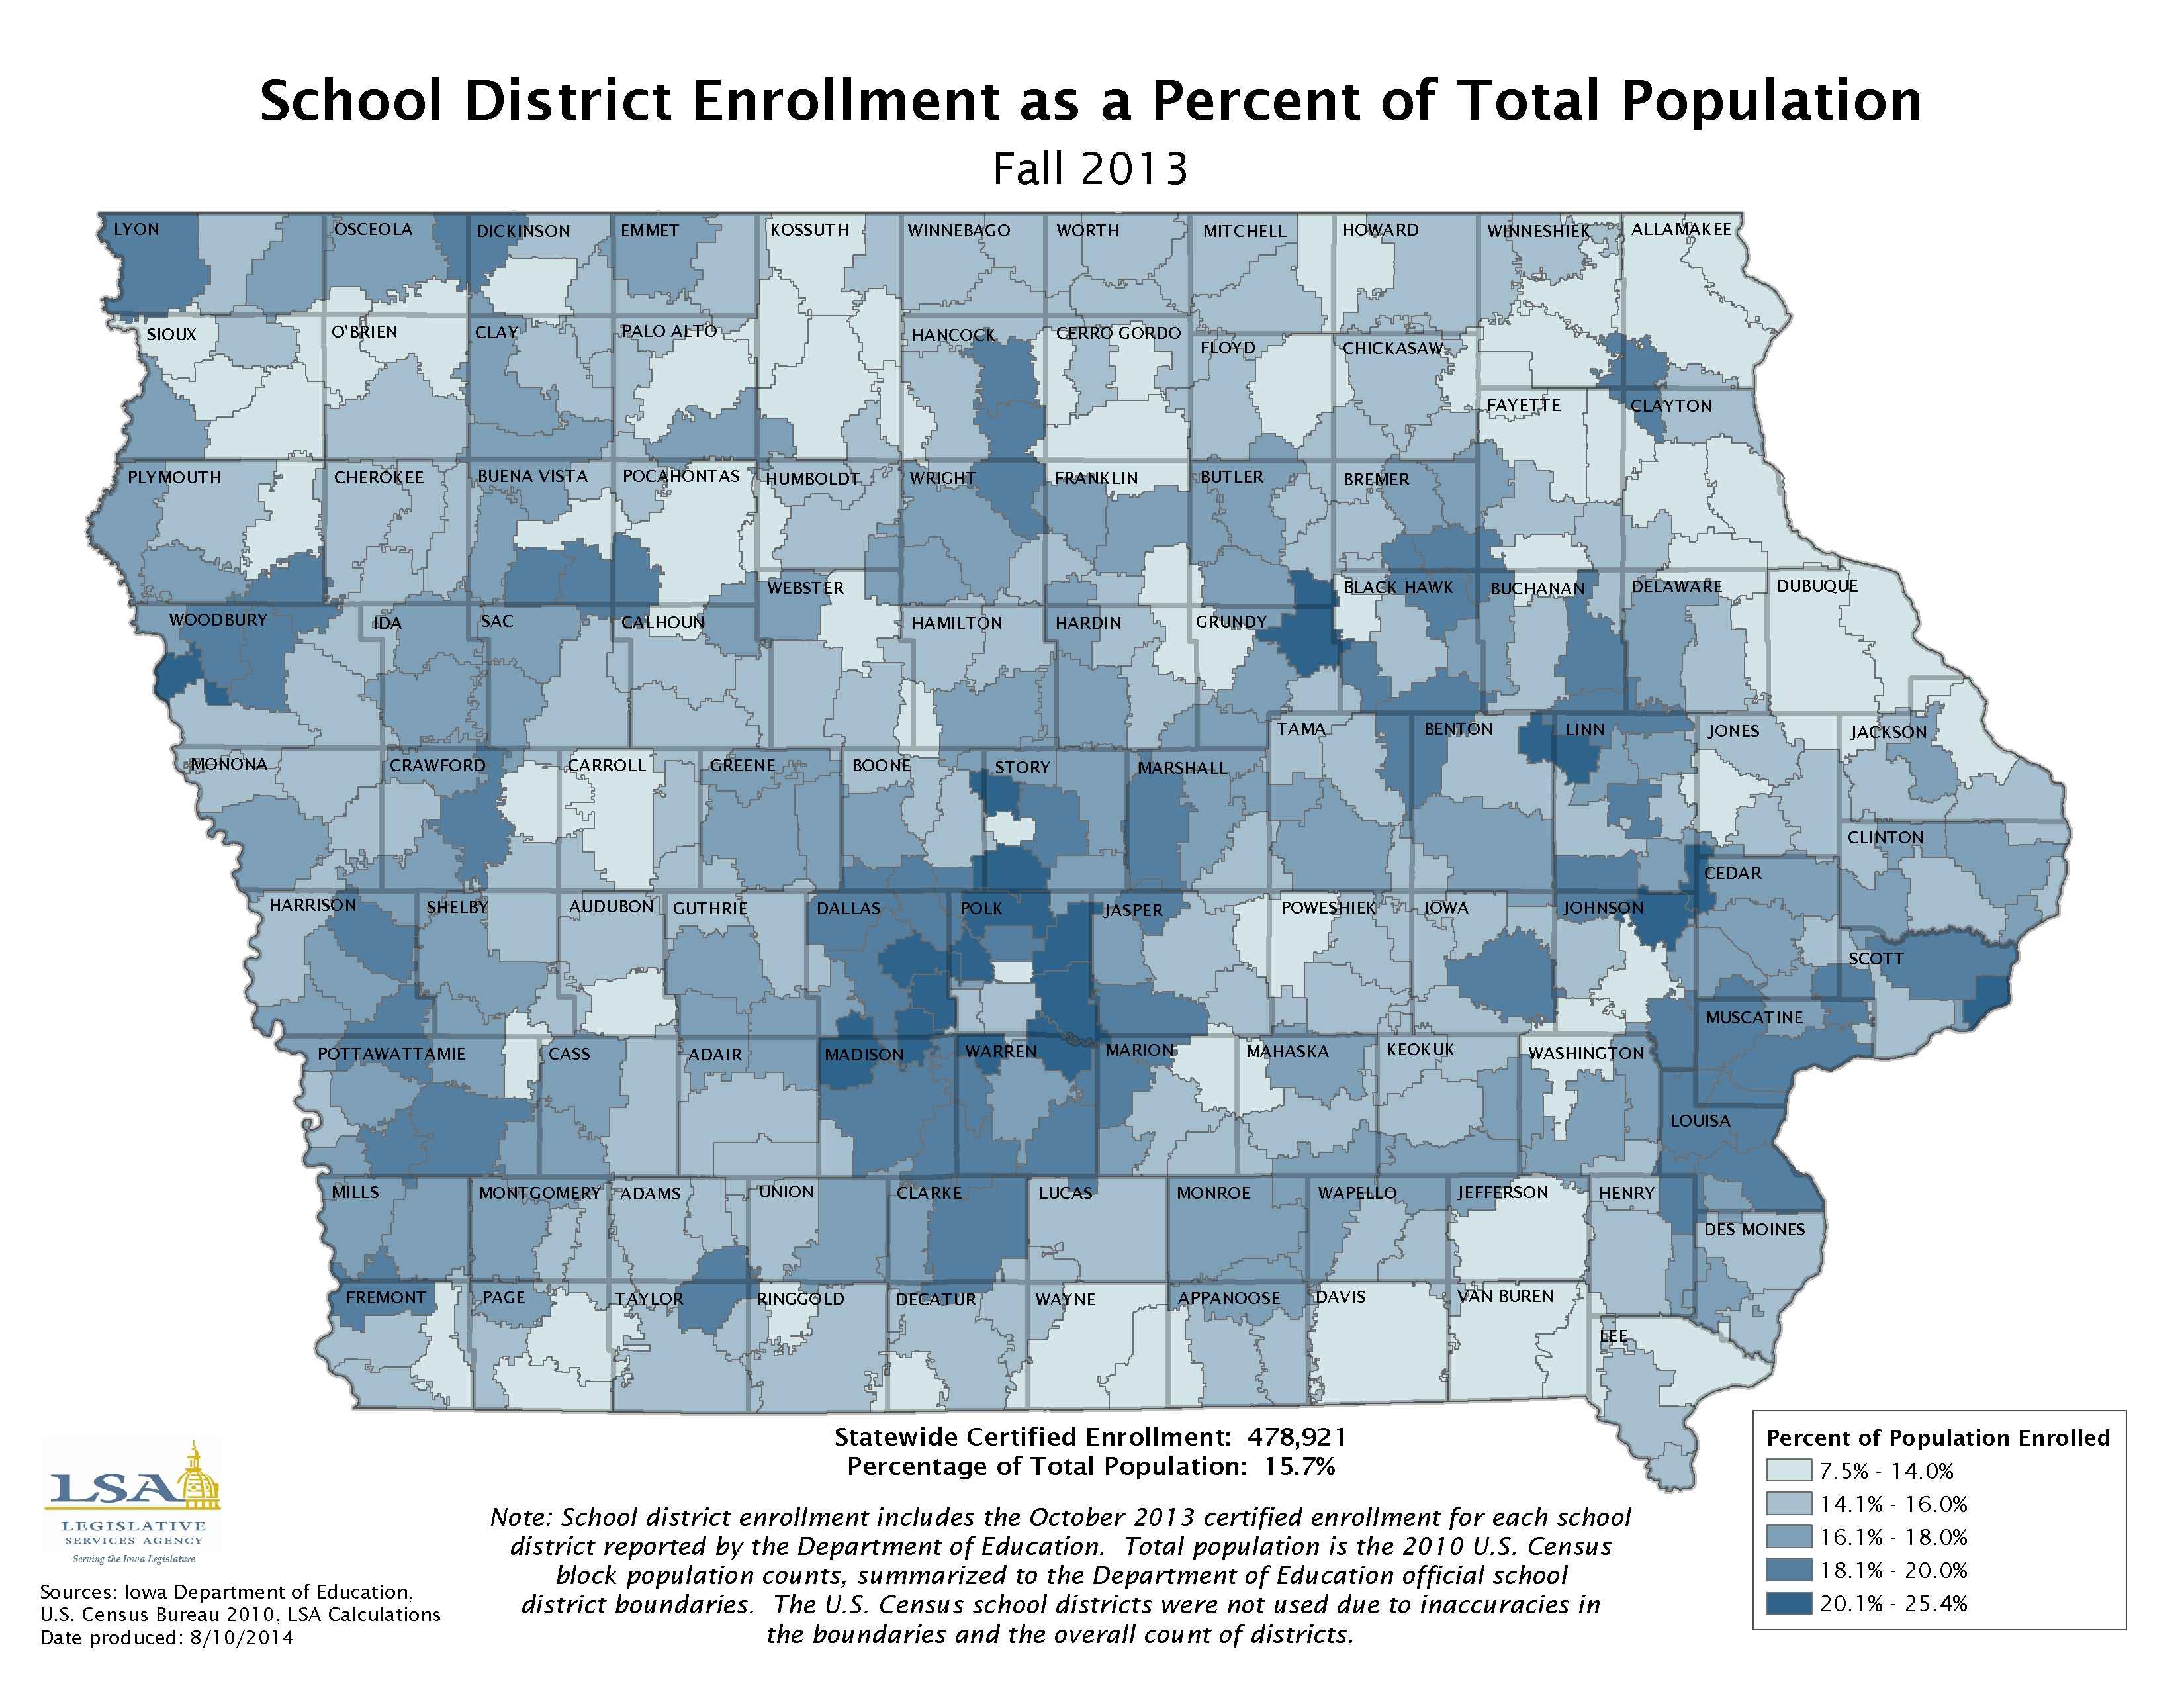
School District Enrollment as a Percentage of Total Population - Fall 2013
|
|
|
|
|
| 08/04/2014 |
Iowa Insights |
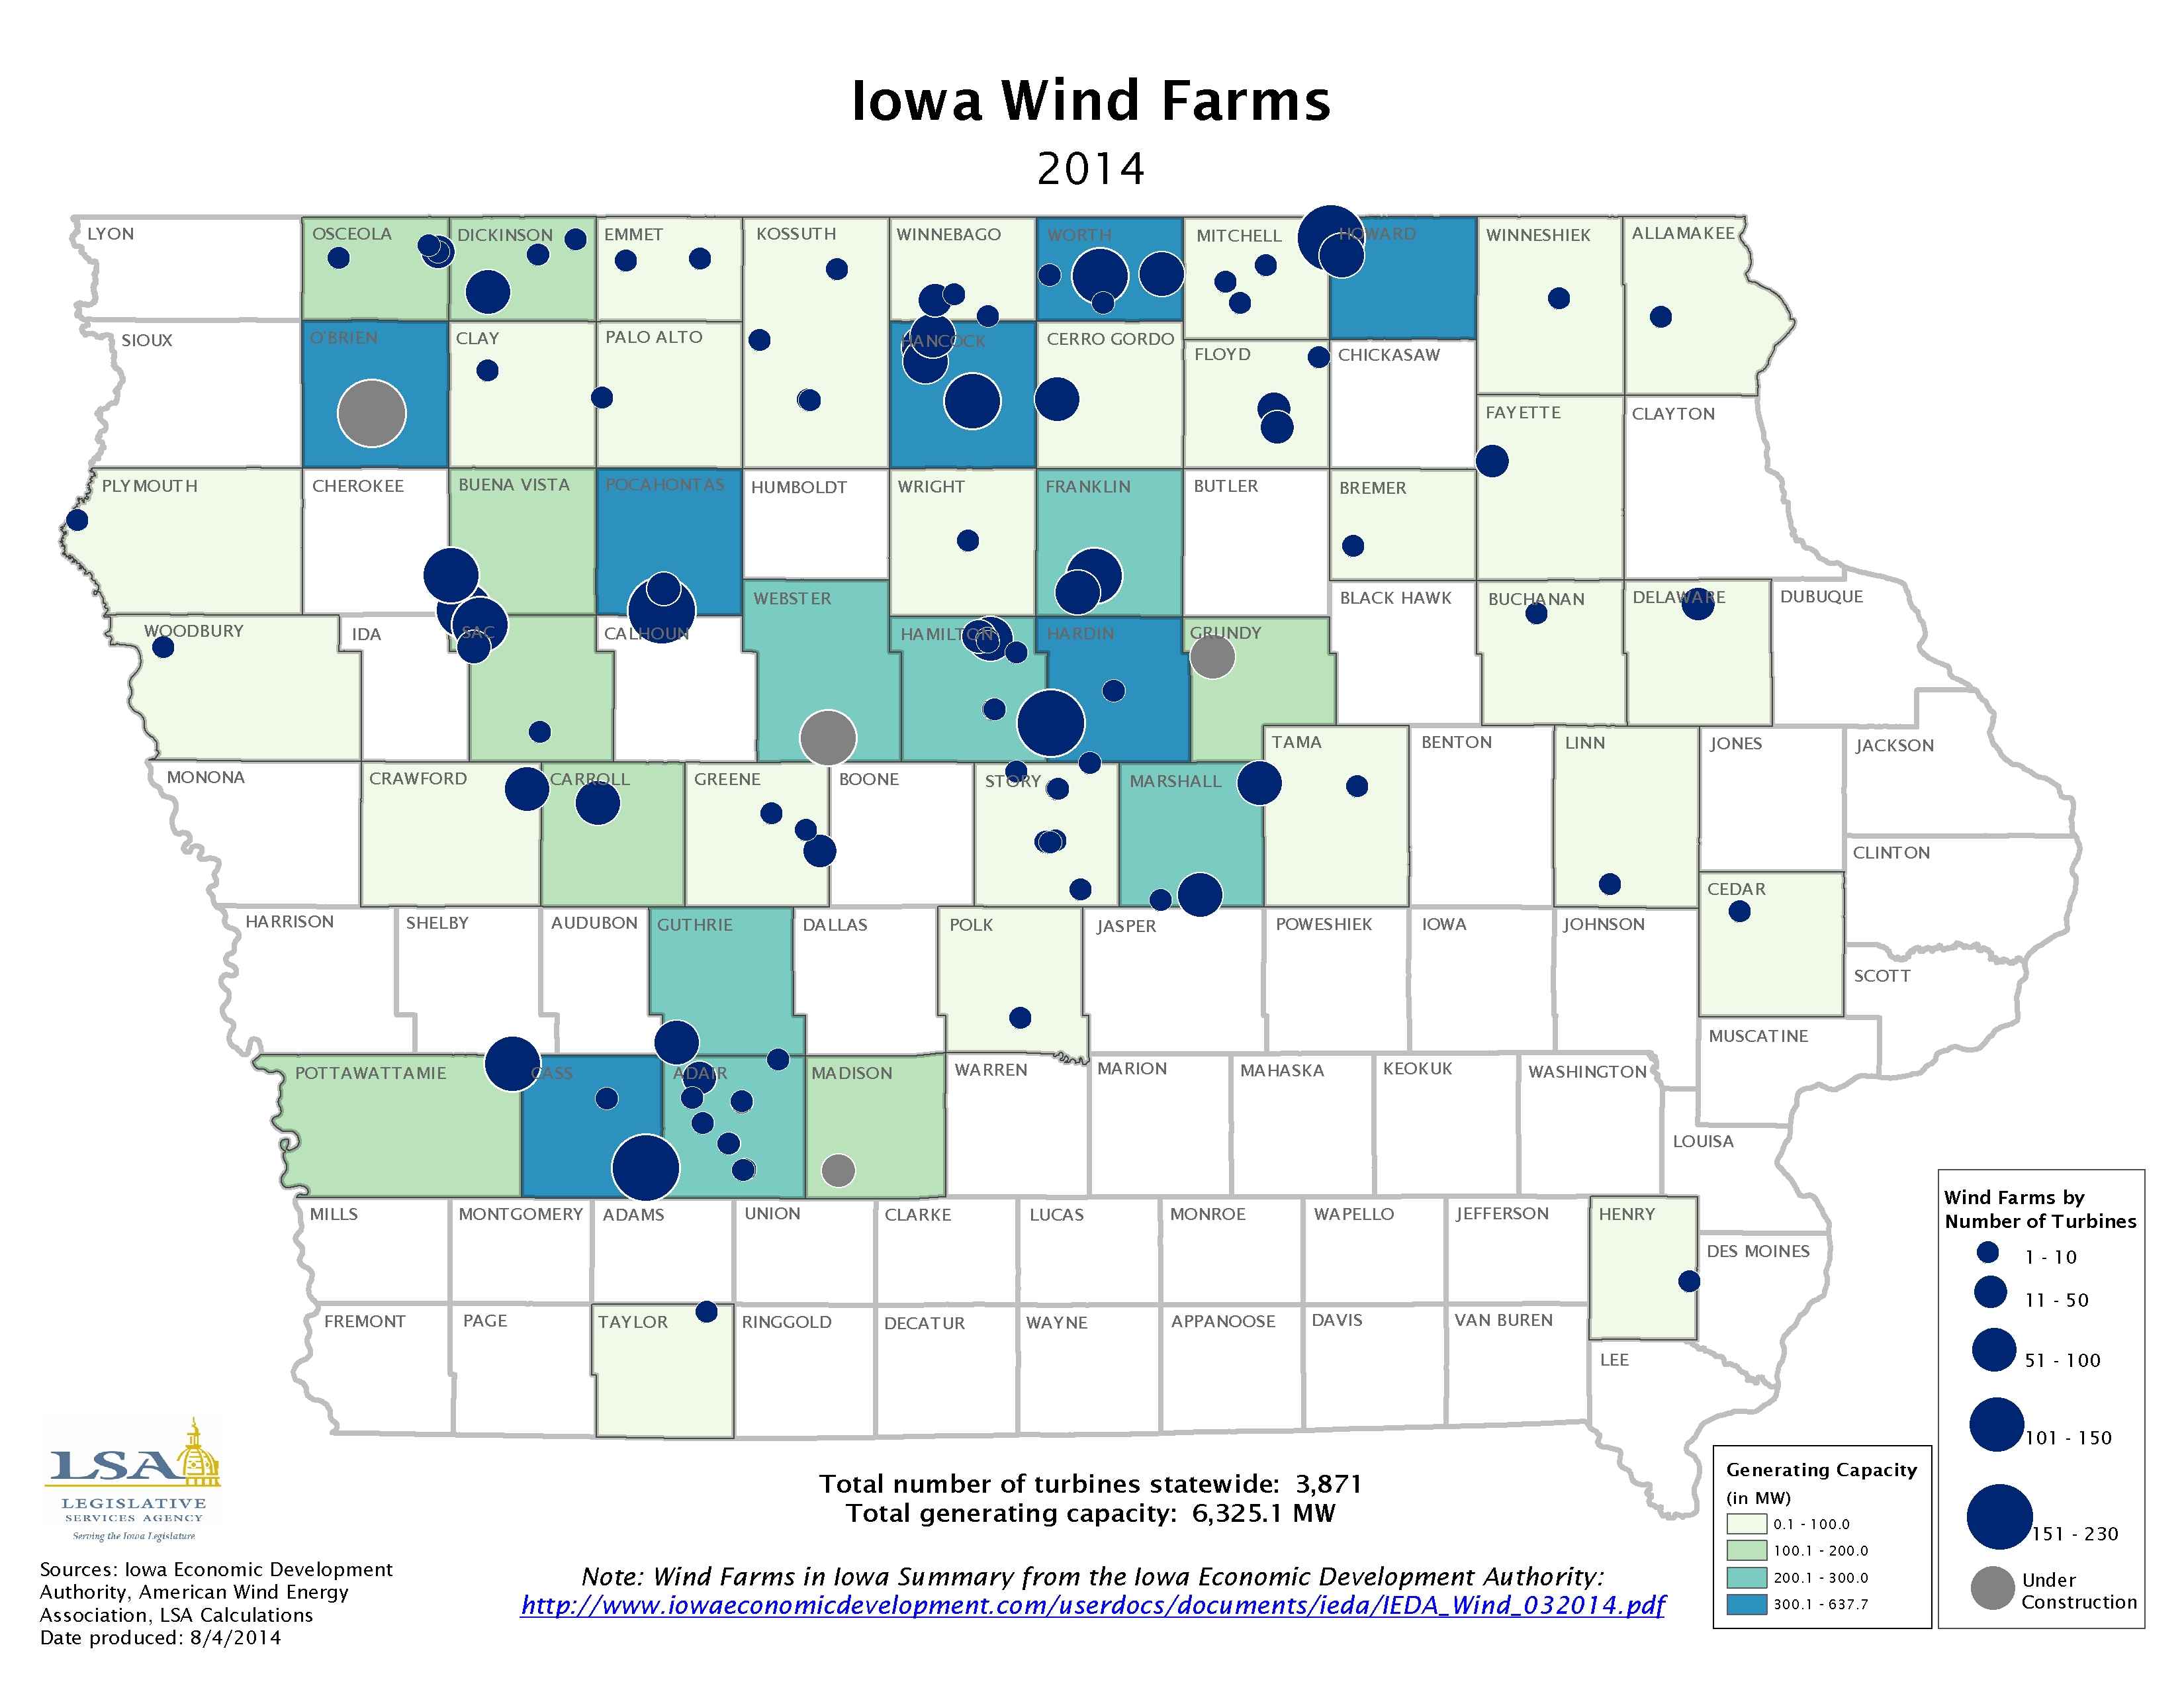
Iowa Wind Farms - 2014
|
|
|
|
|
| 07/28/2014 |
Iowa Insights |
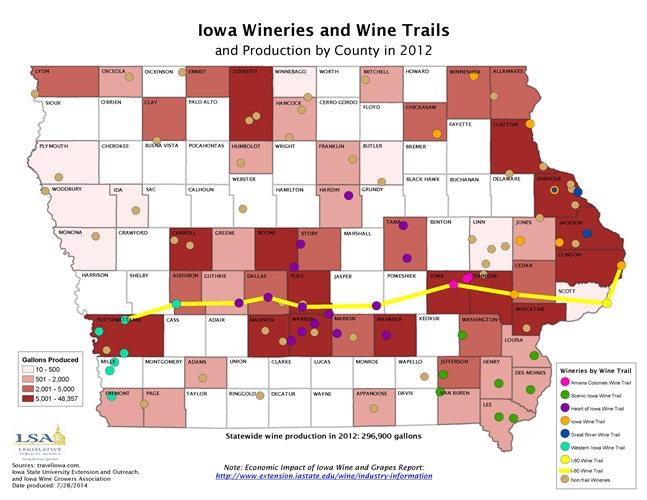
Iowa Wineries and Wine Trails and Production by County - 2012
|
|
|
|
|
| 07/21/2014 |
Iowa Insights |
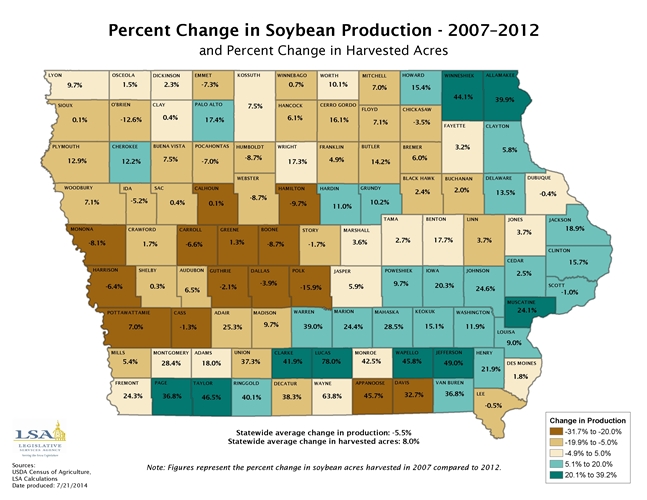
Percent Change in Soybean Production and Percent Change in Harvested Acres - 2007–2012
|
|
|
|
|
| 07/14/2014 |
Iowa Insights |
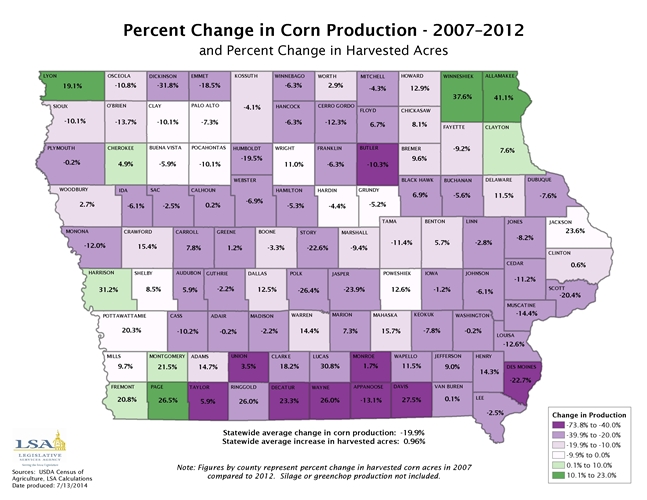
Percent Change in Corn Production and Percent Change in Harvested Acres, 2007–2012
|
|
|
|
|
| 07/07/2014 |
Iowa Insights |
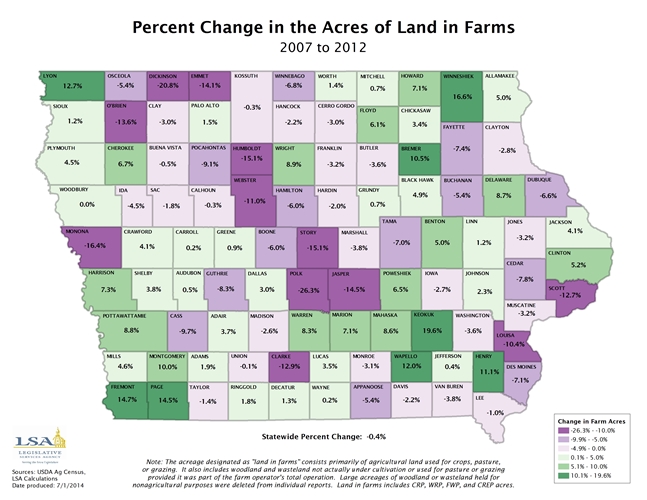
Percent Change in the Acres of Land in Farms
|
|
|
|
|
| 06/30/2014 |
Iowa Insights |
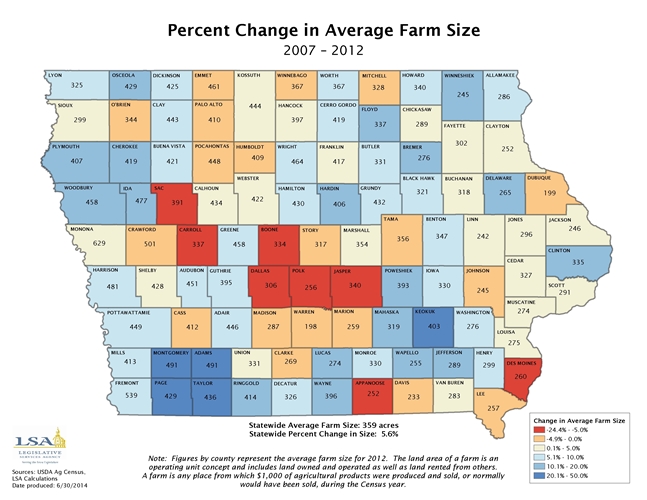
Percent Change in Average Farm Size - 2007 – 2012
|
|
|
|
|
| 06/23/2014 |
Iowa Insights |
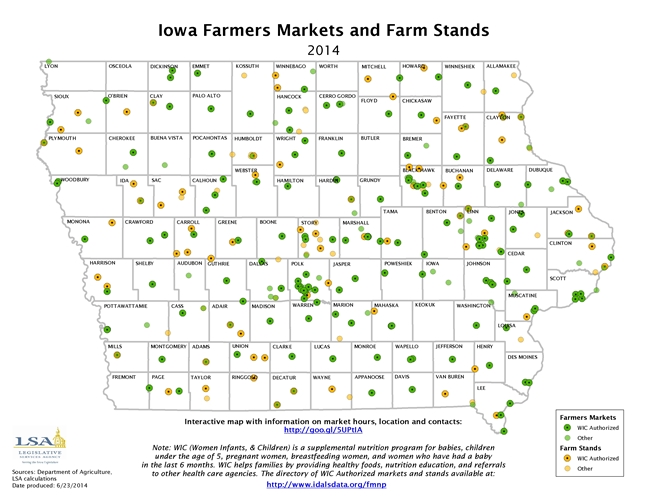
Iowa Farmers Markets and Farm Stands
|
|
|
|
|
| 06/16/2014 |
Iowa Insights |
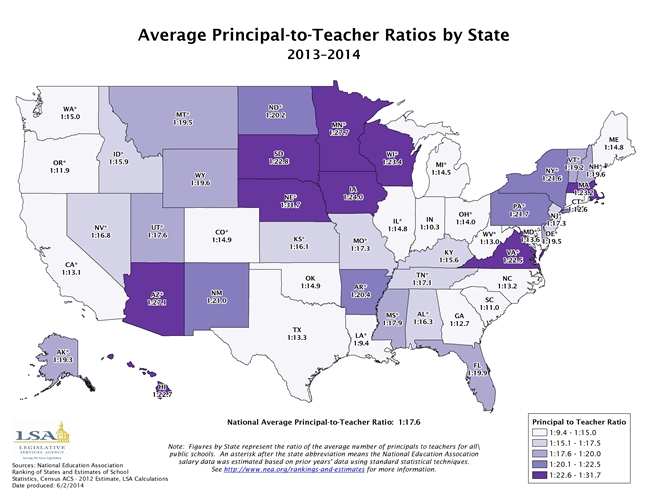
Average Principal-to-Teacher Ratios by State, 2013-2014
|
|
|
|
|
| 06/09/2014 |
Iowa Insights |
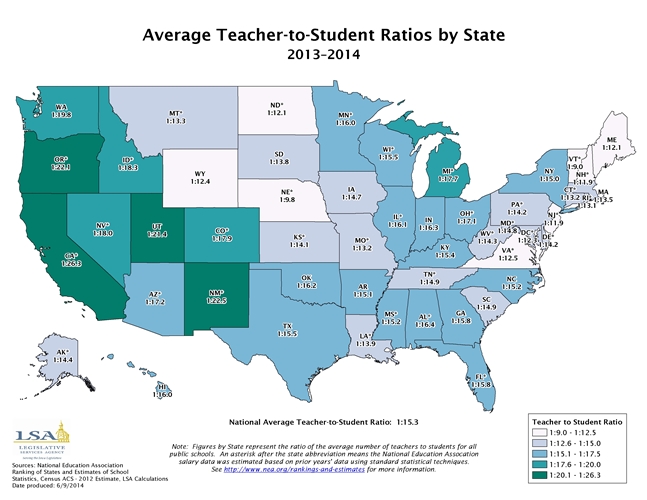
Average Teacher-to-Student Ratios by State - 2013–2014
|
|
|
|
|
| 06/02/2014 |
Iowa Insights |
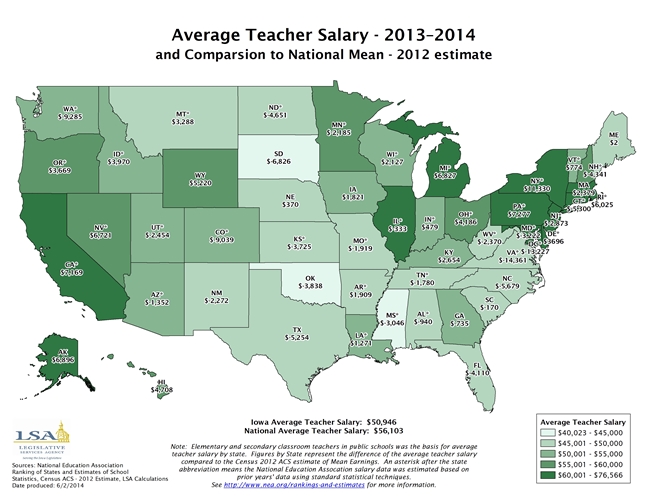
Average Teacher Salary by State - 2013 – 2014
|
|
|
|
|
| 05/27/2014 |
Iowa Insights |
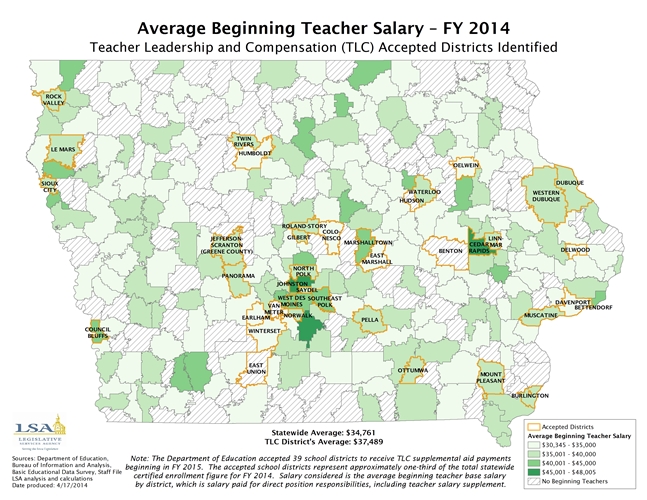
Average Beginning Teacher Salary - FY 2014, Teacher Leadership and Compensation (TLC) Accepted Districts Identified
|
|
|
|
|
| 05/19/2014 |
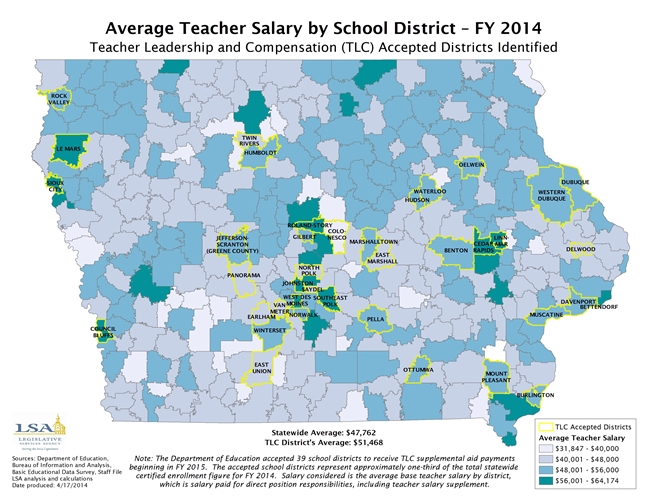
Iowa Insights |
Average Teacher Salary By School District - FY 2014
|
|
|
|
|
| 05/12/2014 |
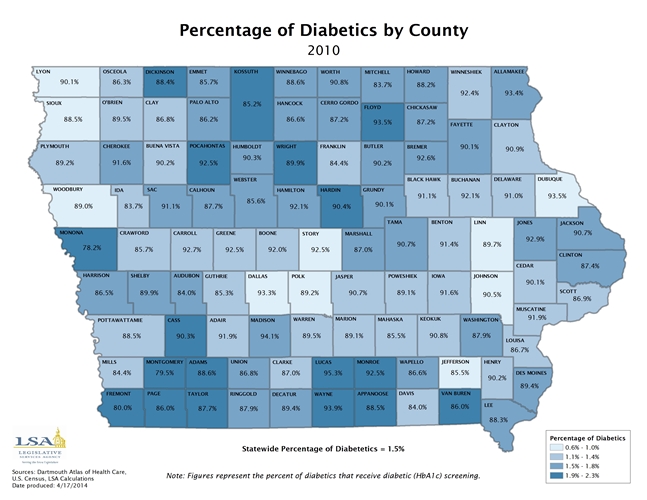
Iowa Insights |
Percentage of Diabetics by County
|
|
|
|
|
| 05/05/2014 |
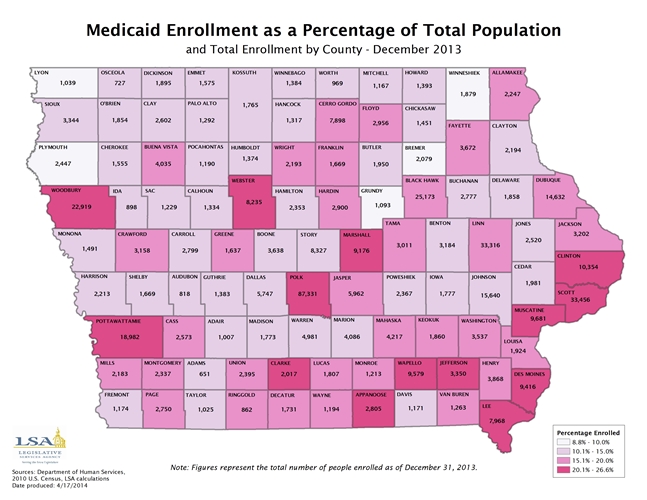
Iowa Insights |
Medicaid Enrollment as a Percentage of Total Population, and Total Enrollment by County - December 2013
|
|
|
|
|
| 04/28/2014 |
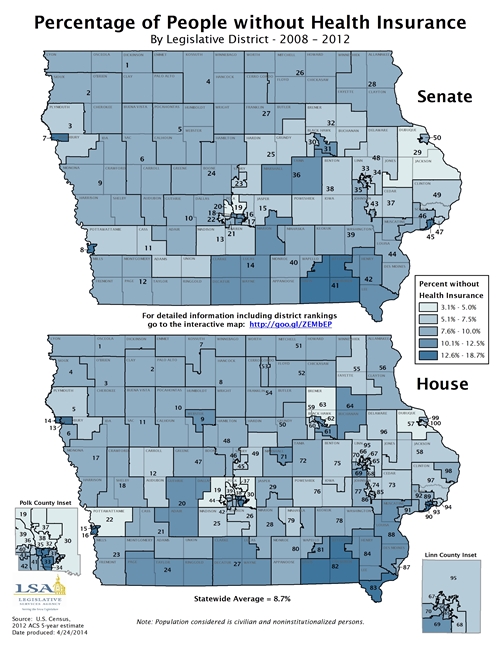
Iowa Insights |
Percentage of People without Health Insurance - By Legislative District - 2008 – 2011
|
|
|
|
|
| 04/17/2014 |
Iowa Insights |
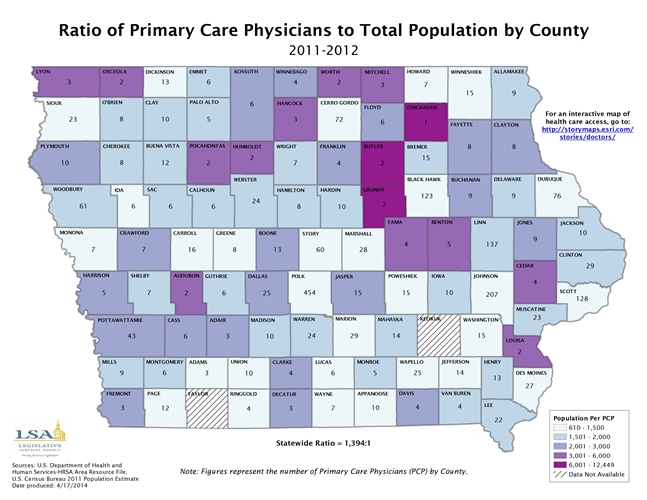
Ratio of Primary Care Physicians to Total Population by County - 2011 – 2012
|
|
|
|
|
| 04/14/2014 |
Iowa Insights |
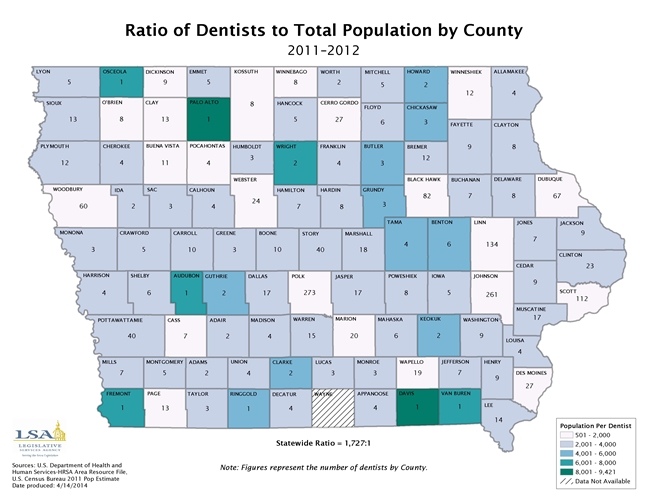
Ratio of Dentists to Total Population by County - 2011 – 2012
|
|
|
|
|
| 04/03/2014 |
Iowa Insights |
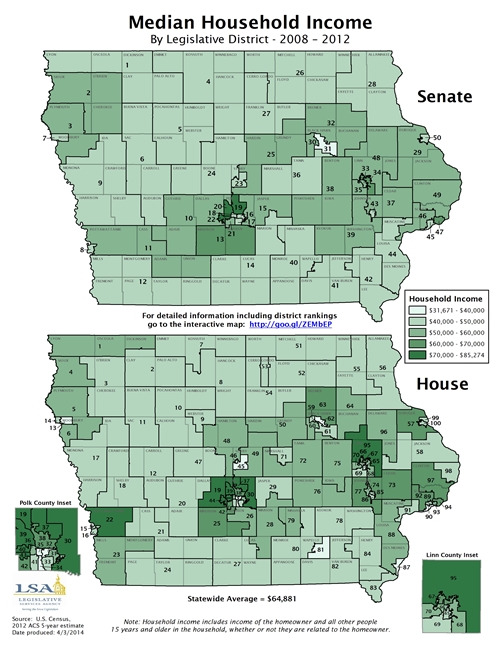
Median Household Income by Legislative District - 2008 – 2012
|
|
|
|
|
| 03/31/2014 |
Iowa Insights |
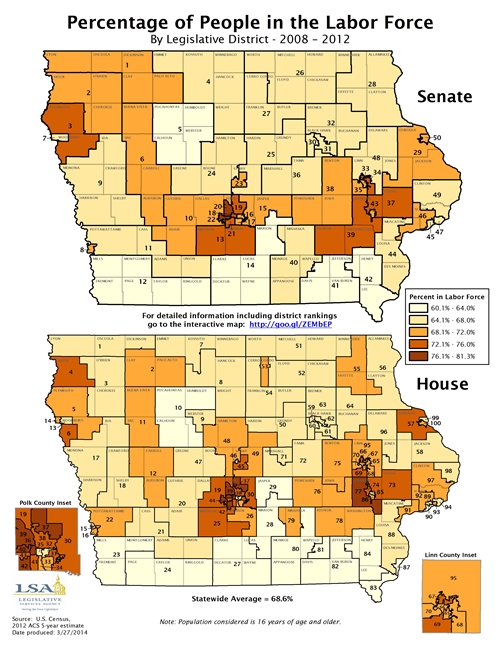
Percentage of People in the Labor Force
|
|
|
|
|
| 03/24/2014 |
Iowa Insights |
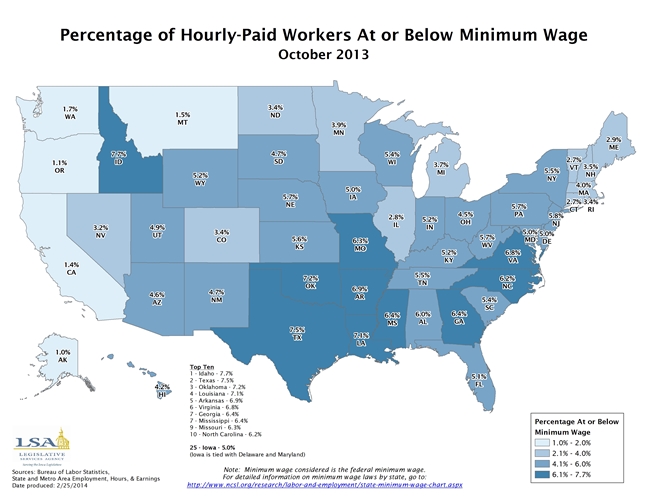
Percentage of Hourly-Paid Workers At or Below Minimum Wage - October 2013
|
|
|
|
|
| 03/17/2014 |
Iowa Insights |
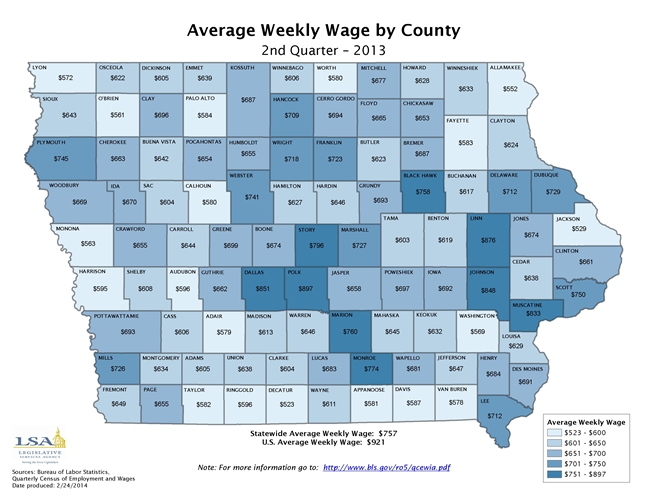
Average Weekly Wage by County - 2nd Quarter - 2013
|
|
|
|
|
| 03/10/2014 |
Iowa Insights |
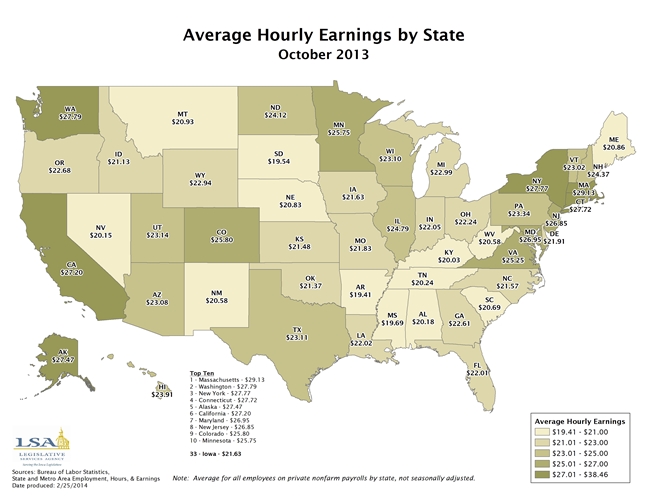
Average Hourly Earnings by State - October 2013
|
|
|
|
|
| 03/03/2014 |
Iowa Insights |
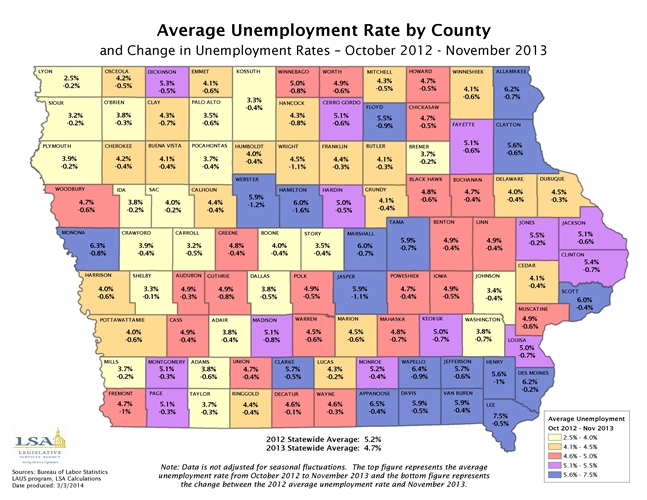
Average Unemployment Rate by County
|
|
|
|
|
| 02/24/2014 |
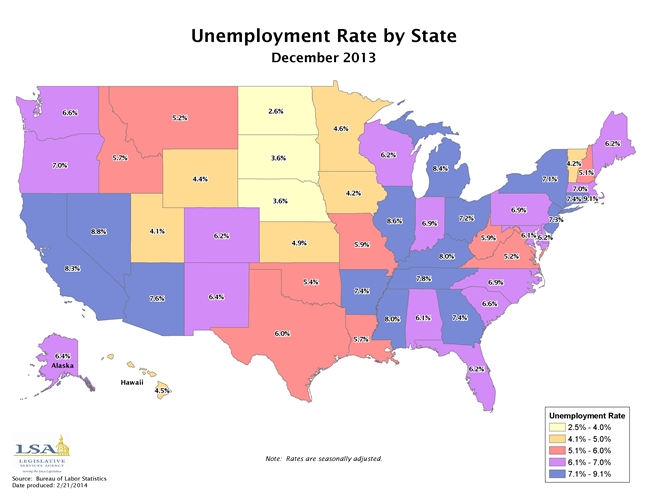
Iowa Insights |
Unemployment Rate by State - December 2013
|
|
|
|
|
| 02/17/2014 |
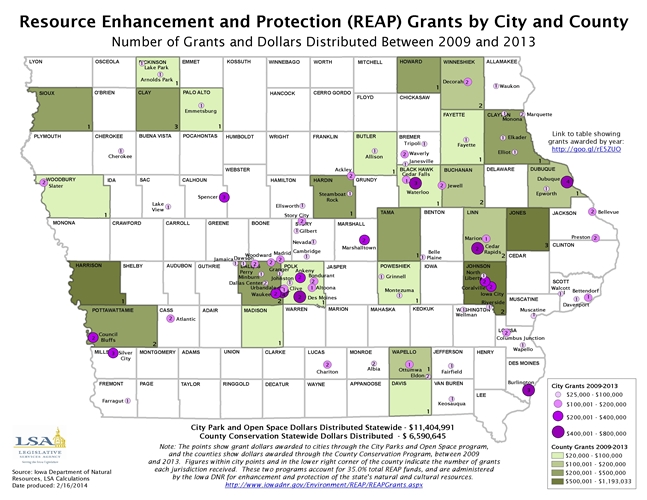
Iowa Insights |
REAP Grants by City and County
|
|
|
|
|
| 02/10/2014 |
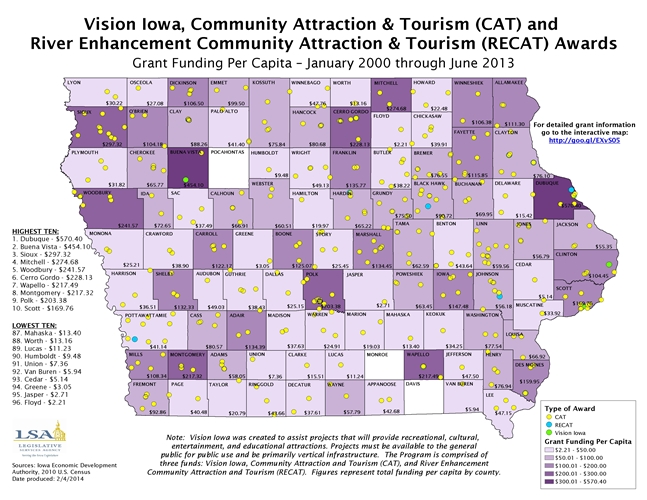
Iowa Insights |
Vision Iowa, CAT, and RECAT Awards
|
|
|
|
|
| 02/03/2014 |
Iowa Insights |
Local Housing Trust Fund Program - Amounts Expended

|
|
|
|
|
| 01/27/2014 |
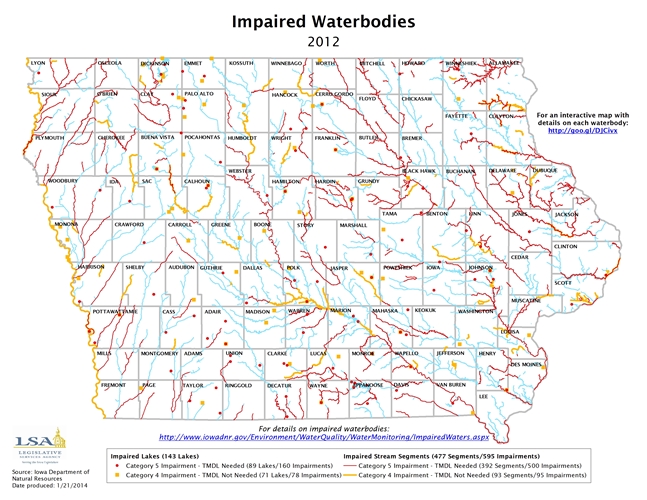
Iowa Insights |
Impaired Waterbodies
|
|
|
|
|
| 01/20/2014 |
Iowa Insights |
Energy Consumption Per Capita by State

|
|
|
|
|
| 01/13/2014 |
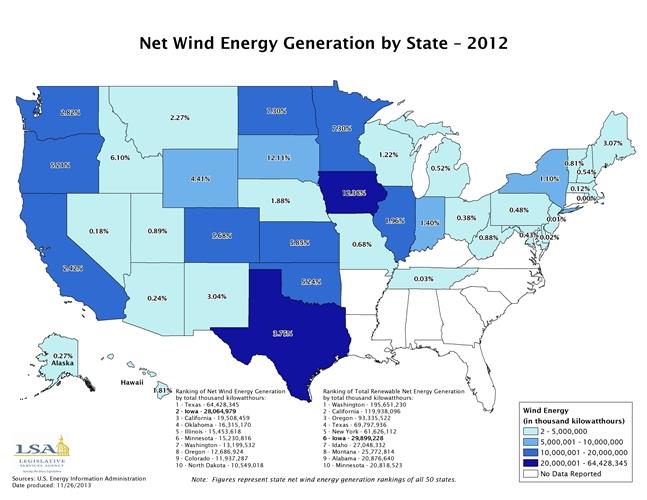
Iowa Insights |
Net Wind Energy Generation by State
|
|
|
|
|
| 01/06/2014 |
Iowa Insights |
Ethanol Operating Capacity by State

|
|
|
|
|
| 12/30/2013 |
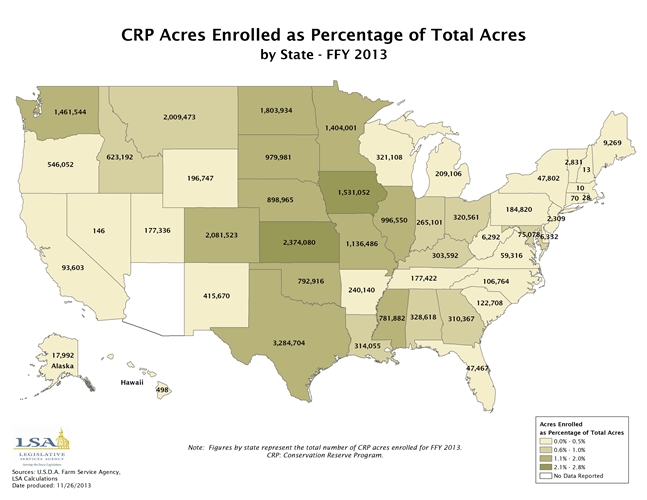
Iowa Insights |
CRP Acres Enrolled as Percentage of Total Acres by State
|
|
|
|
|
| 12/16/2013 |
Iowa Insights |
Acres Enrolled in the Conservation Reserve Program (CRP)

|
|
|
|
|
| 12/09/2013 |
Iowa Insights |
Average Farmland Value Per Acre by County - 2012

|
|
|
|
|
| 12/02/2013 |
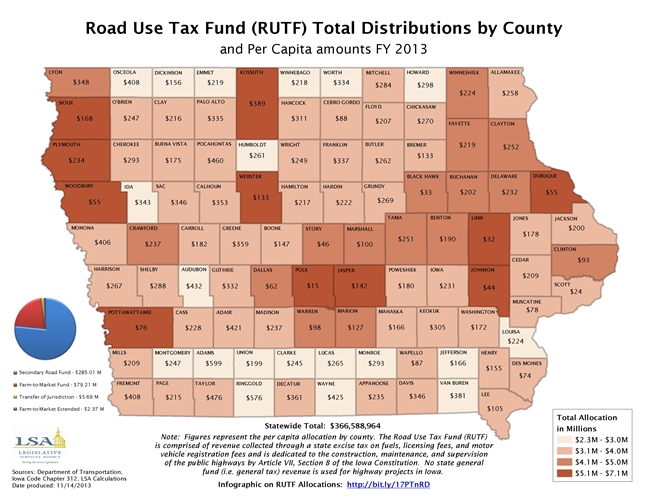
Iowa Insights |
Road Use Tax Fund (RUTF) Total Distributions by County
|
|
|
|
|
| 11/25/2013 |
Iowa Insights |
County Road Fund Expenditures by Category and Total Per Capita Expenditures

|
|
|
|
|
| 11/18/2013 |
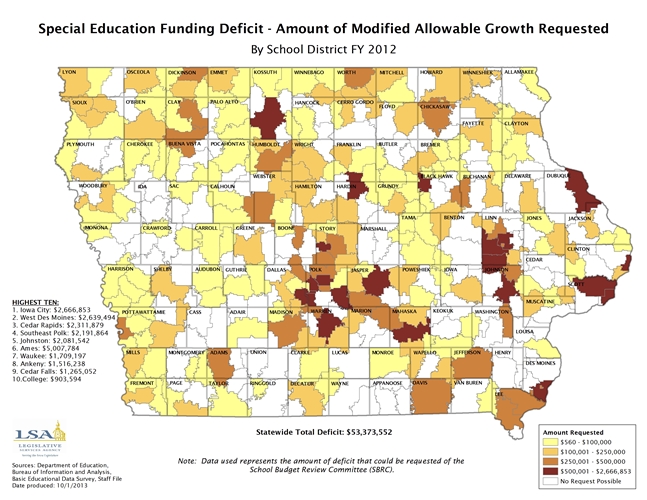
Iowa Insights |
Special Education Funding Deficit - Amount of Modified Allowable Growth Requested
|
|
|
|
|
| 11/11/2013 |
Iowa Insights |
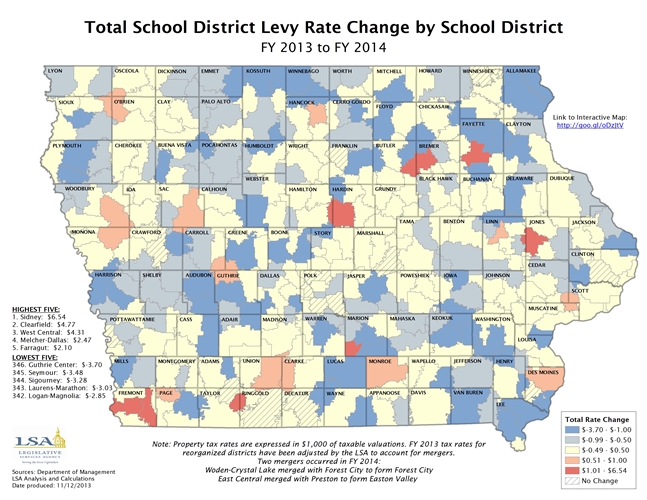
Total School District Levy Rate Change by School District
|
|
|
|
|
| 11/04/2013 |
Iowa Insights |
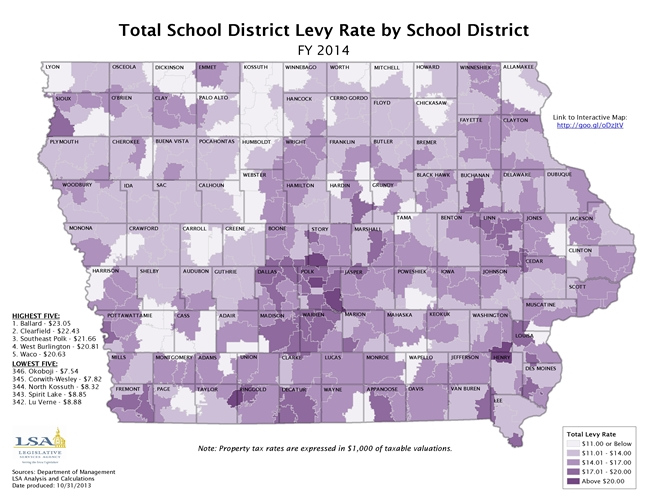
Total School District Levy Rate by School District
|
|
|
|
|
| 10/28/2013 |
Iowa Insights |
TIF Valuation as a Percentage of Total Valuation by School District

|
|
|
|
|
| 10/21/2013 |
Iowa Insights |
Total Property Tax Relief Aid - Rate Reduction by School District

|
|
|
|
|
| 10/14/2013 |
Iowa Insights |
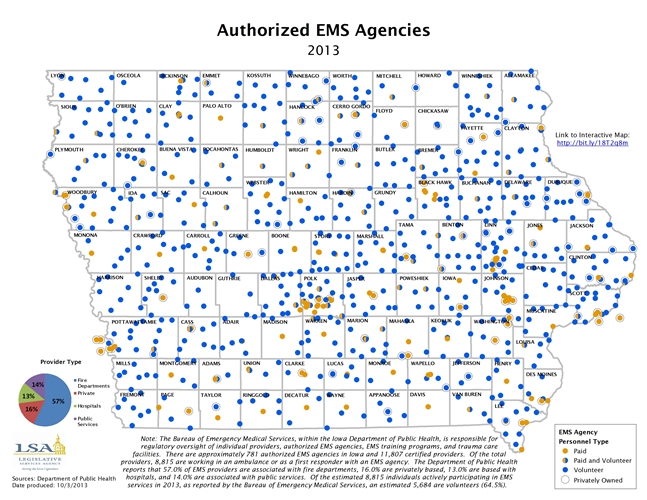
Authorized EMS Agencies
|
|
|
|
|
| 10/07/2013 |
Iowa Insights |
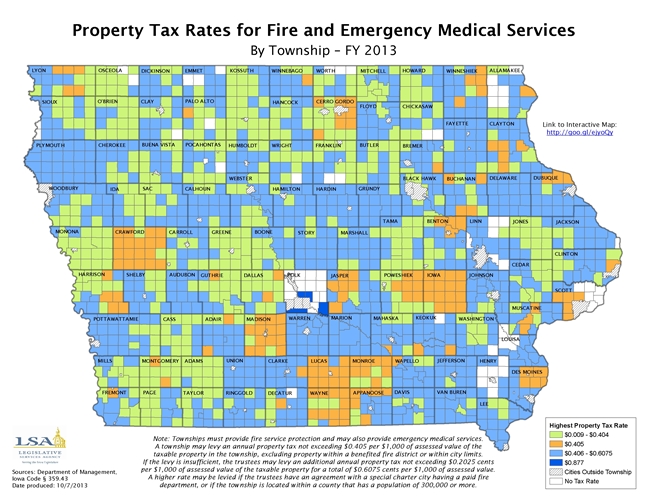
Property Tax Rates for Fire and Emergency Medical Services
|
|
|
|
|
| 09/30/2013 |
Iowa Insights |
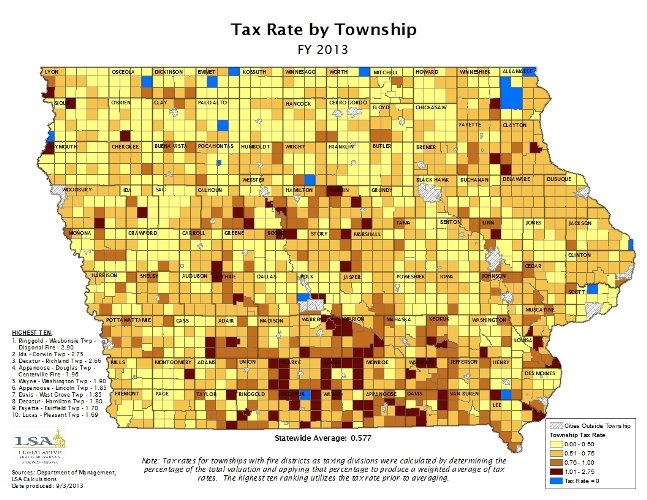
Tax Rate by Township
|
|
|
|
|
| 09/23/2013 |
Iowa Insights |
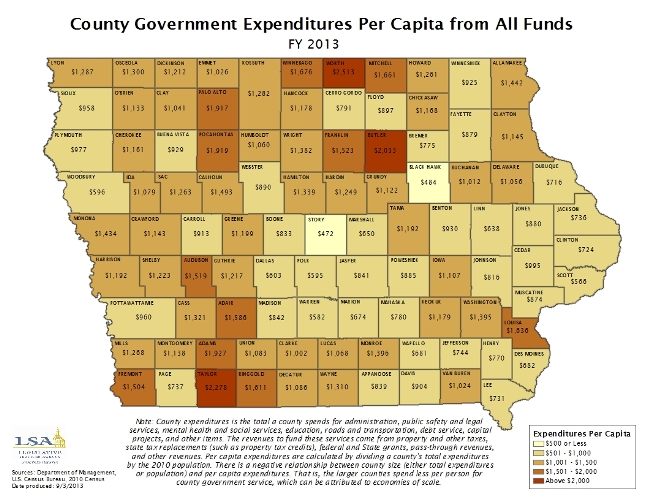
County Government Per Capita Expenditures From All Funds
|
|
|
|
|
| 09/16/2013 |
Iowa Insights |
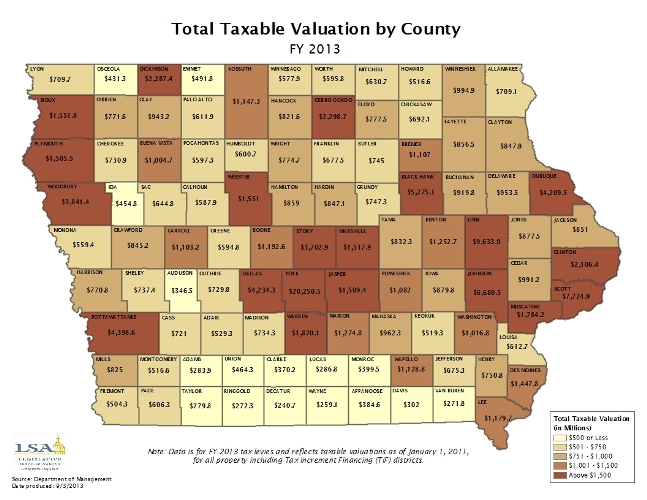
Total Taxable Valuation by County
|
|
|
|
|
| 09/09/2013 |
Iowa Insights |
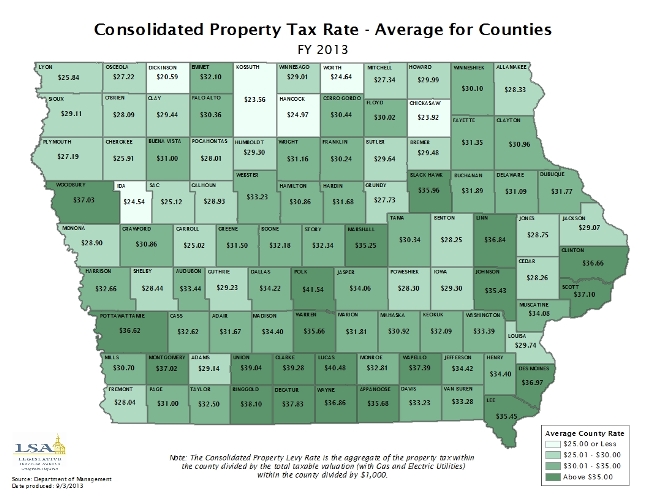
Consolidated Property Tax Rate - Average for Counties
|
|
|
|
|
| 09/02/2013 |
Iowa Insights |
Community College Success Rates

|
|
|
|
|
| 08/26/2013 |
Iowa Insights |
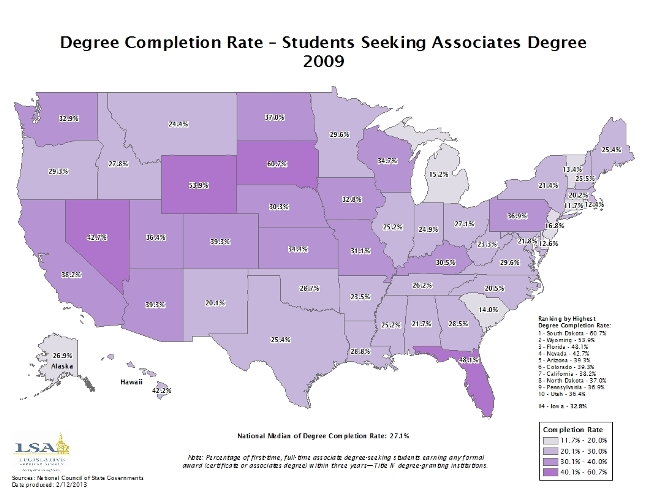
Degree Completion Rate - Students Seeking Associates Degree
|
|
|
|
|
| 08/19/2013 |
Iowa Insights |
Regents Six-Year Graduation Rates for Entering Classes of 1988-2005

|
|
|
|
|
| 08/12/2013 |
Iowa Insights |
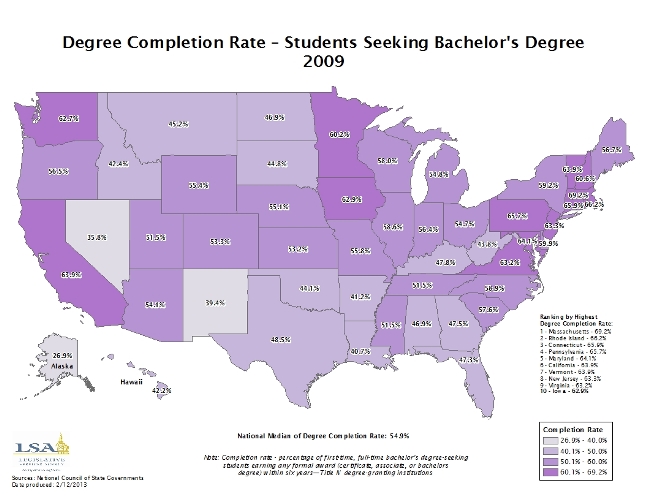
Degree Completion Rate - Students Seeking Bachelors Degree
|
|
|
|
|
| 08/05/2013 |
Iowa Insights |
Regents One-Year Retention Rates for Entering Classes of 1988-2010

|
|
|
|
|
| 07/29/2013 |
Iowa Insights |
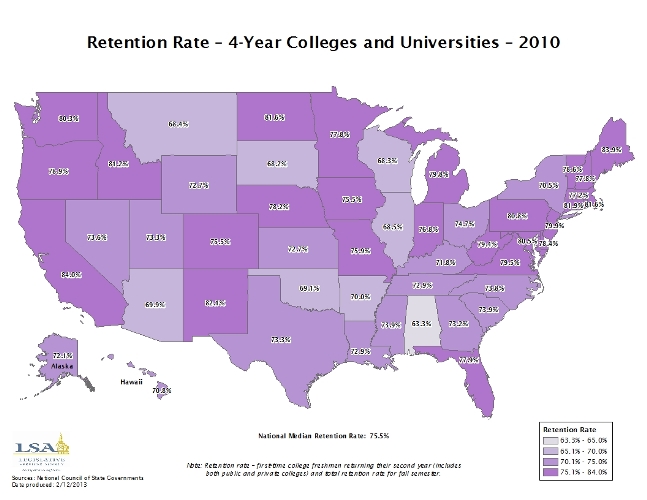
Retention Rate - 4-Year Colleges and Universities
|
|
|
|
|
| 07/22/2013 |
Iowa Insights |
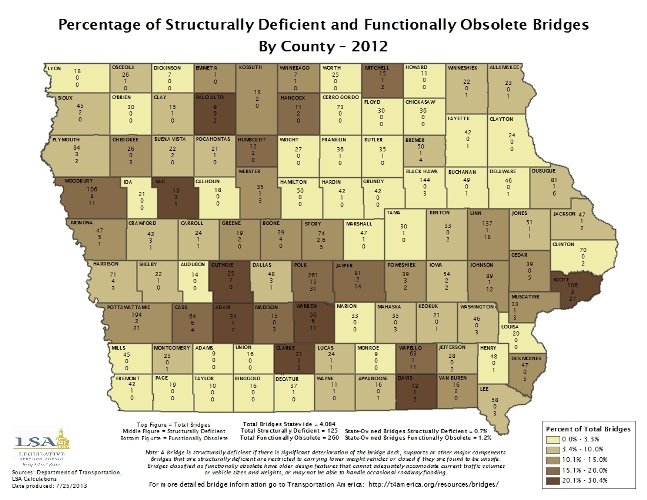
Percentage of Structurally Deficient and Functionally Obsolete Bridges
|
|
|
|
|
| 07/15/2013 |
Iowa Insights |
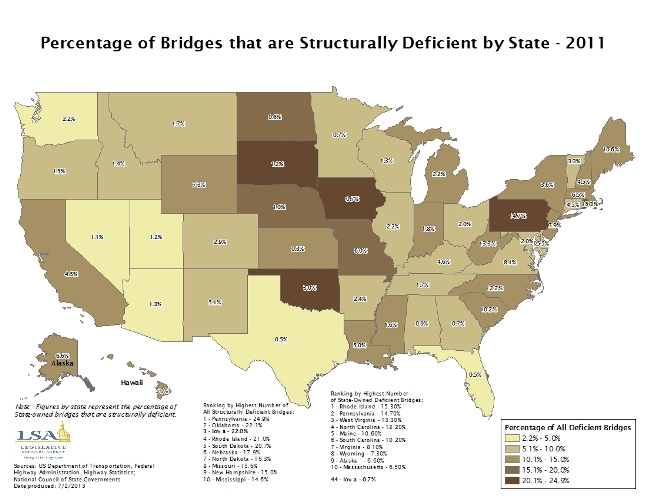
Percentage of Bridges that are Structurally Deficient by State
|
|
|
|
|
| 07/08/2013 |
Iowa Insights |
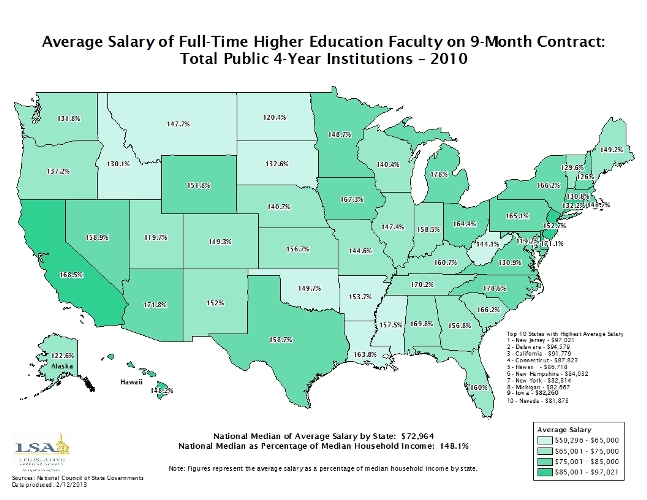
Average Salary of Full-Time Higher Education Faculty on 9-month Contract
|
|
|
|
|
| 07/01/2013 |
Iowa Insights |
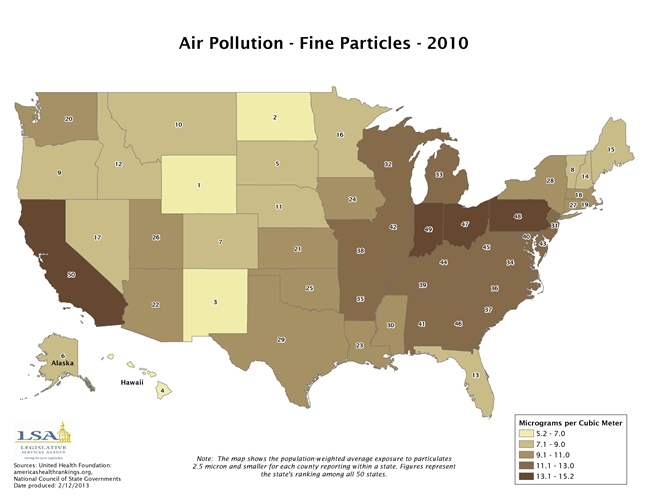
Air Pollution by State
|
|
|
|
|
| 06/24/2013 |
Iowa Insights |
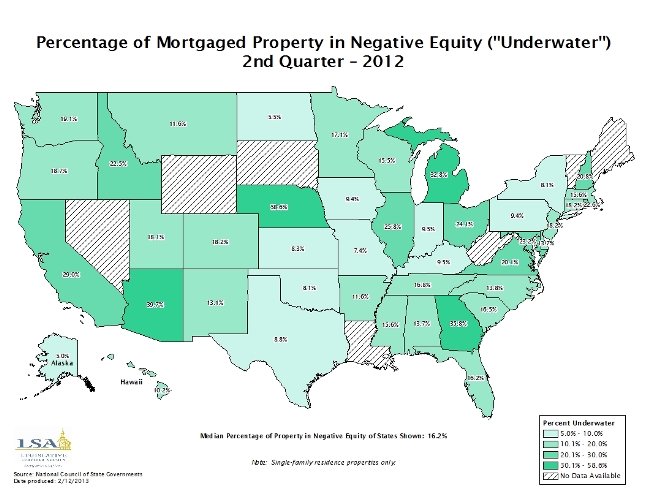
Percentage of Mortgaged Property in Negative Equity
|
|
|
|
|
| 06/17/2013 |
Iowa Insights |
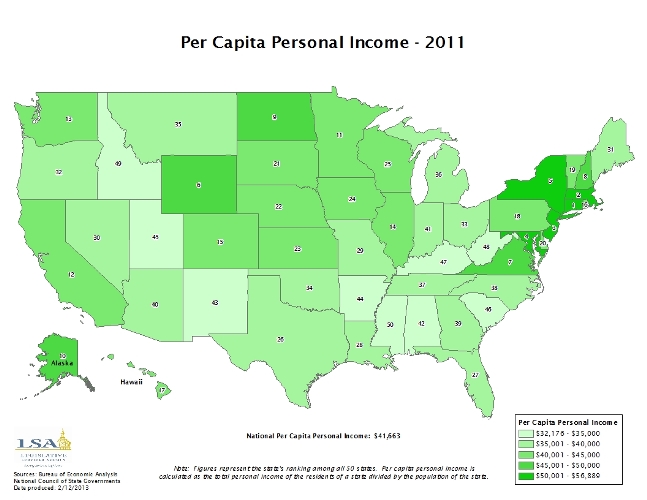
Per Capita Personal Income
|
|
|
|
|
| 06/10/2013 |
Iowa Insights |
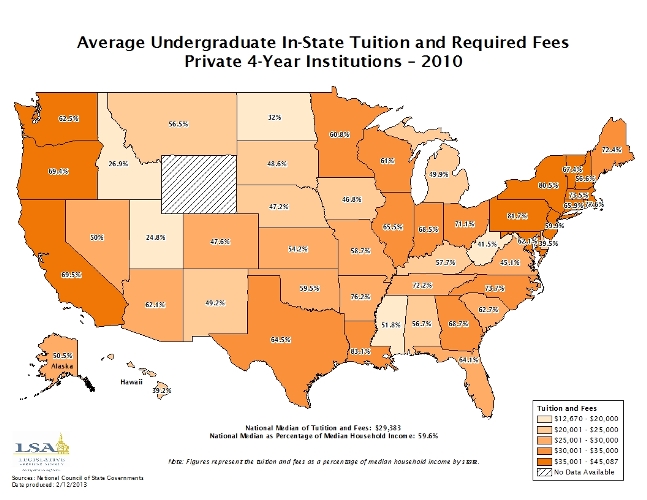
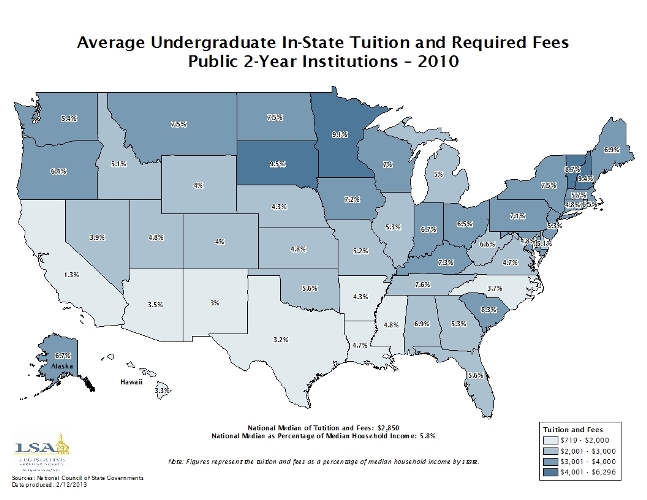
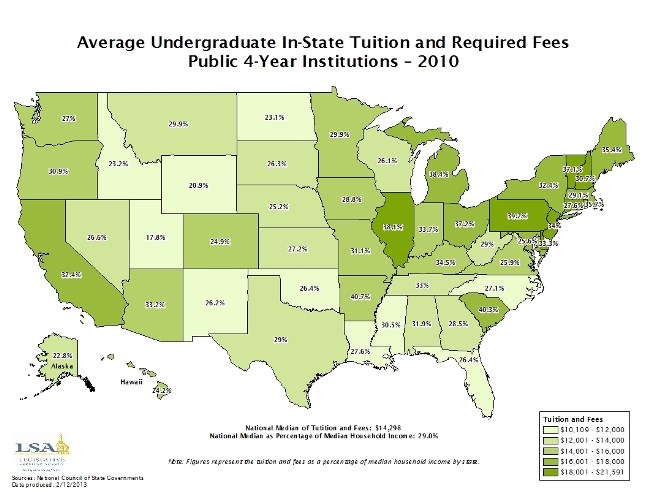
Average Undergraduate In-State Tuition and Required Fees
|
|
|
|
|
| 06/03/2013 |
Iowa Insights |
Average Undergraduate In-State Tuition and Required Fees
|
|
|
|
|
| 05/27/2013 |
Iowa Insights |
Average Undergraduate In-State Tuition and Required Fees
|
|
|
|
|
| 05/20/2013 |
Iowa Insights |
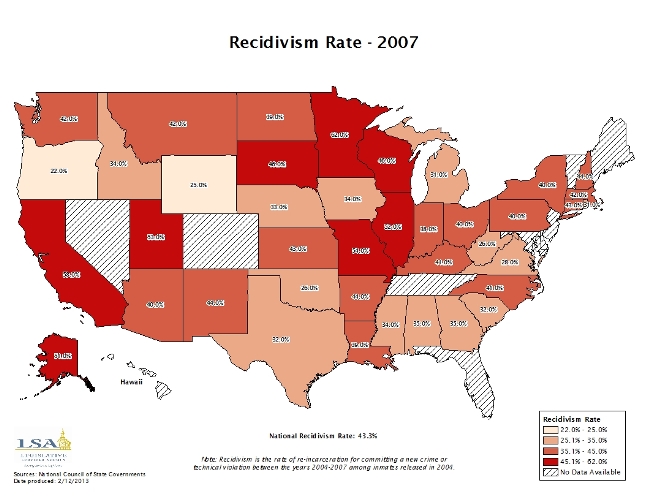
Recidivism Rate
|
|
|
|
|
| 05/13/2013 |
Iowa Insights |
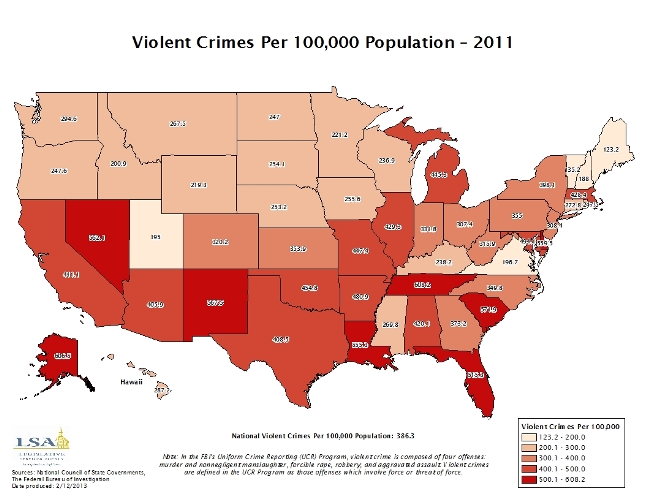
Violent Crimes Per 100,000 Population
|
|
|
|
|
| 05/06/2013 |
Iowa Insights |
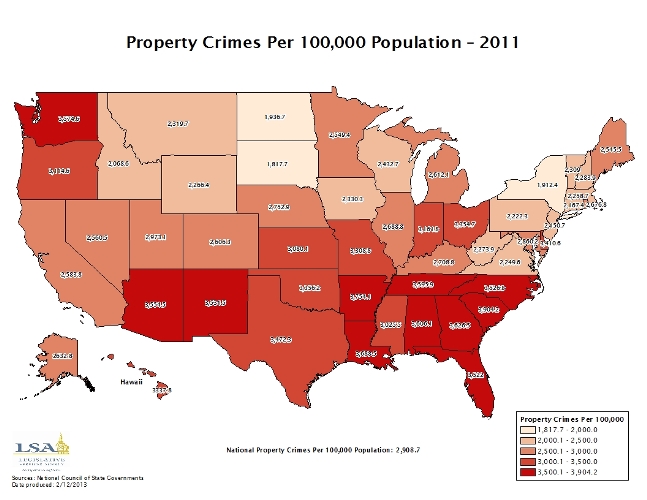
Property Crimes Per 100,000 Population
|
|
|
|
|
| 04/29/2013 |
Iowa Insights |
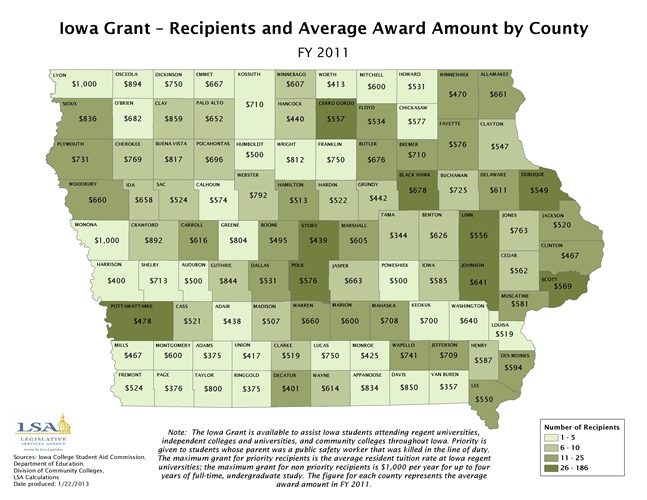
Iowa Grant
|
|
|
|
|
| 04/22/2013 |
Iowa Insights |
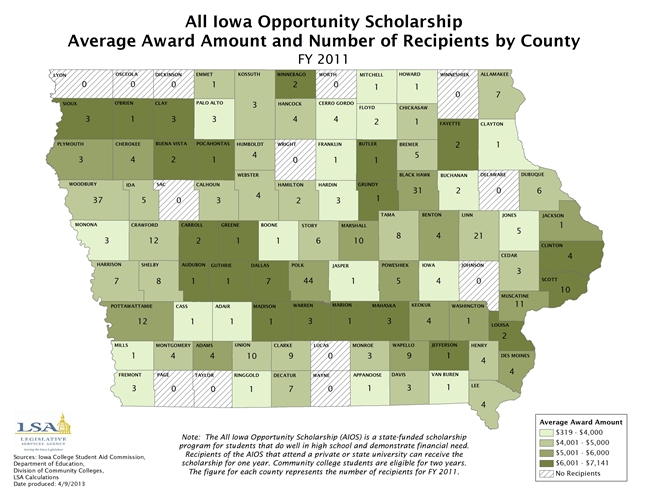
All Iowa Opportunity Scholarship
|
|
|
|
|
| 04/15/2013 |
Iowa Insights |
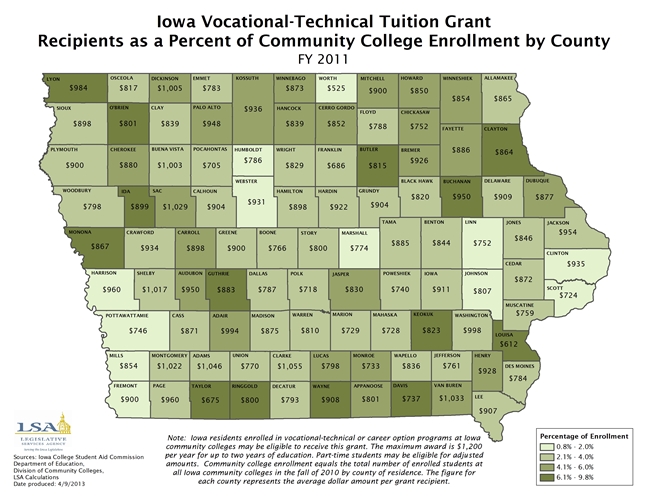
Iowa Vocational-Technical Tuition Grant
|
|
|
|
|
| 04/08/2013 |
Iowa Insights |
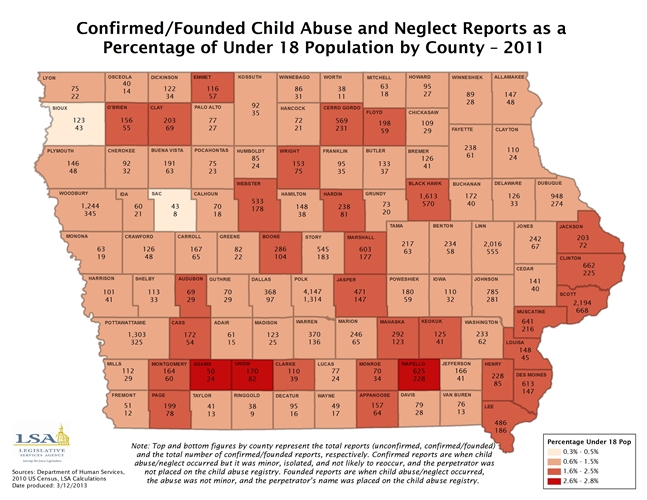
Confirmed or Founded Child Abuse and Neglect Reports
|
|
|
|
|
| 04/01/2013 |
Iowa Insights |
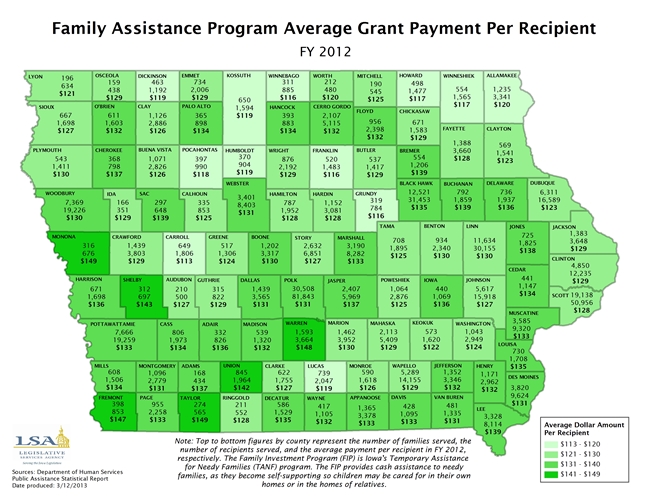
Family Assistance Program Average Grant Payment Per Recipient
|
|
|
|
|
| 03/25/2013 |
Iowa Insights |
Percentage Change in Average Number of Food Assistance Recipients by County

|
|
|
|
|
| 03/18/2013 |
Iowa Insights |
Average Number of Recipients Served in the Food Assistance Program
|
|
|
|
|
| 03/11/2013 |
Iowa Insights |
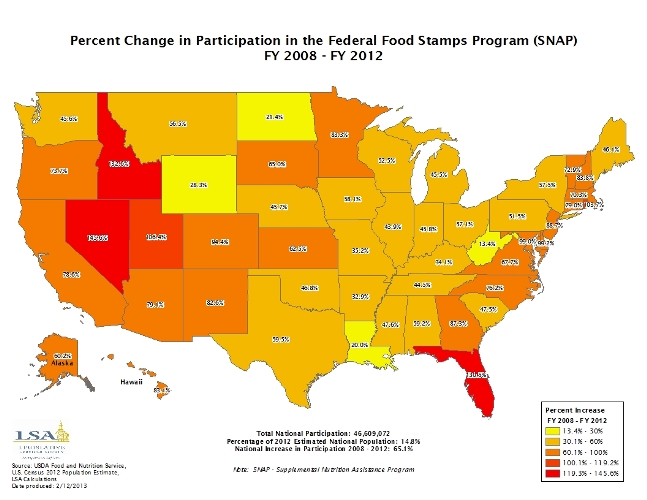
Percent Change in Participation in the Federal Food Stamps Program (SNAP)
|
|
|
|
|
| 03/04/2013 |
Iowa Insights |
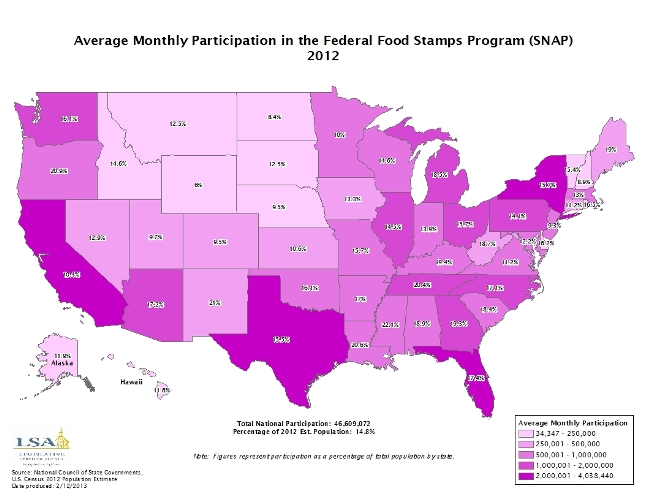
Average Montly Participation in the Federal Food Stamps Program (SNAP)
|
|
|
|
|
| 02/25/2013 |
Iowa Insights |
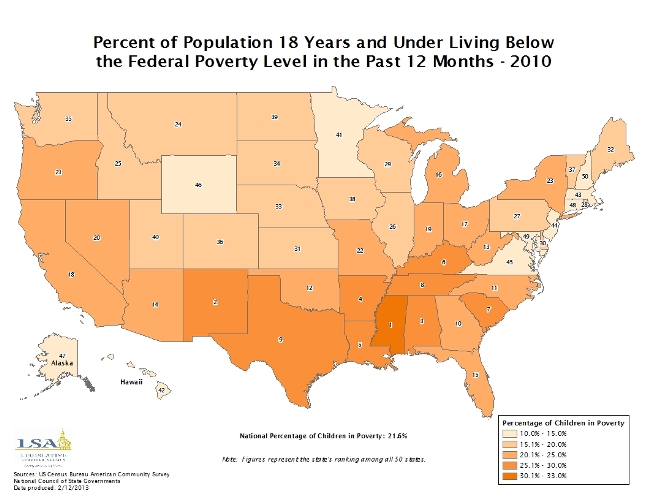
Percent of Population 18 Years and Under Living Below the Federal Poverty Level in the Past 12 Months
|
|
|
|
|
| 02/18/2013 |
Iowa Insights |
Percent of Age 0-5 Population with Family Income Below 185% of Poverty Level

|
|
|
|
|
| 02/11/2013 |
Iowa Insights |
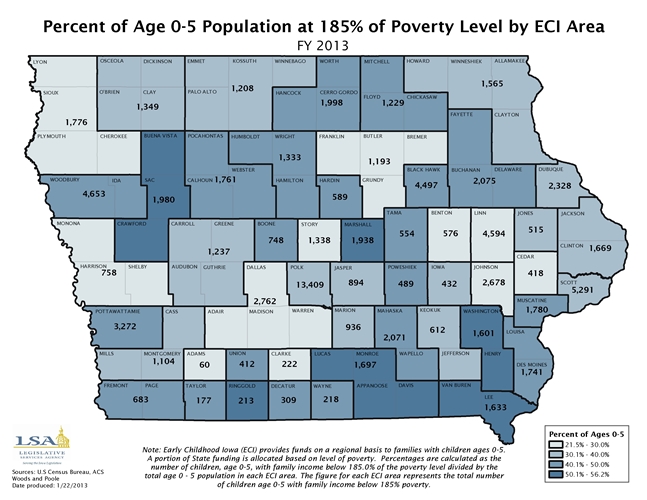
Percent of Age 0-5 Population at 185% of Poverty Level by ECI Area
|
|
|
|
|
| 02/04/2013 |
Iowa Insights |
Early Childhood Iowa – Changes in State Funding

|
|
|
|
|
| 01/28/2013 |
Iowa Insights |
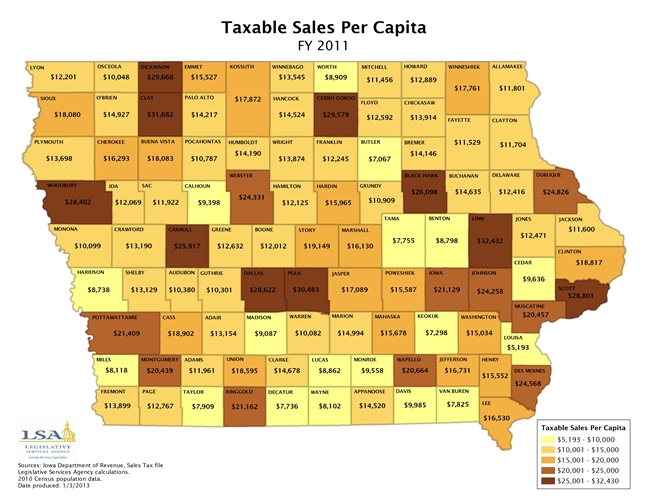
Taxable Sales Per Capita
|
|
|
|
|
| 01/21/2013 |
Iowa Insights |
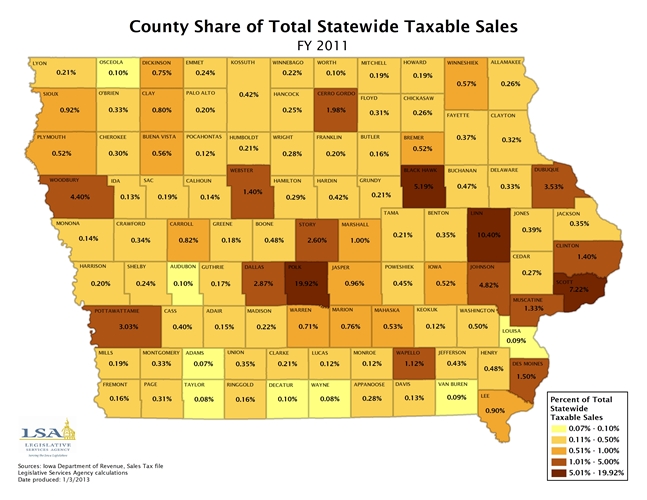
County Share of Total Statewide Taxable Sales
|
|
|
|
|
| 01/14/2013 |
Iowa Insights |
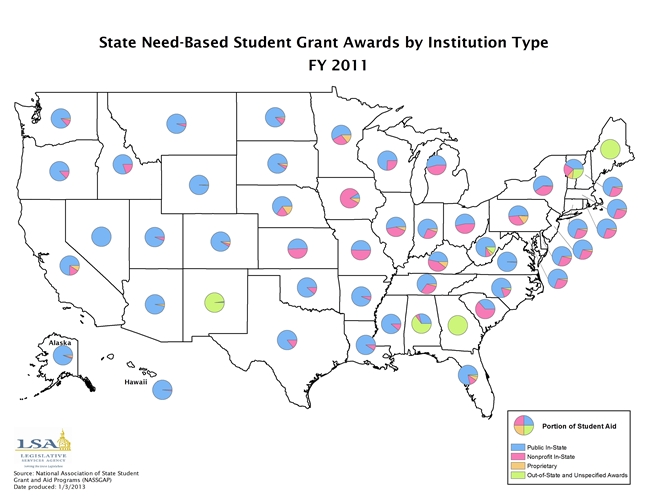
State Need-Based Student Grant Awards by Institution Type
|
|
|
|
|
| 01/07/2013 |
Iowa Insights |
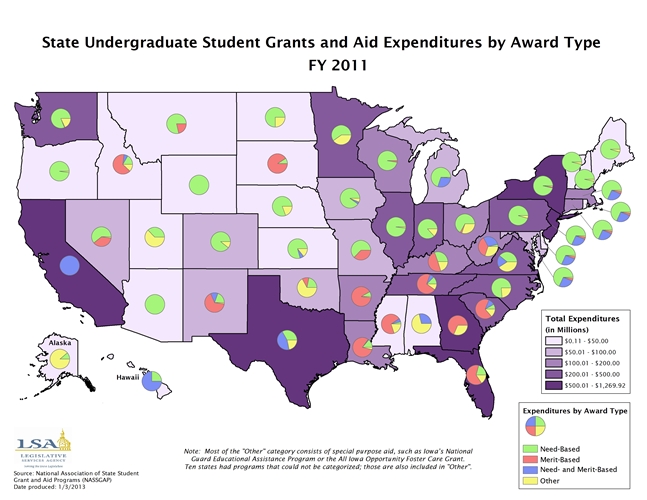
State Undergraduate Student Grants and Aid Expenditures by Award Type
|
|
|
|
|
| 12/31/2012 |
Iowa Insights |
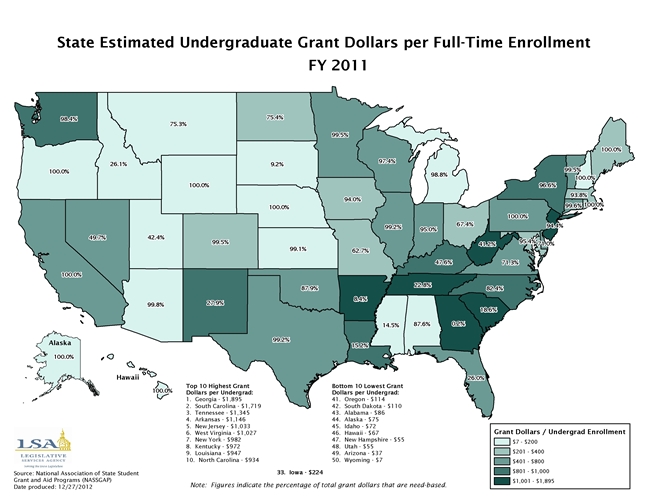
State Estimated Undergraduate Grant Dollars per Full-Time Enrollment
|
|
|
|
|
| 12/24/2012 |
Iowa Insights |
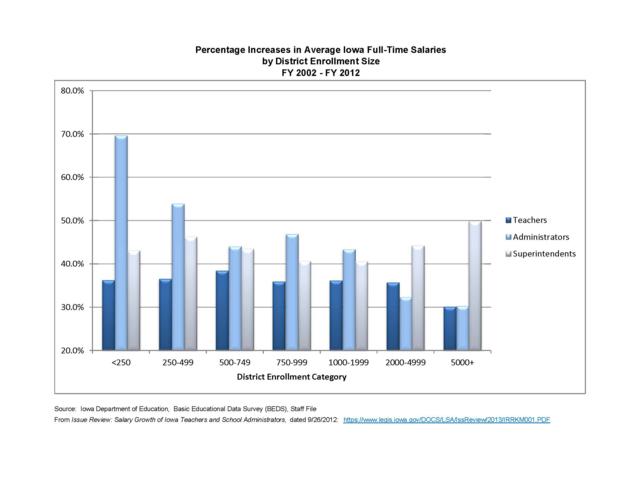
Percentage Increases in Average Iowa Full-Time Salaries by District Enrollment Size
|
|
|
|
|
| 12/17/2012 |
Iowa Insights |
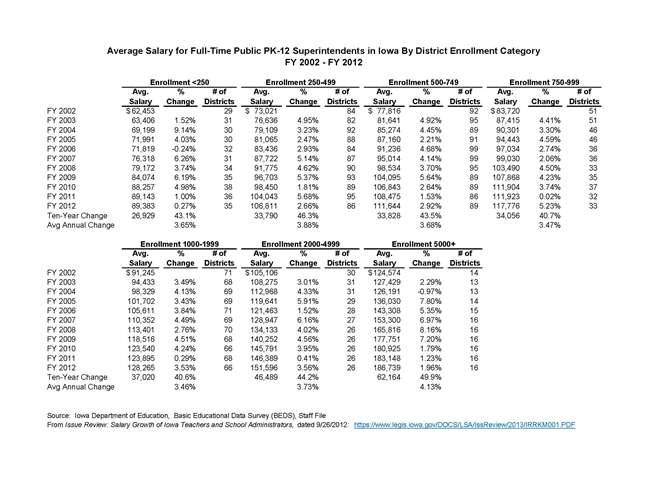
Average Salary for Full-Time PK-12 Superintendents in Iowa by District Enrollment Category
|
|
|
|
|
| 12/10/2012 |
Iowa Insights |
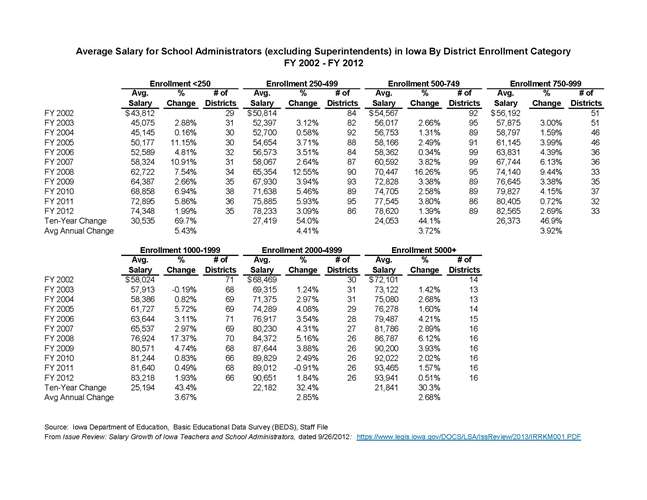
Average Salary for School Administrators in Iowa By District Enrollment Category
|
|
|
|
|
| 12/03/2012 |
Iowa Insights |
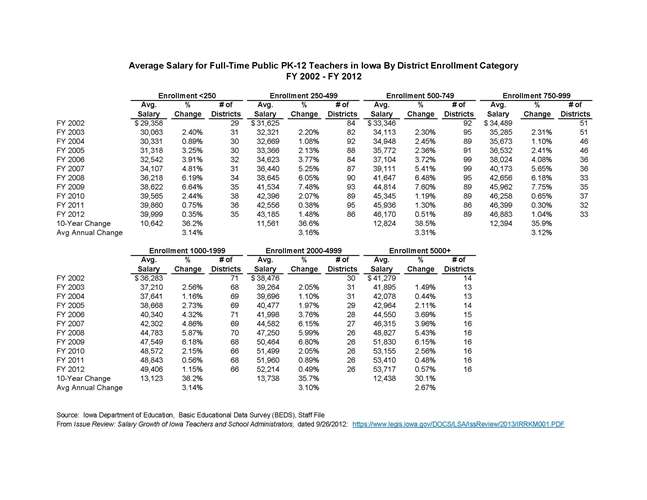
Average Salary for Full-Time Public PK-12 Teachers in Iowa by District Enrollment Category
|
|
|
|
|
| 11/26/2012 |
Iowa Insights |
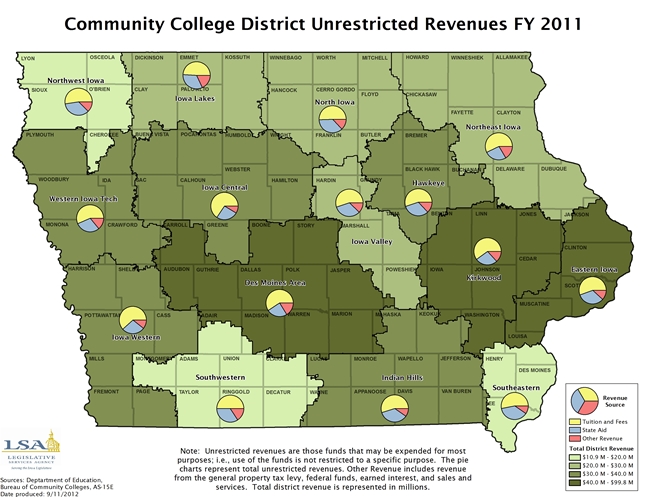
Community College District Unrestricted Revenues
|
|
|
|
|
| 11/19/2012 |
Iowa Insights |
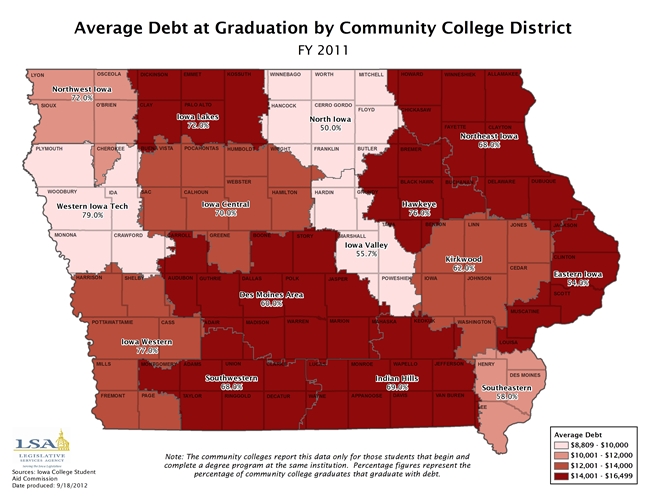
Average Debt at Graduation by Community College District
|
|
|
|
|
| 11/12/2012 |
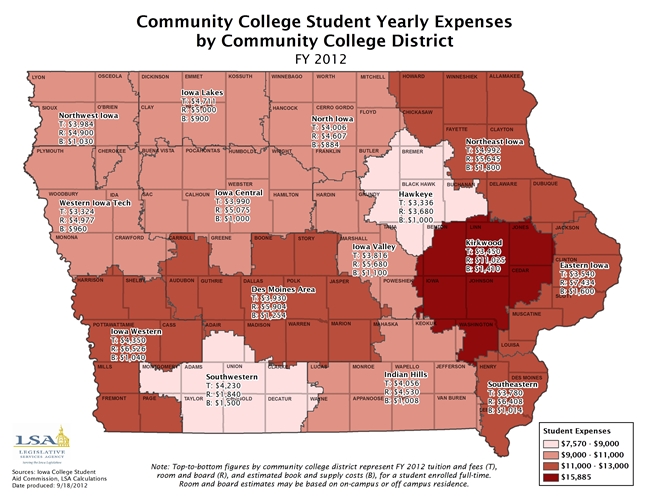
Iowa Insights |
Community College Student Yearly Expenses
|
|
|
|
|
| 11/05/2012 |
Iowa Insights |
Increase in Unemployment Rate by County

|
|
|
|
|
| 10/29/2012 |
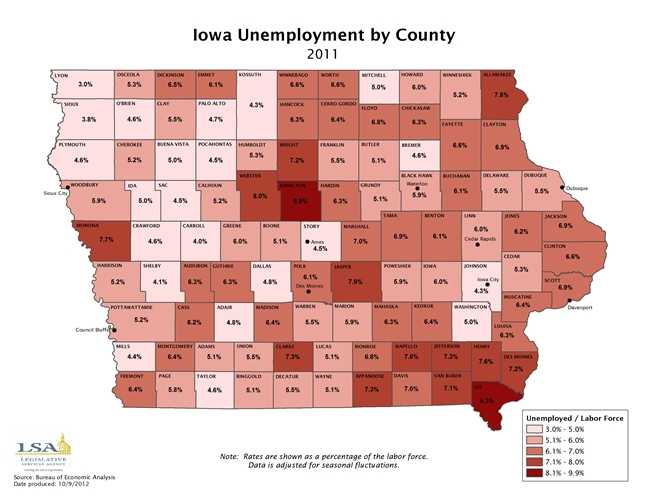
Iowa Insights |
Iowa Unemployment by County
|
|
|
|
|
| 10/22/2012 |
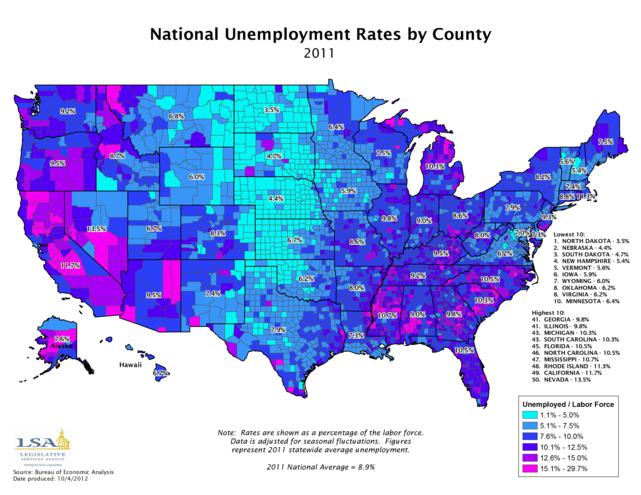
Iowa Insights |
National Unemployment Rates by County
|
|
|
|
|
| 10/15/2012 |
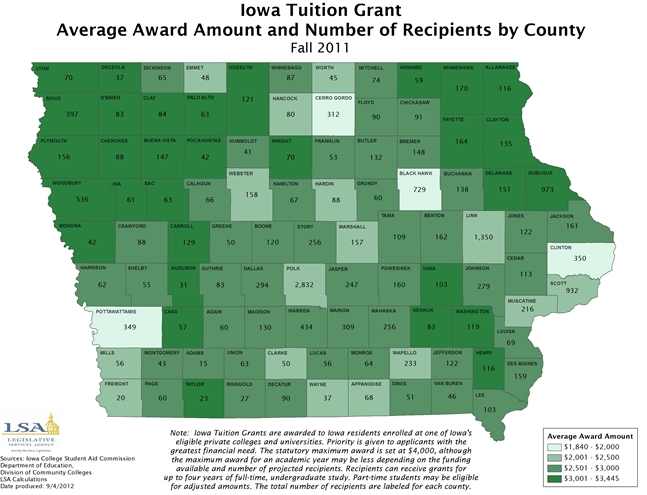
Iowa Insights |
Iowa Tuition Grant
|
|
|
|
|
| 10/08/2012 |
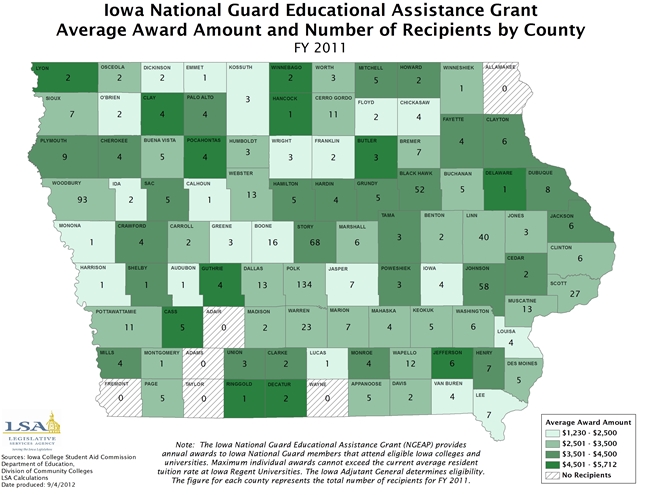
Iowa Insights |
Iowa National Guard Education Assistance Grant
|
|
|
|
|
| 10/01/2012 |
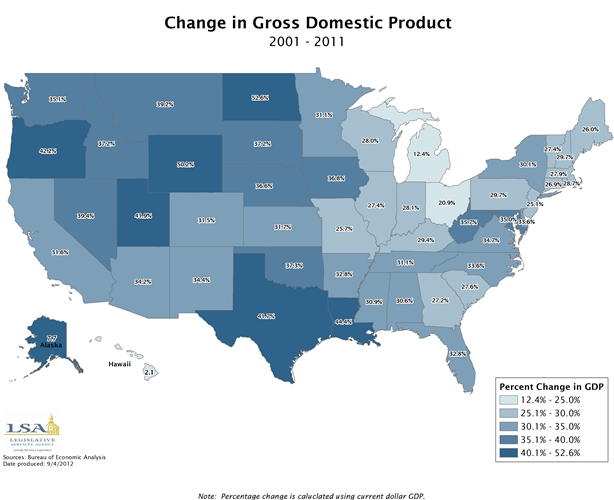
Iowa Insights |
Change in Gross Domestic Product
|
|
|
|
|
| 09/24/2012 |
Iowa Insights |
State Economic Indicators

|
|
|
|
|
| 09/17/2012 |
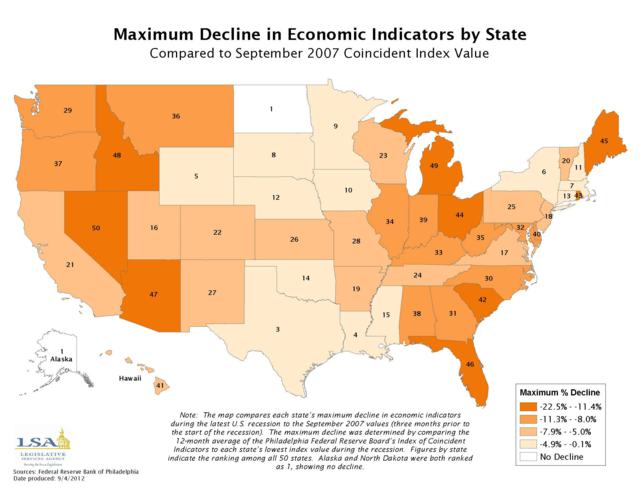
Iowa Insights |
Maximum Decline in Economic Indicators by State
|
|
|
|
|
| 09/10/2012 |
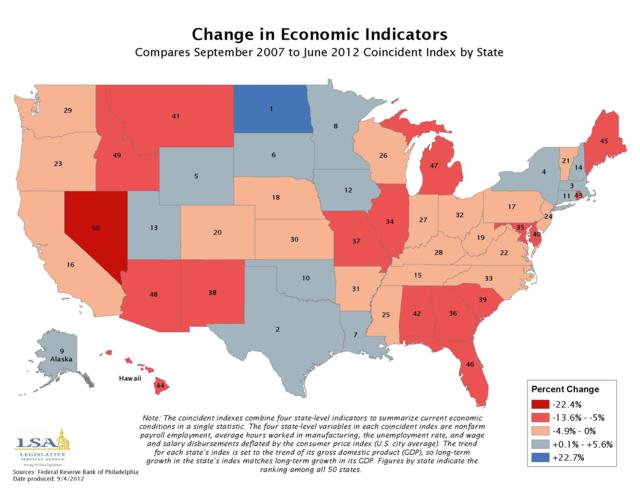
Iowa Insights |
Change in Economic Indicators
|
|
|
|
|
| 09/03/2012 |
Iowa Insights |
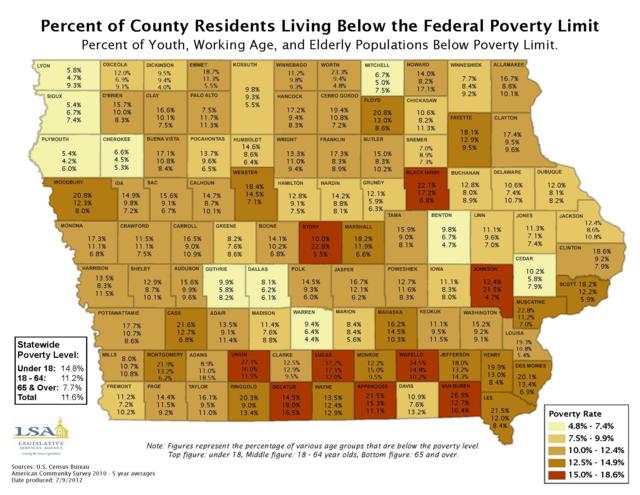
Percent of County Residents Living Below the Federal Poverty Limit
|
|
|
|
|
| 08/27/2012 |
Iowa Insights |
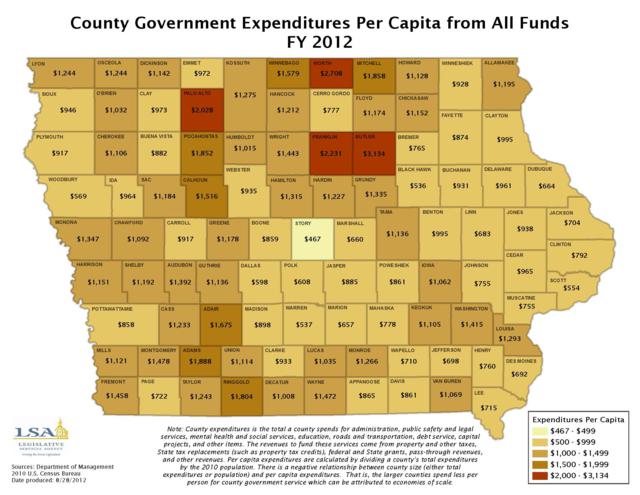
County Government Expenditures Per Capita from All Funds
|
|
|
|
|
| 08/13/2012 |
Iowa Insights |
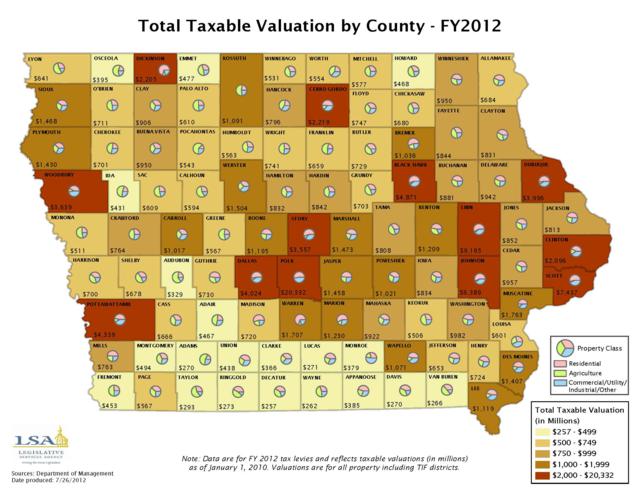
Total Taxable Valuation by County
|
|
|
|
|
| 08/06/2012 |
Iowa Insights |
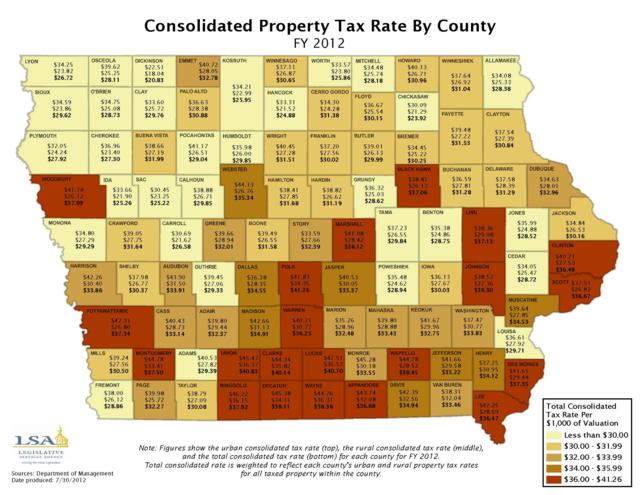
Consolidated Property Tax Rate By County
|
|
|
|
|
| 07/30/2012 |
Iowa Insights |
Property Valuation Amount Per Pupil by School District
|
|
|
|
|
| 07/23/2012 |
Iowa Insights |
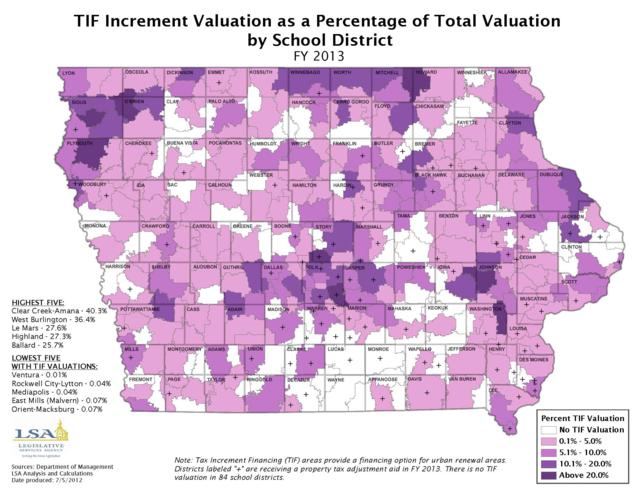
TIF Increment Valuation as a Percentage of Total Valuation

|
|
|
|
|
| 07/16/2012 |
Iowa Insights |
Change in School District Non-General Fund Levy Rate by School District

|
|
|
|
|
| 07/09/2012 |
Iowa Insights |
Total School District Levy Rate Change by School District

|
|
|
|
|
| 07/02/2012 |
Iowa Insights |
Total School District Levy Rate by School District
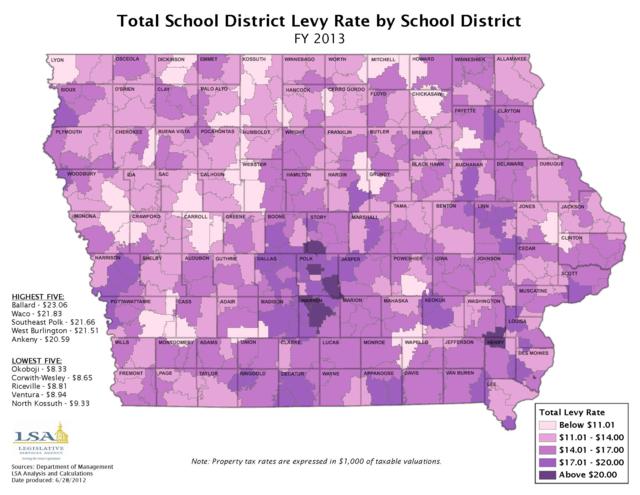
|
|
|
|
|
| 06/25/2012 |
Iowa Insights |
Change in the Percentage of Families in Poverty by County
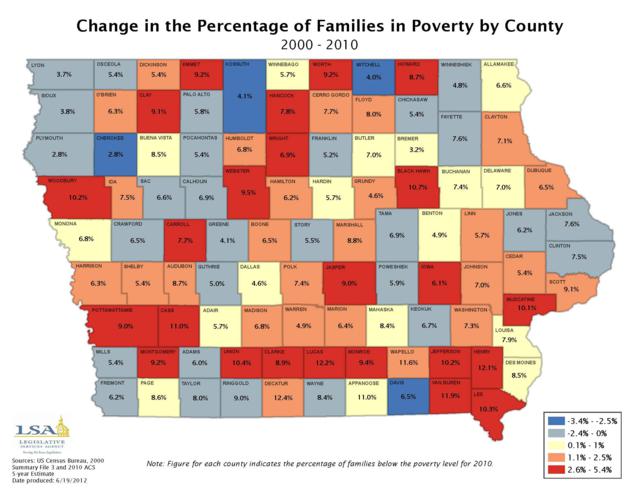
|
|
|
|
|
| 06/18/2012 |
Iowa Insights |
Median Homeowner Costs as a Percentage of Household Income
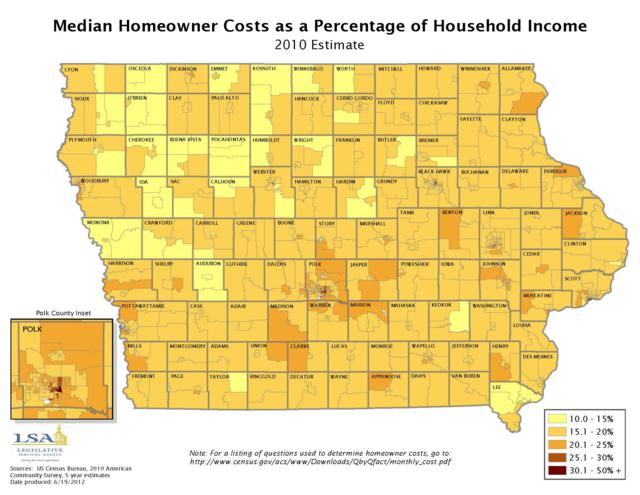
|
|
|
|
|
| 06/11/2012 |
Iowa Insights |
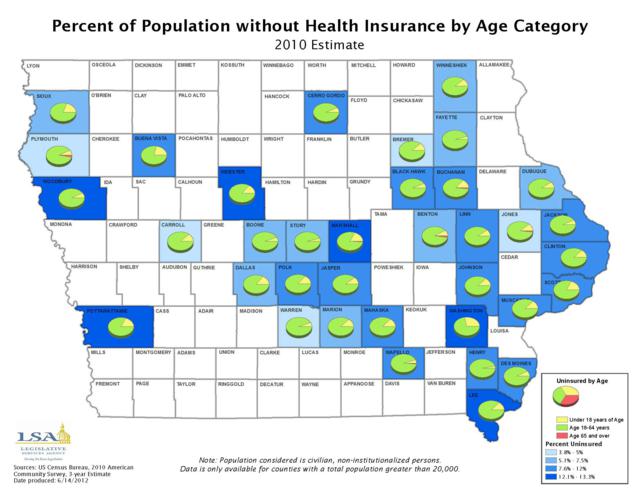
Percent of Population without Health Insurance by Age Category
|
|
|
|
|
 Permanent Link